Adding a new separation dimension to MS and LC-MS: What is ...
111
HAL Id: hal-01702282 https://hal.archives-ouvertes.fr/hal-01702282 Submitted on 8 Oct 2020 HAL is a multi-disciplinary open access archive for the deposit and dissemination of sci- entific research documents, whether they are pub- lished or not. The documents may come from teaching and research institutions in France or abroad, or from public or private research centers. L’archive ouverte pluridisciplinaire HAL, est destinée au dépôt et à la diffusion de documents scientifiques de niveau recherche, publiés ou non, émanant des établissements d’enseignement et de recherche français ou étrangers, des laboratoires publics ou privés. Adding a new separation dimension to MS and LC-MS: What is the utility of ion mobility spectrometry? Valentina d’Atri, Tim Causon, Oscar Hernandez-Alba, Aline Mutabazi, Jean-Luc Veuthey, Sarah Cianférani, Davy Guillarme To cite this version: Valentina d’Atri, Tim Causon, Oscar Hernandez-Alba, Aline Mutabazi, Jean-Luc Veuthey, et al.. Adding a new separation dimension to MS and LC-MS: What is the utility of ion mobil- ity spectrometry?. Journal of Separation Science, Wiley-VCH Verlag, 2018, 41 (1), pp.20 - 67. 10.1002/jssc.201700919. hal-01702282
Transcript of Adding a new separation dimension to MS and LC-MS: What is ...

HAL Id: hal-01702282https://hal.archives-ouvertes.fr/hal-01702282
Submitted on 8 Oct 2020
HAL is a multi-disciplinary open accessarchive for the deposit and dissemination of sci-entific research documents, whether they are pub-lished or not. The documents may come fromteaching and research institutions in France orabroad, or from public or private research centers.
L’archive ouverte pluridisciplinaire HAL, estdestinée au dépôt et à la diffusion de documentsscientifiques de niveau recherche, publiés ou non,émanant des établissements d’enseignement et derecherche français ou étrangers, des laboratoirespublics ou privés.
Adding a new separation dimension to MS and LC-MS:What is the utility of ion mobility spectrometry?
Valentina d’Atri, Tim Causon, Oscar Hernandez-Alba, Aline Mutabazi,Jean-Luc Veuthey, Sarah Cianférani, Davy Guillarme
To cite this version:Valentina d’Atri, Tim Causon, Oscar Hernandez-Alba, Aline Mutabazi, Jean-Luc Veuthey, etal.. Adding a new separation dimension to MS and LC-MS: What is the utility of ion mobil-ity spectrometry?. Journal of Separation Science, Wiley-VCH Verlag, 2018, 41 (1), pp.20 - 67.10.1002/jssc.201700919. hal-01702282

1
Adding a new separation dimension to MS and LC-MS: what is the utility of ion 1
mobility spectrometry? 2
3
AUTHORS: Valentina D’ATRI(1)‡, Tim CAUSON(2)‡, Oscar HERNANDEZ-ALBA(3)‡, Aline 4
MUTABAZI(1)‡, Jean-Luc VEUTHEY(1), Sarah CIANFERANI(3), Davy GUILLARME(1) 5
6
(1) School of Pharmaceutical Sciences, University of Geneva, University of Lausanne, CMU - 7
Rue Michel Servet 1, 1211 Geneva 4, Switzerland 8
(2) Division of Analytical Chemistry, Department of Chemistry, University of Natural Resources 9
and Life Sciences (BOKU Vienna), Muthgasse 18, Vienna 1190, Austria 10
(3) BioOrganic Mass Spectrometry Laboratory (LSMBO), IPHC, Université de Strasbourg, 11
CNRS, IPHC UMR 7178, 67000 Strasbourg, France 12
13
RUNNING TITLE: IM-MS and its applications 14
15
16
CORRESPONDENCE: Davy GUILLARME 17
School of Pharmaceutical Sciences, University of Geneva, University of Lausanne, CMU - Rue 18
Michel Servet 1, 1211 Geneva 4, Switzerland 19
Phone: +41 22 379 34 63 20
E-mail: [email protected] 21
22
23
KEYWORDS: collision cross section values; ion mobility spectrometry; metabolomics; 24
biopharmaceuticals, oligonucleotides 25
26
(‡) These authors contributed equally 27

2
LIST OF ABBREVIATIONS 28
2D-LC: two-dimensional liquid chromatography 29
AD: alzheimer disease 30
ADC: antibody drug conjugate 31
AmtB: ammonia channel 32
APCI: atmospheric pressure chemical ionization 33
APols: amphipatic polymers 34
AqpZ: aquaporin Z 35
A∙T: adenine thymine 36
ATD: arrival time distribution 37
bsAb: bispecific antibodies 38
BSM: bovine sumaxillary mucin 39
CCS: collisional cross section 40
CDL: cardiolipin 41
C∙G: cytosine-guanine 42
CID: collision induced dissociation 43
CIU: collision induced unfolding 44
CRISP : clustered regularly interspaced short palindromic 45
CRISPR : clustered regularly interspaced short palindromic repeats 46
CZE: capillary zone electrophoresis 47
DAR: drug-to-antibody-ratio 48
DBD: DNA-binding domain 49
DC: differential current 50
DDA: data-dependent acquisition 51
DESI: desorption electrospray ionisation 52
DFT: density functional theory 53
DHSS: diffuse hard spheres scattering 54
DIA: data-independent acquisition 55

3
DIMS: differential ion mobility spectrometry 56
DMA: differential mobility analyser 57
DMS: differential mobility spectrometry 58
DNA: deoxyribonucleic acid 59
DTCCSHe: collisional cross section calculated with drift tube ion mobility spectrometry and 60
helium as buffer gas 61
DTCCSN2: collisional cross section calculated with drift tube ion mobility spectrometry and 62
nitrogen as buffer gas 63
DTIMS: drift tube ion mobility spectrometry 64
DTM: diffuse trajectory method 65
EED: electron excitation dissociation 66
EHSS: exact hard sphere scattering 67
ESI: electrospray ionization 68
ETD: electron-transfer dissociation 69
FAIMS : field asymmetric waveform ion mobility spectrometry 70
FDA: food and drug administration 71
FID: flame ionization detector 72
FRET: fluorescence resonance energy transfer 73
GC: gas chromatography 74
HCP: host cell proteins 75
HD-DDA: high definition data direct analysis 76
HDX-MS: hydrogen/deuterium exchange mass spectrometry 77
HIC: hydrophobic interaction chromatography 78
HMGA: high-mobility group A 79
HRMS: high resolution mass spectrometry 80
IAPP: islet amyloid polypeptide 81
IDP: intrinsically disordered proteins 82
IgG: immunoglobulin G 83

4
IM: ion mobility 84
IM-MS: ion mobility - mass spectrometry 85
IMS: ion mobility spectrometry 86
IMS-QTOF: ion mobility spectrometry quadrupole time-of-flight 87
IR: infrared radiation 88
IRMPD: infrared multiphoton dissociation 89
LC: liquid chromatography 90
LC-IMS-MS: liquid chromatography - ion mobility - mass spectrometry 91
LC-MS: liquid chromatography-mass spectrometry 92
LCPA: local collision probability approximation 93
LOD: limit of detection 94
mAb: monoclonal antibody 95
MALDI: matrix-assisted laser desorption ionisation 96
MC: Monte Carlo 97
MD: molecular dynamics 98
MS: mass spectrometry 99
MS/MS: tandem mass spectrometry 100
MscL: mechanosensitive channel of large conductance 101
NMR: nuclear magnetic resonance 102
PA: projection approximation 103
PASEF: parallel accumulation–serial fragmentation 104
PDB: protein data bank 105
PG: phosphatidylglycerol 106
PSA: projection superimposition approximation 107
PTM: posttranslational modifications 108
QM: quantum mechanical 109
QqTOF: quadrupole-time-of-flight 110
QTRAP: triple-quadrupole linear ion trap mass spectrometer 111

5
RF: radio frequency 112
rhGH: recombinant human growth hormone 113
RNA: ribonucleic acid 114
SASA: solvent-accessible surface area 115
SEC: size exclusion chromatography 116
SFC: supercritical fluid chromatography 117
SID: surface induced dissociation 118
SLIM: structures for lossless ion manipulations 119
sno: small nucleolar 120
SRIG: stacked-ring ion guide 121
sRNPs: small nucleolar ribonucleoprotein particles 122
T10: thymine 10 123
T2DM: type 2 diabetes mellitus 124
Td: Townsends unit 125
TIMS: trapped ion mobility spectrometry 126
TIMS-MS: trapped ion mobility spectrometry - mass spectrometry 127
TIMCCSN2: collisional cross section calculated with trapped ion mobility spectrometry and 128
nitrogen as buffer gas 129
TM: trajectory method 130
TOF: time-of-flight 131
TRAP: trp RNA binding attenuation protein 132
TTR: tetrameric transthyretin 133
TWCCSN2: collisional cross section calculated with travelling wave ion mobility spectrometry 134
and nitrogen as buffer gas 135
TWIMS: travelling wave ion mobility spectrometry 136
VUVPD: vacuum ultraviolet photo dissociation 137
VT-IM-MS: variable temperature ion mobility-mass spectrometry 138
wt: wild type 139

6
XUV: extreme ultraviolet light 140

7
Abstract 141
Ion mobility spectrometry is an analytical technique known for more than 100 years, which 142
entails separating ions in the gas phase based on their size, shape and charge. While IMS 143
alone can be useful for some applications (mostly security analysis for detecting certain 144
classes of narcotics and explosives), it becomes even more powerful in combination with MS 145
and HPLC. Indeed, the limited resolving power of ion mobility spectrometry alone can be 146
tackled when combining this analytical strategy with MS or LC-MS. 147
Over the last few years, the hyphenation of ion mobility spectrometry to MS or LC-MS attracted 148
more and more interest, with significant progresses in both technical advances and pioneering 149
applications. This review describes the theoretical background, available technologies and 150
future capabilities of these techniques. It also highlights a wide range of applications, from 151
small molecules (natural products, metabolites, glycans, lipids) to large biomolecules (proteins, 152
protein complexes, biopharmaceuticals, oligonucleotides). 153
154

8
1. Introduction 155
During the last decade, ion mobility spectrometry (IMS) has been applied in several fields, 156
starting from the analysis of chemical warfare agents, explosives and illicit drugs to the analysis 157
of biological samples [1–4]. Nowadays, the increased complexity of the samples (e.g. natural 158
products analysis, biopharmaceutical characterization, -omic samples such as proteins mixture 159
in proteomics or biofluids in metabolomics or lipidomics, etc) demands for analytical methods 160
able to offer very high resolving power to achieve analytical goals and acquire sufficient 161
information from the sample. 162
The addition of IMS dimension to the existing analytical setup can represent an attractive 163
strategy to achieve this goal. [4] Indeed, IMS is a gas-phase separation technique that allows 164
the separation of ions generated by a source (frequently by electrospray ionization, ESI) driven 165
through an ion mobility cell filled with an inert gas (generally nitrogen or helium) under the 166
influence of an electric field. Once in the IM drift cell, ions are separated based on their mobility 167
that accounts for their size, shape and charge. Then, based on the type of IMS separator, the 168
mobility can also allow the determination of the collisional cross section (CCS), a physical 169
property related to the shape of the ion for a given compound in a specific gas environment. 170
The CCS is an important property that could provide an improved characterization of different 171
compounds, such as small molecules, proteins, lipids or glycans, as well as a better 172
understanding of the intramolecular forces [5,6]. A detailed discussion about CCS 173
determination will be addressed in section 2. 174
As illustrated in Figure 1, IMS combined with mass spectrometry (MS), which is also known as 175
IMSxMS or IM-MS, has seen a spectacular growth in the last 20 years. Indeed, the information 176
obtained from IMS and MS can be considered as complementary and IMS can potentially allow 177
the separation of isobaric ions (unresolved by MS) based on their shape differences [7]. 178
Besides IMS and MS, a third separation dimension, such as liquid chromatography (LC) or 179
another front-end separation technique such as supercritical fluid chromatography (SFC), gas 180
chromatography (GC), or capillary zone electrophoresis (CZE) [8] can also be included in the 181
analytical setup. As shown in Figure 1, this three-dimensional separation (LC-IM-MS) is still 182

9
less widespread than IMS alone or IM-MS, but is beginning to attract increasing interest for the 183
analyses of complex samples. As highlighted in Figure 2, LC-IM-MS allows the separation of 184
the different constituents of a mixture based on their lipophilicity (LC), shape (IMS), mass (MS) 185
and charge (IMS and MS). It also offers the possibility to visualize the analytical results in 186
several dimensions, using a plot of MS spectra information vs. IM drift times, for each 187
chromatographic peak. 188
Another important aspect is the time scale of IMS (in the milliseconds range), which fits very 189
well between the chromatographic step (in the minutes range) and MS experiment (in the 190
microseconds time scale). Because of the fast duty cycle of time-of-flight based mass 191
spectrometer (TOF and QqTOF), these instruments appear to be the most suitable analysers 192
for IM-MS [6]. 193
This review paper describes the theoretical background of IM-MS technology, available 194
instrumentation and future capabilities of IM-MS. It also highlights a wide range of recent 195
applications of IM-MS and LC-IM-MS, ranging from small molecules to large biomolecules. 196
197
2. Description of the available ion mobility technologies 198
Several ion mobility technologies have been developed in the last decades, each having its 199
own principle of operation and design. According to May and McLean [9], there are three main 200
separation concepts employed in IMS, namely i) time-dispersive methods, which generate an 201
arrival time spectrum, with all ions drifting along the same pathway (i.e. drift tube ion mobility 202
spectrometry (DTIMS), travelling wave ion mobility spectrometry (TWIMS)), ii) space-203
dispersive methods, which separate ions along different drift paths, based on their mobility 204
differences (i.e. field asymmetric waveform ion mobility spectrometry (FAIMS), differential 205
mobility analyser (DMA)) and iii) ion trapping followed by selective release, which traps ions 206
within a pressurized region and selectively ejects the ions based on their mobility differences 207
(i.e. trapped ion mobility spectrometry (TIMS)). All the IMS techniques described in this section 208
can be coupled with MS [7], but performance and possibilities may vary, particularly in terms 209
of achievable limits of detection (LOD), resolving power (peak capacity) and possibility to 210
10
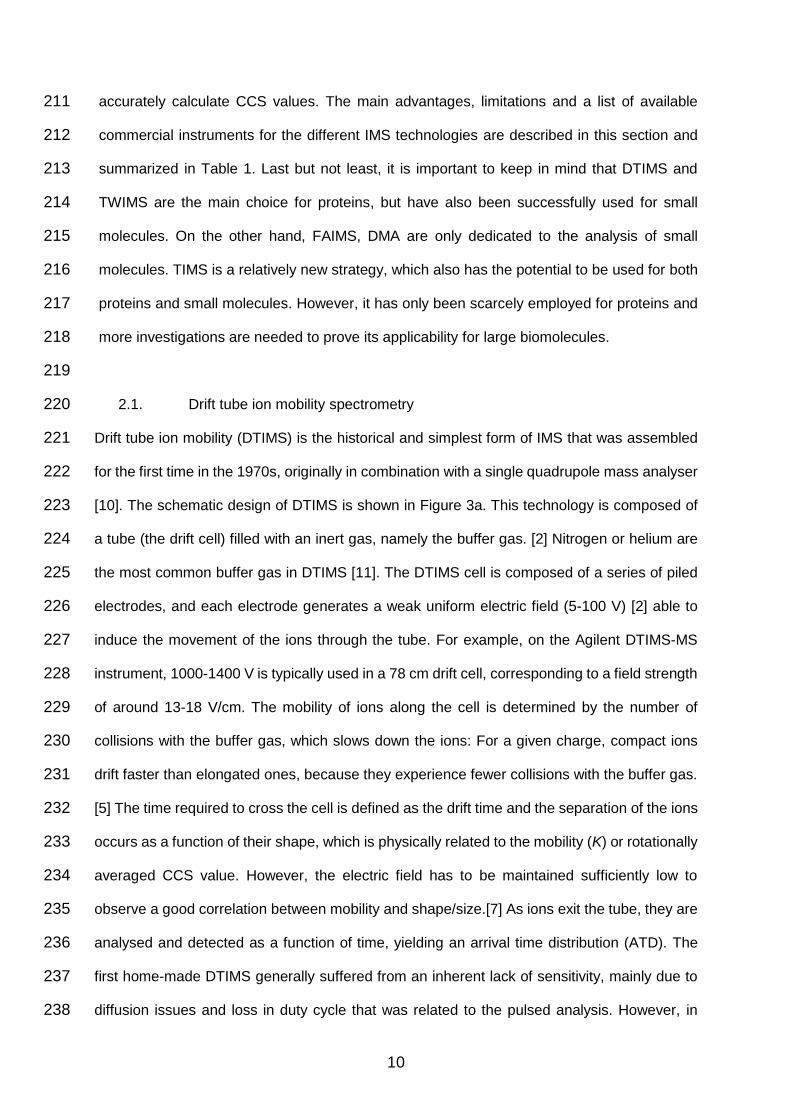
accurately calculate CCS values. The main advantages, limitations and a list of available 211
commercial instruments for the different IMS technologies are described in this section and 212
summarized in Table 1. Last but not least, it is important to keep in mind that DTIMS and 213
TWIMS are the main choice for proteins, but have also been successfully used for small 214
molecules. On the other hand, FAIMS, DMA are only dedicated to the analysis of small 215
molecules. TIMS is a relatively new strategy, which also has the potential to be used for both 216
proteins and small molecules. However, it has only been scarcely employed for proteins and 217
more investigations are needed to prove its applicability for large biomolecules. 218
219
2.1. Drift tube ion mobility spectrometry 220
Drift tube ion mobility (DTIMS) is the historical and simplest form of IMS that was assembled 221
for the first time in the 1970s, originally in combination with a single quadrupole mass analyser 222
[10]. The schematic design of DTIMS is shown in Figure 3a. This technology is composed of 223
a tube (the drift cell) filled with an inert gas, namely the buffer gas. [2] Nitrogen or helium are 224
the most common buffer gas in DTIMS [11]. The DTIMS cell is composed of a series of piled 225
electrodes, and each electrode generates a weak uniform electric field (5-100 V) [2] able to 226
induce the movement of the ions through the tube. For example, on the Agilent DTIMS-MS 227
instrument, 1000-1400 V is typically used in a 78 cm drift cell, corresponding to a field strength 228
of around 13-18 V/cm. The mobility of ions along the cell is determined by the number of 229
collisions with the buffer gas, which slows down the ions: For a given charge, compact ions 230
drift faster than elongated ones, because they experience fewer collisions with the buffer gas. 231
[5] The time required to cross the cell is defined as the drift time and the separation of the ions 232
occurs as a function of their shape, which is physically related to the mobility (K) or rotationally 233
averaged CCS value. However, the electric field has to be maintained sufficiently low to 234
observe a good correlation between mobility and shape/size.[7] As ions exit the tube, they are 235
analysed and detected as a function of time, yielding an arrival time distribution (ATD). The 236
first home-made DTIMS generally suffered from an inherent lack of sensitivity, mainly due to 237
diffusion issues and loss in duty cycle that was related to the pulsed analysis. However, in 238

11
2014 a commercial DTIMS, using nitrogen drift gas and offering a good compromise between 239
sensitivity, length of drift tube, and optics, was developed by Agilent Technologies. In 240
particular, the instrument incorporates a tandem ion funnel interface before the drift tube that 241
acts as a focusing and accumulation region, and a second ion funnel after the drift tube that 242
refocuses the ions through an hexapole ion guide prior to reaching the QqTOFMS. The Agilent 243
DTIMS-MS instrument includes a QqTOF mass analyser, offers a high precision of CCS values 244
(below 0.5% [12]), a high resolving power (thanks to the length of the tube extended to 78 cm 245
combined with the precision electronics) and sensitivity compatible for protein/peptide 246
analyses [11,13]. Another DTIMS instrument commercially available is manufactured by 247
TOFWerk (Switzerland). This instrument contains a 20 cm drift cell operated at high pressure 248
(i.e. 1-1.4 atm) and elevated temperature (e.g. 60°C), which provides greater resolution, while 249
maintaining low-field conditions, but is limited to low molecular weight molecules. 250
251
2.2. Travelling wave ion mobility spectrometry 252
Traveling wave ion mobility (TWIMS) is a more recent IMS technology that was first described 253
in 2004 [14] and made commercially available in 2006 (Waters Synapt HDMS systems) [15]. 254
This high performance instrument has significantly advanced the field of IM-MS thanks to its 255
versatility and widespread availability [16]. Similarly to DTIMS, TWIMS is a time-dispersive 256
method, even though it uses a dynamic application of the electric field to separate the ions in 257
gaseous phase (often nitrogen and occasionally helium). It consists of a stacked-ring ion guide 258
(SRIG) where positive and negative radio frequency (RF) voltages are periodically applied to 259
adjacent ring electrodes to provide radial ion confinement while a pulsed differential current 260
(DC) voltage is applied to axially propel the ions [2]. Therefore, rather than applying a linear 261
electric field through the full length of the mobility cell, like in DTIMS, the electric field in TWIMS 262
forms a wave whose magnitude and speed determine the ions separation, as illustrated in 263
Figure 3b. By surfing on the waves, larger ions experience larger friction with the buffer gas 264
and slip more often behind the waves, thus taking more time to exit the mobility cell as 265
compared to smaller ions. In TWIMS, CCS can also be determined from the drift time, but only 266
12
after calibration by using a set of reference compounds of known CCS values. In addition, the 267
TWIMS technology takes less space than DTIMS (DTIMS needs around 1 meter to be installed 268
in front of the mass spectrometer) and is more versatile, since it allows to perform CID before 269
and after Ion mobility (CID could only be performed after ion mobility with DTIMS) on the 270
commercial instruments (this is a choice of the constructors rather than a theoretical limitation). 271
As described in [9], the original Waters TWIMS technology underwent a major design 272
modification in 2009 (Synapt G2), allowing 4-fold improvement of the accessible resolution, 273
thanks to the use of higher electric fields and higher gas pressure [17]. In 2011 and 2013, two 274
new instruments were released by Waters, namely Synapt G2-S and G2-Si, allowing an 275
improvement of the ion transmission through the IM-MS and a wide range of experimental 276
options [9]. Finally, Waters has released a benchtop instrument in 2016 (Vion IMS QToF), 277
which includes in part the technology of the Synapt, but with a different design (the mobility 278
cell is located before the first quadrupole of the QqTOF/MS). Indeed, this instrument is 279
dedicated to non-experts who want to add an IMS dimension (determination of CCS values, 280
removal of spectral interferences) to routine analyses often performed in MS or LC-MS. 281
282
2.3. Field asymmetric waveform ion mobility spectrometry 283
Field asymmetric waveform ion mobility spectrometry (FAIMS) is also known as differential ion 284
mobility spectrometry (DMS or DIMS). The principle of operation of FAIMS is illustrated in 285
Figure 3c [18]. FAIMS utilizes two electrodes between which a high asymmetric electric field 286
(up to 10000 V/cm, also called dispersion field) is applied at reduced pressure (but can also 287
operate at atmospheric pressure) [19,20] and room temperature. The carrier gas (often 288
nitrogen, but there is a lot of flexibility to use some alternative gas or even dopants) is injected 289
with the ions in the same direction. A compensation voltage is then superimposed to the 290
dispersion field and it can be tuned for ions with a particular mobility [21]. By applying a suitable 291
compensation voltage, the trajectory of the desired ions can be corrected along the axis of the 292
cell to permit these ions to leave the cell. All other ions will migrate away from the straight line 293

13
due to their different mobility. A full spectrum can finally be collected by scanning the 294
compensation voltage. 295
Unlike DTIMS and TWIMS, FAIMS does not separate ions based directly on their mobility, but 296
rather according to the ratio of mobilities in a low-field and high-field. Therefore, the FAIMS 297
separation is much more orthogonal to m/z than other IMS modes (see section 8.2 for more 298
explanations). However, FAIMS is actually considered to be a filtering technique (or selective 299
scanning technique) rather than structure characterization tool, since calculation of CCS is not 300
possible [2]. Very high resolutions of up to several hundreds were reported in FAIMS, but this 301
was only possible when a mixture of gases was employed (He/N2) [22]. In addition, FAIMS 302
resolution cannot be directly compared to that of any other IMS technique described in this 303
review, since the separation phenomenon is different as is the scaling of the axes [16]. 304
Several companies have commercialized FAIMS devices, including Thermo Fisher Scientific, 305
AB SCIEX and Owlstone. However, the most active provider is certainly SCIEX which utilises 306
FAIMS technology (SelexION) in several MS platforms, including QTRAP (Sciex 5500, 6500 307
and 6500+ series) and QqTOFs (Sciex TripleTOF 5600+ and 6600) analysers. On Thermo 308
Fisher Scientific instruments, the FAIMS interface can be added to existing triple quadrupole, 309
ion trap MS analysers and high-resolution orbital ion trap mass analysers [23]. 310
311
2.4. Differential mobility analyser 312
Differential mobility analyser (DMA) is another form of IMS where the ions with different 313
mobilities are separated in space (rather than in time) at atmospheric pressure and relatively 314
low electric field. Two cylindrical and concentric metal electrodes constitute the usual DMA 315
design. A planar scheme of the DMA design is shown in the Figure 3d [24]. As illustrated in 316
this figure, the ions are injected along an electrical field (directed from top to bottom of the 317
scheme) between the two electrodes. An orthogonal flow of sheath gas from the left to the right 318
of the scheme pushes ions down from an inlet slit to the exit slit. Then, the ions whose mobility 319
matches the length from inlet slit to exit slit, at the used buffer gas flow and the electric field, 320
will reach the exit slit and will be directed towards the MS analyser [25]. 321

14
The other ions, which do not match this mobility, will be eliminated on the lens that acts as a 322
wall. Only the ions with the targeted mobility will leave the DMA and the variation of the electric 323
field permits to select ions with different mobilities. Similarly to FAIMS, DMA is also considered 324
as a selective filter, but operates in the low-field regime. An important limitation of DMA is that 325
it does not allow the transmission of ions having diverse mobilities. The commercial availability 326
of DMA technology is relatively limited, and only a company called SEADM sells DMA systems 327
that can be directly coupled to MS. 328
329
2.5. Trapped ion mobility spectrometry 330
Trapped ion mobility spectrometry (TIMS) is a technology that appeared very recently on the 331
market, which is based on the use of a non-uniform electric field [16]. In contrast to DTIMS or 332
TWIMS, TIMS uses a high gas flow (exclusively nitrogen) to carry the ions of interest into the 333
drift cell. A low electric field is applied in the meantime in the opposite direction with the aim of 334
trapping and separating the ions as a function of their size-to-charge ratio. Then the electric 335
field is gradually decreased allowing the release of the ions from high (large CCS) to small 336
(small CCS) size-to-charge ratios [5]. A schematic of the separation process is shown in Figure 337
3e. 338
The TIMS-MS approach is still in early development and commercial devices have only been 339
released recently by Bruker (timsTOF) [26]. 340
341
The advantages and limitations of these different IM-MS techniques above described are 342
summarized in Table 1. 343
344
3. The importance of collision cross section 345
3.1. Basic collision cross section equation 346
Ion mobility is a separation technique that allows analytes to be identified according to their 347
mass, charge and shape. The principle of IMS is often compared to that of electrophoresis, 348
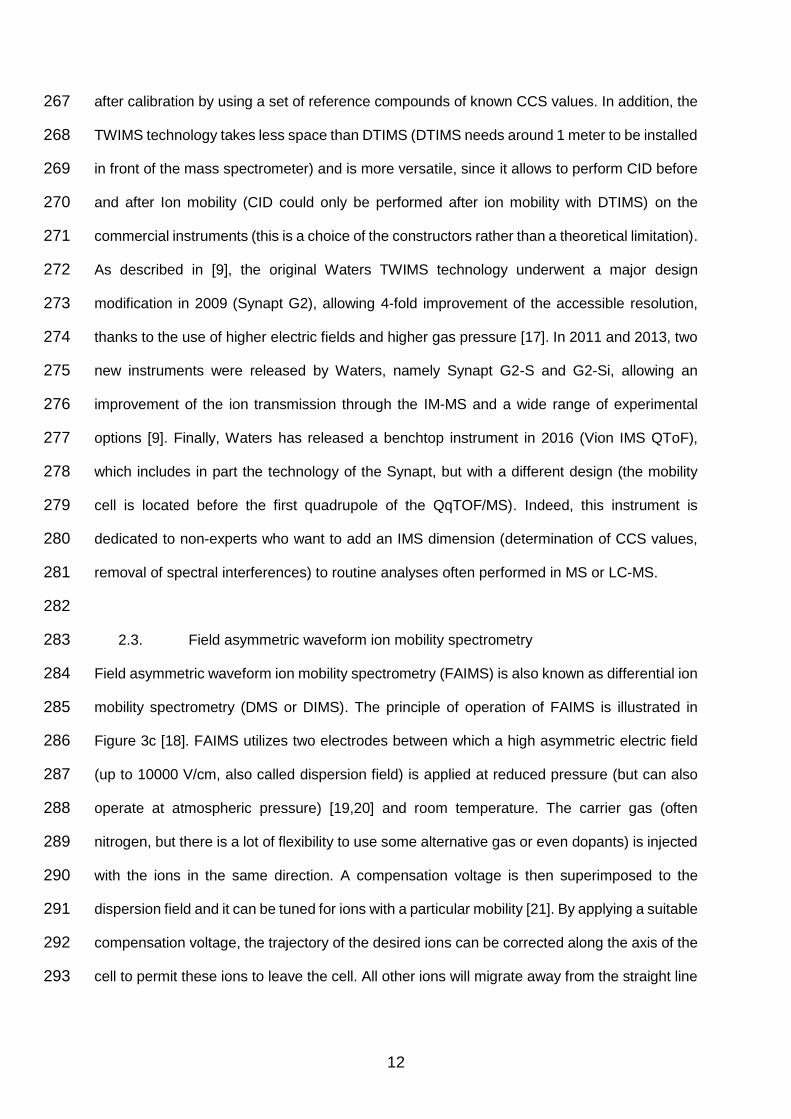
even though the separation is conducted in the gas phase within a millisecond timescale. 349

15
Considering a pool of gas-phase ions moving in a chamber filled with a buffer gas and under 350
the influence of an electric field (E), the mobility (K) is defined as the proportionality coefficient 351
between the strength of the electric field E and the velocity vd attained by the ions: 352
353
𝑣𝑑 = 𝐾 ∙ 𝐸 (1)
354
K is usually reported as the reduced mobility (K0), upon normalization to standard pressure 355
and temperature (p0 = 760 Torr and T0 = 273.15 K): 356
𝐾0 = 𝐾 ∙ 𝑝
𝑝0 ∙
𝑇0
𝑇 (2)
357
In addition, K0 can be related to the collision system parameters, accounting for the analyte 358
characteristics under the experimental conditions, by the Mason-Schamp modification of the 359
fundamental zero-field equation [27]: 360
361
𝐾0 =3𝑞
16𝑁0 ∙ (
2𝜋
𝑘𝐵𝑇)
1
2
∙ (1
𝑚+
1
𝑀)
1
2
∙ 1
𝛺 (3)
362
where q = ze is the ionic charge (z is the nominal ion charge and e is the elementary charge), 363
N0 is the gas density number at p0 and T0, kB is the Boltzmann’s constant, T is the gas 364
temperature, m is the mass of the buffer gas, while M is the one of the ion, and Ω is the collision 365
cross section (CCS). 366
While q and M take into account the charge and the mass of the ion, respectively, CCS (Ω) is 367
the physical quantity taking into account its “size and shape”. CCS represents indeed the 368
effective area of the ion colliding with the molecules of the buffer gas. The higher the CCS, the 369
higher will be the number of collisions and thus more pronounced the effects on the ions that 370
will be slowed down by friction upon collisions. The CCS is thus a distinctive characteristic of 371
each ion (this is true for small molecules) and it is considered as an important structural 372
16
descriptor obtainable by IMS. However, it is important to keep in mind that the case of proteins 373
is more complex, since the activation conditions can influence the CCS and different CCS of 374
the same ion can co-exist. CCS can also be compared with other structural data obtained with 375
different analytical techniques, such as nuclear magnetic resonance (NMR), small-angle X-ray 376
scattering (SAXS), electron microscopy and X-ray crystallography. This point will be further 377
discussed in section 3.3. It is worth noticing that, according to Equations 1 – 3, the mobility (K) 378
depends on the density number of the drift gas (N), and the proportional linearity between vd 379
and E is only valid in the low electric field limit (E/N ratio ≤ 2 Townsends (Td)). As the electric 380
field is increasing, K is no longer constant and becomes field–dependent. Thus, the simple 381
relationship between K0 and 1/Ω breaks down. This point is particularly important to understand 382
the limits of the experimental CCS determination and how to properly deduce it from measured 383
drift times on different types of IMS. 384
385
3.2. Experimental collision cross section determination 386
As described in section 1, several types of ion mobility separators can be coupled to MS. All 387
of these configurations allow the separation of the analytes based on their conformations, but 388
only a few of them can be used to determine CCS values. In this section, our goal was to 389
critically consider whether the IMS hardware allows the determination of experimental CCS. In 390
general, if the analyser operates in the low field limit (E/N ratio < 2 Td) at all times and if the 391
field applied is constant, CCS might be directly determined from measured drift times (like in 392
DTIMS). If the IMS analyser operates in the low field limit, but with non-constant field due to 393
the application of additional radio frequencies (RF) or potentials, then a calibration with ions of 394
known CCS is required (like in TWIMS, DMA and TIMS). Finally, CCS cannot be derived at all 395
from the mobility data if the analyser operates at high field (like in FAIMS). The first two 396
scenarios allowing experimental CCS determination are discussed in further detail. 397
398

17
(i) Low field limit at all times and application of constant field. The best example of this IMS 399
configuration is the DTIMS. Knowing the drift time (td, time spent by the ions in the drift tube) 400
and that vd = L/td (where L is the drift tube length), Equation 2 can be expressed as follow: 401
402
𝐾0 =𝐿
𝑡𝑑𝐸∙
𝑝
𝑝0 ∙
𝑇0
𝑇 (4)
403
with consequent CCS determination obtainable by K0 following Equation 3. Theoretically, 404
DTIMS analysers offer the most accurate CCS measurement using a stepped-field approach 405
without the need for calibration, assuming that all the parameters involved are accurately 406
known and carefully controlled. If not, a calibration with ions of known CCS could be necessary 407
also in this case. For online analysis (e.g. LC-IM-MS), a single-field calibration with ions of 408
known CCS is used to provide a regression model for converting drift time and mass into CCS. 409
In addition, the drift tube can operate with a wide range of neutral gases (e.g. nitrogen, helium, 410
carbon dioxide), thus CCS values are a conditional property. In this regard, users are beginning 411
to ensure appropriate reporting of CCS values with specific reference to the gas and type of 412
IM used (e.g. DTCCSHe or DTCCSN2). 413
An important inter-laboratory study has been recently published [12] to highlight the trueness 414
and reproducibility of CCS measurement with DTIMS. In this work, 120 unique ion species (i.e. 415
metabolites, peptides, lipids and proteins, representing a wide range of masses, chemical 416
compositions and structures) were monitored in both positive and negative ionization modes, 417
and the reproducibility of DTCCSN2 values were evaluated across three laboratories equipped 418
with commercial DTIMS-MS instruments. It appears that the average RSD on CCS values was 419
equal to only 0.29% for all ion species across the three laboratories equipped with the same 420
type of instrument. The trueness of the values, obtained with the commercial DTIMS-MS 421
instruments, was comprised between 0.34% and 0.54%, depending whether a calibration was 422
applied or not. These results clearly illustrate the potential of DTIMS-MS for providing a 423

18
molecular identifier for a broad range of applications, including untargeted screening 424
workflows. 425
426
(ii) Low field limit with non-constant field. The best examples for this IMS configuration are 427
TWIMS, DMA and TIMS. Due to the non-linearity of the electric field that complicates the 428
equations describing the ion trajectories in TWIMS, CCS cannot be directly measured from the 429
drift times, but they can be evaluated after calibration with ions of known CCS and under 430
defined conditions of the drift cell (gas pressure and temperature, drift cell length, wave height 431
and speed). Ruotolo et al. reported a detailed TWIMS calibration protocol to which readers 432
may refer to [28]. Generally, proper calibrants should cover the IM drift time range of the ions 433
of interest, but also being physically and chemically related to the analytes and best bracket 434
the m/z of the compound to be analysed, especially when small differences in CCSs are 435
expected [29]. The most reliable calibration is obtained by using reference CCS values 436
obtained by DTIMS operating with nitrogen as buffer gas (DTCCSN2), since TWIMS cannot 437
operate with helium and is more often commercialised with nitrogen, thus giving access to 438
TWCCSN2 measures. The accuracy of CCS values is an important topic now that these values 439
are becoming an additional reference parameter in automated peak assignment of database 440
for –omics sciences. 441
Similarly, a calibration is needed for obtaining CCS values in DMA. As described in [30], a 442
single calibrant ion (such as tetraheptylammonium+) could be used to link the applied voltage 443
to the mobility of the ions transmitted, assuming that pressure and temperature inside the DMA 444
classification zone are known and controlled. 445
446
TIMS is another example of ion mobility analyser operating in the low field limit, but with no-447
constant field. In TIMS, an axial electric field is applied to accumulate, trap and elute the ions 448
according to their Ω/z ratio (see section 1.5 for additional hardware details). Unlike the 449
configurations introduced previously, larger ions (high CCS) migrate first with respect to the 450
smaller ions (low CCS). Moreover, similar to TWIMS, CCS determination can be obtained only 451

19
upon proper calibration with ions of known CCS as TIMS also operates with nitrogen as buffer 452
gas. Since the commercialisation of this analyser is still relatively recent, there are still very 453
few sources reporting TIMCCSN2 values [5]. 454
455
3.3. Prediction of collision cross section values 456
Even though the experimental CCS values represent an interesting structural parameter 457
obtainable by IMS, it is not sufficient to allow any structural interpretation on its own. To 458
disclose the conformation and shape adopted by the ions in the gas-phase, the experimentally 459
derived CCS needs to be compared with computationally derived CCS values obtained from 460
atomistic models. Nowadays, this approach is the gold-standard if using IM-MS as analytical 461
technique for “conformation analysis” [2,4,5,31–41]. 462
The first challenging task is the achievement of reliable atomistic models. A plethora of 463
computational approaches might be applied for this purpose, including quantum mechanical 464
(QM) methods such as (but not limited to) density functional theory (DFT), ab-initio or semi-465
empirical methods and classical methods such as Monte Carlo (MC) and molecular dynamics 466
(MD). The method of choice is at the discretion of the user, but it is mainly driven by the size 467
of the system under investigation. Generally, QM methods offer the highest level of accuracy, 468
but they are extremely time-consuming and usually viable only for small systems, whereas 469
classical methods are instead more suitable for large systems such as biomolecules [42]. A 470
detailed evaluation of the computational approaches is beyond the scope of this review, but it 471
is worth noting that extensive proficiency in the field of computational chemistry is required to 472
obtain reliable atomistic models, thus several research groups (using IMS as structural tool) 473
have already taken into account the possibility to have a modeller in their group or to work in 474
close collaboration with a modelling team. 475
The second challenging task is the reliable determination of computationally derived CCS. 476
Indeed, once a pool of atomistic models, presumably representing the experimental gas-phase 477
conformations, have been selected through a proper computational method, a CCS calculation 478
algorithm needs to be applied to finally obtain theoretical CCS values (CCSTHE or CCSCAL) 479
20
which can be compared to the experimentally derived CCS (CCSEXP or CCSIMS). Several CCS 480
calculation models might be applied for this purpose. The “historical” models (still widely known 481
and used) are the trajectory method (TM) [43,44], the exact hard sphere scattering (EHSS) 482
[44], and the projection approximation (PA) [43,45,46], all initially parametrised for helium as 483
buffer gas and available in the MOBCAL suite of programs [47]. In general, the three algorithms 484
allow simulation of the collisions between the buffer gas and the randomly oriented structure 485
of the ion under investigation. However, during the collisions, multiple scattering events and 486
long-range interactions also occur, and the three models differ in the assumptions and the 487
grade of approximations of all these events, as depicted in Figure 4. TM [43,44] is an explicit 488
model which can be considered as the most rigorous and physically appealing method, since 489
it accounts for both long-range interactions and multiple scattering events. It is the method of 490
choice for small molecules calculations, but it becomes prohibitively slow if applied to large 491
molecules (> 1000 atoms), except if parallelization of computation is available. EHSS [48] is a 492
hard sphere collisions based method, meaning that both buffer gas and ion under investigation 493
are modelled as hard spheres. It computes the multiple scattering events, but it does not take 494
into account the long-range interactions, offering a reasonable balance between CCS accuracy 495
and time requested for the calculation, also for large molecules (even if an over-estimation of 496
CCS could arise in this latter case). Finally, PA [43,45,46] is a non-explicit method that does 497
not consider the multiple scattering events, or long-range interactions, but works by projecting 498
the “shadow” of the ion onto a plane to find the average area of all the possible orientations of 499
the molecule under investigation. It is the fastest method, but can lead to a systematic 500
underestimation of the CCS, especially for molecules presenting cavities. PA is generally 501
recommended for CCS determination of small molecules (10-200 atoms) with convex surfaces, 502
even though a good correlation has been reported between TM and PA when dealing with 503
CCS calculation of macromolecules [49]. 504
During the last few years, optimizations of these three algorithms and also their 505
parametrizations have been reported, especially to answer to the need of including nitrogen 506
as collision gas [50–54]. In the meantime, new algorithms have also been proposed, such as 507

21
the projection superimposition approximation (PSA) [55–57], and the local collision probability 508
approximation (LCPA) [58], both non-explicit methods; the diffuse hard spheres scattering 509
(DHSS) [59] that is a hard sphere collisions based method; and the diffuse trajectory method 510
(DTM) [59] that is a physically explicit method. Furthermore, new CCS calculators are still 511
being developed with the goal to provide the most reliable CCS calculation possible, especially 512
for large biomolecules and with nitrogen as collision gas. This is the case of the IMPACT 513
software [49] that has been specifically developed for the CCS calculation of large 514
biomolecules. Indeed, IMPACT calculates CCS using an octree-augmented projection 515
approximation with an exceptional boost to speed for large targets. “Collidoscope” [60] is an 516
alternative TM based CCS calculator using parallel processing and optimized trajectory 517
sampling, implementing both helium and nitrogen as collision gas option. 518
It is hard to compare the performance of all these approaches, but accuracy and computing 519
time are clearly strongly dependent on the molecular size. What is clear is that this gold rush 520
indicates the increasing and intriguing involvement of IM-MS in the field of structural 521
characterization. 522
523
4. Resolution and separation performance of ion mobility spectrometry 524
4.1. Basic resolution equations in ion mobility 525
The resolving power of IM is defined in the same fundamental way as for mass spectrometry, 526
but using mobility related parameters (e.g. td/Δtd instead of m/Δm). IM resolution has also been 527
historically described using a variety of approaches beginning with chromatographically-528
equivalent terms including plate height theory [61,62]. However, due to the fundamental 529
differences in ion mobility analyser principles, different models are necessary to describe the 530
achievable resolving power. As a number of recent reviews have comprehensively described 531
fundamentals behind IMS separation and resolution capabilities [8,9,16], only key theoretical 532
equations for describing IMS resolution relevant to commercially available IM-MS 533
instrumentation and their underpinning studies are highlighted in this section. 534

22
The nature of low-field drift tube ion mobility lends itself particularly well to understanding IM 535
resolution as the diffusion-based band broadening can be described by similar equations to 536
that used for isocratic linear chromatographic separations. Following historical development of 537
DTIMS instrumentation and seminal theory [27,63], the conditional resolution model [64] 538
provides a fundamentally-sound basis for describing the evolution of zone width in an ideal 539
case and the maximum obtainable sample peak capacity can thus be readily calculated 540
according to critical experimental parameters (e.g. drift gas, tube length, temperature, 541
pressure, sample type). However, limitations for this model are well-known, including the 542
influence of ion trapping and release processes, as well as additional broadening of the ion 543
packages between the IM and mass analysers. A semi-empirical model designed to account 544
for these effects was developed by the group of Hill [65] and offers a means to better 545
understand instrumental contributions to non-ideal performance, as shown in the recent study 546
of May et al. [66]. Resolution on current commercially available DTIMS instrumentation is in 547
the order of 40-60 for low pressure cells for singly charged compounds (Agilent) and up to 250 548
for high pressure cells (TOFWerk). In Table 2 [21,27,64–71], various aspects of these 549
experimental differences can be rationalised according to the relevant parameters influencing 550
DTIMS resolution. Nevertheless, attempts to improve resolution should also be considered 551
alongside other practical considerations. For example, use of above ambient pressure results 552
in improved resolution, but will also result in substantial losses in transmission [72]. 553
In the case of TWIMS, the fundamentals and achievable resolution are described in detail in 554
the publication of Shvartsburg and Smith [67]. Unlike in DTIMS, the measured drift velocity is 555
proportional to the square of the ion mobility. This yields a resolution term that is dependent 556
upon the ion mobility (scaling as K1/2) and allows the IM resolution to be practically optimized 557
according to the spread of mobilities to be measured. Further technical changes in the design 558
of commercially available TWIMS devices has allowed improved resolution (40-60) to be 559
achieved with consideration to CCS measurement stability and the optimization of the ratio of 560
wave height and wave velocity given thorough investigation [17,68]. Furthermore, exciting 561
developments in building serpentine paths of several meters in length seem to be the way 562
23
forward to achieve resolution of several 100s for next generation TWIMS devices as effective 563
IM length can be increased enormously without increasing the instrument footprint [73]. 564
A resolution equation for TIMS was derived by Hernandez et al., whereby the resolution for a 565
given ion is proportional to the gas velocity (vg) and to the fourth root of the length of the electric 566
field gradient [69]. As ions of different mobilities will be trapped using different gas velocities, 567
the achievable resolution will differ accordingly. Finally, the achievable velocity is primarily 568
controlled by vg, the electric field ramp speed, and the RF confinement. Experimental studies 569
have demonstrated good agreement with this model and resolution of up to 300 under 570
optimized conditions [74]. However, it must be noted that this very high resolution is only 571
achievable for a narrow m/z (respectively mobility) range. When used for generic, full mass 572
scan IM-MS experiments then the resolution will be in the range of 50-70. 573
Finally, as described in the review of May and McLean, IMS resolution has limitations as a 574
standalone metric for comparing different types of IMS analysers [9]. In particular, the 575
achievable resolution for DMA and FAIMS are more difficult to compare. An excellent overview 576
of DMA resolution theory is found in the aerosol science literature [75], while some recent 577
examples have demonstrated resolving powers in the order of 65 using DMA-MS with 578
optimized plate designs [76]. The fundamentals of compensation field-based resolving power 579
for FAIMS were outlined in a computational study from Shvartsburg and Smith [77] with some 580
recent contributions also highlighting some of the limitations of using classical resolving power 581
to describe the performance of FAIMS devices [78]. Although not implemented in routine 582
FAIMS analysis, one recent study demonstrated an improvement in the resolving power of 583
FAIMS from 20 up to 400-500 by the use of optimized gas mixtures and extended separation 584
times [22], while another recent work utilized ion focusing strategies to yield up to 37% 585
improvement in resolution [79]. 586
A summary of the most relevant IMS resolution equations is provided in Table 2. 587
588
4.2. Separation performance in ion mobility 589
24
Based on established differences in CCS values of molecules and IM resolution models, the 590
theoretical limitations of various ion mobility analysers can be considered according to the 591
instrument design parameters. Many early studies have assessed peak capacity in some form 592
for IM-MS analysis, with some of them focusing specifically on LC-IM-MS [80–82]. Akin to the 593
chromatographic definition [83], peak capacity within IM is simply a theoretical estimate of the 594
maximum number of peaks from the sample class of interest that can be fully resolved side-595
by-side within a single scan. In combination with resolution and/or peak capacity models for 596
different types of ion mobility devices, improvements in separation potential can be modelled 597
and practically verified. An excellent example of the improvements from increasing path length 598
can be seen in the development of serpentine paths for TWIMS separation of ions [73]. With 599
effective lengths of several meters, quite elevated resolution separations have been realised, 600
while still maintaining sub-second IMS separation times. 601
One of the great promises of combining IM with MS is the possibility to resolve and individually 602
interrogate isobaric species present in a single sample. For such considerations, the IM 603
resolving power and measurement precision are the most critical factors. The majority of 604
publications on IM-MS continue to use experimentally determined IM resolving power as a 605
means to broadly describe instrument performance, but it is critical to point out that the nature 606
of the ion (charge state), ion gating/trapping, and the IM principle used can all influence the 607
measured resolving power for a given measurement. In many cases, more relevant information 608
for users can be gained by focusing on critical pair (peak-to-peak) resolution within the 609
molecular class of interest, as originally postulated by Karasek and Kim [84]. Practically, a 610
number of studies have demonstrated that isomers exhibiting minor differences in CCS can be 611
differentiated with excellent repeatability precision when analysed separately. Conversely, 612
measurements of mixtures of isomers often yield only broadened IMS peaks as the differences 613
in CCS are in the order of <2% and cannot be resolved by most IM-MS instrumentation (Figure 614
5) [82]. In a recent contribution, the group of McLean provided theoretical estimations for the 615
required resolution to achieve sufficient IM separation such as small molecules and explored 616
the necessary advances in IM resolution required in some details [85]. In particular, the 617

25
separation challenges associated with different isobaric separation problems are discussed 618
with reference to the degree of separation required. The differences in CCS values for isomer 619
pairs of particular classes (e.g. diasteroisomers) were estimated to vary from 0.3 up to 6.9%, 620
and further suggest that an instrument with a resolving power of 250 should be capable of 621
resolving approximately three quarters of the considered isomer pairs. Thus, as modelling 622
developments and improvements in measurement accuracy established by inter-laboratory 623
comparisons continue to inform our understanding of IMS behaviour, we expect that instrument 624
design can mature in order to address this challenge. Nevertheless, it is clear that chemical 625
separation (e.g. LC) remains critical in many cases for the analysis of complex sample analysis 626
in order to correctly assign mass spectral features to individual compounds, and also to reduce 627
ion suppression which is obviously not mitigated by ion mobility separation. 628
629
5. Formation of protomers – a potential issue in ion mobility spectrometry? 630
When considering a singly charged species in positive electrospray ionization mode (ESI+), 631
the molecules have to be first protonated, and the added proton, which gives the charge, is 632
located at the molecule site having generally the largest gas-phase basicity. However, a 633
significant number of substances possess several protonation sites, which can lead to different 634
isomers in the gas phase, also known as protomers. As reported in [4], the average number of 635
protomers for more than 100,000 structures of biologically relevant compounds contained in 636
the drug data report database was equal to 6.3 per compound, which means that the 637
prevalence of protomers in the small molecule chemical space is important. In addition, it has 638
been reported that the protonation sites (location of charges) can have a significant effect on 639
the conformation of an ion [4]. In MS and HRMS, the protomers cannot be distinguished since 640
they possess different conformation, but the m/z ratios remain identical. However, when adding 641
an IMS dimension to the separation, the protomers can be differentiated based on their shapes, 642
leading to several peaks observed on the mobilogram. This behaviour is well illustrated in 643
Figure 6, showing the mobilogram of ciprofloxacin (fluoroquinolone antibiotic), which reveals 644
the presence of two well separated gas-phase species (protomers), with their respective sites 645

26
of protonation in the positive ionization mode (on the cyclic ketone and the piperazine moieties) 646
and their corresponding drift times [86]. In this example, these two different gas phase 647
components, although they only differ by their site of protonation, were well separated in IMS 648
(1.14 ms difference in drift time). The experimental IMS data of ciprofloxacin were compared 649
with theoretical calculations using molecular modelling (density functional theory) and 650
subsequent CCS calculations using projection approximation. Besides ciprofloxacin, there are 651
several other examples reported in the literature. 652
In differential mobility spectrometry, two protomers were observed for the 4-aminobenzoic acid 653
[87]. In this study, the authors have demonstrated that the relative abundance of each protomer 654
depends on the nature of the solvent employed in ESI. Various proportions of acetonitrile/water 655
and methanol/water were tested and the following conclusions were drawn: in presence of a 656
protic solvent (MeOH), mostly O-protonation of 4-aminobenzoic acid occurs, while the 657
presence of aprotic solvent (acetonitrile) favours the formation of N-protonated 4-658
aminobenzoic acid. This behaviour can be attributed to the stabilization of one of the two 659
protonated forms in a given solvent [88]. Similar observations on the influence of ESI solvent 660
on the relative abundance of protomers were reported for benzocaine, a local anaesthetic [89]. 661
The authors proved that the differences in drift times observed for the two species were 662
attributed to a different charge distribution within the molecules. They also highlighted that the 663
permittivity of the solvent was a key point since a highly protic solvent (such as MeOH/water) 664
facilitates the ionization of the most basic group (amide nitrogen) into the gas phase, while the 665
carbonyl oxygen becomes energetically favourable for protonation in the presence of a less 666
protic solvent (ACN/water), when the relative permittivity decreases. 667
Apart from differences observed between protomer abundance when altering the nature of the 668
ESI solvent, different fragmentation behaviours were also reported for the protomers. This has 669
been highlighted in [87], where some differences in the amount of residual precursor ion and 670
in some fragment ions, as well as the presence of unique ions were observed for one of the 671
two protomers of 4-aminobenzoic acid. These differences in MS/MS spectra of protomers were 672
also highlighted in [90], with ciprofloxacin as a case study. The formation, separation and 673

27
characterization of the protomers of aniline and three different porphyrins in presence of 674
different organic solvents and using polarizable CO2 as the drift gas was shown in [91]. The 675
observed protomers of aniline were characterized via structurally diagnostic collision-induced 676
dissociation (CID), thanks to post-TWIMS CID, while the pre-TWIMS CID allows the 677
determination of protomers ratio from equilibrium in solution or formed in the gas phase. For 678
aniline, the two protomers, namely N-protonated and unusual ring-protonated species, exist 679
as a ratio of 5:1 in solution equilibrium. This ratio was found to be substantially different in the 680
gas phase at non-equilibrium conditions. The same conclusions were drawn for porphyrins, 681
showing that pre- and post-TWIMS CID may be considered as a useful structural tool for 682
investigating protomers in more details. 683
In conclusion, IMS can be considered as a valuable analytical tool for the separation and 684
characterization of protomers. This feature could be particularly attractive for those who are 685
interested in determining the most favourable site of protonation or deprotonation of molecules, 686
which exhibit several acidic and basic sites. Therefore, the characterization of protomers is of 687
great fundamental relevance, to better understand compound stability and reactivity. However, 688
in analytical chemistry, the presence of various protomers for one single molecule is not 689
welcome, since it will surely add complexity to the mobilogram and MS spectra, making the 690
data interpretation difficult. Indeed, several peaks could potentially be observed for one single 691
molecule on the mobilogram. If these different species cannot be totally resolved in IMS, the 692
corresponding mobility peak will appear broad and distorted (shouldering) on the mobilogram. 693
Currently, the IMS resolution is relatively low (often below 50), and therefore, the different 694
protomers are often not separated at all and are analyzed as a single peak in IMS. However, 695
if (as expected) the IMS resolution will be significantly enhanced with the next generation of 696
instruments (see section 8.1.), numerous protomers will be observed for one given substance, 697
which will create some additional issues in terms of data interpretation. Finally, the number of 698
studies dealing with the understanding of protomers formation, separation and characterization 699
in IMS and its prevalence is still too limited and deserves some additional work from specialists. 700

28
In addition, it is important to consider that the same effect (protomer formation) can also takes 701
place with proteins and protein complexes. This is of great interest, because of the mechanism 702
whereby charges migrate upon gas-phase unfolding of the protein (collision induced unfolding, 703
CIU). More details will be provided on this particular mechanism in section 7, dedicated to the 704
characterization of large biomolecules. 705
706
6. Application of ion mobility spectrometry to the analysis of small molecules 707
6.1. Metabolomics and related applications 708
Global metabolomic studies are a challenging task that aims to analyze as much of the 709
metabolome of interest as possible often within a single analysis [92]. For this reason, high 710
resolution mass spectrometry in combination with chromatographic separation has become 711
the essential tool for successful metabolite annotation and relative quantification tasks [93,94]. 712
IM-MS in combination with LC attempts to directly address the challenge of limited metabolome 713
coverage within a single analysis, by increasing overall method selectivity, which was outlined 714
in recent contributions on this topic [9,95]. The high chemical diversity of small metabolites 715
(e.g. encompassing amino acids, small organic acids, sugars, nucleosides, nucleotides, 716
carbohydrates, sugar phosphates, vitamins, but also lipids) and their widely differing molecular 717
properties (e.g. polarity, acid/base character) provides particular challenges for the 718
development of IM-MS and LC-IM-MS workflows as in-source fragments, dimers and adducts 719
can be separated by IM, which would not occur when using LC-MS alone. Thus, the correct 720
re-grouping of these signal features and interpretation of data from such workflows remains a 721
challenging task that has not yet been solved. The earliest literature examples using this 722
combination for metabolomics demonstrated increased confidence in metabolite annotation 723
via drift time or CCS alignment, but also limitations in transmission and assignment of 724
molecular formulae to adducts [72,96,97]. 725
Building on a landmark interlaboratory study [98], Paglia and Astarita recently published a 726
protocol using LC-TWIMS-MS for both metabolomic and lipidomic studies using this platform, 727
which presents details on all procedures from calibration, tuning, analysis up to data 728

29
processing including the derivation of TWCCSN2 values [3]. Other recent works focusing on 729
method development for global metabolomics have investigated the use of commercially 730
available TWIMS-MS instrumentation for urine profiling [99] and DTIMS-MS for human plasma 731
and HaCaT cells [100], whereby improvements in signal-to-noise and some confirmed 732
examples of isobar separations have been demonstrated. Other notable recent studies have 733
focused on non-targeted metabolomic assessment of placental samples [101], and serum 734
profiling [102]. The potential of LC-FAIMS-MS was also explored in a very recent contribution 735
with a broad outlook toward different “omics” approaches [103]. 736
In addition to high resolution mass data, as commercially-available IM-MS instrumentation also 737
includes a quadrupole and collision cell (e.g. IMS-QTOF), the potential of using both IM-MS 738
with fragment ions associated to the precursor ion (i.e. aligned by drift time) can become part 739
of standardized workflows in order to utilize retention time, CCS, MS and MS/MS information 740
for metabolite annotation. However, data processing to make use of all of this information for 741
annotating metabolites in fully non-targeted workflows is time consuming and remains a 742
current roadblock for method development. 743
Aside from global metabolomic profiling, several groups have also focused on characterization 744
of secondary metabolites including food and plant studies [104–107]. Xiao et al. studied the 745
thermal degradation of beta-carotene using TWIMS-MS and putatively identified several 746
breakdown products [107]. Causon et al. demonstrated preliminary developments for wine 747
metabolomic studies using DTIMS, where excellent day-to-day repeatability precision (<0.3%) 748
and agreement between CCS determined using standards and online measurement of real 749
samples (<0.5%) was observed [104]. Covington et al. recently reviewed strategies utilized for 750
secondary metabolism and concluded that IM-MS is likely to play a role in natural products 751
dereplication [108]. Structural isomers and epimers of steroids, oxysterols and related 752
hormones have also been in focus within some recent IM-MS studies demonstrating the 753
suitability of available instrumentation for a diverse range of applications [109–111]. In all of 754
these examples, cleaner mass spectra and use of CCS as an identification point are 755
highlighted to have potential for increasing confidence in confirming metabolite identity. Thus, 756

30
it is of critical importance for establishment of user-friendly LC-IM-MS metabolomic workflows 757
that the introduction of CCS as a conditional identification point for metabolite annotation 758
involves careful establishment of consensus CCS values to populate libraries for global use. It 759
is therefore expected that combined efforts in building reference CCS libraries for different 760
types of IM-MS instrumentation will emerge in order to provide validated methods supporting 761
metabolomic-related studies. 762
The area of drug metabolism has also been studied using IM-MS in recent contributions with 763
particular focus on isomeric variants. Reading et al. studied the gas phase conformation of 764
drug metabolites using TWIMS-MS, with a focus on correlating experimental data with 765
computational models for pharmaceutical structural characterization (Figure 7) [112]. Lee et 766
al. investigated metabolites of the anticancer drug Paclitaxel to study hydroxylation at different 767
sites using TWIMS-MS and supported their results with theoretical calculations [113]. Beucher 768
et al. studied non-steroidal selective androgen receptor modulators, which are prohibited by 769
the World Anti-Doping Agency, but remain readily available and potentially used in livestock 770
production for growth promotion [114]. Interestingly, the authors were able to successfully 771
couple supercritical fluid chromatography (SFC) separation with TWIMS-MS for the analysis 772
of bovine urine and suggested that CCS has potential within this workflow to be used as an 773
identification parameter within a screening method. 774
775
6.2. Glycan analysis 776
Glycans constitute a large class of biomolecules with a broad chemical diversity. They are 777
involved in many biological processes, such as embryonic development, cell-cell recognition, 778
inflammation and fertilization, among others [115,116]. Glycans can be covalently bound with 779
proteins to form glycoconjugates and hence affect protein folding mechanism and protein 780
stabilization. An abnormal conjugation between proteins and glycans can lead to a modification 781
of the tertiary structure having an impact on their biological response. 782
Structural characterization of glycans is the first step towards the understanding of their 783
biological activity. Due to their structural heterogeneity, the elucidation of glycan structures 784
31
remains a challenging task. Liquid chromatography combined with tandem mass spectrometry 785
has been widely used for glycan analysis [117–119]. Nevertheless, different chromatographic 786
columns may be required to provide sufficient separation of isomers, which cannot be obtained 787
with tandem MS, leading to a low analysis throughput. Recent advances in IM-MS have 788
allowed the improvement of the structural characterization and separation of carbohydrates 789
have been reported since then [5,120]. Clemmer and coworkers first published the reduced 790
mobilities of negatively charged trisaccharides and their fragments by using a home-built drift 791
tube instrument [121]. In 2003, Hill and coworkers separated 21 different carbohydrate 792
standards using a non-commercial ion mobility instrument as well [122]. Overall, these results 793
showed the capabilities and the potential of IM-MS for the analysis of carbohydrates. 794
The interest on IM-MS especially increased after the advent of commercial instruments. A large 795
number of studies dealing with carbohydrate analysis in IM-MS have been reported [120] since 796
then [5]. Resolving power is the major issue of ion mobility in the analysis of carbohydrates. 797
Several strategies have been developed to circumvent this problem. Formation of non-covalent 798
complexes with metal ions has been largely used to induce alternative carbohydrate 799
conformations and thus, enhance isomer separation [123–125]. This approach has been used 800
for comparing the effect of different cations on the CCS of several milk sugar isomers [123], to 801
study the influence of the metal cation on carbohydrate structure. The sodium adducts 802
presented larger CCS compared to lithium adducts, but Na+ was not found to be a suitable 803
cation to provide the best isomeric carbohydrate separation. Altogether, it was concluded that 804
separation of isomers does not only depend on cation radius, but also on the stereochemistry 805
of the compounds. Hoffman et al. studied a set of six trisaccharide isomers with different 806
composition in the non-reducing-end moiety [126]. IM-MS experiments were performed in 807
positive and negative ion modes to evaluate the influence of the ion polarity. In addition, two 808
kinds of trisaccharide adducts were formed with Na+ and Cl- to improve the separation of the 809
precursor ions. Overall, IM provided a better separation of configurational and linkage isomers 810
in negative ion mode, compared to sodium adducts or protonated trisaccharides. Interestingly, 811
similar ATDs were observed for [M-H]+ and [M-Na]+ sodium adducts, whilst an impact on the 812

32
general structure of trisaccharides was observed upon chloride adduct formation. Another 813
additional interest about IM highlighted in this work was its ability to quantify small amounts of 814
carbohydrate impurities from a given mixture. Product ions in a relative concentration of 0.1% 815
could indeed be efficiently detected and quantified by analyzing the corresponding ATDs. 816
The versatility of certain IM-MS instruments allows the fragmentation of ions before the IM cell 817
(pre-mobility CID) [127,128] and/or after (post-mobility CID) [129,130] to provide in-depth 818
insights about the structure of precursor carbohydrates and also to generate specific tandem 819
mass spectra. For instance, oligosaccharide-alditols from bovine sumaxillary mucin (BSM) 820
were separated by HPLC and analyzed by IM-MS in the negative ion mode [128]. Some 821
specific precursor ions were post-mobility fragmented to generate specific tandem mass 822
spectra from isomeric precursor ions. CID was also performed upon IM separation giving rise 823
to isomeric mobility peaks. The mobility resolved product ions were also fragmented in the 824
transfer cell, generating further structural information. A more recent study from Harvey et al. 825
performed a post-mobility fragmentation of hybrid and complex glycans obtained from five 826
different glycoproteins [130]. 827
The previous works were mainly focused on improving the separation and identification of 828
isomeric species and the characterization of the global structure from IM measurements. 829
However, IM can also be used as a filter, to reduce the complexity associated with the 830
carbohydrate mass spectra [11,127,130,131]. Interactions between neutral buffer gases and 831
ions strongly depend on the chemical nature of the analytes, leading to different mobility 832
behaviors. May et al. calculated almost 600 CCS values that comprise different molecules 833
such as lipids, peptides, carbohydrates and quaternary ammonium salts, using a drift tube 834
coupled to a quadrupole time-of-flight mass spectrometer [11]. Above 1200 Da, these four 835
classes exhibit different gas-phase packing trends that were clearly distinguishable by IM. In 836
addition, multiply charged ions will exhibit higher mobilities than singly charged ones, 837
describing specific drift time/mass-to-charge trends that can be individually extracted from the 838
global mass spectrum. This example is clearly observed in the analysis of N-glycosides from 839
bovine fetuin studied by Harvey et al. in the negative ion mode [130]. Several well-defined 840

33
regions are displayed in the driftscope, corresponding to different N-glycan charge states. It is 841
worth pointing out that filter-role of ion mobility not only facilitates the interpretation of mass 842
spectra but also allows the detection of minor species that could not be observed in classical 843
MS conditions by improving the signal-to-noise ratio. 844
Alternative fragmentation techniques to CID are required to produce more diagnostic cross-845
ring fragments such as electron excitation dissociation (EED) [132], vacuum ultraviolet 846
photodissociation (VUVPD) [133], and extreme ultraviolet light (XUV) [134] or spectroscopic 847
techniques such as infrared multiple photon dissociation (IRMPD) [78], to produce 848
characteristic IR spectra to elucidate the structure of the carbohydrate isomers. Further 849
improvements in separation and identification of glycan isomers can be achieved by coupling 850
two IMS dimensions, as recently demonstrated [135,136]. IMS-CID-IMS-MS experiments can 851
be performed with these experimental set-ups to study the structural heterogeneity of complex 852
glycan mixtures, where the separation of the precursor ions is not fully achieved in classical 853
IM-MS experiments. 854
855
6.3. Lipid analysis 856
Lipids occupy a distinct conformational space in IM-MS analysis, due to their relatively high 857
flexibility and low density (i.e. large CCS for their m/z). Moreover, aside from the broad class 858
separation requirements for lipid analysis (triacylglycerides, phospholipids, free fatty acids, 859
ceramides, sphingomyelins,…), there is great structural diversity within individual classes 860
influencing their conformation including different alkyl chain lengths, degree of saturation, and 861
double bond position. In this regard, IM-MS offers great potential to investigate this diversity 862
that may not be revealed by conventional analysis. Application of IM-MS to lipidomics has been 863
recently reviewed by Paglia et al [137,138] and the reader is referred to these two contributions 864
for a comprehensive overview of this topic. Astarita and Paglia also recently published an 865
advanced lipidomic protocol using TWIMS-MS in combination with liquid chromatography [3], 866
while excellent insight into CCS calibration strategies for lipidomics using this type of 867
instrument was recently published [139]. In a particularly novel approach, the group of Murphy 868

34
has demonstrated the use of product ion mobility for lipidomic workflows, whereby collisional 869
activation is used to generate product ions for which a CCS value can be determined to aid 870
with lipid identification using a TWIMS-MS platform [140,141]. 871
Some very recent results from DTIMS studies have indicated the challenges associated with 872
separating minor differences in CCS (e.g. double bond position isomers) due to the sub-1% 873
differences in CCS of many isomers. Kyle et al. studied a wide range of lipid classes using the 874
Agilent DTIMS instrument demonstrating the possibilities for a wide range of lipid isomer types 875
and the separation potential offered with current resolution limitations [142]. Dried blood spots 876
were the focus of a second study from this group involving longitudinal samples from diabetic 877
patients also assessed by DTIMS [143]. Stable isotope-labelling was used for profiling of fatty 878
acids using DTIMS, where the similarity of drift times was used to help associate labeled with 879
unlabeled acids in normal and cancerous human thyroid tissue samples [144]. Impressive 880
resolution of acyl chain- and double bond positional isomers of lipids has been demonstrated 881
on the TOFWerk DTIMS platform [145]. A resolution of >250 was calculated for isomeric lipids 882
measured under low-field conditions with the instrument operated with Hadamard multiplexing, 883
which requires sophisticated signal deconvolution approaches. 884
As is the case for metabolomic studies, standardization of CCS values must become a key 885
focus for building of global lipid libraries for identity confirmation and is already a targeted focus 886
of some computational modelling studies [146]. Nevertheless, some of the subtleties of gas-887
phase lipid conformation have not yet been resolved between theoretical and experimental 888
considerations and ongoing effort is needed to reconcile these aspects. The commercial 889
availability of high-precision instrumentation utilizing different types of IMS analysers is already 890
playing a key role in supporting such work. 891
FAIMS offers a complementary approach in comparison to TWIMS and DTIMS and has also 892
been used for targeted studies of lipids by several authors for interrogating isobaric lipid 893
species as essentially a “mobility filter” prior to MS experiments. In one such study, Steiner et 894
al. used differential-mobility in combination with a state-of-the-art ozonolysis strategy to probe 895
the structure of deoxysphingosine [147]. This type of study underlines the structural diversity 896

35
within a single lipid class that can influence biological behavior that can benefit from IM-MS as 897
a powerful analytical approach (Figure 8). A very recent study has also demonstrated some 898
promising results using FAIMS for resolution of a wider range of isomeric lipid classes [148]. 899
Finally, due the complementarity of different available IM-MS analysers, the potential for 900
revealing previously unknown biological information using IM-MS has started to emerge in 901
recent literature and further insightful publications in this area are expected. 902
903
6.4. Environmental analysis 904
IMS has a long history for usage in field applications entailing rapid environmental 905
assessments. The recent review of Marquez-Sillero et al. presents IMS applications focusing 906
on environmental analysis [149]. While IMS alone has great potential for applications requiring 907
portable analysis, IM-MS and LC-IM-MS have excellent potential to be used for lab-based 908
screening workflows, particularly for trace analysis in complex samples. The group of Schmitz 909
has recently demonstrated a powerful approach by combining two online separation methods 910
(LC+LC or GC+GC) with DTIMS-MS [150,151]. Complex wastewater samples were 911
successfully screened using an in-house CCS database with excellent repeatability of CCS 912
and mass spectra, while their more recent study used GC+GC with atmospheric pressure 913
chemical ionization (APCI) for the screening of various compounds, including pesticides. 914
Further discussion of the potential of multidimensional chromatography in combination with 915
IM-MS is presented in section 8.3. Grimm et al. used TWIMS-MS for the study of of unknown 916
or variable composition biological materials (UVCBs), complex reaction products, and 917
biological materials in petroleum samples [152]. This workflow allowed mass-to-charge, drift 918
time, and Hydrogen/Carbon ratio to be used to support compound classification and inter-919
samples comparisons. While such studies offer exciting results, for such approaches to 920
become broadly accepted in standardized methods, CCS will require standardization as an 921
identification point in order to be used alongside retention time and MS identification 922
parameters within regulated methods. 923

36
The substantial challenge of exposomic studies, where 1000s of compounds including 924
xenobiotics, secondary metabolites, and transformation products which remain currently 925
unidentified, is a focus of high-throughput IM-MS studies whereby computational prediction of 926
CCS values is suggested to be a way forward to allow rapid screening of samples [153]. Such 927
a workflow requires substantial computational effort to predict CCS values, but some authors 928
have presented promising results using different approaches in addressing this major 929
challenge [154–156]. The workflow demonstrated by Zhou et al [156] was particularly in-depth 930
as DTIMS experimental data from a total of ~400 compounds were used to generate molecular 931
descriptors to train a machine-learning algorithm, which matched CCS values measured on 932
their instrument with a median relative error of 3%. Alternative approaches to modelling of CCS 933
are discussed in Section 3.3. 934
935
6.5. Clinical analysis 936
A number of studies have investigated the use of IMS and IM-MS for the analysis of samples 937
of clinical origin and the potential of these technologies for such applications was recently 938
reviewed by Chouinard et al. [110]. As is the case for environmental applications, standalone 939
IMS instrumentation is considered to be attractive for clinical applications due to its portability, 940
ease of use and low cost. Rapid sampling of exhaled breath is one example that has already 941
explored the use of this technology since the 1980s [157]. In the case of IM-MS, some of the 942
more promising investigations for clinical applications appearing within the last few years are 943
aiming toward the use of IM-MS for imaging using desorption electrospray ionisation (DESI) or 944
matrix-assisted laser desorption ionisation (MALDI) in combination with IM-MS [158–160]. 945
Apart from these developments, many of the goals and challenges within clinical applications 946
using IM-MS also overlap with those of the related “omic” studies, which are presented in the 947
elsewhere relevant sections of this review. 948
949
7. Application of ion mobility spectrometry to the characterization of large 950
biomolecules 951

37
7.1. Separation of isobaric peptides 952
One of the most important challenge of structural biology is the elucidation of the protein 953
structure/function relationship. Posttranslational modifications (PTM) like phosphorylation, 954
acetylation, or methylation can be involved in modification of the protein structure and thereby 955
have a straight impact on their function. Identification and precise location are essential 956
information to provide a thorough PTM characterization. For this purpose, LC has been used 957
prior to MS/MS to separate precursor peptides, however this approach often fails to separate 958
and identify positional variants, especially when isobaric peptides exhibit no specific 959
reporter/diagnostic fragments [154]. A newer approach based on the implementation of IMS 960
has been used to provide an additional separation dimension to the characterization of large 961
biomolecules. Ruotolo et al. studied [154] a large set of phosphorylated and non-962
phosphorylated peptides using a MALDI-DT-MS mass spectrometer. The contour plots show 963
that phosphorylated peptides exhibit lower drift times compared to non-phosphorylated 964
peptides with the same m/z. Unfortunately, the resolving power of the technique [161–163] 965
only allows the efficient separation of some phosphorylated variants. The separation capability 966
of IM was further improved by using FAIMS coupled to MS [23,164]. Three different 967
phosphorylated peptides from protein (VAVVRTpPPKSPSSAK, VAVVRTPPKSpPSSAK, 968
VAVVRTPPKSPSpSAK) were efficiently separated under the influence of the asymmetric 969
electric field and by modifying the He/N2 ratio of the buffer gas [165]. The best separation was 970
achieved with a mixture of gas containing 40/60 v/v of He/N2. The identification of each 971
phosphorylated variant was performed after ETD fragmentation. It is worth noting that ETD 972
spectraof each individual phosphorylated peptide do not exhibit unique fragments that allow 973
unambiguously identification of the precursor ions, thereby, an efficient separation is required 974
prior to ETD fragmentation. More challenging PTM characterization was envisaged with the 975
same experimental set-up, like methylated [166] and acetylated peptides [167]. Both 976
modifications were studied on histone tails, more precisely in the 1-21 and 21-44 segments of 977
H3 tails, and 1-25 segment of H4 respectively. Positional variants of methylated and acetylated 978
peptides were separated using different He/N2 or H2/N2 gas ratios, to improve ion separation. 979

38
Overall, very narrow peaks and a baseline separation could be achieved after addition of He 980
to the buffer gas (from 0% to 40% v/v). It is worth mentioning that methylated or acetylated 981
peptides are +14 and +42 Da modification, respectively over “middle down” sequences (up to 982
3 KDa) which means that methyl variation accounts for 0.5% of the mass, requiring high 983
resolving power to provide an efficient separation. These results show the utility of IM-MS to 984
improve detection of positional isomers of modified peptides and identification from a complex 985
peptide mixture. 986
987
7.2. Adding an ion mobility dimension for improved peak capacity in high throughput 988
large scale proteomics 989
Modern proteomic analysis consists of identification and simultaneous quantification of 990
thousands of proteins present in complex protein mixtures, with many applications in molecular 991
and cellular biology [168–170]. Up to now, most proteomic studies rely on bottom-up analysis: 992
complex protein mixtures are digested into peptides that are further analyzed by reversed 993
phase liquid chromatography coupled to nanoelectrospray ionization tandem mass 994
spectrometry (nanoLC-MS/MS) platforms. Hybrid tandem mass spectrometers such as ion 995
trap-orbitrap, quadrupole-orbitrap and quadrupole-time-of-flight (QqTOF) instruments have 996
dominated the field of large scale high throughput proteomics. These configurations offer high 997
data acquisition speed and high mass accuracy for peptide precursor and fragment ions. 998
However, this classical bottom-up proteomic workflow presents a series of caveats : i) several 999
peptides can co-elute from the chromatography column and ii) MS/MS acquisitions are mostly 1000
performed in a data-dependent (DDA) way, meaning that most intense ions are fragmented 1001
one at a time, the others being entirely discarded. Limited scan speeds and sensitivities of the 1002
mass spectrometers mostly account for this under-sampling, leading to subsequent lower 1003
sensitivities. Thus, improving the performance of new instrumentation relies on increasing the 1004
rate of MS/MS acquisition without information loss (transmission) on tandem mass spectra. 1005
Although ion trap instruments may still offer higher absolute sensitivity owing to their ability to 1006
accumulate precursor ions to a desired level prior to fragmentation (a feature that is not 1007
39
available on QqTOF instruments), TOF instruments have the potential for very fast data 1008
acquisition (up to 100 Hz for QqTOFs) [171] and high in-spectral dynamic range, both of which 1009
are highly desirable for the analysis of the very complex samples [172]. IMS can then be 1010
exploited to increase speed, selectivity, and sensitivity of MS/MS experiments [2,173,174]. 1011
The integration of TWIMS into DDA acquisition schemes [14], termed high definition or HD-1012
DDA [175] has removed the long standing limitation of low duty cycles of QqTOF instruments 1013
and leads to considerably improved sensitivity and productivity of proteomic analysis on such 1014
instruments [14]. The actual speed of HD-DDA is 30 Hz, mainly owing to the time required for 1015
on-the-fly data processing within the instrument control software. In the TWIMS configuration, 1016
charge separation capabilities of TWIMS cells are used to separate singly charged from 1017
multiply charged ions of tryptic peptides. 1018
Data-independent acquisition (DIA) modes, in which fragment ion spectra of all detectable 1019
precursor ions within an LC-MS run regardless of any specific characteristics (intensity, charge 1020
state and so on) are generated, [176] have also been reported as alternatives to circumvent 1021
under-sampling of MS/MS experiments. MSE is one of the first reported DIA approach and 1022
consists of two alternating MS scans recorded at low and high collision energy across the full 1023
mass range, providing precursor and product ion information, respectively [177]. The 1024
integration of IMS to DIA workflows has been referred to as high-definition MSE (HDMSE). IMS 1025
provides here an additional dimension of separation that increases the overall system peak 1026
capacity in LC-MS workflows [174], offering the possibility to fragment precursor ions after IMS. 1027
IMS not only allows the resolution of co-eluting isobaric species, but also enables the use of 1028
drift-time information [178] for the alignment of precursor and product ions (in addition to 1029
retention times in chromatography). This drastically increases the number of identified peptides 1030
and proteins in complex samples as compared to MSE workflows without IMS [179]. Optimized 1031
HDMSE approaches achieved similar proteome coverage as compared with state-of-the-art 1032
DDA methods and displayed excellent reproducibility and overlap between technical replicates 1033
[180,181]. Figure 9 presents an example of HDMSE analysis of a 400 ng Hela digest, leading 1034
to the identification of more than 38440 peptides corresponding to 3490 unique proteins. 1035

40
Thorough overview of the use of IMS-DIA-based label-free quantification and its applications 1036
in biomedical research and clinical proteomics have been reported elsewhere [182,183]. 1037
Similarly, IMS-DIA has also been reported for enhanced impurity detection in protein 1038
biotherapeutics (Host Cell Proteins, HCP), as they present a high dynamic range between the 1039
very abundant therapeutic protein and its low abundance impurities. HCPs present at a 1040
concentration as low as 1 ppm (1 ng HCP/mg mAb) were successfully identified and quantified 1041
in the reference NIST monoclonal antibody and Infliximab [13]. Recently, Haynes et al. 1042
described the use of a new mode of IMS-DIA acquisition: instead of performing IMS-DIA at a 1043
fixed velocity TWIMS settings, ramping the traveling-wave velocity increased drift space 1044
occupancy, amplifying resolution by 16%, peak capacity by nearly 50%, and peptide/protein 1045
identifications by 40%, opening new perspectives for variable-velocity TWIMS in proteomics 1046
analysis [184]. To summarize, IMS adds an orthogonal analytical dimension, reduces ion 1047
interference to improve reproducibility, peak capacity, and peptide identifications to rival 1048
modern hybrid quadrupole orbitrap systems. 1049
A variant of the HDMSE approach has been proposed using a TIMS device [185], introducing 1050
the concept of parallel accumulation–serial fragmentation (PASEF) consisting of sub-1051
millisecond quadrupole serial selection and fragmentation of multiple precursors in single 50 1052
ms TIMS scans [185]. PASEF enables hundreds of MS/MS events per second at full sensitivity. 1053
The PASEF workflow presents a series of advantages among which: i) no loss of sensitivity, 1054
ii) the resulting spectra are fully precursor mass resolved and iii) good compatibility with 1055
reporter ion based chemical multiplexing strategies (such as iTRAQ or TMT). A 10-fold gain 1056
should be achievable by PASEF in shotgun proteomics experiments, as a consequence of 1057
increased sequencing speed, without a decrease in sensitivity. However, modeling suggests 1058
that a combination of targeting more precursors and targeting weak precursors repeatedly will 1059
be most effective. The PASEF principle could be applied to any IM-MS configuration with the 1060
required sub-millisecond scan speed in the MS read out. 1061
1062
7.3. Ion mobility spetrometry for the characterization of gas phase protein structures 1063

41
ESI-IM-MS has been mostly used to study the 3D architecture and conformational properties 1064
of many proteins and biomolecular complexes, through the measurement of their averaged 1065
CCS [28]. However, over years, the question “is protein conformation altered from the solution 1066
to the gas phase of the mass spectrometer?” became central to avoid misinterpretation of IM 1067
data. Several studies that compared IM measured CCS to either calculated CCS from PDB 1068
structures or in vacuum molecular dynamics (MD) generated CCSs brought partial answers to 1069
this question. One common observation is that when the charge increases, the molecules 1070
undergo Coulomb-induced unfolding to adopt extended helical structures [186,187] and 1071
ultimately string-like extended structures at very high charge states [188,189]. At low charge 1072
states, however, the proteins usually remain compact, with sizes that are expected for 1073
condensed phase native structures. Thus, depending on the type of proteins/complexes of 1074
interest, the gas phase collapse and/or unfolding of proteins is more or less pronounced. It is 1075
now generally accepted that 3D structures of globular proteins (like TRAP, TTR, SAP, integral 1076
membrane proteins) [190] survive the transfer into the gas phase without major compactions 1077
or unfolding at low energies [191], as attested by the number of success stories based on 1078
agreement between IMS-measured CCSs and calculated ones. More recently, Devine et al. 1079
[192] showed that non-globular proteins (like monoclonal antibodies or proteins with flexible 1080
hinge regions in between more structured domains) and RNA molecules undergo strong 1081
compaction in the gas phase (CCS values measured underestimate the physical size of the 1082
solution structure and modeled data of the biomolecule), highlighting a potential caveat in 1083
studying these specific biomolecules with this technique. However, IMS is not directly sensitive 1084
to protein secondary structure, and observing a compact structure does not guarantee that the 1085
secondary structure accurately reflects that of the native form. To go ahead with keeping 1086
secondary structures from the solution to the gas phase, optical/IR spectroscopy, a direct 1087
method that allows distinguishing helices from -sheets, has been coupled to IMS [193]. In this 1088
configuration, IMS is used to select the global shape of proteins, followed by IR spectroscopy 1089
to probe their secondary structure. On two reference proteins, myoglobin (85% of -helix) and 1090
β-lactoglobulin (60% β-sheets), IMS combined to IR showed that secondary along with tertiary 1091

42
structures are retained in the condensed gas-phase. When IMS is combined to gas-phase 1092
infrared multiple photon dissociation (IRMPD) spectroscopy, gas-phase Coulomb-driven 1093
unzipping to a defined secondary structure is a general feature of all highly charged protein 1094
ions [194]. 1095
1096
7.4. ion mobility spectrometry for proteins and protein-ligand complexes 1097
7.4.1. Ion mobility spectrometry for intrinsically disordered proteins 1098
Intrinsically disordered proteins (IDPs) have been the scope of many IM-MS studies (for review 1099
see [195,196]). Indeed IDPs, which are associated with a wide range of major disorders 1100
including cancer and amyloid-related disorders, are flexible proteins that can adopt many 1101
different conformations in order to bind to different physiological partners. This conformational 1102
change along with absolute conformation(s) characterization and detection of populations of 1103
conformations can be uniquely monitored by IM-MS. Bernstein et al. [197] performed IM-MS 1104
experiments on α-synuclein that indicate how the size of its conformations differed with charge 1105
state at initial solutions of neutral and acidic pH. IM–MS has also been used to study the 1106
structure of the DBD (DNA-binding domain) of the tumour-suppressor protein p53 with and 1107
without the functional zinc [198]. IM-MS showed smaller CCSs (12.3% in CCS) for the p53 1108
without zinc than for the zinc-bound form. Other research using IM–MS to study IDPs has 1109
examined changes in conformational equilibria of the intrinsically disordered HMGA (high-1110
mobility group A) chromatin factors [199]. IM-MS measurements of wild type and of a C-1111
terminal truncated (shorter) HGMA2 were recorded. Despite the increase in size of WT with 1112
respect to the C-terminal truncated HGMA2, IM-MS revealed a more compact structure for the 1113
C-terminal shorter form, indicating that the presence of the C-terminal tail is here responsible 1114
for further compacting HGMA2, which could be correlated to a reduction in oncogenic activity. 1115
D’urzi et al. reported the use of IM-MS to characterize the complex between the intrinsically 1116
disordered NTAIL domain and the phosphoprotein X domain (PXD) from measles virus (MeV). 1117
IM-MS revealed distinct conformers, yielding the estimation of the solvent-accessible surface 1118
area (SASA) in solution and the average CCS in the gas phase. Computational modeling of 1119

43
the complex in solution, based on experimental IM-MS constraints, were generated and 1120
provided the first attempt to modeling the entire NTAIL domain bound to PXD at atomic resolution. 1121
IM-MS is also well-positioned to assess IDP/ligand interactions and conformations induced 1122
upon ligand binding. Dickinson et al. have demonstrated the use of IM-MS to characterize the 1123
effect of two inhibitors RITA and Nutlin-3 on their respective binding partners: p53 and MDM2 1124
[200]. While no Np53:RITA complex was observed in native MS experiments, an alteration in 1125
the conformational distributions (through variations in DTCCSHe values) adopted by Np53 in the 1126
gas phase was observed. This finding supports the hypothesis that RITAs mode of action 1127
proceeds via a conformational change in p53, which was further confirmed by a combination 1128
of complementary biophysical techniques. Similarly, DTIMS analysis revealed that, in the 1129
absence of Nutlin-3, every charge state of N-MDM2 shows at least two conformations. Again, 1130
upon binding to Nutlin-3, the protein undergoes a compaction event similar to that observed 1131
with RITA and Np53. This multi-technique approach highlights the inherent disorder in these 1132
systems; and in particular exemplifies the power of IM-MS as a technique to study transient 1133
interactions between small molecule inhibitors and IDPs. For instance, Knapman et al. 1134
reported the use of IM-MS to probe the conformational characteristics of two IDPs, apo-1135
cytochrome c and apo-osteocalcin, which are both structured when bound to their respective 1136
substrates, but disordered in their unbound-states [201]. In both cases, the intrinsically 1137
unstructured apo-states exist as multiple conformations with larger cross-sectional areas than 1138
their holo-analogues, suggesting that IDPs do not preclude the formation of preferred 1139
conformations. Together, these examples illustrate the scope and utility of IM-MS for studying 1140
the characteristics and properties of IDPs, whose analysis by other techniques is limited. 1141
Another feature that can be monitored by IM-MS is the tendency of IDP to form amyloid fibrils, 1142
the protein aggregates involved in the onset of neurodegenerative diseases such as 1143
Parkinson’s and Alzheimer’s (for review see [202]). Due to their dynamic, polydisperse, and 1144
polymorphic nature, these oligomers are very challenging to characterize using traditional 1145
condensed-phase methods. IM-MS based approaches can be used to study amyloid 1146
formation, providing information about the assembly pathway and the size and shape of 1147

44
presumably toxic oligomers. IM-MS was first used to separate, analyze and measure CCSs of 1148
individual oligomer species present in equilibrium [202]. A remarkable IM-MS study is reported 1149
by Leney et al. [203] and compares the oligomers formed from wild-type β2m (beta-2-1150
microglobulin) with those formed from a variant of the protein (H51A), during in vitro fibril 1151
assembly. While H51A was shown to exhibit a two-fold increase in the lag-time of fibril 1152
formation, no differences were observed by IM-MS for the oligomers of the two proteins (similar 1153
CCSs). Real-time native MS was the only technique able to highlight the differences in the 1154
kinetics of the lag phase between the two protein variants. Similarly, IM-MS was used to 1155
investigate the formation of heterogeneous pre-fibrillar, oligomeric species involving human 1156
amylin (also known as islet amyloid polypeptide, hIAPP) and the amyloid-beta peptide (Aβ-1157
40), two pathogenic factors in Type 2 diabetes mellitus (T2DM) and Alzheimer's disease (AD), 1158
respectively [204]. Oligomerization of human islet amyloid polypeptide (IAPP), being 1159
considered as a pathogenic process in type II diabetes, has also been extensively investigated 1160
by IM-MS [205,206]. Time-course MS and IM-MS were reported to probe the early aggregation 1161
states of an amyloidogenic endecapeptide derived from amino acid residues 105-115 of the 1162
human plasma protein transthyretin [207]. Early Aβ oligomers, which are thought to be 1163
responsible for the neurodegeneration of AD patients, have also been analyzed using IM-MS 1164
[31]. IM-MS revealed for instance that full-length Aβ42 aggregates faster and is more cytoxic 1165
than the shorter Aβ40 variant, which could be related to a compact stable tetramer formation 1166
for the Aβ40 and a rather “open tetramer” that can evolve to an hexamer for the Aβ42. More 1167
recently, Illes-Toth et al. have characterized by IM-MS a specific population of α-syn oligomers, 1168
which was shown to have the ability to induce intracellular aggregation [208]. Structurally, the 1169
MS compatible oligomers populated a range of species from dimers to hexamers. Lower-order 1170
oligomers were structurally diverse and consistent with unstructured assemblies. Higher-order 1171
oligomers were shown to be compact with ring-like structures. The observation of this compact 1172
state may explain how this natively disordered protein is able to transfer pathology from cell to 1173
cell and avoid degradation by cellular proteases. 1174
45
IM-MS provides valuable data on the ion’s overall size and shape, but it does not yield direct 1175
information about the underlying internal structure. To obtain such data, IM-MS was recently 1176
used as a preselection tool for a further analysis using orthogonal, structure-sensitive gas-1177
phase techniques, like action fluorescence resonance energy transfer (FRET) spectroscopy 1178
[209] or gas phase infrared spectroscopy [210]. IM-MS can also be successfully applied for 1179
high-throughput inhibitor screening. IM-MS is capable of high-throughput binding screening 1180
with a rate of up to 5000 molecules per day [211,212], providing not only conformational 1181
characteristics but also binding stoichiometries and specificities. 1182
To summarize, IM-MS provides a useful insight into events that occur during the early stages 1183
of aggregation including delineating the structure of the monomer, identifying oligomer 1184
distributions, and revealing mechanistic details of the aggregation process. 1185
1186
7.4.2. Ion mobility spectrometry for protein-ligand interactions 1187
The study of protein–ligand interactions is of particular interest for the pharmaceutical industry, 1188
especially in the context of drug development. Native MS has there also been demonstrated 1189
to be a pivotal technique providing relevant information about stoichiometry of interaction, site-1190
specificity of ligand-binding and, in appropriate cases, affinities (through dissociation constant, 1191
KD, measurements) between the target protein and the ligand [212,213]. As the binding of 1192
ligands often induces a conformational change of the protein, the hyphenation of IMS to native 1193
MS could bring an additional level of conformational characterization, in addition to the 1194
classical binding screening (for review see [213,214]). A first solution to track the 1195
conformational change of a protein upon ligand binding is thus to perform IM-MS and measure 1196
CCS values for the free protein and the ligand-bound form. However, this simple and basic 1197
idea is not straightforward as ligand binding not always induce major global conformational 1198
changes, but rather very localized conformational changes with exceedingly low impact on the 1199
global CCS measurements (below 5% CCS differences). In addition, the resolution of the IMS 1200
cell is here of paramount importance. As a consequence, careful optimization of the IM cell to 1201
distinguish between protein (P) and protein:ligand (P:L) are required to resolve CCS changes 1202

46
lower than 2% for P:P and P:L complexes [29,68,215]. Despite these limitations, the use of IM-1203
MS to discern conformational tightening on the c-MYC:MAX leucine zipper formation due to 1204
ligand binding has been previously reported by Harvey et al. [216] and along with these 1205
findings, provides an exciting prospect as a method for screening inhibitors to conformational 1206
dynamic systems. Collision induced unfolding (CIU) experiments have proven to be an 1207
interesting IM-based alternative to tackle systems involving very subtle conformational 1208
changes (<2%). CIU is an IMS-based gas phase method that aims at collisional heating of 1209
ions, typically through the application of an accelerating electric field that results in higher-1210
energy collisions with background gas. Ions undergo unfolding and the resulting conformers 1211
are separated in the IMS cell. Two ions that share similar initial CCS values can be readily 1212
differentiated through the CCSs and collision energies associated with the unfolded protein 1213
forms populated during CIU. The comparison of CIU fingerprints (IM drift times as a function 1214
of accelerating voltages) obtained for P and different P:L systems can help to differentiate 1215
conformational populations of very close CCS (<1%, [217]). Ruotolo first showed that CIU 1216
experiments allow differentiation of the effects of ligand binding not normally observed by MS 1217
alone on wild-type (wt) and disease-associated variants of tetrameric transthyretin (TTR) [218]. 1218
CIU experiments were able to show that the natural thyroxine ligand of TTR stabilizes wt TTR 1219
but also disease-associated TTR variants. Similar experiments were reported for ligand 1220
binding on model proteins like FK-binding protein, lysozyme or myoglobin [219]. More recently, 1221
CIU experiments have been reported for the identification of kinase inhibitors that specifically 1222
bind to the inactive conformation of the protein. CIU patterns allowed distinguishing between 1223
inhibitors with similar KD values, suggesting the use of IMS-based CIU fingerprints as a new 1224
assay capable of both rapidly detecting inhibitor binding and classifying the resultant kinase 1225
binding modes. Since then CIU experiments have been reported in advanced drug discovery 1226
workflow [220], highlighting the stabilizing role of lipids in the context of membrane protein 1227
complexes [221] or the cooperative stabilization effects upon sugar binding in the concanavalin 1228
A tetramer [222]. CIU appears as a method allowing to “resolve the unresolved through gas-1229
phase measurements” [213]. 1230
47
1231
7.4.3. Ion mobility spectrometry for membrane proteins 1232
IM-MS is also a well-established strategy to study the global conformation of membrane 1233
proteins and the characterization of their interactions with ligand/lipids [223–225]. Membrane 1234
proteins are involved in many vital cellular processes, such as trafficking and signal 1235
transduction [226,227]. Due to the high hydrophobicity associated to their structure, membrane 1236
proteins are transferred into the mass spectrometer encapsulated within detergent micelles to 1237
preserve their native-like structure [167]. Detergent aggregates strongly suppress ionization in 1238
ESI and need to be removed to perform MS analysis. Therefore, ionization source conditions 1239
such as pressure, temperature, and acceleration voltages are critical for membrane protein 1240
analysis. The protective role of detergent aggregates was clearly showed in the case of the 1241
transmembrane complex BtuC2D2 [223]. After increasing the number of collisions to produce 1242
the release of the complex from the micelle, the intact tetramer can be observed. The same 1243
ion channel (BtuC2D2) and a transporter (KirBac3.1) were characterized by Robinson and 1244
coworkers [224] to compare the average CCS of both tetramers after release from the 1245
detergent micelles. Different activation energies were applied and the overall size of both 1246
tetramer remained constant. The same experiment was performed upon activation of their 1247
respective trimers. In this case, KirBac3.1 trimer exhibited one single distribution that remained 1248
constant through ion activation, however, a bimodal distribution was observed for the BtuC2D2 1249
trimer when the acceleration voltage was set to 240 V being consistent with two conformer 1250
populations. Experimental CCS of BtuC2D2 and KirBac3.1 trimers were smaller compared to 1251
the theoretical ones, suggesting that trimer structures collapsed after the removal of one 1252
subunit. 1253
CCS measurements played a critical role in the modeling strategy of full length OmpA (FL-1254
OmpA) dimer structure [167]. Native MS data showed monomeric and dimeric populations 1255
while further IM-MS experiments revealed compact dimers and extended and compact 1256
monomers. The same experiment was carried out for the N-terminal domain (TM-OmpA), 1257
where only the monomer structure could be observed. These results combined with native MS 1258

48
confirmed that dimer interface was located in the C-terminal 188-276 amino acid sequence. A 1259
low-resolution structure for the FL-OmpA dimer assembly was proposed based on IM-MS data 1260
as well as cross-linking constraints. The theoretical model of the FL-OmpA dimer is sustained 1261
by the good agreement between experimental and theoretical CCS. 1262
Amphipatic polymers (APols) have been shown to be a suitable alternative to detergent 1263
aggregates for preserving membrane protein water solubility [228]. Watkinson et al. studied 1264
the influence of several APols on the structure and activity of three outer membrane proteins 1265
(Omp), namely PagP, OmpT, and tOmpA [229]. The catalytic activity of these three Omp 1266
strongly varies as a consequence of amphipols interactions, despite the fact that circular 1267
dichroism data indicate that PagP, OmpT, and tOmpA native structures is preserved in the 1268
amphipols. The structures of the released Omp were assessed by ESI-IMS-MS. The 1269
experimental CCS of the lower charge states were in good agreement with theoretical CCS 1270
from protein data bank (PDB)-coordinates indicating that APols tested in this study do not 1271
induce any significant structural changes. 1272
Membrane proteins have shown strong interactions with lipids [167,230]. They play an 1273
essential role in membrane protein structure, folding, and activity [230,231]. Laganowsky and 1274
coworkers studied the selectivity of lipid binding to membrane proteins by using native MS and 1275
IMS. The stability of the mechanosensitive channel of large conductance (MscL), aquaporin Z 1276
(AqpZ) and the ammonia channel (AmtB) was assessed upon lipid binding by monitoring the 1277
unfolding process of the membrane proteins as a function of collision voltage (CIU 1278
experiments). CIU fingerprints revealed that upon the addition of CDL and PG, the stabilisation 1279
energy of AmtB dramatically increased. This result is based on the increase of the collision 1280
voltage required to induce unfolding process of the lipid complexes compared to the apo 1281
structures. In the case of AqpZ and MscL, the same stabilization effect was observed after the 1282
addition of the different lipids. These results emphasize the interest on CIU experiments to 1283
study the selectivity of membrane proteins toward lipids, and how this interaction can modulate 1284
their function. In this case, the trap cell was used for releasing membrane proteins from 1285
detergent micelles as well as to induce protein unfolding. To avoid the presence of detergent 1286
49
aggregates in the trap cell, “in-source” fragmentation was performed by increasing the source 1287
temperature up to 120 V [225] (Figure 10), thus detergent aggregates are removed before the 1288
entrance of the ions in the trap cell. Ions are subsequently activated (CIU experiments) with or 1289
without previous ion selection (IMS-MS or MS-IMS-MS respectively) to monitor the unfolding 1290
process of membrane proteins as a function of the activation energy. Stabilization of AmtB 1291
upon lipid binding could be evidenced by comparing the transitions of the CIU profiles. The “in-1292
source” fragmentation allowed performing MS-IMS-MS CIU profiles to evaluate the 1293
stabilization energy provided upon lipid binding. 1294
Overall, for all these works, experimental CCS for membrane proteins were measured through 1295
the use of well-defined IM calibration protocols [232,233]. However, membrane protein ions 1296
exhibit lower mobility compared to soluble proteins with similar molecular weights [223] as a 1297
result of their low charge state. In a recent paper from Allison et al., it was reported that the 1298
average mobility of membrane proteins was about 30% lower than soluble proteins used for 1299
TWIMS calibration [190]. Similar native-like membrane protein standards should be used to 1300
provide an accurate CCS measurement. Due to the lack of available membrane protein 1301
standards, they suggest to use larger calibrants for reducing the error associated with the long-1302
range extrapolation of the calibration function. 1303
1304
7.5. Ion mobility spectrometry for large protein assemblies and its integration to 1305
structural biology programs 1306
For protein analysis, IM-MS is mostly used to characterize conformational states or to monitor 1307
conformational changes induced upon any modification of the protein environment 1308
(experimental conditions, oligomerization, ligand binding, RNA/DNA binding, protein partner 1309
binding, etc. [41]). As the number of publications reporting the use of IM-MS for protein 1310
characterization has tremendously increased in the past 10 years, it is no more possible to 1311
draw an exhaustive picture of the possibilities of IM-MS for protein conformational 1312
characterization. IM-MS can be used to determine changes in mobility and thus conformation 1313
and CCS, properties such as conformational dynamics, folding and unfolding intermediates, 1314

50
ligand-induced conformational changes, aggregation intermediates and quaternary structures 1315
(topology) [2,28,41]. We thus tried to focus on some relevant works performed over the past 1316
10 years that could serve as case studies. 1317
Native MS has been particularly useful to study the dynamics of assembly or disassembly of 1318
several macromolecular machineries, giving direct access to the stoichiometry of intermediates 1319
of assembly/disassembly through accurate mass measurement. When combined with IMS, 1320
native IM-MS enables monitoring of global conformational changes occurring during the 1321
assembly/disassembly process through accurate CCS measurements. Plots representing the 1322
CCS as a function of mass are often used to highlight assembly/disassembly events. In such 1323
representation, CCS is expected to follow a linear increase as a function of the compound 1324
mass, thus events that happen at constant CCS further suggest a major conformational 1325
change. An example of such IM-MS application is given by Van Duijn et al [234], who reported 1326
the use of native MS in combination to IMS for the study of the E. coli Cascade complex (405 1327
kDa) and the P. aeruginosa Csy CRISP-complex (350 kDa) immune systems. They monitored 1328
Cascade complex disassembly either under gas-phase or in-solution dissociation experiments 1329
using native IM-MS. The results allowed to create subunit connectivity models of both the 1330
Cascade and Csy CRISPR immune systems. They compared experimentally measured 1331
CCSEXP of Cascade sub-modules with values calculated using molecular modeling on the basis 1332
of the cryo-EM structure of Cascade. Finally, the interaction between Cascade and its target 1333
ssDNA was next monitored by IM-MS, highlighting a small but significant structural change for 1334
Cascade upon its association to ssDNA as evidenced by the measured CCSEXP (3 nm2 1335
experimental compared to 9 nm2 expected from calculations), which can only be explained by 1336
an altered conformation of the complex. 1337
Several case studies based on structural information derived from IM-MS to build three-1338
dimensional models have been reported, including the analysis of the full clamp loader 1339
complex (γ3δδ'ψχ, 254 kDa) in interaction with a single-stranded DNA (ssDNA) binding protein 1340
(SSB4) [235] (Figure 11), the analysis of the trp RNA binding attenuation protein (TRAP) [41], 1341

51
the study of ribonucleoprotein particles (sno/sRNPs) [236] or to decipher the conformation and 1342
assembly of viruses with molecular weights ranging from 1.8 MDa up to 18 MDa [237–239]. 1343
Most of these studies were performed on TWIMS instruments. However, the group of 1344
Fernandez-Lima recently reported for the first time the use of TIMS instruments for accurate 1345
CCS measurements on protein complexes [240]. As CCS values alone give no detailed 1346
information on subunit structure within the complex, IM-MS analyses can be coupled to gas-1347
phase activation techniques including collision induced dissociation (CID) and more recently 1348
surface induced dissociation (SID) to generate sub-complexes, SID being more adapted to 1349
retain native-like structures in the gas phase [241,242]. In addition, crosslinking strategies have 1350
been proven to be valuable to capture transient complex, protein complexes modified with 1351
either charged crosslinkers or tags, but not those treated with neutral crosslinkers, exhibiting 1352
enhanced stability in the gas phase relative to CIU [243]. 1353
Overall, these studies of large heteromeric complexes analyzed by IM-MS, coupled with 1354
integrative modelling, highlight the potential of such an approach to reveal structural features 1355
of previously unknown complexes of high biological importance. 1356
IM-MS can be considered today as a complementary low-resolution technique for structural 1357
biology. Indeed, hybrid approaches in structural biology have gained considerable interest for 1358
uncovering the molecular architectures of large and transient biological systems. MS-based 1359
methods, and in particular IM-MS, and structural electron microscopy can complement 1360
conventional tools, such as X-ray crystallography and NMR spectroscopy [244,245]. Today, 1361
IM-MS is often applied to the structural elucidation of protein assemblies that have failed high-1362
throughput crystallization or NMR spectroscopy screens. In the interpretation of the IM data 1363
for multiprotein complexes, there are two main steps to interpret IM for multiprotein complexes: 1364
the conversion of drift times into CCS values, and their comparison with model protein 1365
architectures. 1366
Such IM-MS and MS/MS measurements are often integrated with other sources of structural 1367
information to build comprehensive models of intact multiprotein complexes that remain 1368

52
refractory to more classical structural biology techniques. For instance, CCS restraints from 1369
IM-MS have been successfully combined to distance constraints from chemical crosslinking 1370
approaches to determine the best model among hundreds or thousands of computationally 1371
generated models for the study of the proteasomal base [246] or for the outer membrane 1372
protein A from Escherichia coli [247]. Combining IM-MS to solution hydrogen/deuterium 1373
exchange MS (HDX-MS) seems also appealing and has been reported for the characterization 1374
of flexible serpins [248] or on the Kai circandian complex [249]. For this latter system, native 1375
MS revealed that the complex formed between two of the components (KaiB and KaiC) is a 1376
dodecamer; HDX-MS provided their binding interface and finally the structural restraints 1377
derived from HDX were then combined with IM-derived CCSs and used as input for the 1378
HADDOCK web server to generate models of the KaiC6B6 complex. IM–MS is an emergent 1379
technology for structural proteomics, capable of assessing multiprotein topologies from 1380
complex mixtures using minute amounts of sample. Computational analysis is a key aspect of 1381
IM–MS data interpretation, and developments in this area are likely to be rapid over the next 1382
5 years. 1383
1384
7.6. Biopharmaceuticals 1385
MS performed under non-denaturing conditions (native MS) has emerged as a promising 1386
technique for mAb-related compound characterization [250,251]. As a logical evolution, 1387
hyphenation of IMS to native MS was also rapidly implemented for biopharmaceutical analysis. 1388
Since IMS provides a global view of conformational differences, it is a good choice for 1389
preliminary investigations of mAb conformations, where the shape and size of the molecule 1390
are of interest. IMS can either be used qualitatively mostly to address heterogeneity issues, 1391
but also in a quantitative way, to determine CCS values or to directly evaluate the relative 1392
amounts of the different species present in solution from IMS data. IMS can also serve to 1393
address more fundamental issues through collision induced unfolding (CIU) experiments, in 1394
which collisional heating is applied in the gas-phase to unfold the protein, which is 1395
subsequently separated by IM and then analyzed by MS. A typical CIU plot presents IM drift 1396
53
times as a function of increasing collisional energies applied in the region in front of the IM cell 1397
[252]. CIU fingerprints represent the amount of protein unfolding as a function of collisional 1398
energy applied. Those unfolding patterns have proven to be highly sensitive to small variations 1399
in protein structure that cannot be easily resolved by IMS alone. Figure 12 summarizes the 1400
IMS-based information that can be obtained for biopharmaceutical characterization. 1401
1402
IMS for disulfide bridge heterogeneity - The first application of IMS for mAb structural 1403
characterization was reported in 2010 for the rapid characterization of disulfide variants in 1404
intact IgG2 mAbs [253]. IMS revealed 2 to 3 gas-phase conformer populations for IgG2s, 1405
whereas a single gas-phase conformer was revealed for either an IgG1 or a mutated IgG2, 1406
providing strong evidence that the observed IgG2 gas-phase conformers are related to 1407
disulfide bond heterogeneity. Similarly, Jones et al. have used IMS to rapidly provide 1408
information on the higher order structure of a series of wild type and mutant IgG2 mAbs [254]. 1409
1410
IMS for global conformational characterization - Given that IM is fast and gives a global view 1411
of mAb-related compound conformation, several groups have addressed the global 1412
conformation of mAb, ADC or bispecific antibodies compounds using IMS, attempting to 1413
attribute CCSs to given mAb isotype conformations and even to particular conformational 1414
heterogeneities. Pritchard et al. used this approach to detect three monomer conformations 1415
and two dimers for a commercial rhGH-specific antibody [255]. A quantitative analysis of the 1416
ATDs revealed that ∼80% of the species present in the sample was in the second monomer 1417
conformation. Pacholarz et al. reported structural differences between IgG1 and IgG4 based 1418
on IMS measurements [38]. Interestingly, the DTCCSHe values obtained on a linear drift tube 1419
IM instrument in helium (61.1–83.2 nm2) were in agreement with those measured on TWIMS 1420
instruments by other groups for different IgGs, which demonstrates the robustness of the CCSs 1421
calculated from properly calibrated IM-MS data. However, the experimentally IMS-estimated 1422
CCS values were shown to be significantly lower than the CCS determined either from crystal 1423
structures or from MD simulation [38,192]. This has recently been explained by the flexibility 1424

54
of the hinge region which collapses in the gas phase, such that the measured CCS of the mAb 1425
is substantially less than both the predicted CCS from its crystal structure and the in vacuum 1426
MD simulation [192]. 1427
1428
Real-time IMS to monitor dynamic processes – IMS has also been employed to monitor 1429
dynamic processes such as the IgG4 Fab-arm exchange that produces bispecific mAbs, 1430
constituted of two different half-antibody arms, each of which recognizes a distinct antigen, a 1431
particularly valuable property for therapeutic applications. In combination with time-resolved 1432
native MS, IMS was used to monitor the formation of the bispecific mAbs in real time [256], the 1433
CCSs of the bsAb (66.9 nm2) being intermediate to those of the original mAbs (65.6 and 69.6 1434
nm2). 1435
1436
IMS for ADC drug conjugation heterogeneity assessment - IMS can also be of great interest 1437
for the characterization of drug conjugation heterogeneity/homogeneity for antibody-drug 1438
conjugate characterization. IMS can provide several information, among which the global 1439
conformation of all detected species including conjugated and unconjugated forms or the 1440
global conjugation profile and average drug-to-antibody-ratio (DAR) through a semi-1441
quantitative interpretation of IMS data (integration of ATDs areas). Debaene et al. reported the 1442
IMS characterization of brentuximab vedotin, the reference cysteine ADC [257]. The different 1443
TWCCS of the multiple drug loads were calculated, evidencing slight conformational changes 1444
that occur upon payload binding. The average DAR determined from IMS was 3.7 ± 0.1 (vs. 1445
4.0 expected), consistent with values obtained from other MS methods. In addition, 1446
hydrophobic interaction chromatography (HIC) fractions were collected and analyzed 1447
individually by IMS, revealing conformational homogeneity of each drug load species. Marcoux 1448
et al. next performed a similar study on trastuzumab emtansine (T-DM1), the reference lysine 1449
ADC already on the market [258]. The detailed structural picture provided by IM-MS was 1450
complemented by molecular modeling. As for the cysteine compound, native IMS highlights 1451
the increase in heterogeneity that occurs when trastuzumab is conjugated with DM1. The 1452

55
resulting drug distribution profile and average DAR (3.4 ± 0.2) are also consistent with values 1453
obtained from other MS methods (average DAR of 3.5). Recently, extensive conformational 1454
characterization by IMS of a new generation site-specific ADC enabled detection of different 1455
IM drift times for unconjugated mAb and the DAR4 site-specific ADC [259]. Again, average 1456
DAR values along with drug load distributions could be estimated. Altogether, these studies 1457
demonstrate the capabilities of native IMS to directly access site-specific ADC conformational 1458
information through the measurement of IM drift times and CCS calculations. 1459
1460
Qualitative IMS for comparability studies - IMS is a forefront methodology for qualitative batch 1461
to batch comparison. In case of comparability studies between originators and biosimilars 1462
(copy versions of mAb), IMS can address global conformational identity. IMS has been 1463
employed to highlight conformational heterogeneity in a biosimilar version of trastuzumab. 1464
Different IM drift times were observed for trastuzumab and its biosimilar version, which could 1465
be attributed to the presence of additional species bearing 0 or 1 glycan per Fc on the biosimilar 1466
version [260]. Similarly, a combination of MS-based approaches, including native MS and IMS 1467
were used to compare the originator compound Remicade (infliximab, Janssen) to its biosimilar 1468
product Remsima (Celltrion) [261]. Native IMS revealed similar IM drift times for mAb 1469
fragments, monomers, and dimers in both sample. Extensive comparative studies of 1470
monoclonal antibody drug products representing different IgG subclasses, manufacturers, and 1471
lots were also reported by Fergusson et al. [262] using a set of IMS-based metrics to assess 1472
reproducibility and robustness issues of IMS. IMS enabled detection of differences between 1473
monoclonal antibodies with the same target protein but different production techniques, as well 1474
as products with different targets. All of these studies conclude that native IMS analysis 1475
presents the advantage to require only a minimal (when manual buffer exchange is used) or 1476
no (when size exclusion is coupled to IMS using volatile salts) sample preparation, along with 1477
a global conformational characterization of the studied mAb-related compounds. 1478
1479

56
CIU experiments and variable-temperature IMS to study mAb unfolding patterns - IMS 1480
methodologies based on CIU experiments have been reported to address rapid conformational 1481
characterization of mAbs [263]. CIU experiments provide specific unfolding fingerprints that 1482
can be used to distinguish similar conformations, for instance mAb isotypes (IgG1 vs IgG2 vs 1483
IgG3 vs IgG4) with different numbers and/or patterns of disulfide bonding and levels of 1484
glycosylation. CIU experiments have also been reported for site-specific ADC characterization 1485
[259]. Even if different IM drift times were obtained for the ADC and its unconjugated mAb 1486
counterpart, they both exhibited similar intact CCS, which did not allow distinction between a 1487
mass effect or a real conformational change induced upon drug conjugation. CIU experiments 1488
were thus performed on both ADC and its unconjugated mAb version. Different CIU unfolding 1489
patterns were obtained for the unconjugated mAb compared to the site-specific DAR4 ADC, 1490
revealing increased ADC stability towards unfolding as compared with the unconjugated mAb. 1491
Here, CIU experiments allowed circumventing the lack of IM resolution through the 1492
establishment of unfolding patterns. CIU experiments were also used for comparability studies 1493
between biosimilar and originator [261]. Pisupati et al. compared the CIU patterns of the 1494
originator Remicade and its biosimilar version Remsina. Both compounds revealed remarkably 1495
similar patterns. While CIU patterns were globally similar (two unfolded states at nearly 1496
identical voltages for each CIU transition), a marked difference in the variance associated with 1497
the CIU fingerprint for Remsima at low collision voltages was observed. CIU experiments can 1498
thus be used for batch-to-batch comparison or more generally for comparability studies. Due 1499
to its higher reproducibility compared to traditional collision cross section IMS studies, CIU 1500
experiments remain a promising technique for advanced analytical characterization of protein 1501
therapeutics [262]. 1502
Variable Temperature IMS (VT-IM-MS) were also reported to address mAb conformation and 1503
conformational transitions induced upon IM cell temperature variations [264]. In this work, the 1504
thermal stability of three types of intact IgG molecules (with the same antigen binding 1505
specificity) has been probed by variable-temperature IM-MS. In these experiments, mass 1506
spectra and IM plots were acquired, while the temperature of the helium gas in the drift tube 1507

57
was increased (from 300 to 550 K). While the native mass spectra showed no significant 1508
change as the temperature was increased (other than improved desolvation), the DTCCSsHe of 1509
the IgG1 and IgG4 isotypes decreased because of compaction. The maximum collapse 1510
occurred at a higher temperature for IgG1 (400 K) than for IgG4 (360 K), in agreement with 1511
solution-phase studies in which IgG1 was found to be more thermally stable than IgG4. 1512
Differences in the extent of unfolding (an increase and widening of DTCCSHe) among the IgG 1513
subclasses were also observed at high buffer gas temperatures, IgG4 unfolding at a lower 1514
temperature and to a greater extent than IgG1. VT-IM-MS provides insights into mAbs 1515
structural thermodynamics and can be considered as a promising tool for thermal-stability 1516
studies for proteins of therapeutic interest. 1517
1518
In conclusion, IMS is an interesting methodology for the characterization of intact antibodies 1519
and related formats (bispecific, ADCs) and may be useful to routinely fingerprint higher order 1520
structures. 1521
Reproducibility of IMS measurements and mobilograms, as well as the suitability of IMS to 1522
differentiate between and/or characterize different monoclonal antibody drug products has 1523
been evaluated by the FDA [262], evidencing that the use of summed charge state datasets 1524
and the analysis of metrics beyond drift time should be preferred for a more comprehensive 1525
comparative study between different monoclonal antibody drug products. Also the added value 1526
of CIU experiments, that have proved to be more reproducible than classical IMS 1527
measurements (IM drift times and CCS), offers new possibilities for mAb-related compound 1528
conformational characterization. IMS measurements can finally be extended to investigate 1529
conformational changes induced upon antigen binding to individual mAb isoforms in order to 1530
gain more structural insights. 1531
1532
7.7. Oligonucleotides 1533
IM-MS applied to oligonucleotides has been mainly used to gain conformational insights of 1534
such highly polymorphic macromolecule. Indeed, besides the classical and widely known 1535
58
double-stranded DNA sequence (duplex), a plethora of other helical structures can be found, 1536
such as hairpin, pseudoknot, triplex, cruciform (Holliday junction) and G-quadruplex structures. 1537
Most of these DNA conformations have been studied by IM-MS and molecular dynamics, 1538
highlighting a more dynamic and complex behaviour in the gas-phase as compared to proteins 1539
[265]. 1540
One of the first research article was published by Clemmer et al. [266]. They reported a 1541
conformational study of an oligonucleotide comprising ten thymine nucleotides (T10). The 1542
authors highlighted that the gas-phase conformations observed by IM-MS were strongly 1543
dependent of the charge states: lower charge states corresponded to globular conformers 1544
(lower CCS) and higher charge states to elongated forms (higher CCS). Moreover, by 1545
comparing the experimental CCS (ΩEXP) with calculated CCS (ΩTHE) of conformers generated 1546
by modelling technique (by using one of the first parametrisation of EHSS model), [48] a strong 1547
dependency was found between the gas-phase conformations and the number and especially 1548
the locations of charged sites. It should be noted that charge states observed by IM-MS reflect 1549
the extension of the neutralization of the ionizable groups. Whereas in proteins, the ionizable 1550
groups are represented by the N- and C-terminal residues plus the basic and acidic side 1551
chains, in nucleic acids they are represented by the phosphodiester linkages that are all 1552
potentially and equally ionizable. In the case of T10, neutralization could occur along the nine 1553
phosphate groups with a number of combination equal to 9!/[n!(9-n)!], thus several protomers 1554
could arise for each unique charge state. Authors calculated theoretical CCS (ΩTHE) for several 1555
different charge site assignments and they found that conformers having the same charge 1556
state (−5) showed a compact conformation (ΩTHE = 501 ± 19 Å) when having close located 1557
charges, and a most open conformation (ΩTHE = 608 ± 21 Å) when charges were more evenly 1558
distributed throughout the oligomer. Open conformation was found to match better with the 1559
experimental values (ΩEXP = 627 ± 6 Å) and thus it was accordingly assigned [266]. Although 1560
the authors themselves questioned the absolute accuracy of the calculations, the concepts 1561
highlighted on number and locations of charged sites affecting the conformers shape were 1562

59
fundamental to understand how different from solution nucleic acids might behave in the gas-1563
phase. 1564
Duplex stability and its behaviour in gas-phase has also been investigated by IM-MS and 1565
molecular modelling; initial contributions in this direction came from Bowers group [267–269]. 1566
First studies involving d(CG)n∙d(CG)n duplexes [267] demonstrated that a globular form is the 1567
dominant conformer for up to 8-mer length oligomer, whereas for longer duplexes only the 1568
helical structure was observed, keeping quite good memory of the solution structure. Then, the 1569
effect of the oligomer sequence composition on the overall conformation of the duplex was 1570
investigated by studying a series of 14-mer duplexes containing both C∙G and A∙T pairs in 1571
different sequences [268,269]. It turns out that the A∙T pairs were preferentially broken over 1572
C∙G pairs and they appear more easily disrupted when placed at the ends of the duplex, while 1573
forming bubble if placed at the middle of the sequence. Therefore, overall results showed that 1574
duplex helicity was usually maintained in the gas-phase on the ms timescale but the structures 1575
stability was dependent of the length of the oligomer, its bases composition and its sequence 1576
order. However, as highlighted in [270], the structural comparison between the duplex native 1577
forms in solution and the conformations assumed in the gas-phase remained questionable, 1578
since the experiments were performed in non-native solution conditions. Indeed, a more recent 1579
contribution on duplex nucleic acids behaviour in the gas-phase upon native electrospray mass 1580
spectrometry came from the Orozco and Gabelica groups [270]. A compelling study on short 1581
(12-bp) and long (36-bp) DNA and RNA duplexes was performed by ESI-DTIM-MS, and a 1582
significant compaction of the duplex nucleic acids was observed for ions sprayed from native 1583
solution conditions. ΩTHE of the structures adopted in solution were obtained upon MD 1584
simulation carried out in water and then compared to ΩEXP (DTCCSHe) that were found 1585
significantly lower than the predicted values. To investigate the behaviour of the duplexes in 1586
the gas-phase, an extensive molecular modelling study was performed, including DFT and 1587
semi-empirical calculations for small helices and short duplexes plus MD simulations for long 1588
duplexes. Finally, authors were able to demonstrate that the compaction experimentally 1589
observed by ESI-IM-MS was related to the self-solvation of the phosphates groups occurring 1590

60
through new phosphate-phosphate interactions that undermine the Coulomb-driven expansion 1591
of the duplexes. These metastable conformations arose in part during the desolvation process 1592
and rearranged by self-solvation while in the gas-phase, thus resulting significantly compacted 1593
compared to the starting structures [270]. Similarly, Devine et al. described the gas-phase 1594
compaction of two 35-mer RNAs having similar mass, but different sequences and secondary 1595
structures [192]. Reference ΩTHE values of the two 35-mer RNAs were obtained from an NMR 1596
and a crystal structure, respectively. Nevertheless, ESI-TWIMS-MS of the RNAs yielded to 1597
identical ΩEXP (TWCCSN2) that were significantly lower than the predicted values, hence 1598
accounting for a severe compaction of the RNAs in the gas-phase. However, beyond 1599
mentioning the collapse of the RNAs, authors did not investigate further on the RNA behaviour 1600
in the gas-phase by molecular modelling studies. 1601
A quite different gas-phase behaviour was observed for higher-ordered oligonucleotide 1602
structures, namely triplex and G-quadruplex structures. In [271] ΩTHE obtained upon an 1603
extensive (90 µs) MD simulation were compared with ΩEXP (DTCCSHe) obtained by ESI-DTIM-1604
MS experiments, to validate the theoretical data and assess the stability and the structure of a 1605
triplex in the gas-phase A very good agreement was found between theoretical and 1606
experimentally derived CCS. A 12-mer and 18-mer triplexes were used for the study and the 1607
overall results suggested that the gas-phase structures maintained an excellent memory of the 1608
solution structures, together with a well-preserved helicity, even though a significant number 1609
of structural alterations were observed. Indeed, a sligh compaction of the triplex (in respect to 1610
the solution structure) was observed for the most abundant charge states, but no triplex 1611
disruption was observed in any case. 1612
Even a higher DNA structure stability in the gas-phase was observed for the G-quadruplex 1613
structures that were monitored by both ESI-IM-MS and molecular modelling [272–275]. G-1614
quadruplexes are characterised by the formation of G-tetrads (four planar guanines held 1615
together by Hoogsteen hydrogen bonds) that stack on top of each other to form rigid and well 1616
organised structures, thanks also to the presence of cations placed in-between the G-tetrads 1617
that further stabilise the structure. These particular DNA conformations can be formed, starting 1618

61
from G-rich oligonucleotides, they can be intra-, bi-, or tetra-molecular, and they are related to 1619
cellular ageing and transformations. Evidences of G-quadruplex structure preservation in the 1620
gas-phase were reported by several groups [276,277] and mainly related to the preservation 1621
of the inner cations in-between the G-tetrads [278]. Moreover, MD simulation (0.5 – 1 µs) 1622
studies validated this preservation and proved the ability of the G-quadruplexes to keep an 1623
excellent memory of their solution structure [279], with a general excellent agreement between 1624
theoretical and experimentally derived CCS [39,268,272]. Then, the stability of G-1625
quadruplexes in the gas-phase was furthermore validated after testing a series of potential 1626
ligands that were found to form stable complexes maintained also upon transfer in the gas-1627
phase [280]. 1628
1629
8. The future of ion mobility spectrometry 1630
8.1. Some potential solutions to improve ion mobility resolution 1631
One of the major constraints of IMS is the limited resolution of commercial instruments. This 1632
low separation power obviously limits the applicability of IMS, as it remains difficult to 1633
differentiate structurally related compounds (species having mobilities differences of less than 1634
1-2% are hardly distinguishable today [215]). Besides resolving isobaric compounds, a higher 1635
resolving power could also contribute to increasing the dynamic range of the measurements 1636
[8]. 1637
To circumvent this limitation, there are many IMS prototypes that have been proposed by 1638
academic laboratories and providers of MS instrumentation, which are well described in the 1639
recent review of McLean and May [9]. However, it is important to keep in mind that achieving 1640
higher resolution comes at the expense of mobility range and/or sensitivity reduction. In this 1641
section, only the technical solutions that have the potential to be transformed into commercial 1642
products, at least from our point of view, will be described. Indeed, we have to keep in mind 1643
that the speed of translating IM-MS prototypes into commercial instruments in the last 5 years 1644
has increased dramatically. 1645
62
As described in the first sections of this review, the DTIMS resolution is directly proportional to 1646
the square root of drift tube length and applied electric field. Therefore, there have been a lot 1647
of attempts to increase these parameters in DTIMS. However, when increasing drift tube 1648
length, the transmission may be drastically reduced (ion losses), or only a very narrow mobility 1649
range could be investigated, thus limiting the molecular coverage. In addition, a drift tube length 1650
of several meters, as described by Kemper [281] may be impractical for common laboratory 1651
space and requires very high voltages. To avoid the use of high voltages, the TWIMS 1652
technology was found to be more adapted in combination with long IMS cell. Recently, the 1653
group of Smith et al. have constructed a 13 m long serpentine TWIMS drift path, including 44 1654
“U” turns to limit the required laboratory space [73]. In addition, the 13 m tube was included in 1655
a structure for lossless ion transmission (SLIM), to assist in ion transmission and manipulation, 1656
thus enabling a very limited loss in sensitivity. They demonstrated a baseline resolution for two 1657
isomeric sugars and also employed this new device for resolving peptides of an albumin tryptic 1658
digest. According to the authors, the resolution was increased by a factor of 9, in comparison 1659
with commercial DTIMS instrument having a tube length of 80 cm. 1660
Another promising strategy to improve the current resolving power of IMS may be the use of a 1661
cyclic TWIMS design to limit laboratory space. Using this approach, very high resolution can 1662
be achieved after an important number of cycles (up to 12) on a circular TWIMS drift tube of 1663
around 1 meter [9]. One of the major limitations of the circular drift tube geometry may be 1664
related to the fact that the ions of high mobility of the next cycle can lap over the ions of low 1665
mobility from the previous cycle. Since the TWIMS operates in a time dispersive manner, this 1666
point is less critical, but one of the main limitations of this design remains that the measurable 1667
mobility range decreases with every cycle needed to improve the resolution. 1668
Another strategy to improve IMS resolution is to modify the gas nature since the latter could 1669
strongly impact the separation power in FAIMS. In particular, Shvartsburg and co-workers have 1670
improved FAIMS measurements by using non-traditional buffer gases (mixtures of He/ N2 or 1671
H2/N2). They showed that when helium rich-gases and elevated electric fields were used, the 1672
resolution was significantly increased, allowing the separation of previously unresolved 1673

63
conformers of a proteolytic digest [282,283]. To avoid the electrical breakdown which is 1674
inevitable when a high proportion of He is used, mixtures of N2 and up to 90% H2 were also 1675
successfully employed [284]. Some other authors have also demonstrated that drift gas with 1676
high polarizability (carbon dioxide or argon) allow achieving better resolution and peak capacity 1677
in DTIMS and TWIMS, due to the extended interactions that take place [81,285]. As example, 1678
Eberlin et al. show a separation of disaccharide isomers in TWIMS with carbon dioxide, while 1679
it was not possible with nitrogen [286]. 1680
1681
8.2. Improving orthogonality between ion mobility and mass spectrometry 1682
Besides its limited resolving power, another important constraint of IMS is the lack of 1683
orthogonality with MS, since the shape of molecules in a gas phase (IMS separation criteria) 1684
is strongly correlated to its mass (MS separation criteria). In this sense, FAIMS offers a better 1685
orthogonality to MS, due to a different operation principle, in comparison with DTIMS, TWIMS 1686
and TIMS. Some authors have clearly demonstrated that the gas nature in IMS could also 1687
impact selectivity, in addition to the improvement of resolving power discussed in section 5.1. 1688
The most remarkable example to date has been reported by Hill et al. who demonstrated the 1689
separation of enantiomers in DTIMS, by doping the drift gas with a chiral selector (2-butanol) 1690
[287]. Some other research groups have also tested different drift gases (i.e. nitrogen, helium, 1691
argon, methane) in DTIMS for separating peptides from a tryptic digest, but they showed that 1692
selectivity was less affected by the gas nature, when the ions belong to the same biomolecular 1693
class [288]. 1694
In FAIMS, the selectivity could be drastically modified when adding different polar modifiers 1695
(alcohols, acetonitrile, acetone…) to the drift gas (nitrogen) [289,290]. This was well illustrated 1696
by Varesio et al. who considered a mixture of eight pharmaceutical compounds having all a 1697
mass of 316 Da, as a case study. As illustrated in Figure 13, with pure nitrogen as transport 1698
gas, the resolving power for the eight compounds with the same nominal mass was close to 1699
zero and the eight analytes experienced a relatively similar differential mobility in the 10 V 1700
compensation voltage window [291]. When adding only 1.5% organic modifier, the separation 1701

64
was drastically improved, particularly with isopropanol. The separation enhancement was 1702
probably due to the formation of transient clusters between the analytes of interest and the 1703
polar modifier molecules. In this example, the overall IMS separation was quite good, despite 1704
the fact that the drugs possess the same masses, because their chemical properties were 1705
different as well as their interactions with the modifiers. In another study [292], 30 drugs of 1706
abuse were investigated in FAIMS using various modifiers (i.e. acetone, acetonitrile and 1707
methanol) in the drift gas. The best IMS separation was achieved with 1.5% methanol, but this 1708
example also demonstrates the limited resolving power of FAIMS (the maximum peak capacity 1709
was less than 20). Despite the poor peak capacity, some isomeric metabolites such as 1710
hydroxylated or desmethylated ones were partially resolved, and glucuronide metabolites were 1711
differentiated from the parent drug, preventing the overestimation of the latter in case of in-1712
source fragmentation. Finally, Chen et al. have also used FAIMS for the detection and 1713
quantification of nine structurally related amphetamine-type stimulants in urine in presence of 1714
dopants (i.e. MeOH, propanol, butanol, hexanol, heptanol) and various transport gas (i.e. 1715
nitrogen, helium, argon, carbon dioxide) [293]. The authors concluded that the combination of 1716
He and MeOH allows achieving the best sensitivity and selectivity for the investigated mixture 1717
of compounds. 1718
All the above mentioned studies illustrate the potential of using alternative drift gas natures or 1719
adding modifiers to the drift gas in IMS and DMS to tune selectivity. It is also clear that there 1720
are further combinations of gas and additives that could be explored to improve orthogonality 1721
between IMS and MS and some additional studies in this particular field will be helpful to make 1722
progress. However, it is also important to keep in mind that some of the current instruments 1723
on the market are not compatible with a variety of gases and modifiers and can only be used 1724
with pure nitrogen as drift gas (i.e. Waters VION, Bruker TIMS…). 1725
1726
8.3. Combining two-dimensional LC and ion mobility - mass spectrometry (4 1727
dimensional analytical approach) 1728
65
Because the samples to be investigated in the –omic field (i.e. lipidomics, proteomics or 1729
metabolomics), in natural products analysis or in biopharmaceuticals characterization are 1730
extremely complex, there is a need to develop analytical strategies able to separate the highest 1731
number of compounds. On the chromatographic side, comprehensive 2D-LC strategy has 1732
emerged over the last few years, as a promising (but complex) alternative to very high-1733
resolution 1D separation [294–299]. Beyond separation techniques, IMS and HRMS become 1734
ever popular and powerful, particularly for untargeted analysis of complex samples. 1735
To simultaneously take advantage of these chromatographic and mass spectrometric 1736
advances, Stephan et al. [105,151] have recently combined in series 2D-LC and IMS-HRMS, 1737
enabling the characterization of the most complex samples in four dimensions. According to 1738
the authors, there are many constraints when implementing such a complex analytical setup. 1739
In particular, there is a need to improve the software for managing the LC+LC-IMS/MS setup 1740
and above all the data treatment. Nevertheless, they have successfully applied the strategy to 1741
characterize plant extract (Gingko Biloba) and achieved impressive performance, with a peak 1742
capacity of 8,700 for an analysis time of only two hours [105]. In addition, for each peak 1743
observed on the 2D-LC chromatogram, the CCS and m/z values were also available, as 1744
illustrated in Figure 14. Stephan et al. have also applied the same strategy for the analysis of 1745
wastewater [151]. They performed the analysis of wastewater sample in “regular” LC-IMS/MS 1746
and discovered 22 different pollutants using a database containing about 500 drug-like 1747
compounds and pesticides. When using the newly developed LC+LC-IMS/MS strategy, 53 1748
different compounds were identified using the exact mass and CCS values in the database. 1749
In the future, it is expected that this type of approach will be investigated for the 1750
characterization of -omic samples, as the number of detected features could certainly be 1751
strongly enhanced when using these multiple separation dimensions. Another application 1752
could be the analytical characterization of biopharmaceuticals, including monoclonal 1753
antibodies, antibody-drug conjugates, and bispecific antibodies. The addition of IMS to the 1754
more commonly used 2D-LC-MS setup would be of particular interest because it could help to 1755
differentiate isobaric compounds that are not chromatographically separated [298]. Recently, 1756

66
an innovative multidimensional analytical approach combining comprehensive on-line two 1757
dimensional chromatography that consists of hydrophobic interaction chromatography (HIC) 1758
and size exclusion chromatography (SEC) to ion mobility and mass spectrometry (IM-MS) was 1759
applied for performing analytical characterization of ADCs under non-denaturing conditions. 1760
This promising approach allows obtaining in-depth and detailed information on ADC samples 1761
that cannot be reached from HIC-UV or non-denaturing mass spectrometry alone. The all-in-1762
one analytical strategy described here permits a deep, straightforward and rapid 1763
characterization of complex ADC samples [300]. 1764
1765
8.4. Improvement of data interpretation workflows and software 1766
As underlined in the previous sections, there are currently a number of new IM-MS techniques 1767
and technologies under development with the aim of further improving the performance in 1768
terms of resolution, sensitivity and orthogonality between IMS and MS. However, one of the 1769
remaining limitations of IM-MS instrument is often represented by the software, which requires 1770
intensive development for improving speed and user-friendliness, especially when technical 1771
possibilities continue to grow. 1772
Indeed, when performing LC-IM-MS experiments, the data are extremely complex as they are 1773
acquired on many different dimensions (i.e. retention times in LC; drift times in IMS; exact 1774
mass, MS/MS spectra and signal intensity in MS). Not all softwares are well developed for 4-1775
dimensional (retention time, drift time, m/z, abundance) alignment of molecular features 1776
(entities) across different samples. This means that doing high-quality statistical interpretation 1777
during non-targeted (discovery) analysis can be extremely challenging or even impossible 1778
without innovation using open-source tools. 1779
In addition, files processing of large data sets may be critical. In particular, peak picking 1780
(feature finding) can be very slow and algorithms optimization is still a topic of prime interest. 1781
In this regard, Vivo-Truyols and co-workers reported the Bayesian approach for features 1782
finding in GC-HRMS [301] or GCxGC-FID [302], that could be envisaged for application in LC-1783
IM-MS data treatment in the future in order to improve the peak picking process throughput. 1784

67
For processing MS/MS data alongside IMS information (e.g. LC-IMS-QqTOF/MS), some 1785
solutions are proposed by the IM-MS instruments providers. For example, Waters proposes 1786
the MSE approach, which records data without discrimination or preselection, while Agilent 1787
uses an approach called "alternating frames", where two MS analyses (high energy and low 1788
energy) can be obtained within a single acquisition in order to associate MS/MS and MS 1789
spectra via drift time alignment. Such approaches can be already implemented into analytical 1790
methods, but software-based extraction of all the information together is awaiting for further 1791
developments and it will also require careful validation for non-targeted workflows. 1792
Another important area of software development regards the data deconvolution strategies, 1793
which allows the extraction of additional information from partially resolved ion mobility data, 1794
taking into account the orthogonal information obtained from ion fragmentation taking place 1795
after the ion mobility cell. This promising approach can allow the reconstruction of ion mobility 1796
spectra for individual species, especially for the challenging topic of isomer differentiation, as 1797
reported in [66]. 1798
1799
9. Conclusion 1800
This review paper summarizes the current status of IM-MS and main application fields where 1801
the technology has been employed to date. As discussed, the main benefits of IM-MS are the 1802
following: i) Improving the confidence in peak annotation thanks to the use of CCS values in 1803
addition to retention time, exact mass and fragment spectra, ii) Reducing the complexity of 1804
MS/MS spectra, and rapid association of fragments with their monoisotopic precursors by 1805
taking into account the mobility alignment, iii) Increasing the overall resolution of the analysis, 1806
since MS and HRMS are obviously unable to separate isobaric compounds, iv) In-depth 1807
studies of the gas phase conformation of large biomolecules such as proteins and 1808
oligonucleotides and comparison of calculated and experimental CCS values. 1809
Among the applications reported in this contribution, adding an IMS dimension looks 1810
particularly attractive in metabolomics for improving peak annotation confidence. It can also 1811
offer a higher resolving power for a few families of compounds having relatively high flexibility 1812

68
and containing a substantial number of isomers. Among them, lipids and glycans are 1813
particularly well adapted to IMS and have been studied extensively during the last few years. 1814
Finally, due to the inherent complexity of protein biopharmaceuticals and oligonucleotides, 1815
there will certainly be even more interest for IMS in the coming years in order to increase the 1816
amount and quality of information that can be obtained from their analysis. 1817
As illustrated throughout this paper, the field of IMS is very active and instrumental advances 1818
are being regularly published. In this regard, one of the remaining bottlenecks of IMS is its 1819
limited resolution. Therefore, there is a need for longer IMS drift cells, or alternative IMS 1820
designs, as an order of magnitude improvement in resolving power would clearly revolutionize 1821
the field [16]. Another important limitation of the technology is the poor orthogonality between 1822
IMS and MS. To improve this aspect, the addition of dopants (small amount of organic modifier) 1823
to the IMS drift gas appears as a promising strategy, but this solution is unfortunately not 1824
compatible with all IM-MS instruments. Finally, even though the sensitivity achieved in IM-MS 1825
has been drastically improved over the last few years, there could still be some sensitivity loss 1826
when adding an IMS dimension prior to MS. To avoid, or at least limit this issue, Smith et al. 1827
have recently developed some IMS structures with lossless ion manipulations (SLIM), which 1828
seems certain to be implemented in the next IMS generation [303]. 1829
1830
1831
1832
The authors have declared no conflict of interest. 1833
1834

69
10. References 1835
[1] Uetrecht, C., Rose, R. J., van Duijn, E., Lorenzen, K., Heck, A. J. R., Ion mobility mass 1836
spectrometry of proteins and protein assemblies. Chem. Soc. Rev. 2010, 39, 1633–1837
1655. 1838
[2] Lanucara, F., Holman, S. W., Gray, C. J., Eyers, C. E., The power of ion mobility-mass 1839
spectrometry for structural characterization and the study of conformational dynamics. 1840
Nat. Chem. 2014, 6, 281–294. 1841
[3] Paglia, G., Astarita, G., Metabolomics and lipidomics using traveling-wave ion mobility 1842
mass spectrometry. Nat. Protoc. 2017, 12, 797–813. 1843
[4] Lapthorn, C., Pullen, F., Chowdhry, B. Z., Ion mobility spectrometry-mass spectrometry 1844
(IMS-MS) of small molecules: separating and assigning structures to ions. Mass 1845
Spectrom. Rev. 2013, 32, 43–71. 1846
[5] Gray, C. J. J., Thomas, B., Upton, R., Migas, L. G. G., Eyers, C. E. E., Barran, P. E. E., 1847
Flitsch, S. L. L., Applications of ion mobility mass spectrometry for high throughput, high 1848
resolution glycan analysis. Biochim. Biophys. Acta - Gen. Subj. 2016, 1860, 1688–1709. 1849
[6] Szymańska, E., Davies, A. N., Buydens, L. M. C., Chemometrics for ion mobility 1850
spectrometry data: recent advances and future prospects. Analyst 2016, 141, 5689–1851
5708. 1852
[7] Kanu, A. B., Dwivedi, P., Tam, M., Matz, L., Hill, H. H., Ion mobility–mass spectrometry. 1853
J. Mass Spectrom. 2008, 43, 1–22. 1854
[8] Zheng, X., Wojcik, R., Zhang, X., Ibrahim, Y. M., Burnum-Johnson, K. E., Orton, D. J., 1855
Monroe, M. E., Moore, R. J., Smith, R. D., Baker, E. S., Coupling front-end separations, 1856
ion mobility spectrometry, and mass spectrometry for enhanced multidimensional 1857
biological and environmental analyses. Annu. Rev. Anal. Chem. 2017, 10, 71–92. 1858
[9] May, J. C., McLean, J. A., Ion mobility-mass spectrometry: time-dispersive 1859
instrumentation. Anal. Chem. 2015, 87, 1422–1436. 1860
[10] Cohen, M. J., Karasek, F. W., Plasma chromatography - a new dimension for gas 1861
chromatography and mass spectrometry. J. Chromatogr. Sci. 1970, 8, 330–337. 1862

70
[11] May, J. C., Goodwin, C. R., Lareau, N. M., Leaptrot, K. L., Morris, C. B., Kurulugama, 1863
R. T., Mordehai, A., Klein, C., Barry, W., Darland, E., Overney, G., Imatani, K., Stafford, 1864
G. C., Fjeldsted, J. C., McLean, J. A., Conformational ordering of biomolecules in the 1865
gas phase: Nitrogen collision cross sections measured on a prototype high resolution 1866
drift tube ion mobility-mass spectrometer. Anal. Chem. 2014, 86, 2107–2116. 1867
[12] Stow, S. M., Causon, T., Zheng, X., Kurulugama, R. T., Mairinger, T., May, J. C., Rennie, 1868
E. E., Baker, E. S., Smith, R. D., McLean, J. A., Hann, S., Fjeldsted, J. C., An 1869
interlaboratory evaluation of drift tube ion mobility - mass spectrometry collision cross 1870
section measurements. Anal. Chem. 2017, acs.analchem.7b01729. 1871
[13] Doneanu, C. E., Anderson, M., Williams, B. J., Lauber, M. A., Chakraborty, A., Chen, 1872
W., Enhanced detection of low-abundance host cell protein impurities in high-purity 1873
monoclonal antibodies down to 1 ppm using ion mobility mass spectrometry coupled 1874
with multidimensional liquid chromatography. Anal. Chem. 2015, 87, 10283–10291. 1875
[14] Giles, K., Pringle, S. D., Worthington, K. R., Little, D., Wildgoose, J. L., Bateman, R. H., 1876
Applications of a travelling wave-based radio-frequency-only stacked ring ion guide. 1877
Rapid Commun. Mass Spectrom. 2004, 18, 2401–2414. 1878
[15] Pringle, S. D., Giles, K., Wildgoose, J. L., Williams, J. P., Slade, S. E., Thalassinos, K., 1879
Bateman, R. H., Bowers, M. T., Scrivens, J. H., An investigation of the mobility 1880
separation of some peptide and protein ions using a new hybrid quadrupole/travelling 1881
wave IMS/oa-ToF instrument. Int. J. Mass Spectrom. 2007, 261, 1–12. 1882
[16] Ewing, M. A., Glover, M. S., Clemmer, D. E., Hybrid ion mobility and mass spectrometry 1883
as a separation tool. J. Chromatogr. A 2016, 1439, 3–25. 1884
[17] Giles, K., Williams, J. P., Campuzano, I., Enhancements in travelling wave ion mobility 1885
resolution. Rapid Commun. Mass Spectrom. 2011, 25, 1559–1566. 1886
[18] FAIMS/Ion Mobility, https://yost.chem.ufl.edu/research/faims/ (last time accessed: July 1887
25, 2017). 1888
[19] Isenberg, S. L., Armistead, P. M., Glish, G. L., Optimization of peptide separations by 1889
differential ion mobility spectrometry. J. Am. Soc. Mass Spectrom. 2014, 25, 1592–1890
71
1599. 1891
[20] Hernandez, O., Isenberg, S., Steinmetz, V., Glish, G. L., Maitre, P., Probing mobility-1892
selected saccharide isomers: selective ion–molecule reactions and wavelength-specific 1893
IR activation. J. Phys. Chem. A 2015, 119, 6057–6064. 1894
[21] Schneider, B. B., Nazarov, E. G., Londry, F., Vouros, P., Covey, T. R., Differential 1895
mobility spectrometry/mass spectrometry history, theory, design optimization, 1896
simulations, and applications. Mass Spectrom. Rev. 2016, 35, 687–737. 1897
[22] Shvartsburg, A. A., Seim, T. A., Danielson, W. F., Norheim, R., Moore, R. J., Anderson, 1898
G. A., Smith, R. D., High-Definition Differential Ion Mobility Spectrometry with Resolving 1899
Power up to 500. J. Am. Soc. Mass Spectrom. 2013, 24, 109–114. 1900
[23] Xuan, Y., Creese, A. J., Horner, J. A., Cooper, H. J., High-field asymmetric waveform 1901
ion mobility spectrometry (FAIMS) coupled with high-resolution electron transfer 1902
dissociation mass spectrometry for the analysis of isobaric phosphopeptides. Rapid 1903
Commun. Mass Spectrom. 2009, 23, 1963–1969. 1904
[24] SEADM’s planar differential mobility analyzer, 1905
http://www.seadm.com/products/technological-modules/separation/planar-dma-cell/ 1906
(last time accessed: July 25, 2017). 1907
[25] Pomareda, V., Lopez-Vidal, S., Calvo, D., Pardo, A., Marco, S., A novel differential 1908
mobility analyzer as a VOC detector and multivariate techniques for identification and 1909
quantification. Analyst 2013, 138, 3512. 1910
[26] timsTOF, https://www.bruker.com/fileadmin/user_upload/8-PDF-1911
Docs/Separations_MassSpectrometry/Literature/Brochures/1844502_timsTOF_brochu1912
re_05-2016_ebook.pdf (last time accessed: July 25, 2017). 1913
[27] Revercomb, H. E., Mason, E. A., Theory of Plasma Chromatography/Gaseous 1914
Electrophoresis- A Review. Anal. Chem. 1975, 47, 970–983. 1915
[28] Ruotolo, B. T., Benesch, J. L. P., Sandercock, A. M., Hyung, S.-J., Robinson, C. V, Ion 1916
mobility-mass spectrometry analysis of large protein complexes. Nat. Protoc. 2008, 3, 1917
1139–1152. 1918

72
[29] Atmanene, C., Petiot-Bécard, S., Zeyer, D., Van Dorsselaer, A., Vivat Hannah, V., 1919
Sanglier-Cianférani, S., Exploring key parameters to detect subtle ligand-induced 1920
protein conformational changes using traveling wave ion mobility mass spectrometry. 1921
Anal. Chem. 2012, 84, 4703–4710. 1922
[30] Ouyang, H., Larriba-Andaluz, C., Oberreit, D. R., Hogan, C. J., The collision cross 1923
sections of iodide salt cluster ions in air via differential mobility analysis-mass 1924
spectrometry. J. Am. Soc. Mass Spectrom. 2013, 24, 1833–1847. 1925
[31] Bernstein, S. L., Dupuis, N. F., Lazo, N. D., Wyttenbach, T., Condron, M. M., Bitan, G., 1926
Teplow, D. B., Shea, J.-E., Ruotolo, B. T., Robinson, C. V., Bowers, M. T., Amyloid-β 1927
protein oligomerization and the importance of tetramers and dodecamers in the 1928
aetiology of Alzheimer’s disease. Nat. Chem. 2009, 1, 326–331. 1929
[32] Fernandez-Lima, F. A., Wei, H., Gao, Y. Q., Russell, D. H., On the structure elucidation 1930
using ion mobility spectrometry and molecular dynamics. J. Phys. Chem. A 2009, 113, 1931
8221–8234. 1932
[33] Politis, A., Park, A. Y., Hyung, S. J., Barsky, D., Ruotolo, B. T., Robinson, C. V., 1933
Integrating ion mobility mass spectrometry with molecular modelling to determine the 1934
architecture of multiprotein complexes. PLoS One 2010, 5, e12080. 1935
[34] Albrieux, F., Calvo, F., Chirot, F., Vorobyev, A., Tsybin, Y. O., Lepére, V., Antoine, R., 1936
Lemoine, J., Dugourd, P., Conformation of polyalanine and polyglycine dications in the 1937
gas phase: insight from ion mobility spectrometry and replica-exchange molecular 1938
dynamics. J. Phys. Chem. A 2010, 114, 6888–6896. 1939
[35] Jurneczko, E., Barran, P. E., How useful is ion mobility mass spectrometry for structural 1940
biology? The relationship between protein crystal structures and their collision cross 1941
sections in the gas phase. Analyst 2011, 136, 20–28. 1942
[36] Chirot, F., Calvo, F., Albrieux, F., Lemoine, J. J., Tsybin, Y. O., Dugourd, P., Statistical 1943
analysis of ion mobility spectrometry. I. Unbiased and guided replica-exchange 1944
molecular dynamics. J. Am. Soc. Mass Spectrom. 2012, 23, 386–396. 1945
[37] Calvo, F., Chirot, F., Albrieux, F., Lemoine, J. J., Tsybin, Y. O., Pernot, P., Dugourd, P., 1946

73
Statistical analysis of ion mobility spectrometry. II. Adaptively biased methods and 1947
shape correlations. J. Am. Soc. Mass Spectrom. 2012, 23, 1279–1288. 1948
[38] Pacholarz, K. J., Porrini, M., Garlish, R. A., Burnley, R. J., Taylor, R. J., Henry, A. J., 1949
Barran, P. E., Dynamics of intact immunoglobulin-G explored by drift-tube ion-mobility 1950
mass spectrometry and molecular modeling. Angew. Chemie Int. Ed. 2014, 53, 7765–1951
7769. 1952
[39] D’Atri, V., Porrini, M., Rosu, F. F., Gabelica, V. V., Linking molecular models with ion 1953
mobility experiments. Illustration with a rigid nucleic acid structure. J. Mass Spectrom. 1954
2015, 50, 711–726. 1955
[40] Ghassabi Kondalaji, S., Khakinejad, M., Tafreshian, A., J. Valentine, S., Comprehensive 1956
peptide ion structure studies using ion mobility techniques: Part 1. An advanced protocol 1957
for molecular dynamics simulations and collision cross-section calculation. J. Am. Soc. 1958
Mass Spectrom. 2017, 28, 947–959. 1959
[41] Ruotolo, B. T., Giles, K., Campuzano, I., Sandercock, A. M., Bateman, R. H., Robinson, 1960
C. V., Evidence for macromolecular protein rings in the absence of bulk water. Science. 1961
2005, 310, 1658–1661. 1962
[42] Orozco, M., Eisenmesser, A theoretical view of protein dynamics. Chem. Soc. Rev. 1963
2014, 43, 5051–5066. 1964
[43] Mesleh, M. F., Hunter, J. M., Shvartsburg, A. A., Schatz, G. C., Jarrold, M. F., Structural 1965
information from ion mobility measurements: effects of the long-range potential. J. Phys. 1966
Chem. A 1997, 101, 968–968. 1967
[44] Shvartsburg, A. a., Schatz, G. C., Jarrold, M. F., Mobilities of carbon cluster ions: Critical 1968
importance of the molecular attractive potential. J. Chem. Phys. 1998, 108, 2416–2423. 1969
[45] Wyttenbach, T., Helden, G., Batka, J. J., Carlat, D., Bowers, M. T., Effect of the long-1970
range potential on ion mobility measurements. J. Am. Soc. Mass Spectrom. 1997, 8, 1971
275–282. 1972
[46] Mack, E., Average cross-sectional areas of molecules by gaseous diffusion methods. J. 1973
Am. Chem. Soc. 1925, 47, 2468–2482. 1974

74
[47] The Martin Jarrold Research Group, http://www.indiana.edu/~nano/software/ (accessed 1975
on May 10, 2017) (last time accessed: July 25, 2017). 1976
[48] Shvartsburg, A. A., Jarrold, M. F., An exact hard-spheres scattering model for the 1977
mobilities of polyatomic ions. Chem. Phys. Lett. 1996, 261, 86–91. 1978
[49] Marklund, E. G., Degiacomi, M. T., Robinson, C. V., Baldwin, A. J., Benesch, J. L. P., 1979
Collision cross sections for structural proteomics. Structure 2015, 23, 791–799. 1980
[50] Campuzano, I., Bush, M. F., Robinson, C. V., Beaumont, C., Richardson, K., Kim, H., 1981
Kim, H. I., Structural characterization of drug-like compounds by ion mobility mass 1982
spectrometry: Comparison of theoretical and experimentally derived nitrogen collision 1983
cross sections. Anal. Chem. 2012, 84, 1026–1033. 1984
[51] Siu, C. K., Guo, Y., Saminathan, I. S., Hopkinson, A. C., Siu, K. W. M., Optimization of 1985
parameters used in algorithms of ion-mobility calculation for conformational analyses. 1986
J. Phys. Chem. B 2010, 114, 1204–1212. 1987
[52] Shvartsburg, A. A., Mashkevich, S. V., Baker, E. S., Smith, R. D., Optimization of 1988
algorithms for ion mobility calculations. J. Phys. Chem. A 2007, 111, 2002–2010. 1989
[53] Kim, H., Kim, H. I., Johnson, P. V., Beegle, L. W., Beauchamp, J. L., Goddard, W. A., 1990
Kanik, I., Experimental and theoretical investigation into the correlation between mass 1991
and ion mobility for choline and other ammonium cations in N2. Anal. Chem. 2008, 80, 1992
1928–1936. 1993
[54] Kim, H. I., Kim, H., Pang, E. S., Ryu, E. K., Beegle, L. W., Loo, J. A., Goddard, W. A., 1994
Kanik, I., Structural characterization of unsaturated phosphatidylcholines using traveling 1995
wave ion mobility spectrometry. Anal. Chem. 2009, 81, 8289–8297. 1996
[55] Bleiholder, C., Wyttenbach, T., Bowers, M. T., A novel projection approximation 1997
algorithm for the fast and accurate computation of molecular collision cross sections (I). 1998
Method. Int. J. Mass Spectrom. 2011, 308, 1–10. 1999
[56] Bleiholder, C., Contreras, S., Do, T. D., Bowers, M. T., A novel projection approximation 2000
algorithm for the fast and accurate computation of molecular collision cross sections (II). 2001
Model parameterization and definition of empirical shape factors for proteins. Int. J. 2002

75
Mass Spectrom. 2013, 345–347, 89–96. 2003
[57] Bleiholder, C., Contreras, S., Bowers, M. T., A novel projection approximation algorithm 2004
for the fast and accurate computation of molecular collision cross sections (IV). 2005
Application to polypeptides. Int. J. Mass Spectrom. 2013, 354–355, 275–280. 2006
[58] Bleiholder, C., A local collision probability approximation for predicting momentum 2007
transfer cross sections. Analyst 2015, 140, 6804–6813. 2008
[59] Larriba-Andaluz, C., Fernandez-Garcia, J., Ewing, M. A., Hogan, C. J., Clemmer, D. E., 2009
Gas molecule scattering & ion mobility measurements for organic macro-ions in He 2010
versus N2 environments. Phys. Chem. Chem. Phys. 2015, 17, 15019–15029. 2011
[60] Ewing, S. A., Donor, M. T., Wilson, J. W., Prell, J. S., Collidoscope: an improved tool for 2012
computing collisional cross-sections with the trajectory method. J. Am. Soc. Mass 2013
Spectrom. 2017, 587–596. 2014
[61] Asbury, G. R., Hill, H. H., Evaluation of ultrahigh resolution ion mobility spectrometry as 2015
an analytical separation device in chromatographic terms. J. Microcolumn Sep. 2000, 2016
12, 172–178. 2017
[62] Spangler, G. E., Collins, C. I., Peak shape analysis and plate theory for plasma 2018
chromatography. Anal. Chem. 1975, 47, 403–407. 2019
[63] Rokushika, S., Hatano, H., Baim, M. A., Hill, H. H., Resolution measurement for ion 2020
mobility spectrometry. Anal. Chem. 1985, 57, 1902–1907. 2021
[64] Kanu, A. B., Gribb, M. M., Hill, H. H., Predicting optimal resolving power for ambient 2022
pressure ion mobility spectrometry. Anal. Chem. 2008, 80, 6610–6619. 2023
[65] Siems, W. F., Wu, C., Tarver, E. E., Hill, H. H. J., Larsen, P. R., McMinn, D. G., 2024
Measuring the resolving power of ion mobility spectrometers. Anal. Chem. 1994, 66, 2025
4195–4201. 2026
[66] May, J. C., Dodds, J. N., Kurulugama, R. T., Stafford, G. C., Fjeldsted, J. C., McLean, 2027
J. A., Broadscale resolving power performance of a high precision uniform field ion 2028
mobility-mass spectrometer. Analyst 2015, 140, 6824–6833. 2029
[67] Shvartsburg, A. A. A., Smith, R. R. D., Fundamentals of Traveling Wave Ion Mobility 2030

76
Spectrometry. Anal. Chem. 2008, 80, 9689–9699. 2031
[68] Zhong, Y., Hyung, S.-J., Ruotolo, B. T., Characterizing the resolution and accuracy of a 2032
second-generation traveling-wave ion mobility separator for biomolecular ions. Analyst 2033
2011, 136, 3534. 2034
[69] Hernandez, D. R., DeBord, J. D., Ridgeway, M. E., Kaplan, D. A., Park, M. A., 2035
Fernandez-Lima, F., Ion dynamics in a trapped ion mobility spectrometer. Analyst 2014, 2036
139, 1913–1921. 2037
[70] Michelmann, K., Silveira, J. A., Ridgeway, M. E., Park, M. A., Fundamentals of trapped 2038
ion mobility spectrometry. J. Am. Soc. Mass Spectrom. 2015, 26, 14–24. 2039
[71] Silveira, J. A., Michelmann, K., Ridgeway, M. E., Park, M. A., Fundamentals of trapped 2040
ion mobility spectrometry part II: fluid dynamics. J. Am. Soc. Mass Spectrom. 2016, 27, 2041
585–595. 2042
[72] Dwivedi, P., Bendiak, B., Clowers, B. H., Hill, H. H., Rapid resolution of carbohydrate 2043
isomers by electrospray ionization ambient pressure ion mobility spectrometry-time-of-2044
flight mass spectrometry (ESI-APIMS-TOFMS). J. Am. Soc. Mass Spectrom. 2007, 18, 2045
1163–1175. 2046
[73] Deng, L., Ibrahim, Y. M., Hamid, A. M., Garimella, S. V. B., Webb, I. K., Zheng, X., Prost, 2047
S. A., Sandoval, J. A., Norheim, R. V., Anderson, G. A., Tolmachev, A. V., Baker, E. S., 2048
Smith, R. D., Ultra-high resolution ion mobility separations utilizing traveling waves in a 2049
13 m serpentine path length structures for lossless ion manipulations module. Anal. 2050
Chem. 2016, 88, 8957–8964. 2051
[74] Silveira, J. A., Danielson, W., Ridgeway, M. E., Park, M. A., Altering the mobility-time 2052
continuum: nonlinear scan functions for targeted high resolution trapped ion mobility-2053
mass spectrometry. Int. J. Ion Mobil. Spectrom. 2016, 19, 87–94. 2054
[75] Flagan, R. C., On Differential Mobility Analyzer Resolution. Aerosol Sci. Technol. 1999, 2055
30, 556–570. 2056
[76] Rus, J., Moro, D., Sillero, J. A., Royuela, J., Casado, A., Estevez-Molinero, F., 2057
Fernández de la Mora, J., IMS–MS studies based on coupling a differential mobility 2058

77
analyzer (DMA) to commercial API–MS systems. Int. J. Mass Spectrom. 2010, 298, 30–2059
40. 2060
[77] Shvartsburg, A. A., Tang, K., Smith, R. D., Modeling the resolution and sensitivity of 2061
FAIMS analyses. J. Am. Soc. Mass Spectrom. 2004, 15, 1487–1498. 2062
[78] Santiago, B. G., Harris, R. a, Isenberg, S. L., Glish, G. L., Resolving powers of >7900 2063
using linked scans: how well does resolving power describe the separation capability of 2064
differential ion mobility spectrometry. Analyst 2015, 140, 6871–6878. 2065
[79] Tang, F., Xu, C., Wang, X., Resolution enhancement of field asymmetric waveform ion 2066
mobility spectrometry (FAIMS) by ion focusing. Chem. Cent. J. 2013, 7, 120. 2067
[80] Ruotolo, B. T., Gillig, K. J., Stone, E. G., Russell, D. H., Peak capacity of ion mobility 2068
mass spectrometry: J. Chromatogr. B 2002, 782, 385–392. 2069
[81] Ruotolo, B. T., McLean, J. A., Gillig, K. J., Russell, D. H., Peak capacity of ion mobility 2070
mass spectrometry: the utility of varying drift gas polarizability for the separation of 2071
tryptic peptides. J. Mass Spectrom. 2004, 39, 361–367. 2072
[82] Causon, T. J., Hann, S., Theoretical evaluation of peak capacity improvements by use 2073
of liquid chromatography combined with drift tube ion mobility-mass spectrometry. J. 2074
Chromatogr. A 2015, 1416, 47–56. 2075
[83] Neue, U. D., Peak capacity in unidimensional chromatography. J. Chromatogr. A 2008, 2076
1184, 107–130. 2077
[84] Karasek, F. W., Final Report. University of Waterloo Research Institute; Waterloo, 2078
Ontario, Canada: 1980. Study of technology relating to plasma chromatography sensing 2079
tubes. 2080
[85] Dodds, J. N., May, J. C., McLean, J. A., Investigation of the complete suite of the leucine 2081
and isoleucine isomers: toward prediction of ion mobility separation capabilities. Anal. 2082
Chem. 2017, 89, 952–959. 2083
[86] Mccullagh, M., Goscinny, S., Hanot, V., Roberts, D., Neeson, K., Goshawk, J., Eatough, 2084
D., Stead, S., Rao, R., Discovery of pesticide protomers ssing routine ion mobility 2085
screening. Waters Appl. Note 2014, 720005028E, 1–7. 2086

78
[87] Campbell, J. L., Le Blanc, J. C. Y., Schneider, B. B., Probing electrospray ionization 2087
dynamics using differential mobility spectrometry: the curious case of 4-aminobenzoic 2088
acid. Anal. Chem. 2012, 84, 7857–7864. 2089
[88] Tian, Z., Kass, S. R., Gas-phase versus liquid-phase structures by electrospray 2090
ionization mass spectrometry. Angew. Chemie - Int. Ed. 2009, 48, 1321–1323. 2091
[89] Warnke, S., Seo, J., Boschmans, J., Sobott, F., Scrivens, J. H., Bleiholder, C., Bowers, 2092
M. T., Gewinner, S., Schöllkopf, W., Pagel, K., von Helden, G., Protomers of 2093
benzocaine: solvent and permittivity dependence. J. Am. Chem. Soc. 2015, 137, 4236–2094
4242. 2095
[90] McCullagh, M., Stead, S., Williams, J., Keizer, W. de, Bergwerff, A., Identification of 2096
multiple sites of intra-molecular protonation and different fragmentation patterns within 2097
the fluoroquinolone class of antibiotics in porcine muscle extracts using travelling wave 2098
ion mobility mass spectrometry. Waters Appl. Note No. 720004720en 2013, 2099
720004720e, 1–11. 2100
[91] Lalli, P. M., Iglesias, B. A., Toma, H. E., Sa, G. F. De, Daroda, R. J., Filho, C. S., 2101
Szulejko, J. E., Eberlin, M. N., Protomers : formation , separation and characterization 2102
via travelling wave ion mobility mass spectrometry. 2012, 712–719. 2103
[92] Fiehn, O., Metabolomics – the link between genotypes and phenotypes. Plant Mol. Biol. 2104
2002, 48, 155–171. 2105
[93] Wolfender, J.-L., Marti, G., Thomas, A., Bertrand, S., Current approaches and 2106
challenges for the metabolite profiling of complex natural extracts. J. Chromatogr. A 2107
2015, 1382, 136–164. 2108
[94] Cajka, T., Fiehn, O., Toward merging untargeted and targeted methods in mass 2109
spectrometry-based metabolomics and lipidomics. Anal. Chem. 2016, 88, 524–545. 2110
[95] Ortmayr, K., Causon, T. J., Hann, S., Koellensperger, G., Increasing selectivity and 2111
coverage in LC-MS based metabolome analysis. TrAC Trends Anal. Chem. 2016, 82, 2112
358–366. 2113
[96] Dwivedi, P., Schultz, A. J., Metabolic profiling of human blood by high-resolution ion 2114

79
mobility mass spectrometry (IM-MS). Int. J. Mass Spectrom. 2010, 298, 78–90. 2115
[97] Harry, E. L., Weston, D. J., Bristow, A. W. T., Wilson, I. D., Creaser, C. S., An approach 2116
to enhancing coverage of the urinary metabonome using liquid chromatography–ion 2117
mobility–mass spectrometry. J. Chromatogr. B 2008, 871, 357–361. 2118
[98] Paglia, G., Williams, J. P., Menikarachchi, L., Thompson, J. W., Tyldesley-Worster, R., 2119
Halldórsson, S., Rolfsson, O., Moseley, A., Grant, D., Langridge, J., Palsson, B. O., 2120
Astarita, G., Ion mobility derived collision cross sections to support metabolomics 2121
applications. Anal. Chem. 2014, 86, 3985–3993. 2122
[99] Rainville, P. D., Wilson, I. D., Nicholson, J. K., Issacs, G., Mullin, L., Langridge, J. I., 2123
Plumb, R. S., Ion mobility spectrometry combined with ultra performance liquid 2124
chromatography/mass spectrometry for metabolic phenotyping of urine: Effects of 2125
column length, gradient duration and ion mobility spectrometry on metabolite detection. 2126
Anal. Chim. Acta 2017, 982, 1–8. 2127
[100] Zhang, X., Kew, K., Reisdorph, R., Sartain, M., Powell, R., Armstrong, M., Quinn, K., 2128
Cruickshank-Quinn, C., Walmsley, S., Bokatzian, S., Darland, E., Rain, M., Imatani, K., 2129
Reisdorph, N., Performance of a high-pressure liquid chromatography-ion mobility-2130
mass spectrometry system for metabolic profiling. Anal. Chem. 2017, 89, 6384–6391. 2131
[101] Burnum-Johnson, K. E., Baker, E. S., Metz, T. O., Characterizing the lipid and 2132
metabolite changes associated with placental function and pregnancy complications 2133
using ion mobility spectrometry-mass spectrometry and mass spectrometry imaging. 2134
Placenta 2017, DOI: 10.1016/j.placenta.2017.03.016. 2135
[102] Tebani, A., Schmitz-Afonso, I., Rutledge, D. N., Gonzalez, B. J., Bekri, S., Afonso, C., 2136
Optimization of a liquid chromatography ion mobility-mass spectrometry method for 2137
untargeted metabolomics using experimental design and multivariate data analysis. 2138
Anal. Chim. Acta 2016, 913, 55–62. 2139
[103] Arthur, K. L., Turner, M. A., Reynolds, J. C., Creaser, C. S., Increasing peak capacity in 2140
non-targeted omics applications by combining full scan field asymmetric waveform ion 2141
mobility spectrometry with liquid chromatography–mass spectrometry. Anal. Chem. 2142

80
2017, 89, 3452–3459. 2143
[104] Causon, T. J., Došen, M., Reznicek, G., Hann, S., Workflow Development for the 2144
analysis of phenolic compounds in wine using liquid chromatography combined with 2145
drift-tube ion mobility–mass spectrometry. LCGC North Am. 2016, 34, 854–867. 2146
[105] Stephan, S., Jakob, C., Hippler, J., Schmitz, O. J., A novel four-dimensional analytical 2147
approach for analysis of complex samples. Anal. Bioanal. Chem. 2016, 408, 3751–2148
3759. 2149
[106] Liu, W., Zhang, X., Knochenmuss, R., Siems, W. F., Hill, H. H., Multidimensional 2150
separation of natural products using liquid chromatography coupled to hadamard 2151
transform ion mobility mass spectrometry. J. Am. Soc. Mass Spectrom. 2016, 27, 810–2152
821. 2153
[107] Xiao, X., Miller, L. L., Bernstein, R., Hochrein, J. M., Thermal degradation of β-carotene 2154
studied by ion mobility atmospheric solid analysis probe mass spectrometry: full product 2155
pattern and selective ionization enhancement. J. Mass Spectrom. 2016, 51, 309–318. 2156
[108] Covington, B. C., McLean, J. A., Bachmann, B. O., Comparative mass spectrometry-2157
based metabolomics strategies for the investigation of microbial secondary metabolites. 2158
Nat. Prod. Rep. 2017, 34, 6–24. 2159
[109] Kylli, P., Hankemeier, T., Kostiainen, R., Feasibility of ultra-performance liquid 2160
chromatography–ion mobility–time-of-flight mass spectrometry in analyzing oxysterols. 2161
J. Chromatogr. A 2017, 1487, 147–152. 2162
[110] Chouinard, C. D., Wei, M. S., Beekman, C. R., Kemperman, R. H. J., Yost, R. A., Ion 2163
mobility in clinical analysis: current progress and future perspectives. Clin. Chem. 2016, 2164
62, 124–133. 2165
[111] Cohen, A., Ross, N. W., Smith, P. M., Fawcett, J. P., Analysis of 17β-estradiol, estriol 2166
and estrone in American eel ( Anguilla rostrata ) tissue samples using liquid 2167
chromatography coupled to electrospray differential ion mobility tandem mass 2168
spectrometry. Rapid Commun. Mass Spectrom. 2017, 31, 842–850. 2169
[112] Reading, E., Munoz-Muriedas, J., Roberts, A. D., Dear, G. J., Robinson, C. V., 2170

81
Beaumont, C., Elucidation of drug metabolite structural isomers using molecular 2171
modeling coupled with ion mobility mass spectrometry. Anal. Chem. 2016, 88, 2273–2172
2280. 2173
[113] Lee, H. H., Hong, A., Cho, Y., Kim, S., Kim, W. J., Kim, H. I., Structural characterization 2174
of anticancer drug paclitaxel and its metabolites using ion mobility mass spectrometry 2175
and tandem mass spectrometry. J. Am. Soc. Mass Spectrom. 2016, 27, 329–338. 2176
[114] Beucher, L., Dervilly-Pinel, G., Prévost, S., Monteau, F., Le Bizec, B., Determination of 2177
a large set of β-adrenergic agonists in animal matrices based on ion mobility and mass 2178
separations. Anal. Chem. 2015, 87, 9234–9242. 2179
[115] Dwek, R. A., Glycobiology: toward understanding the function of sugars. Chem. Rev. 2180
1996, 96, 683–720. 2181
[116] Varki, A., Biological roles of glycans. Glycobiology 2017, 27, 3–49. 2182
[117] Guile, G. R., Rudd, P. M., Wing, D. R., Prime, S. B., Dwek, R. A., A rapid high-resolution 2183
high-performance liquid chromatographic method for separating glycan mixtures and 2184
analyzing oligosaccharide profiles. Anal. Biochem. 1996, 240, 210–226. 2185
[118] Picmanova, M., Neilson, E. H., Motawia, M. S., Olsen, C. E., Agerbirk, N., Gray, C. J., 2186
Flitsch, S., Meier, S., Silvestro, D., Jorgensen, K., Sanchez-Pérez, R., Moller, B. L., 2187
Bjarnholt, N., A recycling pathway for cyanogenic glycosides evidenced by the 2188
comparative metabolic profiling in three cyanogenic plant species. Biochem. J. 2015, 2189
469, 375–389. 2190
[119] Marino, K., Bones, J., Kattla, J. J., Rudd, P. M., A systematic approach to protein 2191
glycosylation analysis: a path through the maze. Nat. Chem. Biol. 2010, 6, 713–723. 2192
[120] Hofmann, J., Pagel, K., Glycan analysis by ion mobility-mass spectrometry. Angew. 2193
Chemie Int. Ed. 2017, 56, 8342–8349. 2194
[121] Liu, Y., Clemmer, D. E., Characterizing oligosaccharides using injected-ion 2195
mobility/mass spectrometry. Anal. Chem. 1997, 69, 2504–2509. 2196
[122] Lee, D.-S., Wu, C., Hill, H. H., Detection of carbohydrates by electrospray ionization-ion 2197
mobility spectrometry following microbore high-performance liquid chromatography. J. 2198

82
Chromatogr. A 1998, 822, 1–9. 2199
[123] Hoffmann, W., Hofmann, J., Pagel, K., Energy-resolved ion mobility-mass spectrometry 2200
- A concept to improve the separation of isomeric carbohydrates. J. Am. Soc. Mass 2201
Spectrom. 2014, 25, 471–479. 2202
[124] Li, H., Giles, K., Bendiak, B., Kaplan, K., Siems, W. F., Hill, H. H., Resolving structural 2203
isomers of monosaccharide methyl glycosides using drift tube and traveling wave ion 2204
mobility mass spectrometry. Anal. Chem. 2012, 84, 3231–3239. 2205
[125] Fenn, L. S., McLean, J. A., Structural resolution of carbohydrate positional and structural 2206
isomers based on gas-phase ion mobility-mass spectrometry. Phys. Chem. Chem. 2207
Phys. 2011, 13, 2196–2205. 2208
[126] Hofmann, J., Hahm, H. S., Seeberger, P. H., Pagel, K., Identification of carbohydrate 2209
anomers using ion mobility–mass spectrometry. Nature 2015, 526, 241–244. 2210
[127] Both, P., Green, A. P., Gray, C. J., Sardzik, R., Voglmeir, J., Fontana, C., Austeri, M., 2211
Rejzek, M., Richardson, D., Field, R. A., Widmalm, G., Flitsch, S. L., Eyers, C. E., 2212
Discrimination of epimeric glycans and glycopeptides using IM-MS and its potential for 2213
carbohydrate sequencing. Nat. Chem. 2013, 6, 65–74. 2214
[128] Li, H., Bendiak, B., Siems, W. F., Gang, D. R., Hill, H. H., Determining the isomeric 2215
heterogeneity of neutral oligosaccharide-alditols of bovine submaxillary mucin using 2216
negative ion traveling wave ion mobility mass spectrometry. Anal. Chem. 2015, 87, 2217
2228–2235. 2218
[129] Harvey, D. J., Scarff, C. A., Edgeworth, M., Crispin, M., Scanlan, C. N., Sobott, F., 2219
Allman, S., Baruah, K., Pritchard, L., Scrivens, J. H., Travelling wave ion mobility and 2220
negative ion fragmentation for the structural determination of N-linked glycans. 2221
Electrophoresis 2013, 34, 2368–2378. 2222
[130] Harvey, D. J., Scarff, C. A., Edgeworth, M., Pagel, K., Thalassinos, K., Struwe, W. B., 2223
Crispin, M., Scrivens, J. H., Travelling-wave ion mobility mass spectrometry and 2224
negative ion fragmentation of hybrid and complex N -glycans. J. Mass Spectrom. 2016, 2225
51, 1064–1079. 2226

83
[131] Sarbu, M., Zhu, F., Peter-Katalinić, J., Clemmer, D. E., Zamfir, A. D., Application of ion 2227
mobility tandem mass spectrometry to compositional and structural analysis of 2228
glycopeptides extracted from the urine of a patient diagnosed with Schindler disease. 2229
Rapid Commun. Mass Spectrom. 2015, 29, 1929–1937. 2230
[132] Pu, Y., Ridgeway, M. E., Glaskin, R. S., Park, M. A., Costello, C. E., Lin, C., Separation 2231
and identification of isomeric glycans by selected accumulation-trapped ion mobility 2232
spectrometry-electron activated dissociation tandem mass spectrometry. Anal. Chem. 2233
2016, 88, 3440–3443. 2234
[133] Lee, S., Valentine, S. J., Reilly, J. P., Clemmer, D. E., Analyzing a mixture of 2235
disaccharides by IMS-VUVPD-MS. Int. J. Mass Spectrom. 2012, 309, 161–167. 2236
[134] Ropartz, D., Giuliani, A., Fanuel, M., Hervé, C., Czjzek, M., Rogniaux, H., Online 2237
coupling of high-resolution chromatography with extreme UV photon activation tandem 2238
mass spectrometry: Application to the structural investigation of complex glycans by 2239
dissociative photoionization. Anal. Chim. Acta 2016, 933, 1–9. 2240
[135] Li, H., Bendiak, B., Siems, W. F., Gang, D. R., Hill, H. H., Carbohydrate structure 2241
characterization by tandem ion mobility mass spectrometry. Anal. Chem. 2013, 85, 2242
2760–2769. 2243
[136] Gaye, M. M., Kurulugama, R., Clemmer, D. E., Investigating carbohydrate isomers by 2244
IMS-CID-IMS-MS: precursor and fragment ion cross-sections. Analyst 2015, 140, 6922–2245
6932. 2246
[137] Paglia, G., Kliman, M., Claude, E., Geromanos, S., Astarita, G., Applications of ion-2247
mobility mass spectrometry for lipid analysis. Anal. Bioanal. Chem. 2015, 407, 4995–2248
5007. 2249
[138] Paglia, G., Shrestha, B., Astarita, G., Ion-mobility mass spectrometry for lipidomics 2250
applications. 2017, pp. 61–79. 2251
[139] Hines, K. M., May, J. C., McLean, J. A., Xu, L., Evaluation of collision cross section 2252
calibrants for structural analysis of lipids by traveling wave ion mobility-mass 2253
spectrometry. Anal. Chem. 2016, 88, 7329–7336. 2254

84
[140] Hankin, J. A., Barkley, R. M., Zemski-Berry, K., Deng, Y., Murphy, R. C., Mass 2255
spectrometric collisional activation and product ion mobility of human serum neutral lipid 2256
extracts. Anal. Chem. 2016, 88, 6274–6282. 2257
[141] Berry, K. A. Z., Barkley, R. M., Berry, J. J., Hankin, J. A., Hoyes, E., Brown, J. M., 2258
Murphy, R. C., Tandem mass spectrometry in combination with product ion mobility for 2259
the identification of phospholipids. Anal. Chem. 2017, 89, 916–921. 2260
[142] Kyle, J. E., Zhang, X., Weitz, K. K., Monroe, M. E., Ibrahim, Y. M., Moore, R. J., Cha, 2261
J., Sun, X., Lovelace, E. S., Wagoner, J., Polyak, S. J., Metz, T. O., Dey, S. K., Smith, 2262
R. D., Burnum-Johnson, K. E., Baker, E. S., Uncovering biologically significant lipid 2263
isomers with liquid chromatography, ion mobility spectrometry and mass spectrometry. 2264
Analyst 2016, 141, 1649–1659. 2265
[143] Kyle, J. E., Casey, C. P., Stratton, K. G., Zink, E. M., Kim, Y.-M., Zheng, X., Monroe, M. 2266
E., Weitz, K. K., Bloodsworth, K. J., Orton, D. J., Ibrahim, Y. M., Moore, R. J., Lee, C. 2267
G., Pedersen, C., Orwoll, E., Smith, R. D., Burnum-Johnson, K. E., Baker, E. S., 2268
Comparing identified and statistically significant lipids and polar metabolites in 15-year 2269
old serum and dried blood spot samples for longitudinal studies. Rapid Commun. Mass 2270
Spectrom. 2017, 31, 447–456. 2271
[144] Leng, J., Guan, Q., Sun, T., Wang, H., Cui, J., Liu, Q., Zhang, Z., Zhang, M., Guo, Y., 2272
Direct infusion electrospray ionization–ion mobility–mass spectrometry for comparative 2273
profiling of fatty acids based on stable isotope labeling. Anal. Chim. Acta 2015, 887, 2274
148–154. 2275
[145] Groessl, M., Graf, S., Knochenmuss, R., High resolution ion mobility-mass spectrometry 2276
for separation and identification of isomeric lipids. Analyst 2015, 140, 6904–6911. 2277
[146] Zhou, Z. Z., Zhu, Z.-J., 13th Annual Conference of the Metabolomics Society, Brisbane, 2278
Australia. 25-29 June 2017. 2279
[147] Steiner, R., Saied, E. M., Othman, A., Arenz, C., Maccarone, A. T., Poad, B. L. J., 2280
Blanksby, S. J., von Eckardstein, A., Hornemann, T., Elucidating the chemical structure 2281
of native 1-deoxysphingosine. J. Lipid Res. 2016, 57, 1194–1203. 2282

85
[148] Bowman, A. P., Abzalimov, R. R., Shvartsburg, A. A., Broad separation of isomeric lipids 2283
by high-resolution differential ion mobility spectrometry with tandem mass spectrometry. 2284
J. Am. Soc. Mass Spectrom. 2017, 28, 1552–1561. 2285
[149] Márquez-Sillero, I., Aguilera-Herrador, E., Cárdenas, S., Valcárcel, M., Ion-mobility 2286
spectrometry for environmental analysis. TrAC Trends Anal. Chem. 2011, 30, 677–690. 2287
[150] Lipok, C., Hippler, J., Schmitz, O. J., A four dimensional separation method based on 2288
continuous heart-cutting gas chromatography with ion mobility and high resolution mass 2289
spectrometry. J. Chromatogr. A 2017, DOI: 10.1016/j.chroma.2017.07.013. 2290
[151] Stephan, S., Hippler, J., Köhler, T., Deeb, A. A., Schmidt, T. C., Schmitz, O. J., 2291
Contaminant screening of wastewater with HPLC-IM-qTOF-MS and LC+LC-IM-qTOF-2292
MS using a CCS database. Anal. Bioanal. Chem. 2016, 408, 6545–6555. 2293
[152] Grimm, F. A., Russell, W. K., Luo, Y.-S., Iwata, Y., Chiu, W. A., Roy, T., Boogaard, P. 2294
J., Ketelslegers, H. B., Rusyn, I., Grouping of petroleum substances as example UVCBs 2295
by ion mobility-mass spectrometry to enable chemical composition-based read-across. 2296
Environ. Sci. Technol. 2017, 51, 7197–7207. 2297
[153] Metz, T. O., Baker, E. S., Schymanski, E. L., Renslow, R. S., Thomas, D. G., Causon, 2298
T. J., Webb, I. K., Hann, S., Smith, R. D., Teeguarden, J. G., Integrating ion mobility 2299
spectrometry into mass spectrometry-based exposome measurements: what can it add 2300
and how far can it go? Bioanalysis 2017, 9, 81–98. 2301
[154] Zhou, Z., Shen, X., Tu, J., Zhu, Z.-J., Large-scale prediction of collision cross-section 2302
values for metabolites in ion mobility-mass spectrometry. Anal. Chem. 2016, 88, 11084–2303
11091. 2304
[155] Zhou, Z., Xiong, X., Zhu, Z.-J., MetCCS predictor: a web server for predicting collision 2305
cross-section values of metabolites in ion mobility-mass spectrometry based 2306
metabolomics. Bioinformatics 2017, 33, 2235–2237. 2307
[156] Bijlsma, L., Bade, R., Celma, A., Mullin, L., Cleland, G., Stead, S., Hernandez, F., 2308
Sancho, J. V., Prediction of collision cross-section values for small molecules: 2309
application to pesticide residue analysis. Anal. Chem. 2017, 89, 6583–6589. 2310

86
[157] Eiceman, G. A., Shoff, D. B., Harden, C. S., Snyder, A. P., Martinez, P. M., Fleischer, 2311
M. E., Watkins, M. L., Ion mobility spectrometry of halothane, enflurane, and isoflurane 2312
anesthetics in air and respired gases. Anal. Chem. 1989, 61, 1093–9. 2313
[158] Bennett, R. V., Gamage, C. M., Galhena, A. S., Fernández, F. M., Contrast-enhanced 2314
differential mobility-desorption electrospray ionization-mass spectrometry imaging of 2315
biological tissues. Anal. Chem. 2014, 86, 3756–3763. 2316
[159] Trim, P. J., Henson, C. M., Avery, J. L., McEwen, A., Snel, M. F., Claude, E., Marshall, 2317
P. S., West, A., Princivalle, A. P., Clench, M. R., Matrix-assisted laser 2318
desorption/ionization-ion mobility separation-mass spectrometry imaging of vinblastine 2319
in whole body tissue sections. Anal. Chem. 2008, 80, 8628–8634. 2320
[160] McLean, J. A., Ridenour, W. B., Caprioli, R. M., Profiling and imaging of tissues by 2321
imaging ion mobility-mass spectrometry. J. Mass Spectrom. 2007, 42, 1099–1105. 2322
[161] Glover, M. S., Dilger, J. M., Acton, M. D., Arnold, R. J., Radivojac, P., Clemmer, D. E., 2323
Examining the influence of phosphorylation on peptide ion structure by ion mobility 2324
spectrometry-mass spectrometry. J. Am. Soc. Mass Spectrom. 2016, 27, 786–794. 2325
[162] Ruotolo, B. T., Verbeck, Thomson, L. M., Woods, A. S., Gillig, K. J., Russell, D. H., 2326
Distinguishing between phosphorylated and nonphosphorylated peptides with ion 2327
mobility−mass spectrometry. J. Proteome Res. 2002, 1, 303–306. 2328
[163] Ruotolo, B. T., Gillig, K. J., Woods, A. S., Egan, T. F., Ugarov, M. V., Schultz, J. A., 2329
Russell, D. H., Analysis of phosphorylated peptides by ion mobility-mass spectrometry. 2330
Anal. Chem. 2004, 76, 6727–6733. 2331
[164] Shvartsburg, A. A., Singer, D., Smith, R. D., Hoffmann, R., Ion mobility separation of 2332
isomeric phosphopeptides from a protein with variant modification of adjacent residues. 2333
Anal. Chem. 2011, 83, 5078–5085. 2334
[165] Baird, M. A., Shvartsburg, A. A., Localization of post-translational modifications in 2335
peptide mixtures via high-resolution differential ion mobility separations followed by 2336
electron transfer dissociation. J. Am. Soc. Mass Spectrom. 2016, 27, 2064–2070. 2337
[166] Shvartsburg, A. A., Zheng, Y., Smith, R. D., Kelleher, N. L., Separation of variant 2338

87
methylated histone tails by differential ion mobility. Anal. Chem. 2012, 84, 6317–6320. 2339
[167] Shvartsburg, A. A., Zheng, Y., Smith, R. D., Kelleher, N. L., Ion mobility separation of 2340
variant histone tails extending to the “middle-down” Range. Anal. Chem. 2012, 84, 2341
4271–4276. 2342
[168] Aebersold, R., Mann, M., Mass spectrometry-based proteomics. Nature 2003, 422, 2343
198–207. 2344
[169] Cravatt, B. F., Simon, G. M., Yates III, J. R., The biological impact of mass-spectrometry-2345
based proteomics. Nature 2007, 450, 991–1000. 2346
[170] Altelaar, A. F. M., Munoz, J., Heck, A. J. R., Next-generation proteomics: towards an 2347
integrative view of proteome dynamics. Nat. Rev. Genet. 2012, 14, 35–48. 2348
[171] Andrews, G. L., Simons, B. L., Young, J. B., Hawkridge, A. M., Muddiman, D. C., 2349
Performance characteristics of a new hybrid quadrupole time-of-flight tandem mass 2350
spectrometer (TripleTOF 5600). Anal Chem 2011, 83, 5442–5446. 2351
[172] Beck, S., Michalski, A., Raether, O., Lubeck, M., Kaspar, S., Goedecke, N., Baessmann, 2352
C., Hornburg, D., Meier, F., Paron, I., Kulak, N. A., Cox, J., Mann, M., The Impact II, a 2353
very high-resolution quadrupole time-of-flight instrument (QTOF) for deep shotgun 2354
proteomics. Mol. Cell. Proteomics 2015, 14, 2014–2029. 2355
[173] Hoaglund-Hyzer, C. S., Clemmer, D. E., Ion trap/ion mobility/quadrupole/time-of-flight 2356
mass spectrometry for peptide mixture analysis. Anal. Chem. 2001, 73, 177–184. 2357
[174] Shliaha, P. V., Bond, N. J., Gatto, L., Lilley, K. S., Effects of traveling wave ion mobility 2358
separation on data independent acquisition in proteomics studies. J. Proteome Res. 2359
2013, 12, 2323–2339. 2360
[175] Helm, D., Vissers, J. P. C., Hughes, C. J., Hahne, H., Ruprecht, B., Pachl, F., Grzyb, 2361
A., Richardson, K., Wildgoose, J., Maier, S. K., Marx, H., Wilhelm, M., Becher, I., 2362
Lemeer, S., Bantscheff, M., Langridge, J. I., Kuster, B., Ion mobility tandem mass 2363
spectrometry enhances performance of bottom-up proteomics. Mol. Cell. Proteomics 2364
2014, 13, 3709–3715. 2365
[176] Chapman, J. D., Goodlett, D. R., Masselon, C. D., Multiplexed and data-independent 2366
88
tandem mass spectrometry for global proteome profiling. Mass Spectrom. Rev. 2014, 2367
33, 452–470. 2368
[177] Silva, J. C., Denny, R., Dorschel, C. A., Gorenstein, M., Kass, I. J., Li, G. Z., McKenna, 2369
T., Nold, M. J., Richardson, K., Young, P., Geromanos, S., Quantitative proteomic 2370
analysis by accurate mass retention time pairs. Anal Chem 2005, 77, 2187–2200. 2371
[178] Geromanos, S. J., Hughes, C., Ciavarini, S., Vissers, J. P. C., Langridge, J. I., Using ion 2372
purity scores for enhancing quantitative accuracy and precision in complex proteomics 2373
samples. Anal. Bioanal. Chem. 2012, 404, 1127–1139. 2374
[179] Daly, C. E., Ng, L. L., Hakimi, A., Willingale, R., Jones, D. J. L., Charlotte E. Daly, Leong 2375
L. Ng, Hakimi, A., Willingale, R., and Jones, D. Qualitative and quantitative 2376
characterization of plasma proteins when incorporating traveling wave ion mobility into 2377
a liquid chromatography–mass spectrometry workflow for biomarker discovery: use of 2378
product ion quantitation as an alternative data analysis tool for label free quantitation. 2379
Anal. Chem. 2014, 86, 1972-1979. 2380
[180] Distler, U., Kuharev, J., Navarro, P., Tenzer, S., Label-free quantification in ion mobility 2381
enhanced data-independent acquisition proteomics. Nat. Protoc. 2016, 11, 795–812. 2382
[181] Distler, U., Kuharev, J., Navarro, P., Levin, Y., Schild, H., Tenzer, S., Drift time-specific 2383
collision energies enable deep-coverage data-independent acquisition proteomics. Nat. 2384
Methods 2013, 11, 167–170. 2385
[182] Distler, U., Kuharev, J., Tenzer, S., Biomedical applications of ion mobility-enhanced 2386
data-independent acquisition-based label-free quantitative proteomics. Expert Rev. 2387
Proteomics 2014, 11, 675–684. 2388
[183] Souza, G. H. M. F., Guest, P. C., Martins-de-Souza, D., Methods in Molecular Biology. 2389
2017, pp. 57–73. 2390
[184] Haynes, S. E., Polasky, D. A., Dixit, S. M., Majmudar, J. D., Neeson, K., Ruotolo, B. T., 2391
Martin, B. R., Variable-velocity traveling-wave ion mobility separation enhancing peak 2392
capacity for data-independent acquisition proteomics. Anal. Chem. 2017, 2393
acs.analchem.7b00112. 2394

89
[185] Meier, F., Beck, S., Grassl, N., Lubeck, M., Park, M. A., Raether, O., Mann, M., Parallel 2395
accumulation-serial fragmentation (PASEF): Multiplying sequencing speed and 2396
sensitivity by synchronized scans in a trapped ion mobility device. J. Proteome Res. 2397
2015, 14, 5378–5387. 2398
[186] Shelimov, K. B., Clemmer, D. E., Hudgins, R. R., Jarrold, M. F., Protein structure in 2399
vacuo: gas-phase confirmations of BPTI and cytochrome c. J. Am. Chem. Soc. 1997, 2400
119, 2240–2248. 2401
[187] Wyttenbach, T., Bowers, M. T., Structural stability from solution to the gas phase: Native 2402
solution structure of ubiquitin survives analysis in a solvent-free ion mobility-mass 2403
spectrometry environment. J. Phys. Chem. B 2011, 115, 12266–12275. 2404
[188] Gonzalez Florez, A. I., Mucha, E., Ahn, D.-S., Gewinner, S., Schollkopf, W., Pagel, K., 2405
von Helden, G., Charge-induced unzipping of isolated proteins to a defined secondary 2406
structure. Angew. Chemie Int. Ed. 2016, 55, 3295–3299. 2407
[189] Segev, E., Wyttenbach, T., Bowers, M. T., Gerber, R. B., Conformational evolution of 2408
ubiquitin ions in electrospray mass spectrometry: molecular dynamics simulations at 2409
gradually increasing temperatures. Phys. Chem. Chem. Phys. 2008, 10, 3077. 2410
[190] Allison, T. M., Landreh, M., Benesch, J. L. P., Robinson, C. V., Low charge and reduced 2411
mobility of membrane protein complexes has implications for calibration of collision 2412
cross section measurements. Anal. Chem. 2016, 88, 5879–5884. 2413
[191] Hall, Z., Politis, A., Bush, M. F., Smith, L. J., Robinson, C. V., Charge-state dependent 2414
compaction and dissociation of protein complexes: Insights from ion mobility and 2415
molecular dynamics. J. Am. Chem. Soc. 2012, 134, 3429–3438. 2416
[192] Devine, P. W. A., Fisher, H. C., Calabrese, A. N., Whelan, F., Higazi, D. R., Potts, J. R., 2417
Lowe, D. C., Radford, S. E., Ashcroft, A. E., Investigating the Structural Compaction of 2418
Biomolecules Upon Transition to the Gas-Phase Using ESI-TWIMS-MS. J. Am. Soc. 2419
Mass Spectrom. 2017, 1–8. 2420
[193] Seo, J., Hoffmann, W., Warnke, S., Bowers, M. T., Pagel, K., von Helden, G., Retention 2421
of native protein structures in the absence of solvent: a coupled ion mobility and 2422
90
spectroscopic study. Angew. Chemie Int. Ed. 2016, 55, 14173–14176. 2423
[194] Warnke, S., Hoffmann, W., Seo, J., De Genst, E., von Helden, G., Pagel, K., From 2424
compact to string - the role of secondary and tertiary structure in charge-induced 2425
unzipping of gas-phase proteins. J. Am. Soc. Mass Spectrom. 2017, 28, 638–646. 2426
[195] Beveridge, R., Chappuis, Q., Macphee, C., Barran, P., Mass spectrometry methods for 2427
intrinsically disordered proteins. Analyst 2013, 138, 32–42. 2428
[196] Jurneczko, E., Cruickshank, F., Porrini, M., Nikolova, P., Campuzano, I. D. G., Morris, 2429
M., Barran, P. E., Intrinsic disorder in proteins: a challenge for (un)structural biology met 2430
by ion mobility-mass spectrometry. Biochem. Soc. Trans. 2012, 40, 1021–1026. 2431
[197] Bernstein, S. L., Liu, D., Wyttenbach, T., Bowers, M. T., Lee, J. C., Gray, H. B., Winkler, 2432
J. R., α-Synuclein: stable compact and extended monomeric structures and pH 2433
dependence of dimer formation. J. Am. Soc. Mass Spectrom. 2004, 15, 1435–1443. 2434
[198] Faull, P. A., Florance, H. V., Schmidt, C. Q., Tomczyk, N., Barlow, P. N., Hupp, T. R., 2435
Nikolova, P. V., Barran, P. E., Utilising ion mobility-mass spectrometry to interrogate 2436
macromolecules: factor H complement control protein modules 10-15 and 19-20 and 2437
the DNA-binding core domain of tumour suppressor p53. Int. J. Mass Spectrom. 2010, 2438
298, 99–110. 2439
[199] Maurizio, E., Cravello, L., Brady, L., Spolaore, B., Arnoldo, L., Giancotti, V., Manfioletti, 2440
G., Sgarra, R., Conformational role for the C-terminal tail of the intrinsically disordered 2441
high mobility group A (HMGA) chromatin factors. J. Proteome Res. 2011, 10, 3283–2442
3291. 2443
[200] Dickinson, E. R., Jurneczko, E., Nicholson, J., Hupp, T. R., Zawacka-Pankau, J., 2444
Selivanova, G., Barran, P. E., The use of ion mobility mass spectrometry to probe 2445
modulation of the structure of p53 and of MDM2 by small molecule inhibitors. Front. Mol. 2446
Biosci. 2015, 2, 1–9. 2447
[201] Knapman, T. W., Valette, N. M., Warriner, S. L., Ashcroft, a E., Ion mobility 2448
spectrometry-mass spectrometry of intrinsically unfolded proteins: trying to put order 2449
into disorder. Curr. Anal. Chem. 2013, 9, 181–191. 2450
91
[202] Hoffmann, W., von Helden, G., Pagel, K., Ion mobility-mass spectrometry and 2451
orthogonal gas-phase techniques to study amyloid formation and inhibition. Curr. Opin. 2452
Struct. Biol. 2017, 46, 7–15. 2453
[203] Leney, A. C., Pashley, C. L., Scarff, C. A., Radford, S. E., Ashcroft, A. E., Insights into 2454
the role of the β-2 microglobulin D-strand in amyloid propensity revealed by mass 2455
spectrometry. Mol. BioSyst. 2014, 10, 412–420. 2456
[204] Young, L. M., Mahood, R. A., Saunders, J. C., Tu, L.-H., Raleigh, D. P., Radford, S. E., 2457
Ashcroft, A. E., Insights into the consequences of co-polymerisation in the early stages 2458
of IAPP and αβ peptide assembly from mass spectrometry. Analyst 2015, 140, 6990–2459
6999. 2460
[205] Dupuis, N. F., Wu, C., Shea, J., Bowers, M. T., β-hairpins : a possible direct 2461
amyloidogenic precursor. 2009, 18283–18292. 2462
[206] Dupuis, N. F., Wu, C., Shea, J. E., Bowers, M. T., The amyloid formation mechanism in 2463
human IAPP: dimers have beta-strand monomer-monomer interfaces. J Am Chem Soc 2464
2011, 133, 7240–7243. 2465
[207] Cole, H. L., Kalapothakis, J. M. D., Bennett, G., Barran, P. E., MacPhee, C. E., 2466
Characterizing early aggregates formed by an amyloidogenic peptide by mass 2467
spectrometry. Angew. Chemie - Int. Ed. 2010, 49, 9448–9451. 2468
[208] Illes-Toth, E., Ramos, M. R., Cappai, R., Dalton, C., Smith, D. P., Distinct higher-order 2469
α-synuclein oligomers induce intracellular aggregation. Biochem. J. 2015, 468, 485–2470
493. 2471
[209] Daly, S., Kulesza, A., Poussigue, F., Simon, A.-L., Choi, C. M., Knight, G., Chirot, F., 2472
MacAleese, L., Antoine, R., Dugourd, P., Correction: Conformational changes in 2473
amyloid-β alloforms studied using action-FRET, IMS and molecular dynamics 2474
simulations. Chem. Sci. 2016, 7, 1609–1610. 2475
[210] Seo, J., Hoffmann, W., Warnke, S., Huang, X., Gewinner, S., Schöllkopf, W., Bowers, 2476
M. T., von Helden, G., Pagel, K., An infrared spectroscopy approach to follow β-sheet 2477
formation in peptide amyloid assemblies. Nat. Chem. 2016, 9, 39–44. 2478

92
[211] Young, L. M., Saunders, J. C., Mahood, R. A., Revill, C. H., Foster, R. J., Tu, L.-H., 2479
Raleigh, D. P., Radford, S. E., Ashcroft, A. E., Screening and classifying small-molecule 2480
inhibitors of amyloid formation using ion mobility spectrometry-mass spectrometry. Nat. 2481
Chem. 2014, 7, 73–81. 2482
[212] Young, L. M., Saunders, J. C., Mahood, R. A., Revill, C. H., Foster, R. J., Ashcroft, A. 2483
E., Radford, S. E., ESI-IMS-MS: a method for rapid analysis of protein aggregation and 2484
its inhibition by small molecules. Methods 2016, 95, 62–69. 2485
[213] Eschweiler, J. D., Kerr, R., Rabuck-Gibbons, J., Ruotolo, B. T., Sizing up protein-ligand 2486
complexes: the rise of structural mass spectrometry approaches in the pharmaceutical 2487
sciences. Annu. Rev. Anal. Chem. 2017, 10, 25–44. 2488
[214] Göth, M., Pagel, K., Ion mobility–mass spectrometry as a tool to investigate protein–2489
ligand interactions. Anal. Bioanal. Chem. 2017, 409, 4305–4310. 2490
[215] Stojko, J., Fieulaine, S., Petiot-Bocard, S., Van Dorsselaer, A., Meinnel, T., Giglione, C., 2491
Cianférani, S., Ion mobility coupled to native mass spectrometry as a relevant tool to 2492
investigate extremely small ligand-induced conformational changes. Analyst 2015, 140, 2493
7234–7245. 2494
[216] Harvey, S. R., Porrini, M., Konijnenberg, A., Clarke, D. J., Tyler, R. C., Langridge-Smith, 2495
P. R. R., Macphee, C. E., Volkman, B. F., Barran, P. E., Dissecting the dynamic 2496
conformations of the metamorphic protein lymphotactin. J. Phys. Chem. B 2014, 118, 2497
12348–12359. 2498
[217] Rabuck, J. N., Hyung, S. J., Ko, K. S., Fox, C. C., Soellner, M. B., Ruotolo, B. T., 2499
Activation state-selective kinase inhibitor assay based on ion mobility-mass 2500
spectrometry. Anal. Chem. 2013, 85, 6995–7002. 2501
[218] Harvey, S. R., Porrini, M., Stachl, C., MacMillan, D., Zinzalla, G., Barran, P. E., Small-2502
molecule inhibition of c-MYC:MAX leucine zipper formation is revealed by ion mobility 2503
mass spectrometry. J. Am. Chem. Soc. 2012, 134, 19384–19392. 2504
[219] Hopper, J. T. S., Oldham, N. J., Collision induced unfolding of protein ions in the gas 2505
phase studied by ion mobility-mass spectrometry: the effect of ligand binding on 2506

93
conformational stability. J. Am. Soc. Mass Spectrom. 2009, 20, 1851–1858. 2507
[220] Niu, S., Rabuck, J. N., Ruotolo, B. T., Ion mobility-mass spectrometry of intact protein–2508
ligand complexes for pharmaceutical drug discovery and development. Curr. Opin. 2509
Chem. Biol. 2013, 17, 809–817. 2510
[221] Laganowsky, A., Reading, E., Allison, T. M., Ulmschneider, M. B., Degiacomi, M. T., 2511
Baldwin, A. J., Robinson, C. V., Membrane proteins bind lipids selectively to modulate 2512
their structure and function. Nature 2014, 510, 172–175. 2513
[222] Niu, S., Ruotolo, B. T., Collisional unfolding of multiprotein complexes reveals 2514
cooperative stabilization upon ligand binding. Protein Sci. 2015, 24, 1272–1281. 2515
[223] Barrera, N. P., Di Bartolo, N., Booth, P. J., Robinson, C. V., Micelles protect membrane 2516
complexes from solution to vacuum. Science (80-. ). 2008, 321, 243–246. 2517
[224] Wang, S. C., Politis, A., Di Bartolo, N., Bavro, V. N., Tucker, S. J., Booth, P. J., Barrera, 2518
N. P., Robinson, C. V., Ion mobility mass spectrometry of two tetrameric membrane 2519
protein complexes reveals compact structures and differences in stability and packing. 2520
J. Am. Chem. Soc. 2010, 132, 15468–15470. 2521
[225] Liu, Y., Cong, X., Liu, W., Laganowsky, A., Characterization of membrane protein–lipid 2522
interactions by mass spectrometry ion mobility mass spectrometry. J. Am. Soc. Mass 2523
Spectrom. 2017, 28, 579–586. 2524
[226] Lee, A. G., Biological membranes: the importance of molecular detail. Trends Biochem. 2525
Sci. 2011, 36, 493–500. 2526
[227] Long, S. B., Tao, X., Campbell, E. B., MacKinnon, R., Atomic structure of a voltage-2527
dependent K+ channel in a lipid membrane-like environment. Nature 2007, 450, 376–2528
382. 2529
[228] Popot, J.-L., Amphipols, nanodiscs, and fluorinated surfactants: three non conventional 2530
approaches to studying membrane proteins in aqueous solutions. Annu. Rev. Biochem. 2531
2010, 79, 737–775. 2532
[229] Watkinson, T. G., Calabrese, A. N., Giusti, F., Zoonens, M., Radford, S. E., Ashcroft, A. 2533
E., Systematic analysis of the use of amphipathic polymers for studies of outer 2534

94
membrane proteins using mass spectrometry. Int. J. Mass Spectrom. 2015, 391, 54–2535
61. 2536
[230] Singer, S. J., Nicolson, G. L., The fluid mosaic model of the structure of cell membranes. 2537
Science. 1972, 175, 720–731. 2538
[231] HUNTE, C., RICHERS, S., Lipids and membrane protein structures. Curr. Opin. Struct. 2539
Biol. 2008, 18, 406–411. 2540
[232] Bush, M. F., Hall, Z., Giles, K., Hoyes, J., Robinson, C. V., Ruotolo, B. T., Collision 2541
Cross Sections of Proteins and Their Complexes: A Calibration framework and 2542
database for gas-phase structural biology. Anal. Chem. 2010, 82, 9557–9565. 2543
[233] Smith, D., Knapman, T., Campuzano, I., Malham, R., Berryman, J., Radford, S., 2544
Ashcroft, A., Deciphering drift time measurements from travelling wave ion mobility 2545
spectrometry-mass spectrometry studies. Eur. J. Mass Spectrom. 2009, 15, 113. 2546
[234] van Duijn, E., Barbu, I. M., Barendregt, A., Jore, M. M., Wiedenheft, B., Lundgren, M., 2547
Westra, E. R., Brouns, S. J. J., Doudna, J. A., van der Oost, J., Heck, A. J. R., Native 2548
tandem and ion mobility mass spectrometry highlight structural and modular similarities 2549
in clustered-regularly-interspaced shot-palindromic-repeats (CRISPR) - associated 2550
protein complexes from Escherichia coli and Pseudomonas aeruginosa. Mol. Cell. 2551
Proteomics 2012, 11, 1430–1441. 2552
[235] Politis, A., Park, A. Y., Hall, Z., Ruotolo, B. T., Robinson, C. V., Integrative modelling 2553
coupled with ion mobility mass spectrometry reveals structural features of the clamp 2554
loader in complex with single-stranded DNA binding protein. J. Mol. Biol. 2013, 425, 2555
4790–4801. 2556
[236] Saliou, J.-M., Manival, X., Tillault, A.-S., Atmanene, C., Bobo, C., Branlant, C., Van 2557
Dorsselaer, A., Charpentier, B., Cianférani, S., Combining native MS approaches to 2558
decipher archaeal box H/ACA ribonucleoprotein particle structure and activity. 2559
Proteomics 2015, 15, 2851–2861. 2560
[237] Uetrecht, C., Versluis, C., Watts, N., Wingfield, P., Steven, A., Heck, A. R., Stability and 2561
shape of hepatitis B virus capsids in vacuo. Angew. Chemie Int. Ed. 2008, 47, 6247–2562
95
6251. 2563
[238] Shepherd, D., Holmes, K., Rowlands, D., Stonehouse, N., Ashcroft, A., Using ion 2564
mobility spectrometry-mass spectrometry to decipher the conformational and assembly 2565
characteristics of the hepatitis B capsid protein. Biophys. J. 2013, 105, 1258–1267. 2566
[239] Snijder, J., van de Waterbeemd, M., Damoc, E., Denisov, E., Grinfeld, D., Bennett, A., 2567
Agbandje-McKenna, M., Makarov, A., Heck, A. J. R., Defining the stoichiometry and 2568
cargo load of viral and bacterial nanoparticles by orbitrap mass spectrometry. J. Am. 2569
Chem. Soc. 2014, 136, 7295–7299. 2570
[240] Benigni, P., Marin, R., Molano-Arevalo, J. C., Garabedian, A., Wolff, J. J., Ridgeway, M. 2571
E., Park, M. A., Fernandez-Lima, F., Towards the analysis of high molecular weight 2572
proteins and protein complexes using TIMS-MS. Int. J. Ion Mobil. Spectrom. 2016, 19, 2573
95–104. 2574
[241] Quintyn, R. S., Harvey, S. R., Wysocki, V. H., Illustration of SID-IM-SID (surface-induced 2575
dissociation-ion mobility-SID) mass spectrometry: homo and hetero model protein 2576
complexes. Analyst 2015, 140, 7012–7019. 2577
[242] Quintyn, R. S., Zhou, M., Yan, J., Wysocki, V. H., Surface-induced dissociation mass 2578
spectra as a tool for distinguishing different structural forms of gas-phase multimeric 2579
protein complexes. Anal. Chem. 2015, 87, 11879–11886. 2580
[243] Samulak, B. M., Niu, S., Andrews, P. C., Ruotolo, B. T., Ion mobility-mass spectrometry 2581
analysis of cross-linked intact multiprotein complexes: enhanced gas-phase stabilities 2582
and altered dissociation pathways. Anal. Chem. 2016, 88, 5290–5298. 2583
[244] Marcoux, J., Cianférani, S., Towards integrative structural mass spectrometry: benefits 2584
from hybrid approaches. Methods 2015, 89, 4–12. 2585
[245] Politis, A., Borysik, A. J., Assembling the pieces of macromolecular complexes: hybrid 2586
structural biology approaches. Proteomics 2015, 15, 2792–2803. 2587
[246] Politis, A., Stengel, F., Hall, Z., Hernandez, H., Leitner, A., Walzthoeni, T., Robinson, C. 2588
V, Aebersold, R., A mass spectrometry-based hybrid method for structural modeling of 2589
protein complexes. Nat. Methods 2014, 11, 403–406. 2590

96
[247] Marcoux, J., Politis, A., Rinehart, D., Marshall, D. P., Wallace, M. I., Tamm, L. K., 2591
Robinson, C. V., Mass spectrometry defines the C-terminal dimerization domain and 2592
enables modeling of the structure of full-length OmpA. Structure 2014, 22, 781–790. 2593
[248] Tsutsui, Y., Sarkar, A., Wintrode, P. L., Probing serpin conformational change using 2594
mass spectrometry and related methods. Elsevier Inc. 2011. 2595
[249] Snijder, J., Burnley, R. J., Wiegard, A., Melquiond, A. S. J., Bonvin, A. M. J. J., Axmann, 2596
I. M., Heck, A. J. R., Insight into cyanobacterial circadian timing from structural details 2597
of the KaiB-KaiC interaction. Proc. Natl. Acad. Sci. 2014, 111, 1379–1384. 2598
[250] Beck, A., Terral, G., Debaene, F., Wagner-Rousset, E., Marcoux, J., Janin-Bussat, M.-2599
C., Colas, O., Dorsselaer, A. Van, Cianférani, S., Cutting-edge mass spectrometry 2600
methods for the multi-level structural characterization of antibody-drug conjugates. 2601
Expert Rev. Proteomics 2016, 13, 157–183. 2602
[251] Beck, A., Sanglier-Cianférani, S., Van Dorsselaer, A., Biosimilar, biobetter, and next 2603
generation antibody characterization by mass spectrometry. Anal. Chem. 2012, 84, 2604
4637–4646. 2605
[252] Hyung, S.-J., Robinson, C. V., Ruotolo, B. T., Gas-phase unfolding and disassembly 2606
reveals stability differences in ligand-bound multiprotein complexes. Chem. Biol. 2009, 2607
16, 382–390. 2608
[253] Bagal, D., Valliere-Douglass, J. F., Balland, A., Schnier, P. D., Resolving disulfide 2609
structural isoforms of IgG2 monoclonal antibodies by ion mobility mass spectrometry. 2610
Anal. Chem. 2010, 82, 6751–6755. 2611
[254] Jones, L. M., Zhang, H., Cui, W., Kumar, S., Sperry, J. B., Carroll, J. A., Gross, M. L., 2612
Complementary MS methods assist conformational characterization of antibodies with 2613
altered S–S bonding networks. J. Am. Soc. Mass Spectrom. 2013, 24, 835–845. 2614
[255] Pritchard, C., Groves, K. J., Biesenbruch, S., O'Connor, G., Ashcroft, A. E., Arsene, C., 2615
Schulze, D., Quaglia, M., Quantification of human growth hormone in serum with a 2616
labeled protein as an internal standard: essential considerations. Anal. Chem. 2014, 86, 2617
6525–6532. 2618

97
[256] Debaene, F., Wagner-Rousset, E., Colas, O., Ayoub, D., Corvaia, N., Van Dorsselaer, 2619
A., Beck, A., Cianférani, S., Time resolved native ion-mobility mass spectrometry to 2620
monitor dynamics of IgG4 Fab arm exchange and “bispecific” monoclonal antibody 2621
formation. Anal. Chem. 2013, 85, 9785–9792. 2622
[257] Debaene, F., Bœuf, A., Wagner-Rousset, E., Colas, O., Ayoub, D., Corvaïa, N., Van 2623
Dorsselaer, A., Beck, A., Cianférani, S., Innovative native MS methodologies for 2624
antibody drug conjugate characterization: high resolution native MS and IM-MS for 2625
average DAR and DAR distribution assessment. Anal. Chem. 2014, 86, 10674–10683. 2626
[258] Marcoux, J., Champion, T., Colas, O., Wagner-Rousset, E., Corvaïa, N., Van 2627
Dorsselaer, A., Beck, A., Cianférani, S., Native mass spectrometry and ion mobility 2628
characterization of trastuzumab emtansine, a lysine-linked antibody drug conjugate. 2629
Protein Sci. 2015, 24, 1210–1223. 2630
[259] Botzanowski, T., Erb, S., Hernandez-Alba, O., Ehkirch, A., Colas, O., Wagner-Rousset, 2631
E., Rabuka, D., Beck, A., Drake, P. M., Cianferani, S., Insights from native mass 2632
spectrometry approaches for top- and middle- level characterization of site-specific 2633
antibody-drug conjugates. MAbs 2017, 862, 0–0. 2634
[260] Beck, A., Debaene, F., Diemer, H., Wagner-Rousset, E., Colas, O., Dorsselaer, A. Van, 2635
Cianférani, S., Cutting-edge mass spectrometry characterization of originator, biosimilar 2636
and biobetter antibodies. J. Mass Spectrom. 2015, 50, 285–297. 2637
[261] Pisupati, K., Tian, Y., Okbazghi, S., Benet, A., Ackermann, R., Ford, M., Saveliev, S., 2638
Hosfield, C. M., Urh, M., Carlson, E., Becker, C., Tolbert, T. J., Schwendeman, S. P., 2639
Ruotolo, B. T., Schwendeman, A., A Multidimensional analytical comparison of 2640
Remicade and the biosimilar Remsima. Anal. Chem. 2017, 89, 4838–4846. 2641
[262] Ferguson, C. N., Gucinski-Ruth, A. C., Evaluation of ion mobility-mass spectrometry for 2642
comparative analysis of monoclonal antibodies. J. Am. Soc. Mass Spectrom. 2016, 27, 2643
822–833. 2644
[263] Tian, Y., Han, L., Buckner, A. C., Ruotolo, B. T., Collision induced unfolding of intact 2645
antibodies: rapid characterization of disulfide bonding patterns, glycosylation, and 2646

98
structures. Anal. Chem. 2015, 87, 11509–11515. 2647
[264] Pacholarz, K. J., Peters, S. J., Garlish, R. A., Henry, A. J., Taylor, R. J., Humphreys, D. 2648
P., Barran, P. E., Molecular insights into the thermal stability of mAbs with variable-2649
temperature ion-mobility mass spectrometry. ChemBioChem 2016, 17, 46–51. 2650
[265] Abi-Ghanem, J., Gabelica, V., Nucleic acid ion structures in the gas phase. Phys. Chem. 2651
Chem. Phys. 2014, 16, 21204–21218. 2652
[266] Hoaglund, C. S., Liu, Y., Ellington, A. D., Pagel, M., Clemmer, D. E., Gas-phase DNA: 2653
oligothymidine ion conformers. J. Am. Chem. Soc. 1997, 119, 9051–9052. 2654
[267] Gidden, J., Ferzoco, A., Baker, E. S., Bowers, M. T., Duplex formation and the onset of 2655
helicity in poly d(CG)n oligonucleotides in a solvent-free environment. J. Am. Chem. 2656
Soc. 2004, 126, 15132–15140. 2657
[268] Gidden, J., Baker, E. S., Ferzoco, A., Bowers, M. T., Structural motifs of DNA complexes 2658
in the gas phase. Int. J. Mass Spectrom. 2005, 240, 183–193. 2659
[269] Baker, E. S., Bowers, M. T., B-DNA helix stability in a solvent-free environment. J. Am. 2660
Soc. Mass Spectrom. 2007, 18, 1188–1195. 2661
[270] Porrini, M., Rosu, F., Rabin, C., Darré, L., Gómez, H., Orozco, M., Gabelica, V., 2662
Compaction of duplex nucleic acids upon native electrospray mass spectrometry. ACS 2663
Cent. Sci. 2017, 3, 454–461. 2664
[271] Arcella, A., Portella, G., Ruiz, M. L., Eritja, R., Vilaseca, M., Gabelica, V., Orozco, M., 2665
Structure of triplex DNA in the gas phase. J. Am. Chem. Soc. 2012, 134, 6596–6606. 2666
[272] Baker, E. S., Bernstein, S. L., Gabelica, V., De Pauw, E., Bowers, M. T., G-quadruplexes 2667
in telomeric repeats are conserved in a solvent-free environment. Int. J. Mass Spectrom. 2668
2006, 253, 225–237. 2669
[273] Gabelica, V., Rosu, F., Tabarin, T., Kinet, C., Antoine, R., Broyer, M., De Pauw, E., 2670
Dugourd, P., Base-dependent electron photodetachment from negatively charged DNA 2671
strands upon 260-nm laser irradiation. J. Am. Chem. Soc. 2007, 129, 4706–4713. 2672
[274] Smargiasso, N., Rosu, F., Hsia, W., Colson, P., Baker, E. S., Bowers, M. T., De Pauw, 2673
E., Gabelica, V., G-quadruplex DNA assemblies: loop length, cation identity, and 2674

99
multimer formation. J. Am. Chem. Soc. 2008, 130, 10208–10216. 2675
[275] Rosu, F., Gabelica, V., Poncelet, H., De Pauw, E., Tetramolecular G-quadruplex 2676
formation pathways studied by electrospray mass spectrometry. Nucleic Acids Res. 2677
2010, 38, 5217–5225. 2678
[276] Rosu, F., Gabelica, V., Houssier, C., Colson, P., De Pauw, E., Triplex and quadruplex 2679
DNA structures studied by electrospray mass spectrometry. Rapid Commun. Mass 2680
Spectrom. 2002, 16, 1729–1736. 2681
[277] Vairamani, M., Gross, M. L., G-quadruplex formation of thrombin-binding aptamer 2682
detected by electrospray ionization mass spectrometry. J. Am. Chem. Soc. 2003, 125, 2683
42–43. 2684
[278] Balthasart, F., Plavec, J., Gabelica, V., Ammonium ion binding to DNA G-Quadruplexes: 2685
do electrospray mass spectra faithfully reflect the solution-phase species? J. Am. Soc. 2686
Mass Spectrom. 2013, 24, 1–8. 2687
[279] Rueda, M., Luque, F. J., Orozco, M., G-quadruplexes can maintain their structure in the 2688
gas phase. J. Am. Chem. Soc. 2006, 128, 3608–3619. 2689
[280] Gabelica, V., Baker, E. S., Teulade-Fichou, M. P., De Pauw, E., Bowers, M. T., 2690
Stabilization and structure of telomeric and c-myc region intramolecular G-2691
quadruplexes: the role of central cations and small planar ligands. J. Am. Chem. Soc. 2692
2007, 129, 895–904. 2693
[281] Kemper, P. R., Dupuis, N. F., Bowers, M. T., A new, higher resolution, ion mobility mass 2694
spectrometer. Int. J. Mass Spectrom. 2009, 287, 46–57. 2695
[282] Shvartsburg, A. A., Tang, K., Smith, R. D., Differential ion mobility separations of 2696
peptides with resolving power exceeding 50. Anal. Chem. 2010, 82, 32–35. 2697
[283] Shvartsburg, A. A., Tang, K., Smith, R. D., Understanding and designing field 2698
asymmetric waveform ion mobility spectrometry separations in gas mixtures. Anal. 2699
Chem. 2004, 76, 7366–7374. 2700
[284] Shvartsburg, A. A., Smith, R. D., Accelerated high-resolution differential ion mobility 2701
separations using hydrogen. Anal. Chem. 2011, 83, 9159–9166. 2702

100
[285] Howdle, M. D., Eckers, C., Laures, A. M.-F. F., Creaser, C. S., The effect of drift gas on 2703
the separation of active pharmaceutical ingredients and impurities by ion mobility-mass 2704
spectrometry. Int. J. Mass Spectrom. 2010, 298, 72–77. 2705
[286] Fasciotti, M., Sanvido, G. B., Santos, V. G., Lalli, P. M., McCullagh, M., de Sá, G. F., 2706
Daroda, R. J., Peter, M. G., Eberlin, M. N., Separation of isomeric disaccharides by 2707
traveling wave ion mobility mass spectrometry using CO 2 as drift gas. J. Mass 2708
Spectrom. 2012, 47, 1643–1647. 2709
[287] Dwivedi, P., Wu, C., Matz, L. M., Clowers, B. H., Siems, W. F., Hill, H. H., Gas-phase 2710
chiral separations by ion mobility spectrometry. Anal. Chem. 2006, 78, 8200–8206. 2711
[288] Kurulugama, R. T., Darland, E., Kuhlmann, F., Stafford, G., Fjeldsted, J., Evaluation of 2712
drift gas selection in complex sample analyses using a high performance drift tube ion 2713
mobility-QTOF mass spectrometer. Analyst 2015, 140, 6834–6844. 2714
[289] Schneider, B., Covey, T., Coy, S., Krylov, E., Nazarov, E., Control of chemical effects in 2715
the separation process of a differential mobility mass spectrometer system. Eur. J. Mass 2716
Spectrom. 2010, 16, 57. 2717
[290] Blagojevic, V., Chramow, A., Schneider, B. B., Covey, T. R., Bohme, D. K., Differential 2718
mobility spectrometry of isomeric protonated dipeptides: modifier and field effects on ion 2719
mobility and stability. Anal. Chem. 2011, 83, 3470–3476. 2720
[291] Varesio, E., Le Blanc, J. C. Y., Hopfgartner, G. G., Real-time 2D separation by LC × 2721
differential ion mobility hyphenated to mass spectrometry. Anal. Bioanal. Chem. 2012, 2722
402, 2555–2564. 2723
[292] Porta, T., Varesio, E., Hopfgartner, G., Gas-phase separation of drugs and metabolites 2724
using modifier-assisted differential ion mobility spectrometry hyphenated to liquid 2725
extraction surface analysis and mass spectrometry. Anal. Chem. 2013, 85, 11771–2726
11779. 2727
[293] Chen, P.-S., Chen, S.-H., Chen, J.-H., Haung, W.-Y., Liu, H.-T., Kong, P.-H., Yang, O. 2728
H.-Y., Modifier-assisted differential mobility-tandem mass spectrometry method for 2729
detection and quantification of amphetamine-type stimulants in urine. Anal. Chim. Acta 2730

101
2016, 946, 1–8. 2731
[294] Le Masle, A., Angot, D., Gouin, C., D'Attoma, A., Ponthus, J., Quignard, A., Heinisch, 2732
S., Development of on-line comprehensive two-dimensional liquid chromatography 2733
method for the separation of biomass compounds. J. Chromatogr. A 2014, 1340, 90–2734
98. 2735
[295] Vonk, R. J., Gargano, A. F. G., Davydova, E., Dekker, H. L., Eeltink, S., de Koning, L. 2736
J., Schoenmakers, P. J., Comprehensive two-dimensional liquid chromatography with 2737
stationary-phase-assisted modulation coupled to high-resolution mass spectrometry 2738
applied to proteome analysis of saccharomyces cerevisiae. Anal. Chem. 2015, 87, 2739
5387–5394. 2740
[296] Gargano, A. F. G., Duffin, M., Navarro, P., Schoenmakers, P. J., Reducing dilution and 2741
analysis time in online comprehensive two-dimensional liquid chromatography by active 2742
modulation. Anal. Chem. 2016, 88, 1785–1793. 2743
[297] Stoll, D. R., Carr, P. W., Two-Dimensional liquid chromatography: a state of the art 2744
tutorial. Anal. Chem. 2017, 89, 519–531. 2745
[298] Stoll, D., Danforth, J., Zhang, K., Beck, A., Characterization of therapeutic antibodies 2746
and related products by two-dimensional liquid chromatography coupled with UV 2747
absorbance and mass spectrometric detection. J. Chromatogr. B 2016, 1032, 51–60. 2748
[299] Sorensen, M., Harmes, D. C., Stoll, D. R., Staples, G. O., Fekete, S., Guillarme, D., 2749
Beck, A., Comparison of originator and biosimilar therapeutic monoclonal antibodies 2750
using comprehensive two-dimensional liquid chromatography coupled with time-of-flight 2751
mass spectrometry. MAbs 2016, 8, 1224–1234. 2752
[300] Ehkirch, A., D’Atri, V., Rouviere, F., Hernandez-Alba, O., Goyon, A., Colas, O., Sarrut, 2753
M., Beck, A., Guillarme, D., Heinisch, S., Cianferani, S., An online four-dimensional 2754
HICxSEC-IMxMS methodology for in-depth characterization of antibody drug 2755
conjugates. Anal. Chem. n.d. 2756
[301] Barcaru, A., Mol, H. G. J., Tienstra, M., Vivó-Truyols, G., Bayesian approach to peak 2757
deconvolution and library search for high resolution gas chromatography – mass 2758

102
spectrometry. Anal. Chim. Acta 2017, DOI: 10.1016/j.aca.2017.06.044. 2759
[302] Barcaru, A., Derks, E., Vivó-Truyols, G., Bayesian peak tracking: a novel probabilistic 2760
approach to match GCxGC chromatograms. Anal. Chim. Acta 2016, 940, 46–55. 2761
[303] Tolmachev, A. V., Webb, I. K., Ibrahim, Y. M., Garimella, S. V. B., Zhang, X., Anderson, 2762
G. A., Smith, R. D., Characterization of ion dynamics in structures for lossless ion 2763
manipulations. Anal. Chem. 2014, 86, 9162–9168. 2764
2765

103
11. Figure captions 2766
2767
Figure 1: Number of papers published since 1995 in the field of IMS, IM-MS and LC-IM-MS. In 2768
this figure, the 2 years gap, mean all papers published within 2 years. Source: Scifinder scholar 2769
2017. Date of information gathering: June 2017. 2770
2771
Figure 2: Schematic representation of a three-dimensional analysis, including a liquid 2772
chromatography separation, followed by ion mobility discrimination and time of flight mass 2773
spectrometry detection. A 3D representation of the data was also included in this 2774
representation. 2775
2776
Figure 3: Schematic representation of the commercially available IMS technology, classified 2777
as time-dispersive methods (DTIMS, TWIMS), space-dispersive methods (FAIMS, DMA) and 2778
ion trapping methods (TIMS). This figure was adapted from [2,5,18,24], with permissions from 2779
the Publishers. 2780
2781
Figure 4: Schematic representation of the three atomistic models employed for estimating gas-2782
phase conformations, allowing calculation of CCS values. A: projection approximation (PA), a 2783
non-explicit method working by projecting the “shadow” of the ion onto a plane to find the 2784
average area of all the possible orientations of the molecule under investigation. B: exact hard 2785
sphere scattering (EHSS), a hard sphere collisions based method that computes the multiple 2786
scattering events without taking into account the long-range interactions. C: trajectory method 2787
(TM), an explicit model which accounts for both long-range interactions and multiple scattering 2788
events. The arrows represents the buffer gas atom trajectories. 2789
2790
Figure 5: (a) Calculated absolute CCS differences required to satisfy various peak-to-peak 2791
resolution conditions based on experimental CCS data for positively-charge ions based on 2792
conditional resolution model for current Agilent DTIMS instrument. Symbol key: metabolites 2793

104
(filled squares), peptides (open stars), and lipids (open circles). A peak-to-peak Rs value of 2794
0.6 reflects conditions allowing both CCS values to be reliably determined for co-eluting 2795
isobaric species, while 1.5 represents baseline resolution. (b) Corresponding calculated 2796
percentage CCS differences for the same data. Reprinted from J. Chromatogr. A, Vol. 1416, 2797
Causon, T. J., Hann, S., Theoretical evaluation of peak capacity improvements by use of liquid 2798
chromatography combined with drift tube ion mobility-mass spectrometry., pp 47-56 (ref [82]). 2799
Copyright 2015, with permission from Elsevier. 2800
2801
Figure 6: Intensity vs. drift time for the protomers of ciprofloxacin, with the respective sites of 2802
protonation on the cyclic ketone and the piperazine moiety in the positive ionization mode. 2803
CCS values of the two protomers were also reported in this figure. This figure was adapted 2804
from [86], with permission from Waters corporation. However, a modification was applied by 2805
the authors of this application note on the original figure (Figure 5) found in [86], since one of 2806
the hypothesized protonation site was wrongly assigned in their original work. 2807
2808
Figure 7: CCSs of drug glucuronide metabolite structural isomers with different adducts and 2809
polarity. (A) Structures of drug glucuronide metabolite structural isomers. Overlays of 2810
representative arrival time distributions at 50 V drift voltage for (B) naringenin-4′-glucuronide 2811
(4′) and naringenin-7-glucuronide (7), MW (Da) = 448.5 and for (C) β-3-estradiol-glucuronide 2812
(3) and β-17-estradiol-glucuronide (17), MW (Da) = 448.5. ATD full width half maxima and 2813
DTCCSHe averages are inset. Errors quoted are the standard deviations from at least two 2814
interday repeated measurements. Reproduced from Reading, E., Munoz-Muriedas, J., 2815
Roberts, A. D., Dear, G. J., Robinson, C. V., Beaumont, C., Anal. Chem. 2016, 88, 2273–2280 2816
(ref [112]). Copyright 2016 American Chemical Society. 2817
2818
Figure 8: ESI(+) results from a mixture of D3-labeled hydrolyzed HEK cell lipid extracts spiked 2819
with unlabeled synthetic standards, SPH m18:1(4E)(3OH) and SPH m18:1(14E)(3OH). (A) 2820
Ionograms showing separation in voltage space of the [M+H]+ ions formed from the two lipid 2821

105
isomers. Each of the synthetic lipids spiked into the extract produced a peak in the black trace 2822
(m/z 284) and similar features were observed for the labeled HEK293 extract shown in the red 2823
trace (m/z 287). (B) Ozonolysis (OzID) spectra obtained for synthetic standard (black 2824
spectrum) and the D3-labeled extract (red spectrum) corresponding to the first feature in the 2825
ionogram (i.e., CV = 17 V ozone reaction time of 100 ms). (C) OzID spectra obtained for 2826
synthetic standard (black spectrum) and the D3-labeled extract (red spectrum) corresponding 2827
to the second feature in the ionogram (i.e., CV = 20 V ozone reaction time of 15 s). OzID 2828
product ions characteristic of the locations of the carbon-carbon double bonds are indicated 2829
by closed circles and enable assignment of the position of unsaturation to (Δ14)-position (B) 2830
and (Δ4)-position (C). Adapted from [147], with permission from the American Society for 2831
Biochemistry and Molecular Biology. 2832
2833
Figure 9: HDMSE analysis of 400 ng Hela digest. IMS additional dimension provides an 2834
increasing number of identified peptides and proteins (38440 and 3490 respectively) with a 2835
FDR of 1% at a protein level using PLGS algorithm. 2836
2837
Figure 10: Workflow utilized for IMS-MS analysis of membrane protein-lipid interaction by 2838
Laganowsky et al. Proteins are released from micelles by rising the source temperature and 2839
subsequently activated in the trap cell. The in-source fragmentation allows performing of MS-2840
IM-MS analysis on specific ions. 2841
2842
Figure 11: A general picture of the interaction of the full clamp loader and SSB4 before and 2843
after the addition of ssDNA. Mass spectra and the corresponding countour plots are depicted 2844
for a) y3δδ′ψχ-SSB4 and b) y3δδ′ψχ–SSB4-SSDNA2. The three dimension structure proposed 2845
for c) y3δδ′ψχ-SSB4 and e) y3δδ′ψχ–SSB4-SSDNA2 complexes from molecular modeling. 2846
Measured drift time (d) for the 36+ charge state of y3δδ′ψχ–SSB4(blue) and y3δδ′ψχ–SSB4-2847
SSDNA2 (red). A significant increase in measured collision cross section of the clamp loader-2848
SS4 is observed upon DNA binding. Reprinted from J. Mol. Bio., Vol. 425, Politis, A., Park, A. 2849

106
Y., Hall, Z., Ruotolo, B. T., Robinson, C. V., Integrative Modelling Coupled with Ion Mobility 2850
Mass Spectrometry Reveals Structural Features of the Clamp Loader in Complex with Single-2851
Stranded DNA Binding Protein, pp 4790-4801 (ref [235]). Copyright 2013, with permission from 2852
Elsevier. 2853
2854
Figure 12: Insights about biopharmaceutical mAbs and ADC characterization based on IM-MS 2855
data. a) Analysis of global conformation differences induced by disulfide bridge heterogeneity 2856
(Reproduced from Bagal, D., Valliere-Douglass, J. F., Balland, A., Schnier, P. D., Anal. Chem. 2857
2010, 82, 6751–6755. (ref [253]). Copyright 2010 American Chemical Society.) b) 2858
Benchmarking of different conjugation strategies by IM-MS, c) CIU fingerprint to evaluate gas-2859
phase unfolding process, d) analysis of protein aggregation (oligomerization), e) 2860
characterization of the global conformation of gas-phase ions. 2861
2862
Figure 13: Separation of a mixture of 8 pharmaceutical compounds having a nominal mass of 2863
316 by DMS coupled to a QqQLIT MS. DMS separation: (a) without polar modifier (nitrogen), 2864
(b) with 1.5% of MeOH as modifier, (c) with 1.5% of EtOH as modifier, and (d) with 1.5% of i-2865
PrOH as modifier. With kind permission from Springer science + business media: Anal. 2866
Bioanal. Chem., Real-time 2D separation by LC × differential ion mobility hyphenated to mass 2867
spectrometry, Vol 402, 2012, 2555-2564, Varesio, E., Le Blanc, J. C. Y., Hopfgartner, G. 2868
Figure 3 (ref [291]). 2869
2870
Figure 14: Heat map of an LC + LC-IM-qTOF measurement of a Ginkgo biloba extract (a). The 2871
separation on the second dimension column of one fraction collected between 4 and 8 min 2872
(eluting from the second dimension between 8 and 12 min) from the sample is zoomed in (b). 2873
2D plot of m/z vs. drift time extracted from 9.63 to 9.76 min (c). The zoomed in image shows 2874
the separation of two peaks with the same m/z in the IM dimension (d). With kind permission 2875
from Springer science + business media: Anal. Bioanal. Chem., A novel four-dimensional 2876

107
analytical approach for analysis of complex samples, Vol 408, 2016, 3751-3759, Stephan, S., 2877
Jakob, C., Hippler, J., Schmitz, O. J. Figure 4 (ref [105]). 2878
2879

108
12. Short biography of authors 2880
2881
Dr Valentina D’Atri obtained her PhD in industrial and molecular biotechnologies at the 2882
University of Naples Federico II, Italy. She is now Postdoc at the University of Geneva, 2883
Switzerland. Her expertise includes mass spectrometry, ion mobility-mass spectrometry, 2884
molecular modelling and separation science, including HPLC, UHPLC, and HILIC. Her current 2885
research activity is in the field of biopharmaceutical proteins; in particular, her interest focuses 2886
on the analytical characterization of mAbs, ADCs, and fusion proteins by LC-MS and LC-IM-2887
MS. 2888
2889
Dr Tim Causon obtained his PhD at the University of Tasmania, Australia. He is now Senior 2890
Scientist in the group of Instrumental Analytical Chemistry and Metabolomics at the 2891
Department of Chemistry of the University of Natural Resources and Life Sciences in Austria. 2892
His research interests centre on mass spectrometry, ion mobility-mass spectrometry and 2893
separation science, including analytical method development for metabolomics, as well as 2894
fundamental analytical studies. 2895
2896
Dr. Oscar Hernandez Alba has joined the BioOrganic Mass Spectrometry Laboratory 2897
(LSMBO) at the Hubert Curien Pluridisciplinary Institute (IPHC, University of Strasbourg, 2898
CNRS UMR7178) in Strasbourg as a postdoctoral researcher. He obtained his PhD degree at 2899
the University of Paris-Sud. His thesis was focused on developing a multimodal approach 2900
based on a single mass spectrometer, which incorporates ion mobility spectrometry and 2901
infrared spectroscopy in order to characterize the structure of mobility- and mass-selected 2902
molecular ions. He is currently working on the characterization of biopharmaceuticals and 2903
noncovalent protein/protein complex using native mass spectrometry and ion mobility 2904
spectrometry. 2905
2906
109
Aline Mutabazi graduated from the School of Pharmaceutical Sciences of the University of 2907
Geneva as a pharmacist in 2016. After a master thesis about the development and validation 2908
of a LC-MS method for the analysis of neonicotinoids in honey, she joined Jean-Luc Veuthey 2909
and Davy Guillarme’s team in January 2017 to begin a Ph.D. thesis focused on ion mobility 2910
applied to the analysis of pharmaceutical compounds. 2911
2912
Prof. Jean-Luc Veuthey is professor at the School of Pharmaceutical Sciences, University of 2913
Geneva, Switzerland. He also acted as President of the School of Pharmaceutical Sciences, 2914
Vice-Dean of the Faculty of Sciences and finally Vice-Rector of the University of Geneva. His 2915
research domains are: development of separation techniques in pharmaceutical sciences, and 2916
more precisely: study of the impact of sample preparation procedures in the analytical 2917
process; fundamental studies in liquid and supercritical chromatography; separation 2918
techniques coupled with mass spectrometry; analysis of drugs and drugs of abuse in different 2919
matrices. He published more than 300 articles in peer-review journals. 2920
2921
Dr. Sarah Cianférani holds a PhD degree in analytical chemistry from the University of 2922
Strasbourg, France. She is now a CNRS research director and heads the BioOrganic Mass 2923
Spectrometry Laboratory (LSMBO) at the Hubert Curien Pluridisciplinary Institute (IPHC, 2924
University of Strasbourg, CNRS UMR7178) in Strasbourg. Her expertise focused on 2925
developments in structural mass spectrometry (native MS, ion mobility, H/D exchange and 2926
crosslinking) and applications of advanced native mass spectrometry and native ion-mobility 2927
mass spectrometry methodologies for biological noncovalent complex characterization, and 2928
especially biopharmaceuticals (mAb-related compounds). She is a co-author of more than 110 2929
scientific papers related to mass spectrometry analysis of proteins. 2930
2931
Dr Davy Guillarme holds a PhD degree in analytical chemistry from the University of Lyon, 2932
France. He is now senior lecturer at the University of Geneva in Switzerland. He authored 190 2933
journal articles related to pharmaceutical analysis. His expertise includes HPLC, UHPLC, 2934

110
HILIC, LC-MS, SFC, analysis of proteins and mAbs. He is an editorial advisory board member 2935
of several journals including Journal of Chromatography A, Journal of Separation Science, LC-2936
GC North America and others... 2937
2938