Added Sugar Consumption Among College Students
62
University of the Incarnate Word University of the Incarnate Word The Athenaeum The Athenaeum Theses & Dissertations 8-2017 Added Sugar Consumption Among College Students Added Sugar Consumption Among College Students Maram Murad University of the Incarnate Word, [email protected] Follow this and additional works at: https://athenaeum.uiw.edu/uiw_etds Part of the Human and Clinical Nutrition Commons, Other Nutrition Commons, and the Public Health Education and Promotion Commons Recommended Citation Recommended Citation Murad, Maram, "Added Sugar Consumption Among College Students" (2017). Theses & Dissertations. 6. https://athenaeum.uiw.edu/uiw_etds/6 This Thesis is brought to you for free and open access by The Athenaeum. It has been accepted for inclusion in Theses & Dissertations by an authorized administrator of The Athenaeum. For more information, please contact [email protected].
Transcript of Added Sugar Consumption Among College Students
University of the Incarnate Word University of the Incarnate Word
The Athenaeum The Athenaeum
Theses & Dissertations
8-2017
Added Sugar Consumption Among College Students Added Sugar Consumption Among College Students
Maram Murad University of the Incarnate Word, [email protected]
Follow this and additional works at: https://athenaeum.uiw.edu/uiw_etds
Part of the Human and Clinical Nutrition Commons, Other Nutrition Commons, and the Public Health
Education and Promotion Commons
Recommended Citation Recommended Citation Murad, Maram, "Added Sugar Consumption Among College Students" (2017). Theses & Dissertations. 6. https://athenaeum.uiw.edu/uiw_etds/6
This Thesis is brought to you for free and open access by The Athenaeum. It has been accepted for inclusion in Theses & Dissertations by an authorized administrator of The Athenaeum. For more information, please contact [email protected].

ADDED SUGAR CONSUMPTION AMONG COLLEGE STUDENTS
by
MARAM MURAD
A THESIS
Presented to the Faculty of the University of the Incarnate Word in partial fulfillment of the requirements
for the degree of
MASTER OF SCIENCE IN NUTRITION
UNIVERSITY OF THE INCARNATE WORD
August 2017

©2017 Maram Murad
ii
ACKNOWLEDGMENTS
I would first like to thank my thesis advisor Dr. Beth Senne-Duff of the graduate program
in nutrition at the University of the Incarnate Word. She consistently allowed this paper to be my
own work, but guided me in the right direction whenever I needed it. Along with my advisor, I
would like to thank the rest of my thesis committee Dr. Maureen Rauschhuber and Dr. Cindy
Heiss for their continued support, cooperation and inspiration.
Maram Murad

iii
DEDICATION
I would like to express my gratitude to my parents Hanan Koshak and Ahmed Murad and
to my husband Numey Al-Galib Alsharief for providing me with the support and continuous
encouragement throughout my master's program, and during the process of researching and
writing this thesis. Additionally, I would like to thank my son Malik Al-Galib Alshareif for
giving me strength and reminding me how precious life is. This research would not have been
possible without them.

iv
ADDED SUGAR CONSUMPTION AMONG COLLEGE STUDENTS
Maram Murad, MS
University of the Incarnate Word, 2017
Added sugar consumption has been increasing in all age groups in the United States and
worldwide, with the greatest increase in young adults. College-age years are a critical period in
the young adult's life where many habits develop, including nutrition and food choices. An
understanding of college-age students’ attitudes and behaviors toward added sugar consumption
might help predict added sugar consumption within this population. This was a quantitative
study of traditional-aged college students' added sugar consumption through a convenience
sample at a private university in San Antonio, TX. A survey was administrated to undergraduate
students at different classes. Subjects were 18 to 24 years old, 72% females and 27.7% males.
Results indicated that most participating students consumed one sugar-sweetened beverage daily
or at least several times per week. Moreover, most participating students rarely/never chose a
product based on the type of sweetener used. Only 11% of participating students mentioned that
they tried to limit and avoid added sugars, however, 61% of those considered limiting sugar-
sweetened beverages to help maintain a healthy weight. Furthermore, 56.5% of participating
student declared that they were not aware of the American Heart Association (AHA) added sugar
recommendations. Over half, 54.4%, of participating student reported that they were not aware
of the 2015-2020 Dietary Guidelines for Americans. Similarly, 58.3% declared that they were
not aware of the WHO added sugar limit recommendations and the associated health benefits. In
conclusion, many students were not aware of their added sugar intake, and only a small
percentage were aware of the added sugar limit recommendations. Variables that influence
excess sugar consumption include taste preference, stress, and cost. Most of the students who
consider the sugar content of the foods and beverages they buy do so to help maintain a healthy
weight.

v
TABLE OF CONTENTS
Chapter Page
INTRODUCTION ......................................................................................................................................... 1
Health Concerns Related to Excess Added Sugar Consumption .................................................... 1
The World Health Organization Recommendations on Added Sugar ............................................ 1
The American Heart Association Recommendations on Added Sugar ........................................... 1
The 2015-2020 Dietary Guidelines on Added Sugar ...................................................................... 2
The Food and Drug Administration Proposal on Added Sugars ..................................................... 2
The Major Sources of Added Sugars ............................................................................................... 2
Hidden Sugars in Food .................................................................................................................... 2
LITERATURE REVIEW .............................................................................................................................. 6
A Worldwide Call to Reduce Added Sugar Consumption .............................................................. 6
Excess Added Sugar Consumption and Health Concerns ................................................................ 9
Attitudes and Behaviors toward Added Sugar Consumption ........................................................ 16
The purpose of the study ................................................................................................................ 18
METHODOLOGY ...................................................................................................................................... 19
Subjects ........................................................................................................................................... 19
Data Collection ............................................................................................................................... 19
Statistical Analyses ......................................................................................................................... 20
RESULTS .................................................................................................................................................... 21
Participant Characteristics .............................................................................................................. 21

vi
Table of Contents--Continued
Sugar-Sweetened Beverage Consumption ...................................................................................... 23
Added Sugar Names on Food and Beverages Labels ..................................................................... 24
Determining General Knowledge about Added Sugar ................................................................... 24
DISCUSSION .............................................................................................................................................. 27
Attitudes and Behaviors of College-aged Student Diets ................................................................ 27
Lack of Awareness about Added Sugar Consumption .................................................................... 27
Exceeding Added Sugar Recommended Limit ............................................................................... 28
Factors Influencing Added Sugar Consumption ............................................................................. 28
Lack of Awareness about Added Sugar Recommendations ............................................................ 29
Low Use of Non-nutritive Sweeteners ............................................................................................ 30
Limitations to Study ........................................................................................................................ 31
Future Research Recommendations ................................................................................................ 33
CONCLUSION ............................................................................................................................................ 33
REFERENCES.............................................................................................................................................. 36
APPENDIX .................................................................................................................................................. 46

vii
LIST OF TABLES
Table Page
1. Calorie Intake From Total Sugar-Sweetened Beverages among Young Adults from 1999–2000 to 2007–2008. .............................................................................................................................................................. 2
2. Different Names of Added Sugar .................................................................................................................. 3
3. Participant Characteristics ........................................................................................................................... 24
4. Non-nutritive Sweeteners Examples ........................................................................................................... 30

viii
LIST OF FIGURES
Figure Page
1. WHO Current and Proposed Recommendations ......................................................................................... 15
2. Food Category Sources of Added Sugar in U.S. Population (2016) ........................................................... 15
3. Participating Students’ Extent of Limiting Added Sugar ............................................................................ 25
4. Participating Students’ Knowledge About the American Heart Association Added (AHA) SugarRecommended Limit ................................................................................................................................... 25
5. Participating Students’ Knowledge About the 2015-2020 Dietary Guidelines Added Sugar RecommendedLimit ............................................................................................................................................................ 26
6. Participating Students’ Knowledge about the World Health Organization (WHO) Observed Benefits ofReducing Added Sugar ................................................................................................................................ 26
1
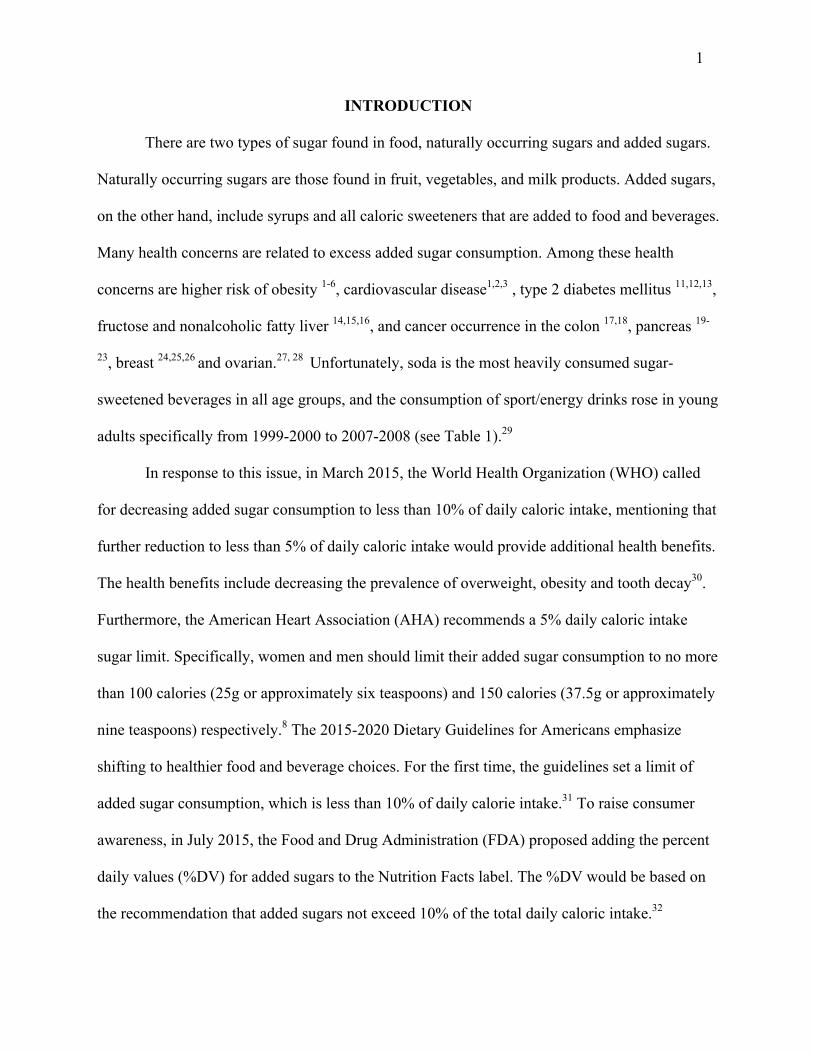
INTRODUCTION
There are two types of sugar found in food, naturally occurring sugars and added sugars.
Naturally occurring sugars are those found in fruit, vegetables, and milk products. Added sugars,
on the other hand, include syrups and all caloric sweeteners that are added to food and beverages.
Many health concerns are related to excess added sugar consumption. Among these health
concerns are higher risk of obesity 1-6, cardiovascular disease1,2,3 , type 2 diabetes mellitus 11,12,13,
fructose and nonalcoholic fatty liver 14,15,16, and cancer occurrence in the colon 17,18, pancreas 19-
23, breast 24,25,26 and ovarian.27, 28 Unfortunately, soda is the most heavily consumed sugar-
sweetened beverages in all age groups, and the consumption of sport/energy drinks rose in young
adults specifically from 1999-2000 to 2007-2008 (see Table 1).29
In response to this issue, in March 2015, the World Health Organization (WHO) called
for decreasing added sugar consumption to less than 10% of daily caloric intake, mentioning that
further reduction to less than 5% of daily caloric intake would provide additional health benefits.
The health benefits include decreasing the prevalence of overweight, obesity and tooth decay30.
Furthermore, the American Heart Association (AHA) recommends a 5% daily caloric intake
sugar limit. Specifically, women and men should limit their added sugar consumption to no more
than 100 calories (25g or approximately six teaspoons) and 150 calories (37.5g or approximately
nine teaspoons) respectively.8 The 2015-2020 Dietary Guidelines for Americans emphasize
shifting to healthier food and beverage choices. For the first time, the guidelines set a limit of
added sugar consumption, which is less than 10% of daily calorie intake.31 To raise consumer
awareness, in July 2015, the Food and Drug Administration (FDA) proposed adding the percent
daily values (%DV) for added sugars to the Nutrition Facts label. The %DV would be based on
the recommendation that added sugars not exceed 10% of the total daily caloric intake.32

2
Beginning July 2018, it will be required by the FDA to show added sugar in grams on food
labels.33
Moreover, added sugars account for almost 270 calories or more than 13% of calories per
day in the typical American diet. 32 The major source of added sugars is sugar-sweetened
beverages, which include soft drinks, fruit drinks, sweetened coffee and tea, energy/sports
drinks, and alcoholic beverages.32 Sugar-sweetened beverages account for almost half of all
added sugars consumed by Americans.32 Some data suggest that the consumption of total sugar-
sweetened beverages is declining. However, current consumption levels among all age groups
remain higher than recommended by health experts.30,31,32 Furthermore, added sugar can be
hidden in food products under different names. Examples of added sugars that can be listed as an
ingredient are found in table 2.
Table 1.
Calorie Intake From Total Sugar-Sweetened Beverages Among Young Adults from 1999–2000 to 2007–2008
Total Sugar-Sweetened Beverages
kcal/day
Regular Soda
kcal/day
Fruit Drinks
kcal/day
Sport/ Energy Drinks
kcal/day 1999–2000 421 374 279 119
2001–2002 389 322 309 176 2003–2004 391 342 285 223 2005–2006 333 278 265 158 2007–2008 338 295 231 229
Han E., Powell L. M. Consumption patterns of sugar-sweetened beverages in the United States. JAND. 2013;113(1),43-53.

3
Table 2.
Different names of added sugar
Names for added sugars on food labels
anhydrous dextrose brown sugar confectioner's powdered sugar corn syrup corn syrup solids dextrose fructose high-fructose corn syrup (HFCS) honey invert sugar lactose malt syrup maltose maple syrup molasses nectars (e.g., peach nectar, pear nectar) pancake syrup raw sugar sucrose sugar white granulated sugar
USDA.What are added sugars? Nov 2016 https://www.choosemyplate.gov/what-are-added-sugars * Note. Other names can be used for added sugars, but these are not recognized bythe FDA as an ingredient name. These include cane juice, evaporated corn sweetener, crystal dextrose, glucose, liquid fructose, sugar cane juice, and fruit nectar.

4
LITERATURE REVIEW
A Worldwide Call to Reduce Added Sugar Consumption
Recently, several research studies have observed that excess sugar consumption is related
to an excess in calorie accumulation, and may lead to a substantial number of health concerns.
Among these health problems are increased risk of risk of obesity1-7, cardiovascular disease8,9,10,
type 2 diabetes mellitus11,12,13, nonalcoholic fatty liver disease14,15,16, and cancer occurrence in
the colon17,18, pancreas19-23, breast24,25,26 and ovaries27, 28. In 2013, Han E. and Powell M.
concluded that added sugar intake has increased in the United States and worldwide over the past
fifteen years in all age groups, with the most significant increase in young adults. 29
With the results of recent research, it is not surprising that in March 2015, the World
Health Organization (WHO) called for decreasing added sugar consumption to less than ten
percent of daily caloric intake, noting that further reduction to less than 5% of daily caloric
intake would provide additional health benefits. These health benefits include decreasing the
prevalence of overweight, obesity and tooth decay 30. The American Heart Association (AHA)
recommends limiting the consumption of added sugar to 5% of the daily caloric intake.
Specifically, women and men should limit their added sugar consumption to no more than 100
calories and 150 calories respectively 8. Also, the 2015-2020 Dietary Guidelines for Americans
now recommends limiting added sugar consumption to less than 10% of the daily calorie intake.
For a 2000 daily calorie diet, this is approximately 200 calories, which is about the amount of
added sugar in just one regular 12 oz. soda beverage.31
In July 2015, the Food and Drug Administration (FDA) proposed changes to include the
percent daily value (%DV) of added sugars on the Nutrition Facts label. The %DV would be
based on the recommendation that daily calorie intake from added sugars dose not exceed 10%
5
of the total daily energy intake.32 On May 20, 2016, the FDA announced the new Nutrition Facts
label for packaged foods, which will show nutrition facts in an easier way to consumers.33 The
FDA published the final rules regarding the Nutrition Facts label update in the Federal Register
on May 27, 2016. Beginning in July 2018, the FDA will require manufacturers to show the
amount of added sugar per gram on food labels.33 Thus, allowing consumers to have a better
understanding of natural and processed added sugars. Also, the amount of added sugar will be
listed in grams; this will help consumers to calculate their added sugar intake and not exceed the
recommended limit.33
The Sugar Association is a trade group founded by the U.S. sugar industry that seeks to
educate people about the scientific study of sugar's role in food, and communicate that role to the
public. The Sugar Association called the FDA's label ruling “a dangerous precedent that is not
grounded in science.” 34 Furthermore, the Sugar Association published an article in May 2016
showing their disappointment in the FDA ruling requiring on added sugar gram and a daily
reference value (DRV) for added sugar on the Nutrition Facts Label. The Sugar Association
group said, “The extraordinary contradictions and irregularities, as well as the lack of scientific
justification in this rulemaking process, are unprecedented for the FDA”.34 They claimed that
they are concerned that this rule will set a dangerous precedent that is not grounded in solid
science and could keep people from buying healthy food options just because of their sugar
content.34
In July 2016, Cristin and coworkers distributed proposed that five decades of exploration
and research into the role of food and heart disease, including dietary proposals, and numerous
nutrition recommendations, may have been greatly influenced by the sugar industry.35
Specifically, in 1960, the sugar industry paid researchers and nutrition experts to point fault at fat

6
as the fundamental cause of heart disease. The report demonstrates that a trade group, called the
Sugar Research Foundation, currently known as The Sugar Association, paid a few Harvard
researchers about $50,000 to publish a 1967 review of research on sugar, fat and heart disease.35
It was determined that the studies utilized in the analysis were picked by the sugar group, and in
response to that, an article was published in the New England Journal of Medicine, minimizing
the connection between sugar and heart health and blaming saturated fat as the primary cause of
the problem.35 Today, heart disease is one of the leading causes of death around the world, and it
is important when reviewing the scientific literature to consider giving less weight to food
industry–funded studies and incorporate more research assessing the impact of added sugars on
various heart disease biomarkers.35
It is estimated that adults consume around 300 calories from added sugar per day, while
children consumed around 329 calories of added sugar per day in 2009-2010.36 These numbers
are much higher than the current recommendations on added sugar consumption.36 Moreover, the
AHA published a statement which reviewed and graded the current scientific evidence for
studies examining the relationship between cardiovascular health and added sugars consumption
in children and adolescents aged 2-18 years old. 37 The available literature was divided into five
areas: effects on blood pressure, lipids, insulin resistance and diabetes mellitus, nonalcoholic
fatty liver disease, and obesity. Substantial evidence supports the association of added sugars
with cardiovascular disease risk in children.37 The cardiovascular disease risk is due to an
increased energy intake, increased central adiposity, and dyslipidemia. The committee concluded
that it is appropriate to set a limit for added sugar consumption in children of ≤25 g (100
calories or approximately 6 teaspoons) of added sugars per day, and to strictly avoid added
sugars for children below two years old.37 In addition, the report recommended that children and
7
adolescents limit their intake of sugar-sweetened beverages to one or fewer 8 oz beverages per
week.37 This was the first actual scientific statement recommending a particular sugar limits for
children and adolescents.
Excess Added Sugar Consumption and Health Concerns
Diets that are high in simple sugars may result in decreased HDL cholesterol 38-43 and
elevated fasting triglycerides44-57 which are established risk factors for cardiovascular disease. In
2013, the AHA claimed that sugar-sweetened beverages including sodas, sports drinks, and fruit
drinks might be associated with an approximate 180,000 deaths around the world each year.58
The study calculated the quantities of sugar-sweetened beverages consumed by age and sex, the
effects of this consumption on obesity and diabetes rates; and the impact of obesity and diabetes-
related deaths. By using data collected as part of the 2010 Global Burden of Diseases Study, the
researchers linked the intake of sugar-sweetened beverages to 133,000 diabetes deaths, 44,000
deaths from cardiovascular diseases and 6,000 cancer deaths.58 Moreover, 78% of these deaths
were to over-consuming sugary drinks were in low and middle-income countries, rather than
high-income countries.58 The study concluded that consumption of sugar-sweetened beverages
can significantly contribute to excess body weight, and increase the risk of developing some
chronic diseases that eventually lead to death.
Jiantao et al believe that drinking sugar-sweetened beverages every day might affect the
risk of developing diabetes and heart disease risk. 59 Regular sugar-sweetened beverages intake
was significantly associated with an adverse change in both visceral adipose tissues quality and
quantity, whereas there was no similar association for diet soda. 59 This finding supports that
drinking sugar-sweetened beverages every day is associated with an increase in visceral adipose
8
tissue fat that may affect diabetes and heart disease risk. Moreover, growing evidence in showing
the health hazards associated with added sugar led the AHA to provide added sugar
recommendations for adults in 2009, and for children and young adults in 2016. 59 These findings
coincide with current dietary guidelines that suggest limiting the consumption of added sugar to
reduce the risk of developing associated health complications. 5,31
Added Sugar and Diabetes
The consumption of sugar-sweetened beverages can cause a dramatic increase in the risk
of type 2 diabetes mellitus.60-65 Regular consumption of sugar-sweetened drinks is strongly
associated with type 2 diabetes independent of obesity status.60 Imamura et al analyzed the
results of 17 observational studies, design and quality were taken into account to minimize bias,
and none of these studies were funded by industry. Frequent consumption of sugar-sweetened
beverages was associated with the incidence of type 2 diabetes, regardless of the weight status. 60
Moreover, consumption of artificially sweetened drinks and fruit juice was positively associated
with type 2 diabetes, but the quality of evidence was limited. 60 In 2013, Romaguera et al used
data on consumption of juices, sugar-sweetened soft drinks and artificially sweetened soft drinks
collected across eight European cohorts to study the link between sugar-sweetened beverages
consumption and type 2 diabetes. The researcher found that drinking at least one 12-ounce
serving size of sugar-sweetened soft drink a day was enough to increase the risk of developing
type 2 diabetes by 22%.65 This increased risk fell slightly to 18% when total energy intake and
body-mass index (BMI) were considered. This result could indicate that the effect of sugar-
sweetened drinks on diabetes goes beyond its effect on body weight.65
In 2016, an epidemiological analysis was done to distinguish the relationship between the
consumption of sugar-sweetened beverages with the risk of prediabetes and insulin resistance.66

9
The analysis found that people who regularly consumed sugar-sweetened beverages, about one
can of soda per day, had a 46% increased risk of developing prediabetes compared to low or non-
consumers over a 14-year period.66 Higher sugar-sweetened beverage intake was also associated
with increased insulin resistance, which is a risk factor for type 2 diabetes.66
Moreover, high consumption of sugar, specifically sugar-sweetened beverages, was
found to be linked to overall poor diet and nutrition.67 New research presented at the annual
meeting of the European Association for the Study of Diabetes (EASD) determined that a high
consumption of sugar-sweetened beverages was significantly associated with lower intakes of
foods generally considered healthy.67 The consumption intake differences between high and low
consumers of sugar-sweetened beverages were noted as fruits, vegetables, yogurt, whole wheat
and fish. People who consumed more sugar-sweetened beverages tended to eat less of these
healthy food choices.67 This study was cross-sectional; therefore, no conclusions about the exact
effect on health can be drawn. However, the authors concluded that the excessive sugar-
sweetened beverages consumption is associated with poor nutrition, which together can cause
health concerns leading to chronic diseases such as type 2 diabetes mellitus.67
Added Sugar Overweight and Obesity
The increasing consumption of sugar-sweetened beverages has been determined to
influence the obesity epidemic.68 There are 16 calories in one teaspoon of sugar; a typical 20-
ounce soda contains 15 to 18 teaspoons of sugar, which is around 240 Kcal from added sugar.69
People who drink sugar in a liquid form do not feel as full as if they had eaten the same calories
from solid food, which contribute to drinking high amounts of sugar.70 Before the 1950s, regular
soda drink bottles were 6.5 ounces. In the 1950s, soda pop drink companies produced larger sizes
including the 12-ounce can. In 1990, the 12-ounce can become the new regular size.71,72 By

10
2011, soda beverages were available in even larger sizes, such as the 42-ounce bottle.73
Furthermore, it was found that half of the people in the United States consumed sugar-sweetened
beverages; one in four people get at least 200 calories per day from these drinks; and 5% get at
least 567 calories, which is equal to five cans of soda.74 One of the major concerns is that sugar-
sweetened beverages are becoming one of the top calorie sources in the young adults’ diets (226
calories per day).75
The consumption of sugar-sweetened beverages is associated with an increase in
abdominal fat which increases the risk of heart disease and diabetes.59 A number of studies
demonstrate that an increased consumption of added sugar is significantly associated with total
and abdominal obesity.1,4,5,6,7 Furthermore, foods containing fructose and high-fructose corn
syrup specifically are found to have a greater relationship with obesity risk, as the effects of high
intake may have effects that build up over time and lead to accumulating excess fat.2,3 According
to Lustig “Fructose is like alcohol, fructose is metabolized directly into fat – not cellular energy,
like glucose.” 76 this means that dietary fructose might potently stimulate the pathways in which
the body convert excess carbohydrates into fatty acids, this is known as “lipogenesis”.76, 77
Duffey et al. tested the effect of replacing sugar-sweetened beverages with water on
energy intake and obesity prevalence.78 They replaced one 8-ounce sugar-sweetened beverage
with an 8-ounce serving of water, based on the daily dietary intake of American adults aged 19
and older. Among the U.S. adults who consume one serving of sugar-sweetened beverages per
day, substituting one drink with water lowered the percent of calories coming from drinks from
17% to 11%. 78 By using previously published randomized controlled trials (RCT) and meta-
analyses of steady weight loss, the researchers also predicted a decrease in obesity and an
increase in normal BMI in the population. 78

11
Added Sugar and Nonalcoholic Fatty Liver Disease
Nonalcoholic Fatty Liver Disease is characterized by the accumulation of triglycerides in
the liver cells that is unrelated to alcohol consumption,79 which can lead to liver damage.
NAFLD is a silent disease, around 25% of Americans with the disease don't experience any
symptoms in the early stages.79 Jiantao et al found an existing relationship between excess added
sugar consumption and NAFLD. It was indicated that there is a higher prevalence of NAFLD
among people who drink more than one sugar-sweetened beverage per day, compared to
individuals who drink no sugar-sweetened beverages.79
Moreover, obesity and overweight increase the risk for NAFLD, and people with NAFLD
tend to be at greater risk of developing chronic diseases such as cardiovascular disease and type
2 diabetes mellitus.79 Animal studies provided additional evidence on the role of fructose sugar
specifically in developing NAFLD.14,15,16,51 The lipogenic and proinflammatory effects of
fructose are related to transient ATP depletion by its rapid phosphorylation in the cell, and the
ability of fructose to increase intracellular and serum uric acid levels. 51
Added Sugar and Cancer
Some studies found a relationship between excess added sugar consumption and cancer
occurrence in the gastrointestinal tract, particularly in the colon and pancreas. Fuchs et al. tested
the association between sugar-sweetened beverage consumption on cancer recurrence and
mortality in patients who suffered from stage III colon cancer.80 The patients completed a food
frequency questionnaire as part of a U.S. National Cancer Institute-sponsored adjuvant
chemotherapy trial. In this study, a high sugar-sweetened beverage intake was associated with an
increased risk of cancer recurrence and mortality in patients with stage III colon cancer.80 In
addition, a community-based case–control study in Japan found that sugar intake was associated
12
with increased risk of colorectal cancer among smokers and non-alcohol drinkers in men.81
Moreover, elevated blood glucose concentrations have been shown to be associated with greater
risk of pancreatic cancer; some studies found that high fructose and sucrose intakes may play a
role in pancreatic cancer etiology.82,83,84 Cancer cells favor metabolizing fructose to increase cell
proliferation. Therefore, it appears that reducing refined fructose intake or inhibiting fructose-
mediated actions may disrupt and decrease tumor growth in patients with cancer.83 Another study
found that there is no overall significant greater risk of pancreatic cancer in men or women with
high intake of total added sugar. Bao et al. concluded that results from previous studies were
scarce and inconsistent.85
Some studies support an existing relationship between added sugar consumption and the
occurrence of cancer in breast and ovaries in women.86-88 Wong et al. found that high
consumption of sugar-sweetened soft drinks and sugar-sweetened fruit drinks were associated
with higher chance of developing breast cancer 86 Women who consumed > 0.5 servings per
day of regular soft drinks had increased odds of premenopausal breast cancer. 86 Moreover,
high glycemic index diets have been associated with an increased risk of breast cancer. Jiang et
al reported that mice which were fed an amount of sucrose and fructose similar to what is found
in a typical American diet developed breast cancer more than mice fed a low sugar diet.87
Furthermore, consuming foods that are high in added sugar raise insulin level in blood, and when
consumed in great amounts can lead to hyperinsulinemia which is found to increase endometrial
cancer risk .88,89 In fact, there is an indication that high added sugar intake might play a major
role in ovarian cancer development.27,28,89 The implication of these findings suggest that a diet
low in sugar may lower the risk of breast, endometrial and ovarian cancer.

13
Attitudes and Behaviors Toward Added Sugar Consumption
Young adulthood is a critical developmental period during the life cycle, in which many
health and nutrition habits are formed.90 In the U.S., it is the average consumption of sugar by all
age groups and especially adolescent and young adults exceed that recommended by WHO; not
only exceeding the proposed 5% limit, but also exceeding the current 10% added sugar limit (see
figure 1).30 Between 1999- 2008 the caloric intake from regular soda and fruit drinks decreased
in young adults. However, the average energy consumption of sports/energy drinks increased to
the largest extent among young adults (119 to 229 kcal/day). Unfortunately, young adults
population shows some of the most unhealthy dietary patterns of all age groups, characterized by
an inadequate consumption of fruits and vegetables and high consumption of fast food and sugar-
sweetened beverages.91,92,93 In fact, sugar-sweetened beverages are the leading single source of
empty calories in American adolescents’ and young adults’ diets.29 The most heavily consumed
sugar-sweetened beverage in those age groups are soda pop.29 Between 2000 and 2008, the
consumption of soda slightly decreased among young adults, however, sports and energy drinks
consumption tripled.29 The data indicates that serious steps need to be taken to reduce the
consumption of sugar-sweetened beverages among the young generation. Spreading awareness
could be the first step to reducing sugar consumption, as college students reported that
educational messages could be a helpful tool to reduce consumption of sugar-sweetened
beverages.94 Also, identifying the top sugar-sweetened beverages sources of added sugars such
as sugar-sweetened beverages and sugary snacks could help health professionals target
educational programs for healthier food and beverages choices (see figure 2).95

14
Figure 1. US Calories Consumption From Added Sugar Compared The Current WHO Recommendations. Data for 2-19 from 2005-08; Other Groups From 2005-10.30
Figure 2. Food Category Sources of Added Sugar in U.S. Population (2016)
15
Many factors can affect young adults’ attitudes and behaviors toward added sugar
consumption. Price was a top factor according to a study done at six colleges to distinguish
factors influencing sugar-sweetened beverages consumption among college students.94
Additionally, lack of awareness was found to be another influencing factor. In the same study,
only a few students mentioned that calorie content was important when making food choices,
and most declared that they were unaware of how many calories their drinks contain.94 Also,
there is some recognition of high sugar content in fruit juices, but many students considered it is
a healthy choice.94 Most of the students’ negative perceptions of sugar-sweetened beverages
focused predominantly on the negative health effect of sugar and chemical ingredients found in
soda.94
Presently, social media and social life can have a significant influence on food and
beverages choices. In fact, the sugar-sweetened beverage industry targets children and young
adults specifically through advertisements and promotions.95 In 2013, almost one-third of
advertisements for sugar-sweetened beverages and energy drink brands appeared on Facebook,
Twitter and YouTube targeting mostly the youth.95 In fact, social media marketing has been
increasing, and sugar-sweetened soda and energy drink brands represented 84% of these
Facebook likes, 86% of Twitter followers, and 95% of YouTube views.95 Moreover, young
adults’ dietary patterns appear to be affected by social norms. Young adults’ dietary behaviors
and attitudes appear to reflect their perceptions of normative behavior, particularly among
friends. However, sugar-sweetened beverages consumption among young adults is significantly
associated with the consumption of sugar-sweetened beverages among family and friends.95
Young people are particularly susceptible to the consumption of excess added sugar.
Thus, it is important to identify attitudes toward added sugar and consumption trends so that

16
public health educators and awareness campaign can address this issue. It can also help in
increasing the awareness of health issues associated with added sugar, and informing the
population how added sugar consumption can be controlled.
The purpose of the study
1. To review the association between excess added sugar consumption and associated health
concerns.
2. To demonstrate college-aged students’ attitudes and behaviors toward added sugar
consumption.
3. To investigate the knowledge level of the recommended limit of added sugar consumption.
4. To determine factors influencing excess added sugar consumption.
5. To determine students’ intention of using non-nutritive sweeteners.

17
METHODOLOGY
Subjects
The study took place at a private Catholic university in San Antonio, TX. The study
participants were 203 undergraduate students between the ages of 18 and 24 years of age.
Students who were less than 18 years of age or greater than 24 years of age were excluded.
Survey development
Survey response rate was 100%, completing the survey was entirely optional and all
survey information remained confidential. No names or other identifying information were asked
from the students. Additionally, all responses were combined with those of many others and
summarized. Participants did not experience any risk other than mild discomfort with trying to
remember their eating habits. The survey was approved by UIW Institutional Review Bord (IRB)
on 08/26/2016. IRB approval number is 16-08-005.
Data collection
Students were selected through a convenience sample of courses whose instructors
agreed to the survey. Participating classes were: Dimensions of wellness, euclidean and non-
euclidean geometry, geometry and proof, introduction to nutrition, mathematics for elementary
teachers II, and religious quest. A paper survey was administered to distinguish undergraduate
student knowledge, attitudes, and beliefs toward added sugar consumption (Appendix). A brief
educational presentation about added sugar consumption was be offered to participating classes
after data collection. It was in an infographic video that could be viewed on Blackboard®, used
by the professor, or could be presented to the class if requested by the instructor.

18
Statistical analyses
Data analysis was completed by December 2016. Data from the survey was entered
manually into SPSS. Descriptive statistics were performed.
19
RESULTS
Participant characteristics
The sample (n=203 at baseline; 72% females, and 28% males) included undergraduate
students 18 to 24 years old. The students self-identified as the following: 32.5% sophomores,
28% juniors, 26% freshmen, and 13.5% seniors. More than half of the participants (60.5%) lived
within driving distance of the institution. More than half of the students who participated in the
study either lived with their parents (36%) or with other students (30%). Only a small percentage
of the participants were athletes (15.8%) or members of an athletic club (3%). Fifty-five percent
of the students took a nutrition course in high school or college. The majority of the participants
(90.9%) were US students whereas 9.1% were foreign students. The Hispanic/Latino students
constituted 65%; 31.3% were white; 9.1% were African-American; 6.1% were Middle Eastern;
5.6% were Asian/Asian American; 1.5% were American Indian/Alaskan Native; 0.5% were
Pacific Islanders, and 1% identified as “other” (see Table 3).

20
Table 3.
Participant Characteristics Table
Variable Total
(n=203) Sex Male Female
Age in years 18-2021-24
Classification in college Freshman Sophmore Junior Senior
Living Distance Dormitory or other campus housing. Residence (house, apartment, etc.) within driving distance of the Institution. Residence (house, apartment, etc.) within Walking distance of the institution.
Athlete UIW college athlete UIW club athlete
Knowledge Took a nutrition class in high school or college
Student Status U.S. student Foreign student
Ethnic identification African American/Black American Indian/ Alaskan Native Asian/Asian American Hispanic/Latino Pacific Islander Middle Eastern/North African White Other
27.7% 72.3%
67.3% 32.7%
25.6% 33%
28.1% 13.3%
34% 61.1%
4.9%
15.8% 3%
55%
90% 9%
9% 1.5% 5.5%
65.5% 0.5%
6% 31% 1%

21
Sugar-Sweetened Beverages Consumption
A small percentage (7.5%) of the students who participated responded that they did not
consume sugar-sweetened soda pop/soft drinks on a regular basis. The most common serving
sizes for the majority who consumed soda pop/soft drinks were 8oz, followed by 12 oz.
Moreover, 19.3% opted to drink sugar-sweetened beverages (other than soda pop/soft drinks) at
least one time per day, while 35.4% responded to drink sugar-sweetened beverages several times
per week. The most consumed serving size of these sugar-sweetened beverages was 12 oz.
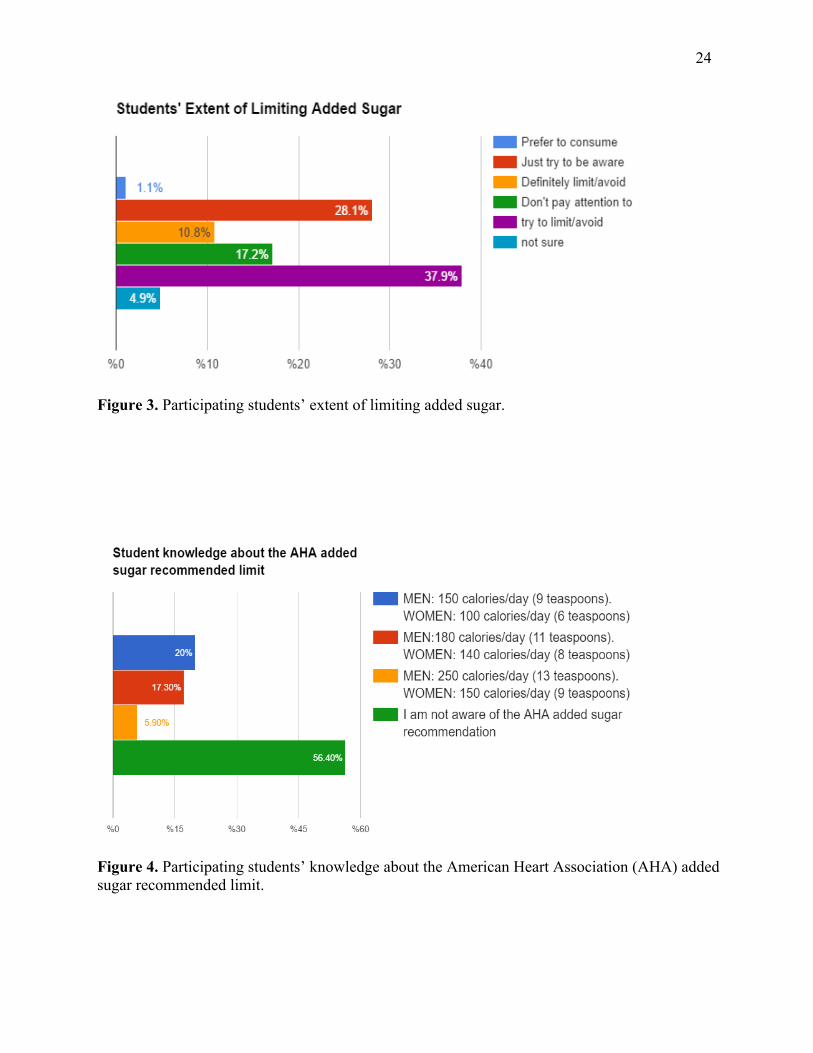
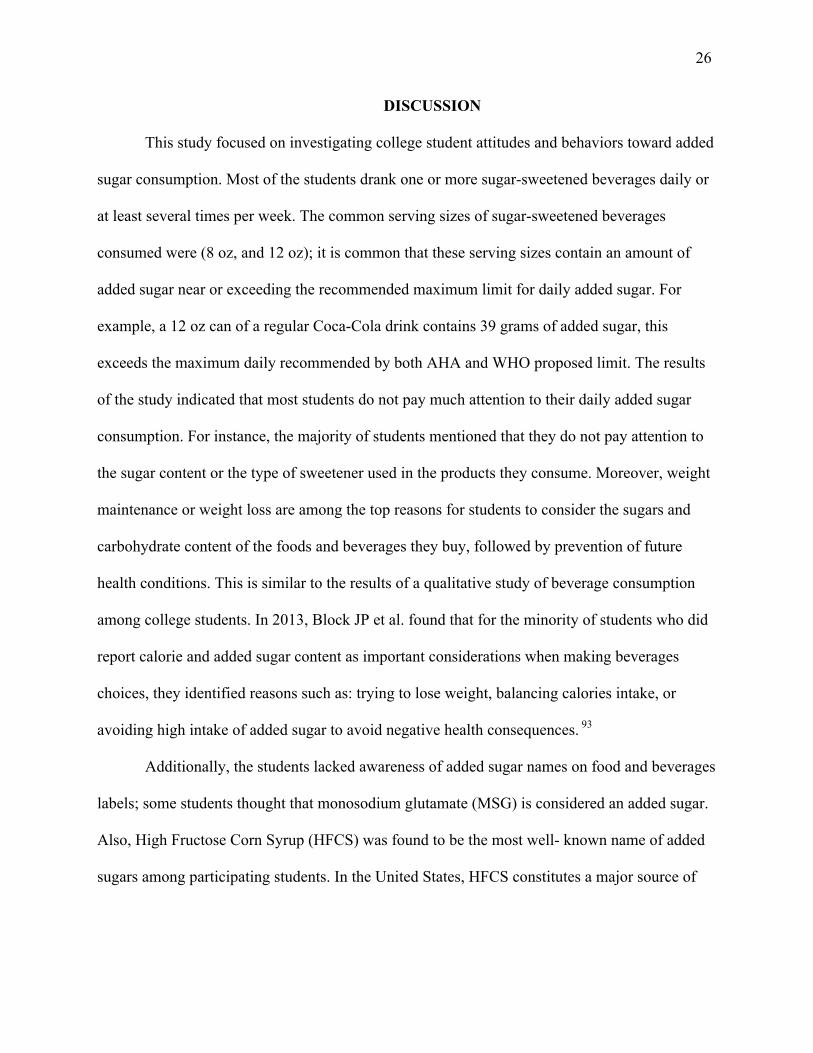
Attitudes Toward Added Sugar Consumption
Students who participated in the study rarely/never chose a product based on the type of
sweetener in the product. Only 11% of the participating students mentioned that they tried to
limit and/or avoid added sugars; 16.5% of respondents selected that they did not pay attention to
added sugar consumption; and 10% indicated that they were not sure. Moreover, over half (61%)
of the students considered the sugars, carbohydrate content of a food in order to help maintain a
healthy weight. Almost half (48.5%) responded that it was to prevent future health conditions,
and 40.5% indicated that it was to help provide energy for physical activities. A small
percentage of the students (20%) said they did not think about sugar and carbohydrate content
when making food and beverages purchases, as shown in Figure 3. The results of the study
indicated that only 2% of the students used artificial sweeteners and none claimed to use sugar
alcohols, and novel sweeteners (e.g. Stevia). Students were asked about factors influencing their
consumption of sugar-sweetened food or beverages. Almost three-quarters (73%) of respondents
indicated that appetite and/or taste often affect their consumption. Mood or stress caused 74% of
the students to alter their food and beverages choices. Nearly 74% stated that attitudes, beliefs, or

22
knowledge were rarely/never factors in food and beverages choices. Cost was a factor for 65% of
the students, meanwhile, 78% selected that access time or skills (e.g. cooking) can sometimes
play a role in choosing food and beverages. Moreover, most participants reported that they don’t
use sugar substitutes. However, the most non-nutritive sweeteners mentioned to be used were
artificial sweeteners (29.9%), followed by novel sweeteners (10.7%).
Added Sugar Names on Food and Beverages Labels
Some students identified different names of added sugars on food and beverages labels.
In fact, corn syrup was found to be the most well- known type of added sugars on food labels
(81.1%), more than fructose (71.1%), sucrose (54.2%), and maltose (33.7%). A little over a
quarter of the students (29.5 %) knew dextrose was an added sugar, roughly the same amount
identified nectar as an added sugar, meanwhile, only 23.7% were aware that cane crystals are
considered added sugar. The least selected name for added sugar (14.2%) was evaporated cane
sugar. Surprisingly, 11.2% thought that monosodium glutamate (MSG) salt is a name of an
added sugar on food and beverages labels.
Determining General Knowledge About Added Sugar
Nearly half (43.4%) of the participating students were aware that 4g of sugar is equal to
16 calories (1 teaspoon). An overwhelming majority of students who participated in the survey
(78.5%), knew that fruit flavored drinks contain very little fruit and are high in added sugar.
Fourteen percent thought that fresh fruit juices contain a high amount of fiber; yet 52% knew that
fresh fruit juices are a more concentrated source of simple sugars than whole fruits.

23
The questionnaire asked students about their current knowledge about added sugar
recommendations. Slightly over half (56.5%) stated they were unaware of the AHA added sugar
recommendations. Although, 20.5% were aware of the AHA maximum limit for added sugar
consumption per day, as shown in Figure 3. A little over half (54.4%) of the participating
students declared that they were not aware of the 2015-2020 Dietary Guidelines for Americans; a
mere 17.2% were aware of the 2015-2020 Dietary Guidelines recommended daily added sugar
limit, as shown in Figure 4. However, 58.3% indicated that they were not aware of the WHO
added sugar limit recommendations and the associated health benefits. A small percentage of
students, 19.1%, thought that the associated health benefits included reducing type 1 and type 2
diabetes mellitus, while only 15.1% were aware that the significant associated health benefits
included reducing the prevalence of overweight, obesity, and tooth decay, as shown in Figure 5.
24
Figure 3. Participating students’ extent of limiting added sugar.
Figure 4. Participating students’ knowledge about the American Heart Association (AHA) added sugar recommended limit.

25
Figure 5. Participating students’ knowledge about the 2015-2020 Dietary Guidelines added sugar recommended limit.
Figure 6. Participating students’ knowledge about the World Health Organization (WHO)
proposal limit and associated health benefits.
26
DISCUSSION
This study focused on investigating college student attitudes and behaviors toward added
sugar consumption. Most of the students drank one or more sugar-sweetened beverages daily or
at least several times per week. The common serving sizes of sugar-sweetened beverages
consumed were (8 oz, and 12 oz); it is common that these serving sizes contain an amount of
added sugar near or exceeding the recommended maximum limit for daily added sugar. For
example, a 12 oz can of a regular Coca-Cola drink contains 39 grams of added sugar, this
exceeds the maximum daily recommended by both AHA and WHO proposed limit. The results
of the study indicated that most students do not pay much attention to their daily added sugar
consumption. For instance, the majority of students mentioned that they do not pay attention to
the sugar content or the type of sweetener used in the products they consume. Moreover, weight
maintenance or weight loss are among the top reasons for students to consider the sugars and
carbohydrate content of the foods and beverages they buy, followed by prevention of future
health conditions. This is similar to the results of a qualitative study of beverage consumption
among college students. In 2013, Block JP et al. found that for the minority of students who did
report calorie and added sugar content as important considerations when making beverages
choices, they identified reasons such as: trying to lose weight, balancing calories intake, or
avoiding high intake of added sugar to avoid negative health consequences. 93
Additionally, the students lacked awareness of added sugar names on food and beverages
labels; some students thought that monosodium glutamate (MSG) is considered an added sugar.
Also, High Fructose Corn Syrup (HFCS) was found to be the most well- known name of added
sugars among participating students. In the United States, HFCS constitutes a major source of

27
dietary fructose. It is a major source of caloric sweeteners in soft drinks and many other sugar-
sweetened beverages.96,97
Similar to previous studies, among college students, appetite taste and price were among
the top factors when choosing food and beverages.93Additionally, peer pressure can also
influence food and beverage selection 94 ; in this study almost half of the students mentioned that
social life including family and friends on occasion had a great influence on their selections.
However, most participants believe that knowledge and beliefs were not found greatly influence
their selection of food and beverages.
It is alarming that a large percent of students declared that they are not aware of the
AHA, WHO, and 2015-2020 Dietary Guidelines recommendations on added sugar. There is a
lack of studies discussing the knowledge and awareness of college students or the general adult
population has about added sugar recommendations. However, in 2017, the AHA News shared a
survey from a leading health website which asked over 3,000 Americans about their attitudes,
habits and knowledge on the health effects of added sugar.98 The survey revealed that most
Americans are not aware of AHA’s recommended daily allowances for sugar consumption. Yet,
most people are aware of the added sugar health risks but do not know how to reduce added
sugar intake.98 Moreover, the WHO reported that by reducing added sugar consumption
overweight, obesity and tooth decay rates would decrease. However, many participants thought
that the reason for the WHO proposed recommendation is to reduce type 1 and type 2 diabetes
mellitus, which is not accurate. Unfortunately, these results show that there is certainly a lack of
knowledge about the current recommendations on added sugar. However, there was some
knowledge about added sugar in general. Around half of the students were aware of the number
of grams of sugar or calories in one teaspoon of sugar. Most students knew that fruit flavored
28
drinks were usually high in added sugar. In a similar study, the researchers concluded that not all
students were aware that while whole fruit can be a healthy choice and a good source of dietary
fiber, fruit juice is basically fruit sugar and contains little to no fiber.93
This study revealed that there is a low use of non-nutritive sweeteners. Non-nutritive
sweeteners are sweeteners that provide fewer calories per gram than sugar because they are not
completely absorbed by the digestive system (see Table 4). The most used type of sugar
substitute among students was artificial sweeteners. There are six artificial sweeteners approved
by the FDA; each one is far sweeter than regular sugar and has no calories. However, the health
effects of artificial sweeteners are inconclusive. Long-term studies show that regular
consumption of artificial sweeteners may lead to adverse health effects including weight gain 99,
induced glucose intolerance 100, and increased sugar craving.101 Recently, Pase et al. found that
high consumption of artificially sweetened soft drinks may be associated with increased risk of
both stroke and dementia.102 In fact, it is the first study to reveal that artificially sweetened
beverages, but not sugar-sweetened beverages, can increase the risk of stroke and dementia,
including Alzheimer’s disease.102

29
Table 4. Non-nutritive Sweeteners Examples
Types Names
Artificial Sweeteners Acesulfame potassium (Sunett, Sweet One) Aspartame (Equal, NutraSweet)
Neotame Saccharin (SugarTwin, Sweet'N Low)
Sucralose (Splenda) Advantame
Sugar Alcohols Erythritol Hydrogenated starch hydrolysate
Isomalt Lactitol Maltitol
Mannitol Sorbitol Xylitol
Noval Sweeteners Stevia extracts (Pure Via, Truvia) Tagatose (Naturlose)
Trehalose Monk fruit
Natural Sweeteners Honey Agave nectar
Date sugar Coconut sugar
Fruit juice concentrate Pure maple syrup
Molasses Brown rice syrup

30
Future investigation into the health effects of routine use of artificial sweeteners in the
diets of young adults is needed. Moreover, sugar alcohols are considered a common alternative,
however, in this study, none of the students mentioned the use of sugar alcohols. Sugar alcohols
have a taste similar to sucrose but increase blood glucose levels much less. Unlike sugar, sugar
alcohols do not cause cavities.103,104 The structures of sugar alcohols are similar to sugar but are
either poorly digested like maltitol, or poorly metabolized like erythritol.105 Sugar alcohols,
except erythritol, may also cause bloating and diarrhea when consumed in excessive amounts.105
However, when consumed regularly, most people develop a degree of tolerance and no longer
experience these undesirable symptoms. Moreover, in order to hydrogenate xylitol nickel is used,
which is a powdered nickel-aluminum alloy. This might pose the risk of heavy metal residue and
contamination.106 Also, there is currently a lack of literature on determining the health effects of
consuming hydrogenated sugar. Future investigation into the health effect of adding sugar
alcohol gradually to daily diet is needed.
Students did not identify using novel sweeteners such as stevia. Novel sweeteners are the
most recent sugar alternative addition to the diet. They are zero-calorie sweeteners, and they do
not raise blood glucose levels. The FDA has approved highly refined stevia preparations as a
novel sweetener. The WHO and UN's Joint Expert Committee on Food Additives also have ruled
stevia to be safe in moderation. Whole stevia leaves contain a number of active components.107
Steviol glycosides are described as having a sweet, clean taste at usual amounts but are bitter at
higher amounts.107, 108 Another novel sweetener, monk fruit extract, was recently approved as a
generally recognized as safe sweetener.109 It is 150 to 300 times sweeter than table sugar, and
contains zero calories per serving.109 Monk fruit extract has beneficial antioxidant properties.
However, it can have a mildly bitter taste when consumed in large amounts.109 Novel sweeteners

31
are less commonly used and may not have the negative health outcomes of other nonnutritive
sweeteners. Thus, more studies are needed to guide the young adult generation on the use of
novel sweeteners as a staple sugar substitute.
Moreover, participating students showed some intreset in using natural sugar substitutes.
Natural sweeteners like honey are sweeter than sugar; therefore, less is needed to achieve the
same level of sweetness. The vitamins present in honey are B6, thiamin, niacin, riboflavin,
pantothenic acid and certain amino acids. The minerals found in honey include calcium, copper,
iron, magnesium, manganese, phosphorus, potassium, sodium and zinc.110 The composition of
honey varies depending on the plants on which the bee feeds and richness of honey. However,
almost all natural honey contains a wide range of compounds including flavonoids, phenolics,
peptides, organic acids and enzymes.110 Many of those compounds work together to provide
synergistic antioxidant 111,112 and antibacterial effects.113,114 However, moderation is important
when using natural sweeteners, because consuming excess amounts of natural sweeteners can
lead to an increase in energy intake, blood glucose and dental cavities. Therefore, excess
consumption of natural sweeteners can lead to weight gain and/or increased triglycerides.10
Future research into the health benefits of routine use of natural sugars instead of processed
sugar and/or artificial sweeteners is needed.
Limitations to the Study
This study has some limitations. First, as mentioned previously this is a convenience
sample, it was done at one university in one location in the country, and therefore, it cannot be
generalized to the population of college-aged students. Second, the time frame which the
students had to finish the survey was limited during the class period. Indeed, some surveys were
32
distributed at the end of the class, so some students had to rush answering to leave the class.
However, many students seemed interested in the study and willing to participate, some students
even asked for extra time to complete the questionnaire. Third, answering in a classroom setting
may have affected the answers selected.
Future Research
A few recommendations for future research can be made based on the present study.
More studies are needed to determine the knowledge and behaviors young adults have regarding
added sugar recommendations. Further studies could examine the knowledge, attitudes, and
behaviors regarding the use of different types of non-nutritive sweeteners.
Conclusion for Added Sugar Consumption among College-Aged Students
This study found that among the college-aged students surveyed there is a lack of
knowledge about added sugar limit recommendations by AHA, WHO, and the 2010-2020
Dietary Guidelines for Americans. Factors found to influence excess added sugar consumption
were: taste, price and peer pressure. Most of the students try to avoid added sugar consumption
for weight management goals, followed by prevention from diseases associated with excess
sugar consumption. Furthermore, artificial sweeteners were the most non-nutritive sweeteners
used by students. However, there is a low intention of using other non-nutritive sweeteners such
as natural sweeteners, sugar alcohols, and novel sweeteners. This study indicates that added
sugar consumption is common in college-aged students, which may justify the need for expanded
efforts in the aim of reducing added sugar intake and emphasizing a healthy style eating pattern.
More studies are important to determine the knowledge and behaviors young adults have

33
regarding added sugar recommendations. Additionally, because of the lack of research for or
against the long term of using non-nutritive sweeteners recommendations is hard to be done.
Thus, further research is needed for the safety of routine use of non-nutritive sweeteners.

34
References
1. Bermudez OI, Gao X. Greater consumption of sweetened beverages and added sugars is associated with obesity among US young adults. Ann Nutr Metab. 2010;57(3-4):211-8.
2. Bray GA., Nielsen SJ, Popkin BM. Consumption of high- fructose corn syrup in beverages may
play a role in the epidemic of obesity. Am J Clin Nutr. 2004;79 (4):537-543
3. Kohli R, Kirby M, Xanthakos SA, Softic S, Feldstein AE, Saxena V, Tang PH, Miles L, Miles MV, Balistreri WF, Woods SC, Seeley RJ. High fructose, medium chain trans fat diet induces liver fibrosis and elevates plasma coenzyme Q9 in a novel murine model of obesity and nonalcoholic steatohepatitis. Hepatology.2010;52(3):934-44
4. Ludwig DS, Peterson KE, Gortmaker SL. Relation between consumption of sugar- sweetened
drinks and childhood obesity: A prospective, observational analysis. The Lancet. 2001; 357(9255), 505-508. doi:10.1016/S0140-6736(00)04041-1
5. Nelson MC, Story M, Larson NI, Neumark-Sztainer D, Lytle, LA. Emerging adulthood and
college-aged youth: An overlooked age for weight-related behavior change. Obesity. 2008;16(10):2205-11. doi: 10.1038/oby.2008.365.
6. Qi Q, Chu AY, Kang JH, Jensen MK, Curhan GC, Pasquale LR, Ridker PM, Hunter DJ, Willett
WC, Rimm EB, Chasman DI, Hu FB, Qi L. Sugar-sweetened beverages and genetic risk of obesity. N Engl J Med. 2012 Oct 11; 367(15):1387-96. doi: 10.1056/NEJMoa1203039.
7. Ruff RR, Akhund A, Adjoian T, Kansagra S. Calorie intake, sugar- sweetened beverage
consumption, and obesity among New York City adults: Findings from a 2013 population study using dietary recalls. J Community Health. 2014;39(6):1117-23. doi: 10.1007/s10900-014-9865-3.
8. Johnson RK, Appel LJ, Brands M, Howard BV, Lefevre M, Lustig RH, Sacks F, Steffen
LM, Wylie-Rosett J; American Heart Association Nutrition Committee of the Council on Nutrition, Physical Activity, and Metabolism and the Council on Epidemiology and Prevention. Dietary sugars intake and cardiovascular health: A scientific statement from the American Heart Association. Circulation. 2009;120(11):1011-20. doi: 10.1161/CIRCULATIONAHA.109.192627.
9. Dinicolantonio JJ, Lucan SC. The wrong white crystals: not salt but sugar as aetiological in
hypertension and cardiometabolic disease. Open Heart. 2014;1:e000167. doi: 10.1136/openhrt-2014-000167
10. Angelopoulos TJ, Lowndes J, Zukley L, Melanson KJ, Nguyen V, Huffman A, Rippe JM. The
effect of high-fructose corn syrup consumption on triglycerides and uric acid. J Nutr. 2009;139(6):1242S-1245S. doi: 10.3945/jn.108.098194. Epub 2009 Apr 29.
35
11. Schulze MB, Manson JE, Ludwig DS, Colditz GA, Stampfer MJ, Willett WC, Hu FB. Sugar- sweetened beverages, weight gain, and incidence of type 2 diabetes in young and middle- aged women. JAMA.2004;292(8):927-34.
12. Melanson KJ, Zukley L, Lowndes J, Nguyen V, Angelopoulos TJ, Rippe JM. Effects of high-
fructose corn syrup and sucrose consumption on circulating glucose, insulin, leptin, and ghrelin and on appetite in normal-weight women. Nutrition. 2007 Feb;23(2):103-12.
13. Lana A, Rodríguez-Artalejo F, Lopez-Garcia E. Consumption of sugar- sweetened beverages is
positively related to insulin resistance and higher plasma leptin concentrations in men and non overweight women. J Nutr. 2014 Jul;144(7):1099-105. doi: 10.3945/jn.114.195230.
14. Yilmaz Y. Review article: Fructose in nonalcoholic fatty liver disease. Aliment Pharmacol
Ther.2012 May;35(10):1135-44. doi: 10.1111/j.1365-2036.2012.05080.x.
15. Abdelmalek MF, Suzuki A, Guy C, Unalparida A, Colvin R, Johnson RJ, Diehl AM. Increased fructose consumption is associated with fibrosis severity in patients with nonalcoholic fatty liver disease. Hepatology. 2010 Jun;51(6):1961-71. doi: 10.1002/hep.23535.
16. Hung M, Ma J, Patel K, Berger S, Lau J, Lichtenstein AH. Fructose, high- fructose corn syrup,
sucrose, and nonalcoholic fatty liver disease or indexes of liver health: A systematic review and meta-analysis. Am J Clin Nutr. 2014 Sep;100(3):833-49. doi: 10.3945/ajcn.114.086314.
17. Fuchs MA, Sato K, Niedzwiecki D, Ye X, Saltz, Mayer R, Mowat R, Whittom R, Hantel A,
Benson A, Atienza D, Messino M, Kindler H, Venook A, Ogino S, Wu K, Willett W, Giovannucci E, Jeffrey A. Meyerhardt. Sugar-Sweetened Beverage Intake and Cancer Recurrence and Survival in CALGB 89803 (Alliance). Plos One. 9(6): e99816.
18. Wang Z, Uchida K, Ohnaka K, Morita M, Toyomura K, Kono S, Terasaka R. Sugars, sucrose
and colorectal cancer risk: The fukuoka colorectal cancer study. Scand J Gastroenterol. 2014; 49(5): 581–588.
19. Bao Y, Stolzenberg-Solomon R, Jiao L, Silverman DT, Subar AF, Park Y, Leitzmann
MF, Hollenbeck A, Schatzkin A, Michaud DS. Added sugar and sugar-sweetened foods and beverages and the risk of pancreatic cancer in the National Institutes of Health-AARP Diet and Health Study. Am J Clin Nutr. 2008; 88(2):431-40.
20. Jiao L, Flood A, Subar AF, Hollenbeck AR, Schatzkin A, Stolzenberg-Solomon R. Glycemic
index, carbohydrates, glycemic load, and the risk of pancreatic cancer in a prospective cohort study. 2009;18(4):1144-51. doi: 10.1158/1055-9965.EPI-08-1135.
21. Nöthlings U, Murphy SP, Wilkens LR, Henderson BE, Kolonel LN. Dietary glycemic load,
added sugars, 21 and carbohydrates as risk factors for pancreatic cancer: the Multiethnic Cohort Study. Am J Clin Nutr. 2007; 86 (5):1495-1501

36
22. Dietary glycemic load, added sugars, and carbohydrates as risk factors for pancreatic cancer: the Multiethnic Cohort Study. Am J Clin Nutr. 2007.
23. Larsson SC, Bergkvist L, Wolk A. Consumption of sugar and sugar-sweetened foods and the risk
of pancreatic cancer in a prospective study. Am J Clin Nutr. 2006; 84 (5): 1171-1176
24. Wong K. The Relationship between Sugar-sweetened Beverages Consumption and Breast Cancer. ProQuest Dissertations. 2015; publication number:1589154
25. Milliron B, Vitolins MZ, Tooze JA. Usual Dietary Intake among Female Breast Cancer
Survivors Is Not Significantly Different from Women with No Cancer History: Results of the National Health and Nutrition Examination Survey, 2003-2006. JAND. 2014 ;114(6):932-7. doi: 10.1016/j.jand.2013.08.015.
26. Wong, Kai Yi Karry. The Relationship between Sugar-sweetened Beverages Consumption and
Breast Cancer. ProQuest Dissertations. 2015. 1589154
27. King M. Consumption of sugary foods and drinks and risk of endometrial and ovarian cancers. Cancer Causes & Control. 24.7 (2013): 1427-436.
28. Silvera SA, Jain M, Howe GR, Miller AB, Rohan TE. Glycaemic index, glycaemic load and
ovarian cancer risk: a prospective cohort study. Public Health Nutr. 2007;10.
29. Han E., Powell L. M. Consumption patterns of sugar-sweetened beverages in the United States. JAND. 2013;113(1),43-53.
30. World Health Organization. Sugars intake for adult and children: Guideline. WHO.
ISBN:9789241549028. Published March 2015. Accessed Jan 20, 2017.
31. U.S. Department of Health and Human Services and U.S. Department of Agriculture. 2015-2020 Dietary Guidelines for Americans. 8th Edition. USDA. Published December 2015. Accessed Jan 20, 2017.
32. U.S. Food and Drug Administration. Proposed changes to the nutrition facts label. Worsening
depression and suicidality in patients being treated with antidepressant medications: FDA public health advisory. 2015.
33. Malik VS, Willett WC, Hu FB. The revised nutrition facts label a step forward and more room
for improvement. JAMA. 2016; 316(6):583-4. doi: 10.1001/jama.2016.8005.
34. The sugar association statement on FDA's added sugars declaration comments. The Sugar Association. www.sugar.org. Published May 20, 2016. Accessed Jan 20, 2017.
35. Cristin K, Schmidt L, and Glantz S. Sugar industry and coronary heart disease research: a
historical analysis of internal industry documents. JAMA. 2016; 176(11):1680-1685. doi: 10.1001/jamainternmed.2016.5394.

37
36. Powell E, Smith L, Popkin B, Recent Trends in Added Sugar Intake among U.S. Children and
Adults from 1977 to 2010. J Am Diet Assoc. 2011; 111(8):1156-64. doi: 10.1016/j.jada.2011.05.007.
37. Vos B, Kaar J, Welsh J, Van Horn L, Feig D, Anderson C, Patel M, Munos J, Krebs N,
Xanthakos S, and Johnson R. Added sugars and cardiovascular disease risk in children: a scientific statement from the American Heart Association. Circulation. 2016;135(19):e1017-e1034. doi: 10.1161/CIR.0000000000000439.
38. Mensink RP, Zock PL, Kester AD, Katan MB. Effects of dietary fatty acids and carbohydrates
on the ratio of serum total to HDL cholesterol and on serum lipids and apolipoproteins: a meta-analysis of 60 controlled trials. Am J Clin Nutr. 2003; 77(5):1146-55.
39. Appel LJ, Sacks F, Carey V, Obarzanek E, Swain JF, Miller, III E, Conlin P, Erlinger T, Rosner
B, Laranjo N, et al.; for the OmniHeart Collaborative Research Group. Effects of protein, monounsaturated fat, and carbohydrate intake on blood pressure and serum lipids: results of the OmniHeart randomized trial. JAMA. 2005;294(19):2455-64.
40. Chong MF, Fielding BA, Frayn KN. Mechanisms for the acute effect of fructose of postprandial
lipemia. Am J Clin Nutr. 2007 ;85(6):1511-20.
41. Fried SK, Rao SP. Sugars, hypertriglyceridemia, and cardiovascular disease. Am J Clin Nutr. 2003; 78(4):873S-880S.
42. Bantle JP, Raatz SK, Thomas W, Georgopoulos A. Effects of dietary fructose of plasma lipids in
healthy subjects. Am J Clin Nutr. 2000 ;72(5):1128-34.
43. Parks EJ, Skokan LE, Timlin MT, Dingfelder CS. Dietary sugars stimulate fatty acid synthesis in adults. J Nutr. 2008 ;138(6):1039-46.
44. Aeberli I, Gerber PA, Hochuli M, Kohler S, Haile SR, Gouni-Berthold I, Berthold HK, Spinas
GA, Berneis K. Low to moderate sugar-sweetened beverage consumption impairs glucose and lipid metabolism and promotes inflammation in healthy young men: a randomized controlled trial. Am J Clin Nutr. 2011; ;94(2):479-85. doi: 10.3945/ajcn.111.013540.
45. Antar MA, Little JA, Lucas C, Buckley GC, Csima A. Interrelationship between the kinds of
dietary carbohydrate and fat in hyperlipoproteinemic patients. 3. Synergistic effect of sucrose and animal fat on serum lipids. Atherosclerosis. 1970;11(2):191-201.
46. Bantle JP, Swanson JE, Thomas W, Laine DC. Metabolic effects of dietary sucrose in type II
diabetic subjects. Diabetes Care.1993;16(9):1301-5.
47. Black RN, Spence M, McMahon RO, Cuskelly GJ, Ennis CN, McCance DR, Young IS, Bell PM, Hunter SJ. Effect of eucaloric high- and low-sucrose diets with identical macronutrient

38
profile on insulin resistance and vascular risk: a randomized controlled trial. Diabetes. 2006;55(12):3566-72
48. Cooper PL, Wahlqvist ML, Simpson RW. Sucrose versus saccharin as an added sweetener in
non-insulin-dependent diabetes: short- and medium-term metabolic effects. Diabet Med. 1988;5(7):676-80.
49. Groen JJ, Balogh M, Yaron E, Cohen AM. Effect of interchanging bread and sucrose as main
source of carbohydrate in a low fat diet on the serum cholesterol levels of healthy volunteer subjects. Am J Clin Nutr.1966 ;19(1):46-58.
50. Lowndes J, Kawiecki D, Pardo S, Nguyen V, Melanson KJ, Yu Z, Rippe JM. The effects of four
hypocaloric diets containing different levels of sucrose or high fructose corn syrup on weight loss and related parameters. Nutr J. 2012; DOI: 10.1186/1475-2891-11-55
51. Maersk M, Belza A, Stødkilde-Jørgensen H, Ringgaard S, Chabanova E, Thomsen H, Pedersen
SB, Astrup A, Richelsen B. Sucrose-sweetened beverages increase fat storage in the liver, muscle, and visceral fat depot: a 6-mo randomized intervention study. Am J Clin Nutr. 2012;95(2):283-9. doi: 10.3945/ajcn.111.022533.
52. Marckmann P, Raben A, Astrup A. Ad libitum intake of low-fat diets rich in either starchy foods
or sucrose: effects on blood lipids, factor VII coagulant activity, and fibrinogen. Metabolism. 2000;49(6):731-5.
53. Raben A, Vasilaras T, Møller A, Astrup A. Sucrose compared with artificial sweeteners:
different effects on ad libitum food intake and body weight after 10 wk of supplementation in overweight subjects. Am J Clin Nutr. 2002;76(4):721-9.
54. Sorensen LB, Raben A, Stender S, Astrup A. Effect of sucrose on inflammatory markers in
overweight humans. Am J Clin Nutr. 2005;82(2):421-7.
55. Stanhope KL, Griffen S, Bair B, Swarbrick M, Kelm N, Havel P. Twenty four hour endocrine and metabolic profiles following consumption of high-fructose corn syrup-, sucrose-, fructose-, and glucose-sweetened beverages with meals. Am J Clin Nutr.2008; 87(5):1194-203.
56. Teff KL, Grudziak J, Townsend RR, Dunn TN, Grant RW, Adams SH. Endocrine and metabolic
effects of consuming fructose- and glucose-sweetened beverages with meals in obese men and women: influence of insulin resistance on plasma triglyceride responses. J Clin Endocrinol Metab. 2009; 94(5):1562-9. doi:10.1210/jc.2008-2192.
57. Stanhope KL et al. Consumption of fructose and high fructose corn syrup increase postprandial
triglycerides, LDL-cholesterol, and apolipoprotein-B in young men and women. J Clin Endocrinol Metab. 2011;96(10):E1596-605. doi: 10.1210/jc.2011-1251.
58. American Heart Association. 180,000 deaths worldwide each year may be associated with sugary soft drinks, research suggests. AHA.19 Published March 2013. Accessed May 2016.
39
59. Jiantao Ma, Nicola M, Shih-Jen H, Udo H, Paul J, Caroline F. Sugar-Sweetened Beverage
Consumption is Associated With Change of Visceral Adipose Tissue Over 6 Years of Follow-Up. Circulation, 2016; 133(4): 370–377.
60. Imamura F, O'Connor L, Ye Z, Mursu J, Hayashino Y, Bhupathiraju SN, Forouhi NG.
Consumption of sugar sweetened beverages, artificially sweetened beverages, and fruit juice and incidence of type 2 diabetes: systematic review, meta-analysis, and estimation of population attributable fraction. BMJ, 21 July 2015, 351. doi: https://doi.org/10.1136/bmj.h3576
61. Basu S, McKee M, Galea G, Stuckler D. Relationship of soft drink consumption to global
overweight, obesity, and diabetes: a cross-national analysis of 75 countries. Am J Public Health. 2013; 103(11):2071-7. doi: 10.2105/AJPH.2012.300974
62. Stanhope KL. Role of fructose-containing sugars in the epidemics of obesity and metabolic
syndrome. Annu Rev Med. 2012 ;63:329-43. doi: 10.1146/annurev-med-042010-113026.
63. Weed DL, Althuis MD, Mink PJ. Quality of reviews on sugar-sweetened beverages and health outcomes: a systematic review. Am J Clin Nutr.2011 ;94(5):1340-7. doi: 10.3945/ajcn.111.015875.
64. Greenwood DC, Threapleton DE, Evans CEL, et al. Association between sugar-sweetened and
artificially sweetened soft drinks and type 2 diabetes: systematic review and dose-response meta-analysis of prospective studies. Br J Nutr. 2014 ;112(5):725-34. doi: 10.1017/S0007114514001329.
65. Romaguera et al. The InterAct consortium. Consumption of sweet beverages and type 2 diabetes
incidence in European adults: results from EPIC-InterAct. Diabetologia, 2013;56(7):1520-30. doi: 10.1007/s00125-013-2899-8.
66. Ma J, Jacques P, Meigs J, Fox , Rogers G, Smith C, Hruby A, Saltzman E, and McKeown N.
Sugar-Sweetened Beverage but Not Diet Soda Consumption Is Positively Associated with Progression of Insulin Resistance and Prediabetes. J. Nutrition, 2016; doi:10.3945/jn.116.234047
67. Diabetologia. High consumption of sugar sweetened beverages linked to overall poor diet. Published September 21, 2015. Accessed May 23, 2016.
68. Glickman D, Parker L, Sim LJ, Del Valle Cook H, Miller EA. Institute of Medicine. Accelerating Progress in Obesity Prevention: Solving the Weight of the Nation. Washington, DC: National Academies Press, 2012.
69. US Department of Agriculture. Nutrient data for 14400, Carbonated beverage, cola, contains caffeine. National Nutrient Database for Standard Reference. 2012.
70. Pan A, Hu FB. Effects of carbohydrates on satiety: differences between liquid and solid food. Curr Opin Clin Nutr Metab Care. 2011;14:385-90.
40
71. The Coca-Cola Company. History of Bottling. Accessed June 21, 2012, http://www.thecoca-colacompany.com/ourcompany/historybottling.html
72. Jacobson M. Liquid Candy: How Soft Drinks are Harming Americans’ Health. Washington, DC: Center for Science in the Public Interest, 2005.
73. The Coca-Cola Company. 1.25 For 125! New 1.25 Liter Coca-Cola Package Rolls Out as Part of Brand’s 125th Anniversary Celebration 2011. Accessed June 25, 2012, http://www.thecoca-colacompany.com/dynamic/press_center/2011/05/125-for-125.html
74. Ogden CL, Kit BK, Carroll MD, Park S. Consumption of sugar drinks in the United States, 2005-2008. NCHS Data Brief. 2011; 1-8.
75. Mean Intake of Energy and Mean Contribution (kcal) of Various Foods Among US Population, by Age, NHANES 2005–06. National Cancer Institute. 2016.
76. Consumption of sweet beverages and type 2 diabetes incidence in European adults: results from EPIC-InterAct. The InterAct consortium. Diabetologia. 2013; 56(7):1520-30. doi: 10.1007/s00125-013-2899-8.
77. Varman S. Fructose induced lipogenesis: from sugar to fat to insulin resistance.Trends Endocrin
Met. 2011 ;22(2):60-5. doi: 10.1016/j.tem.2010.10.003.
78. Duffey K, Poti J. Modeling the effect of replacing sugar-sweetened beverage consumption with water on energy intake, HBI score, and obesity prevalence. Nutrients. 2016; 8(7): 395
79. Jiantao et al. Sugar-sweetened beverage, diet soda, and fatty liver disease in the Framingham Heart Study cohorts. Journal of Hepatology, 2015 ;63(2):462-9. doi: 10.1016/j.jhep.2015.03.032.
80. Fuchs M., Sato K., Niedzwiecki D., Ye X., Saltz B., Mayer J, Meyerhardt A. Sugar-sweetened
beverage intake and cancer recurrence and survival in CALGB. Plos One. 2014 ;9(6):e99816. doi:10.1371/journal.pone.0099816
81. Wang Z, Uchida K, Ohnaka K, Morita M, Toyomura K, Kono S, Terasaka R. Sugars, sucrose and colorectal cancer risk: The fukuoka colorectal cancer study. Scand J Gastroenterol. 2014; 49(5): 581-588.
82. Dietary glycemic load; added sugars; and carbohydrates as risk factors for pancreatic cancer: the multiethnic cohort study. Glycemic Load & Cancer Risk. Nutrition Research Newsletter. 2007; 26(12):4.
83. Jee SH, Ohrr H, Sull JW, Yun JE, Ji M, Samet JM. Fasting serum glucose level and cancer risk in Korean men and women. JAMA. 2005;293:194–202.
84. Larsson SC, Bergkvist L, Wolk A. Consumption of sugar and sugar-sweetened foods and the risk of pancreatic cancer in a prospective study. Am J Clin Nutr. 2006;84(5):1171.
41
85. Bao Y et al. Added sugar and sugar-sweetened foods and beverages and the risk of pancreatic cancer in the National Institutes of Health-AARP Diet and Health Study. Am J Clin Nutr. 2008;88(2):43.
86. Wong, Kai, Baumgart, Charlotte, McCann, Susan, and Weiss, Edward. The relationship between sugar-sweetened beverages consumption and breast cancer. ProQuest Dissertations. 2015.
87. Jiang Y, Pan Y, Rhea P, Tan L, Gagea M, Cohen L, Fischer S, Yang P. Sucrose-enriched diet promotes tumorigenesis in mammary gland in part through the 12-Lipoxygenase pathway. Cancer Res. 2016 Jan 1; 76(1): 24–29.
88. Galeone C, Augustin LS, Filomeno M, et al. Dietary glycemic index, glycemic load, and the risk
of endometrial cancer: a case-control study and meta-analysis. Eur J Cancer Prev. 2013;22:38–45.
89. King M. Consumption of sugary foods and drinks and risk of endometrial and ovarian cancers.
Cancer Causes & Control. 2013; 24(7): 1427–1436.
90. Nelson MC, Story M, Larson NI, et al. Emerging adulthood and college-aged youth: an overlooked age for weight-related behavior change. Obesity (Silver Spring) 2008;16(10):2205–2211.
91. Guenther PM, Dodd KW, Reedy J, et al. Most Americans eat much less than recommended
amounts of fruits and vegetables. J Am Diet Assoc. 2006;106(9):1371–1379.
92. Paeratakul S, Ferdinand DP, Champagne CM, et al. Fast-food consumption among US adults and children: dietary and nutrient intake profile. J Am Diet Assoc. 2003;103(10):1332–1338.
93. Block JP, Gillman MW, Linakis SK, Goldman RE. “If it Tastes Good, I’m Drinking It”:
Qualitative Study of Beverage Consumption among College Students. The Journal of adolescent health: official publication of the Society for Adolescent Medicine. 2013;52(6):702-706. doi:10.1016/j.jadohealth.2012.11.017.
94. Reedy J, Krebs-Smith SM. Dietary Sources of Energy, Solid Fats, and Added Sugars Among
Children and Adolescents in the United States. JADA. 2010;110(10):1477-1484. doi:10.1016/j.jada.2010.07.010.
95. Pelletier JE, Graham DJ, Laska MN. Social Norms and Dietary Behaviors Among Young
Adults. Am J Health Behav. 2014;38(1):10.5993/AJHB.38.1.15. doi:10.5993/AJHB.38.1.15.
96. Bray GA1, Nielsen SJ, Popkin BM. Consumption of high-fructose corn syrup in beverages may play a role in the epidemic of obesity. Am J Clin Nutr. 2004 ;79(4):537-43.
97. Ogden CL, Kit BK, Carroll MD, Park S. Consumption of sugar drinks in the United States,
2005–2008. NCHS data brief, no 71. Hyattsville, MD: National Center for Health Statistics. 2011;(71):1-8.

42
98. Forte N, Foundeur P, Lascurain N. Survey: Sugar is bad, but people can’t stop eating it. AHA news. Published Nov 2016. Accesd May 2017.
99. Swithers SE, Davidson TL. A role for sweet taste: calorie predictive relations in energy
regulation by rats. Behav Neurosci. 2008; 122:161–173.
100. Suez J et al. Artificial sweeteners induce glucose intolerance by altering the gut microbiota.Nature. 2014 Oct;514(7521):181-6. doi: 10.1038/nature13793.
101. Liem DG, de Graaf C. Sweet and sour preferences in young children and adults: role of repeated exposure. Physiol Behav. 2004;83:421–429.
102. Pase MP, Himali JJ, Beiser AS, Aparicio HJ, Satizabal CL, Vasan RS, Seshadri S, Jacques PF. Sugar- and Artificially Sweetened Beverages and the Risks of Incident Stroke and Dementia. Stroke. 2017;STROKEAHA.116.016027.
103. Hayes C. The Effect of Non-Cariogenic Sweeteners on the Prevention of Dental Caries: A Review of the Evidence. J Dent Educ. 2001; Oct;65(10):1106-9.
104. U.S. Food and Drug Administration. Nutrition facts label programs and materials nutrition facts label: sugar alcohols - FDA. 2017 https://www.accessdata.fda.gov/scripts/.../factsheets/Sugar_Alcohols.pdf.
105. Medical Encyclopedia. Sweeteners: sugars. Retrieved April 11, 2017, from https://medlineplus.gov/ency/article/002444.htm
106. Converti A, Parego P, Dominguez, Jose M. Xylitol Production from Hardwood Hemicellulose
Hydrosylates. Applied Biochemistry and Biotechnology. 1999; 82: 141–151. doi:10.1385/abab:82:2:141
107. Ulbricht C, Isaac R, Milkin T, et al. An evidence-based systematic review of stevia by the
Natural Standard Research Collaboration. Cardiovasc Hematol Agents Med Chem. 2010;8:113-127.
108. Goyal SK, Samsher, Goyal RK. Stevia (stevia rebaudiana) a bio-sweetener: A review. Int J Food
Sci Nutr. 2010;61(1):1-10. 109. Prakash I, DuBois GE, Clos JF, Wilkens KL, Fosdick LE. Development of rebiana, a natural,
non-caloric sweetener. Food Chem Toxicol. 2008;46(7 suppl):S75-S82. 110. White JW. Composition of honey. In: Crane E, editor. Honey: A Comprehensive Survey.
London: Heinemann; 1979; 157–192. 111. Alvarez-Suarez JM, Tulipani S, Romandini S, Bertoli E, Battino M. Contribution of honey in
nutrition and human health: a review. Mediterr J Nutr Metab. 2010;3:15–23.
43
112. Al-Mamary M, Al-Meeri A, Al-Habori M. Antioxidant activities and total phenolics of different types of honey. Nutr Res. 2002; 22:1041–1047.
113. Al-Waili NS, Haq A. Effect of honey on antibody production against thymus-dependent and thymus-independent antigens in primary and secondary immune responses. J Med Food. 2004;7:491–494.
114. Emsen IM. A different and safe method of split thickness skin graft fixation: Medical honey application. Burns. 2007;33:782–787.
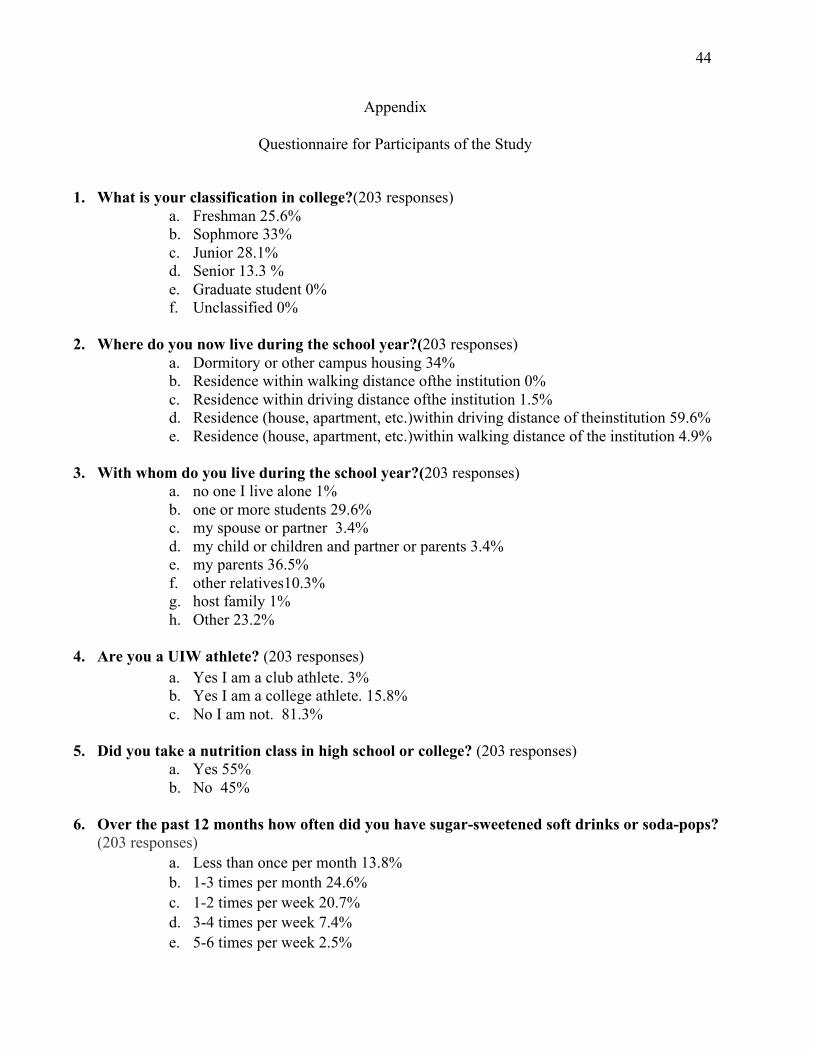
44
Appendix
Questionnaire for Participants of the Study
1. What is your classification in college?(203 responses) a. Freshman 25.6%b. Sophmore 33%c. Junior 28.1%d. Senior 13.3 %e. Graduate student 0%f. Unclassified 0%
2. Where do you now live during the school year?(203 responses)a. Dormitory or other campus housing 34%b. Residence within walking distance ofthe institution 0%c. Residence within driving distance ofthe institution 1.5%d. Residence (house, apartment, etc.)within driving distance of theinstitution 59.6%e. Residence (house, apartment, etc.)within walking distance of the institution 4.9%
3. With whom do you live during the school year?(203 responses)a. no one I live alone 1%b. one or more students 29.6%c. my spouse or partner 3.4%d. my child or children and partner or parents 3.4%e. my parents 36.5%f. other relatives10.3%g. host family 1%h. Other 23.2%
4. Are you a UIW athlete? (203 responses)a. Yes I am a club athlete. 3%b. Yes I am a college athlete. 15.8%c. No I am not. 81.3%
5. Did you take a nutrition class in high school or college? (203 responses)a. Yes 55%b. No 45%
6. Over the past 12 months how often did you have sugar-sweetened soft drinks or soda-pops?(203 responses)
a. Less than once per month 13.8%b. 1-3 times per month 24.6%c. 1-2 times per week 20.7%d. 3-4 times per week 7.4%e. 5-6 times per week 2.5%
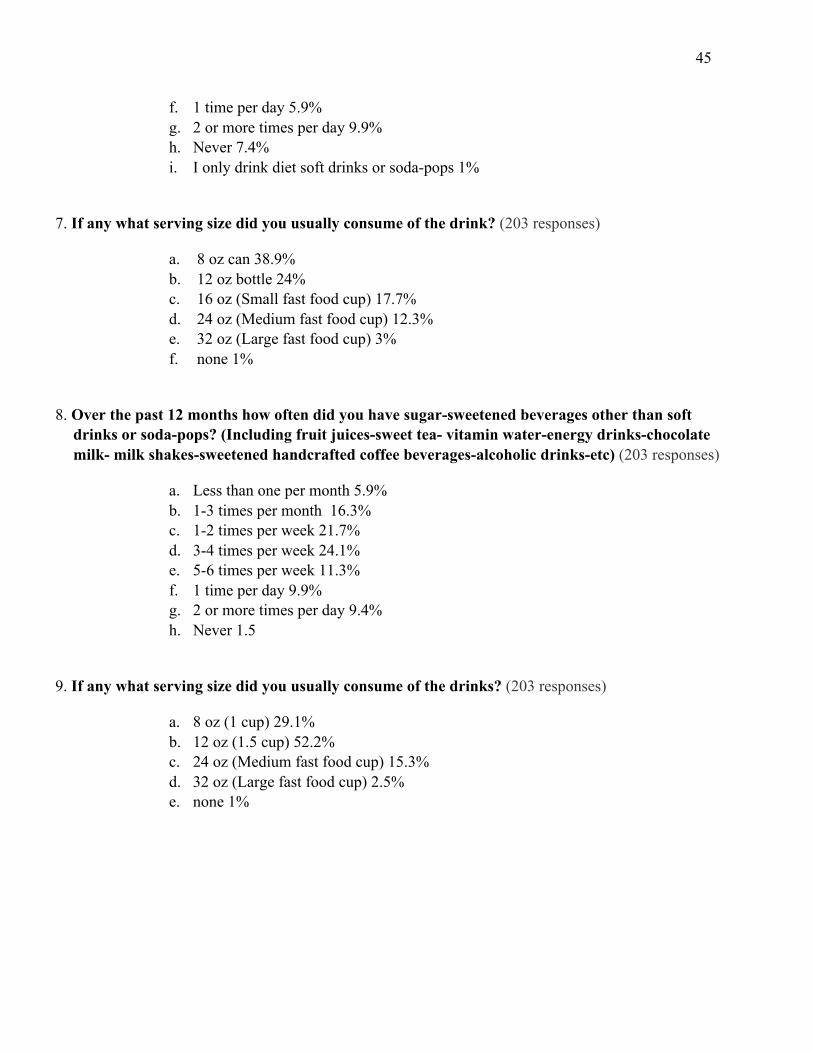
45
f. 1 time per day 5.9% g. 2 or more times per day 9.9% h. Never 7.4% i. I only drink diet soft drinks or soda-pops 1%
7. If any what serving size did you usually consume of the drink? (203 responses)
a. 8 oz can 38.9% b. 12 oz bottle 24% c. 16 oz (Small fast food cup) 17.7% d. 24 oz (Medium fast food cup) 12.3% e. 32 oz (Large fast food cup) 3% f. none 1%
8. Over the past 12 months how often did you have sugar-sweetened beverages other than soft drinks or soda-pops? (Including fruit juices-sweet tea- vitamin water-energy drinks-chocolate milk- milk shakes-sweetened handcrafted coffee beverages-alcoholic drinks-etc) (203 responses)
a. Less than one per month 5.9% b. 1-3 times per month 16.3% c. 1-2 times per week 21.7% d. 3-4 times per week 24.1% e. 5-6 times per week 11.3% f. 1 time per day 9.9% g. 2 or more times per day 9.4% h. Never 1.5
9. If any what serving size did you usually consume of the drinks? (203 responses)
a. 8 oz (1 cup) 29.1% b. 12 oz (1.5 cup) 52.2% c. 24 oz (Medium fast food cup) 15.3% d. 32 oz (Large fast food cup) 2.5% e. none 1%

46
10. How often do these factors influence your consumption of sugar-sweetened food or beverages? (203 responses)
OFTEN
ALWAYS SOMETIMES RARELY/NEVER
a. Appetite and/or taste
73% 47% 63% 19%
b. Mood and/or stress
45% 27% 74% 55%
c. Attitudes beliefs and/or knowledge about food
31% 32% 64% 74%
d. Cost 42% 30% 65% 62%
e. Access time and/or skills (e.g. cooking)
35% 39% 78% 47%
f. Family and/or peers
29% 17% 76% 78%
11. Over the past 12 months have you added solid caloric sweeteners to your food or beverages? (Oatmeal- cereal- coffee- tea-etc) (200 responses)
a. White sugar 49% b. Brown sugar 19.5% c. Coconut sugar 3% d. Date sugar 0.5% e. Turbinado or demerara sugar 0% f. Jaggery sugar 0% g. No I didn't use any 1% h. Other 41%

47
12. If any what is the total amount of the selected solid caloric sweeteners was used? (202 responses)
a. 1 packet per day (1 teaspoon) 7.9% b. 2 packets per day (2 teaspoons) 15.8% c. 3 packets per day (3 teaspoons) 3% d. 4 packets per day (4 teaspoons) 3% e. 5 packets per day (5 teaspoons) 0.5% f. More than 5 packets per day (5+ teaspoons) 0.5% g. 1-2 packets per week 12.4% h. 3-4 packets per week 8.9% i. None 41% j. Other 6.9%
13. Over the past 12 months have you added liquid caloric sweeteners to your food or beverages? (Pancakes- oatmeal-smoothies-coffee-tea-etc) (200 responses)
a. Agave 4% b. Brown rice syrup 0.5% c. Honey 23% d. Pancake syrup 38% e. Pure maple syrup 8% f. Molasses 0.5% g. No i didn't use any 1% h. Other 40.5%
14. If any what is the total amount of the selected liquid caloric sweeteners was used? (200 responses)
a. Less than 1 Tablespoon per day 18.3% b. 1 Tablespoon per day 18.3% c. 2 Tablespoons per day 6.9% d. 3 Tablespoons per day 2% e. 4 Tablespoons per day (equals 1/4 cup) 2.5% f. 5+ Tablespoons per day 1% g. 1-2 Tablespoons per week 17.3% h. 3-4 Tablespoons per week 5% i. None 39.6%

48
15. Over the past 12 months have you add solid and/or liquid low-caloric sweeteners to your food or beverages? (198 responses)
a. Stevia-Truvia-Purevia. 0% b. Artificial sweeteners (Splenda-Sweet'nLow-Equal-NutraSweet). 1% c. Sugar alcohols ( Xylitol-Erythritol-Sorbitol- Mannitol). 0% d. No I didn't use any. 1% e. Other. 106%
16. If any what is the total amount of the selected low caloric sweeteners was used? (200 responses)
a. Less than 1 packet per day (< 1 teaspoon) or (< 2-4 drops) 59.5% b. 1 packet per day (1 teaspoon) or (2-4 drops) 9% c. 2 packets per day (2 teaspoons) or (4-8 drops) 7% d. 3 packets per day (3 teaspoons) or (6-12 drops) 1% e. 4 packets per day (4 teaspoons) or (8-16 drops) 0.5% f. 5 packets per day (5 teaspoons) or (20 drops) 0.5% g. More than 5 packets per day (5+ teaspoons) or (> 20 drops) 0.5% h. 3-4 packets per week (6-16 drops) 6% i. 1-2 packets per week (2-8 drops) 9% j. None 59.5% k. Other 0.5%
17. If any what are your reasons for adding low caloric sweeteners or consuming foods and/or beverages that contain low-calorie sweeteners? (202 responses)
a. To help reduce the total number of calories I consume 16.3% b. To prevent a future health condition 9.9% c. To manage an existing health condition 7.4% d. Taste preference 33.7% e. None 50.5% f. Other 1.5%
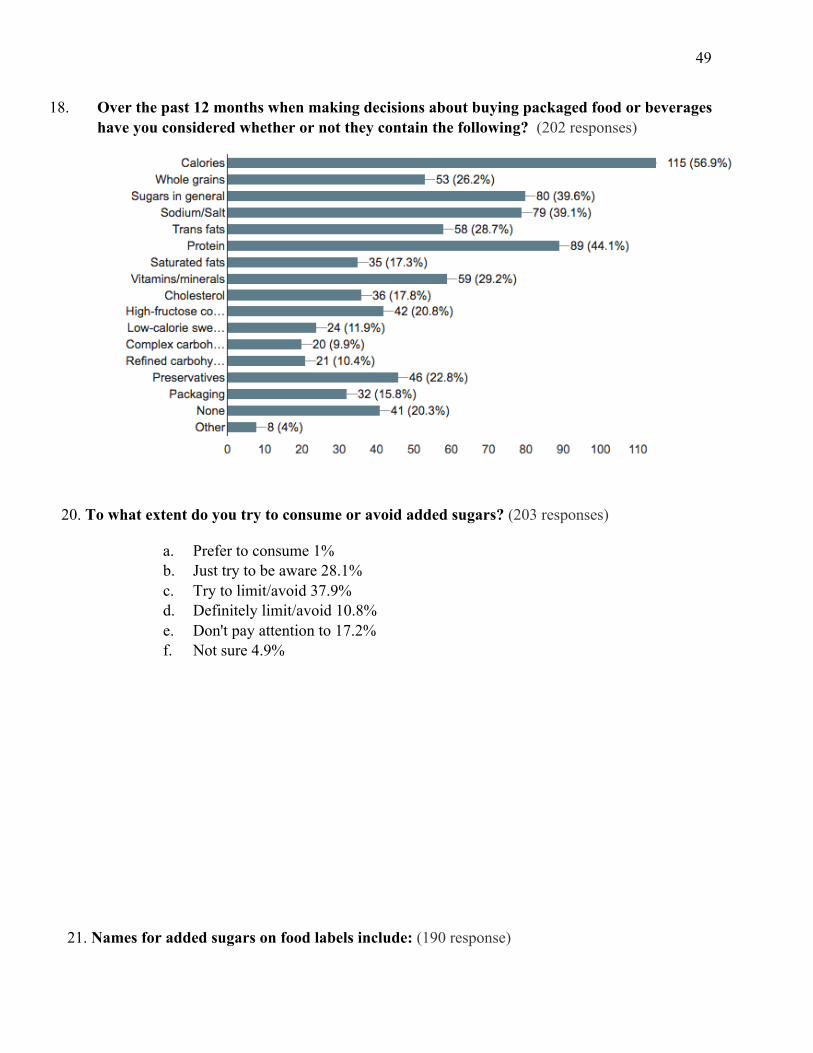
49
18. Over the past 12 months when making decisions about buying packaged food or beverages have you considered whether or not they contain the following? (202 responses)
20. To what extent do you try to consume or avoid added sugars? (203 responses)
a. Prefer to consume 1% b. Just try to be aware 28.1% c. Try to limit/avoid 37.9% d. Definitely limit/avoid 10.8% e. Don't pay attention to 17.2% f. Not sure 4.9%
21. Names for added sugars on food labels include: (190 response)

50
(carrageenan cane crystals, corn syrup, dextrose, evaporated cane juice, fructose, monosodium glutamate, maltose, nectars, sucrose)
22. How often do you do each of the following? (203 responses)
23. Which of the following are reasons why you consider the sugars and/or carbohydrate content of the foods and beverages you buy? (203 reponses)
a. To help maintain a healthy weight 60.6% b. To help provide energy/fuel for my physical activities 39.9% c. To prevent a future health condition To manage an existing health condition 48.8% d. Because I've heard that people should pay attention to the amount of sugar they consume 19.7% e. Because I've heard that people should pay attention to the types of sugar they consume 26.1% f. Another reason 6.4% g. I don't think about 19.2% h. Other 0.5%
24. Check the statements you believe are TRUE regarding fruit juice. (196 responses)

51
a. Fruit-flavored drinks usually have very little fruit and are high in added sugar. 2% b. 100% fruit juices contain a high amount of fiber. 13.8% c. 100% fruit juices are a more concentrated source of simple sugars than whole fruits. 54.6%
25. On food labels the amount of sugar is listed in grams. How much is 4g of sugar? (200 responses)
a. 8 calories (1/2 teaspoon) 18.5% b. 16 calories (1 teaspoon) 44% c. 32 calories (2 teaspoons) 28% d. 64 calories (4 teaspoons) 9.5%
26. The American Heart Association (AHA) declares that the maximum amount of added sugars you should eat in a day is: (202 responses)
27. According to the 2015-2020 Dietary Guidelines we should limit our total daily consumption of added sugars to: (202 responses)
28. In 2015 The World Health Organization (WHO) guidelines recommend limiting the amount of added sugar to less than 5 percent of calories per day this was found to: (202 responses)

52
29. Age (202 responses)
a. 17 or younger 0% b. 18-20 67.3% c. 21-24 32.7% d. 25-29 0% e. 30+ 0%
30. Sex (202 responses)
a. male 27.7% b. female 72.3%
31. What is your student status? (202 responses)
a. US student. 91% b. Foreign student (exchange student). 9%
32. What is your racial or ethnic identification? (202 responses)
a. African American/Black 9% b. American Indian/ Alaskan 1.5% c. Native Asian/Asian American 5.5% d. Hispanic/Latino 65.5% e. Pacific Islander 0.5% f. Middle Eastern/North African 6% g. White 31% h. Other 1%