ADB Working Paper Series on Regional Economic … · ADB Working Paper Series on Regional Economic...
44
What Drives Different Types of Capital Flows and Their Volatilities in Developing Asia? Rogelio Mercado and Cyn-Young Park No. 84 | July 2011 ADB Working Paper Series on Regional Economic Integration
Transcript of ADB Working Paper Series on Regional Economic … · ADB Working Paper Series on Regional Economic...

What Drives Different Types of Capital Flows and Their Volatilities in Developing Asia?
Rogelio Mercado and Cyn-Young ParkNo. 84 | July 2011
ADB Working Paper Series onRegional Economic Integration

Rogelio Mercado+ and Cyn-Young Park++
What Drives Different Types of Capital Flows and Their Volatilities in Developing Asia?
ADB Working Paper Series on Regional Economic Integration
No. 84 July 2011
A draft version of this paper was presented at the International Economics Journal–Korea University Institute of Economic Research Joint Conference held in March 2011. The authors are grateful to the conference participants and discussants for their valuable comments and suggestions. The authors are solely responsible for any remaining errors. + Assistant Professional Lecturer, Economics Department, De La Salle University-Manila, 2401 Taft Avenue, 1004 Manila, Philippines. email: [email protected]++ Principal Economist, Office of Regional Economic Integration, Asian Development Bank, 6 ADB Avenue, Mandaluyong City, 1550 Metro Manila, Philippines. Tel: +63 2 632 5473. email: [email protected]

The ADB Working Paper Series on Regional Economic Integration focuses on topics relating to regional cooperation and integration in the areas of infrastructure and software, trade and investment, money and finance, and regional public goods. The Series is a quick-disseminating, informal publication that seeks to provide information, generate discussion, and elicit comments. Working papers published under this Series may subsequently be published elsewhere.
Disclaimer: The views expressed in this paper are those of the author and do not necessarily reflect the views and policies of the Asian Development Bank (ADB) or its Board of Governors or the governments they represent. ADB does not guarantee the accuracy of the data included in this publication and accepts no responsibility for any consequence of their use. By making any designation of or reference to a particular territory or geographic area, or by using the term “country” in this document, ADB does not intend to make any judgments as to the legal or other status of any territory or area. Unless otherwise noted, $ refers to US dollars. © 2011 by Asian Development Bank July 2011 Publication Stock No. WPS113753

Contents Abstract v
1. Introduction 1
2. The Pattern of Capital Flows 32.1. Foreign Direct Investment Flows 42.2. Foreign Portfolio Investment Flows 42.3. Other Investment Flows 4
3. Literature Review 5
4. Empirical Methodology and Findings 74.1. Data and Descriptive Statistics 74.2. Model Specification and Estimation 84.3. Empirical Findings 9
5. Conclusion 13
References 15
ADB Working Paper Series on Regional Economic Integration 27

Tables
1. Coefficient of Variation of Capital Inflows 17 2. Descriptive Statistics for the Variables Used in Panel
Regression, 1980–2009 18 3. Determinants of the Size of Capital Inflows (Full Sample
Emerging Market Economies, 1980–2009) 19 4. Determinants of the Volatility of Capital Inflows (Full Sample
Emerging Market Economies, 1980–2009) 20 5. Determinants of the Size of Capital Inflows (Developing Asia
Economies, 1980–2009) 21 6. Determinants of the Volatility of Capital Inflows (Developing
Asia Economies, 1980–2009) 22
Figures 1. Financial Account Flows, Developing Asia 23 2. Foreign Direct Investment Inflows, Emerging Market
Economies 23 3. Foreign Direct Investment Inflows, Developing Asia 24 4. Foreign Portfolio Investment Inflows, Emerging Market
Economies 24 5. Foreign Portfolio Investment Inflows, Developing Asia 25 6. Other Investment Inflows, Emerging Market Economies 25 7. Other Investment Inflows, Developing Asia 26

Abstract Understanding the determinants of capital inflows is essential to designing an effective policy framework to manage volatile capital flows and their disruptive potential. This paper aims to identify factors that explain the size and volatility of various types of capital flows to developing Asia with regard to other emerging market economies. The estimates for a panel dataset show that per capita income growth, trade openness, and change in stock market capitalization are important determinants of capital inflows to developing Asia. Trade openness increases the volatility of all types of capital inflows, while change in stock market capitalization, global liquidity growth, and institutional quality lowers the volatility. A regional factor plays an important role in determining the size and volatility of capital inflows in emerging Europe and emerging Latin America, suggesting that regional economic cooperation and policy coordination may be an important element in designing a policy framework to manage capital inflows in emerging economies. Keywords: capital flows, volatility of capital flows, panel data, developing Asia, and push and pull factors JEL Classification: F21, F32, F36

| 1
1. Introduction The recent global financial crisis is a good illustration of the adverse effects of free financial flows and globalization. The wave of financial deregulation and globalization since the 1990s has transformed the nature of capital flows, which can be characterized by the dominance of private capital from a variety of sources. While capital inflows bring potentially substantial benefits to recipient economies, spurring investment and economic growth, 1 a surge in capital inflows can also bring significant risks and challenges to emerging market economies.2 For example, capital flows, particularly driven by large short-term flows, have in the past disrupted the functioning of domestic monetary policy and created financial instability, with adverse consequences for growth. The strong post-crisis economic recovery, together with the return of investors’ risk appetite for emerging market assets, led to a surge in capital flows to developing Asia in the latter half of 2009 and in 2010. Private capital flows to emerging Asia3 were $447 billion in 2010 and are expected to be around $430 billion in 2011 (almost 40% of private capital flows to total emerging markets), according to the Institute of International Finance. Following a dip in late 2008 and early 2009, the strong rebound in capital inflows has been driven by foreign purchases of emerging Asia stocks and a rebound in foreign direct investment (FDI) flows, particularly into the People’s Republic of China (PRC) and India. While the return of capital flows to developing Asia is welcome, today’s dramatic increase in capital inflows, driven particularly by short-term flows, may well presage tomorrow’s large outflows. How to effectively manage capital flows has resurfaced as a major policy concern for many developing Asian economies. In this regard, understanding the forces that drive capital flows is essential for the effective management of such flows.
1 Increased capital flows allow the economies with insufficient savings to tap into the larger world pool,
which can (i) lead to a better allocation of financial resources worldwide, (ii) provide more opportunities for risk sharing and portfolio diversification, and (iii) transfer technology and business know-how to the host country in the case of foreign direct investment (FDI). While more difficult to measure, there are likely to be positive spillover or collateral effects, stemming from increased competition and better functioning financial markets (International Monetary Fund [IMF] 2007a).
2 Throughout this paper, emerging market economies include economies from developing Asia (Bangladesh; People's Republic of China (PRC); Georgia; Hong Kong, China; India; Indonesia; Kazakhstan; Republic of Korea; Malaysia; Pakistan; Papua New Guinea; Philippines; Singapore; Sri Lanka; Taipei,China; Thailand; and Viet Nam), emerging Europe (Bulgaria, Croatia, Czech Republic, Estonia, Hungary, Latvia, Lithuania, Poland, Russian Federation, Slovakia, Slovenia, Turkey, and Ukraine), emerging Latin America (Argentina, Brazil, Chile, Colombia, Ecuador, Mexico, Panama, Peru, Uruguay, and Venezuela), and other emerging economies (Botswana, Ghana, Ivory Coast, Israel, Jordan, Kenya, Nigeria, Oman, Saudi Arabia, and South Africa).
3 Emerging Asia includes the PRC, India, Indonesia, Republic of Korea, Malaysia, Philippines, and Thailand.

2 | Working Paper Series on Regional Economic Integration No. 84
There is a large and growing body of literature on whether capital flows to emerging market economies are driven by external (“push”) factors or domestic (“pull”) factors. Some argue that capital flows to emerging market economies increase when global financing conditions ease. The global financial crisis of 2008–2009 was also preceded by an extended period of very low interest rates in advanced economies. Capital flows driven by such push factors, including international interest rates, may be heavily influenced by business cycles in advanced economies (Calvo, Leiderman, and Reinhart 1993; Fernandez-Arias 1994; Kim 2000; Ying and Kim 2001; Baek 2006). Others argue that pull factors, such as prospective returns on domestic investment, would be a major determining factor for foreign capital flows (Dasgupta and Ratha 2000; Hernández, Mellado, and Valdes 2001; Çulha 2006). Some studies also look at trade and financial openness and the institutional quality of emerging market economies as important drivers of capital flows (Broto, Diaz-Cassou, and Erce-Dominguez 2008b; International Monetary Fund [IMF] 2007b; Wei 2011). In practice, both push and pull factors seem to matter (Chuhan, Claessens, and Mamingi 1993; Taylor and Sarno 1997). On the other hand, recent studies began to notice different behaviors and implications of different types of capital flows. The composition of capital flows is important with regard to macroeconomic management and financial stability. Empirical findings (Carlson and Hernandez 2002; Cavoli and Rajan 2009; Chuhan, Perez-Quiros, and Popper 1996) show that FDI is the least volatile type of financial flow when taking into account the average size of the flows. Studies also show that FDI remains most stable during episodes of financial crisis and is less associated with output volatility (Ito, Jongwanich, and Terada-Hagiwara 2009). Following FDI is foreign portfolio investment, although such flows are often procyclical. Evidence suggests that flows into equities in emerging market economies may be more stable than flows into debt securities. Portfolio debt flows tend to experience a reversal, although the recovery is fairly quick after the sudden stop. Earlier studies—including those by Brecker and Noone (2008) and de Brouwer (1999)—also find that bank lending flows are the most unstable source of net flows to emerging market economies and often contribute to the sudden stop. Despite the broadening interest in the composition of capital flows and the implications for economic growth and financial stability, very few studies have focused on the impact of these drivers on different types of capital flows to emerging market economies in developing Asia, and the volatilities of the flows. Are the factors important for capital flows in developing Asia different from the ones driving capital flows to other emerging market economies? Is there a regional factor? Understanding which factors affect which form of capital flows and their volatilities can guide policy makers in helping to attract more stable forms of capital flows and hence effectively managing the flows to their economies. In this paper we investigate the impact of a set of domestic and global factors on the level and volatility of FDI, portfolio investment, and other investment (mostly bank credit) flows into emerging market economies, including those in developing Asia. Drawing on previous literature (Broto, Diaz-Cassou, and Erce-Dominguez 2008a and b; Carlson and Hernandez 2002; IMF 2007a; Lensink, Morrissey, and Osei 2002; Neumann, Penl, and Tanku 2009), we use a panel dataset of 50 emerging market economies, including 17 developing Asian economies, to measure the impact and significance of (i) various

What Drives Different Types of Capital Flows and Their Volatilities? | 3
domestic and global macroeconomic and financial factors, (ii) institutional quality, (iii) volatility of real exchange rates, and (iv) unidentified regional factors. To further explore the region-specific drivers for the size and volatility of capital inflows, we will also run a separate panel regression on the developing Asian dataset and compare the results with the full sample dataset for emerging market economies. The paper is structured as follows: section B takes a brief look at changes in the pattern of capital flows in emerging market economies and developing Asian economies during 1980–2009, section C offers a literature survey, and section D explains empirical methodology and provides empirical findings. Conclusions are in section E. 2. The Pattern of Capital Flows Table 1 reports the coefficient of variation for different types of capital flows (over gross domestic product [GDP]) in both emerging market economies and developing Asian economies during 1980–2009 under three different subperiods. The coefficient of variation is a normalized measure of volatility independent of different units or means of the variables. The table shows that the volatility of other investment flows measured by the coefficient of variation is consistently larger than the volatility of FDI, and portfolio investment flows for both samples are in line with the past findings. The table also shows that the coefficient of variation for total capital flows to developing Asia was highest during 1990–1999, while for the full emerging market economies sample the coefficient of variation was highest during 1980–1989. Overall, the volatility of capital flows to developing Asian economies is lower than that for the full sample of emerging market economies. The patterns of capital flows to developing Asia have changed significantly since the 1997–1998 Asian financial crisis, reflecting the impact of post-crisis reform efforts (Figure 1). In the period leading up to the 1997–1998 financial crisis, many Asian economies saw a significant increase in net capital inflows. The noticeable increase was driven by the rise in “other investment,” which mainly consists of banking sector capital flows in the form of currency and deposits. These short-term flows, however, reversed sharply in the wake of the crisis. Again, in the few years prior to the recent global financial crisis, a number of Asian economies experienced very large short-term inflows. Then, in the wake of the global crisis, large short-term capital outflows instigated currency and financial market instability in Asia. The patterns of capital flows have become more stable and longer term, which has been especially noticeable since the 2002–2003 global economic downturn. Developing Asian economies are also investing abroad more actively, achieving more balance between capital inflows and outflows. However, the progress and effects of financial reforms vary substantially across borders, pointing to vulnerable spots. Smaller developing economies need to further increase their efforts to attract FDI inflows and the region's authorities should continue monitoring volatile banking flows.

4 | Working Paper Series on Regional Economic Integration No. 84
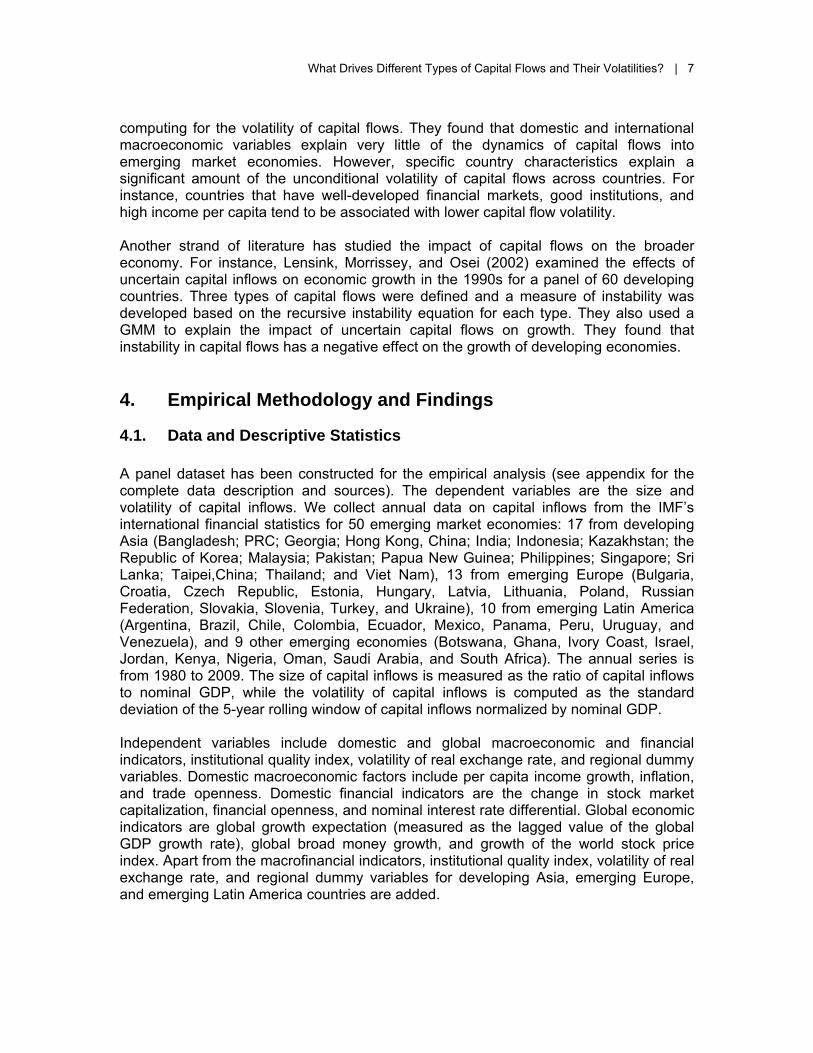
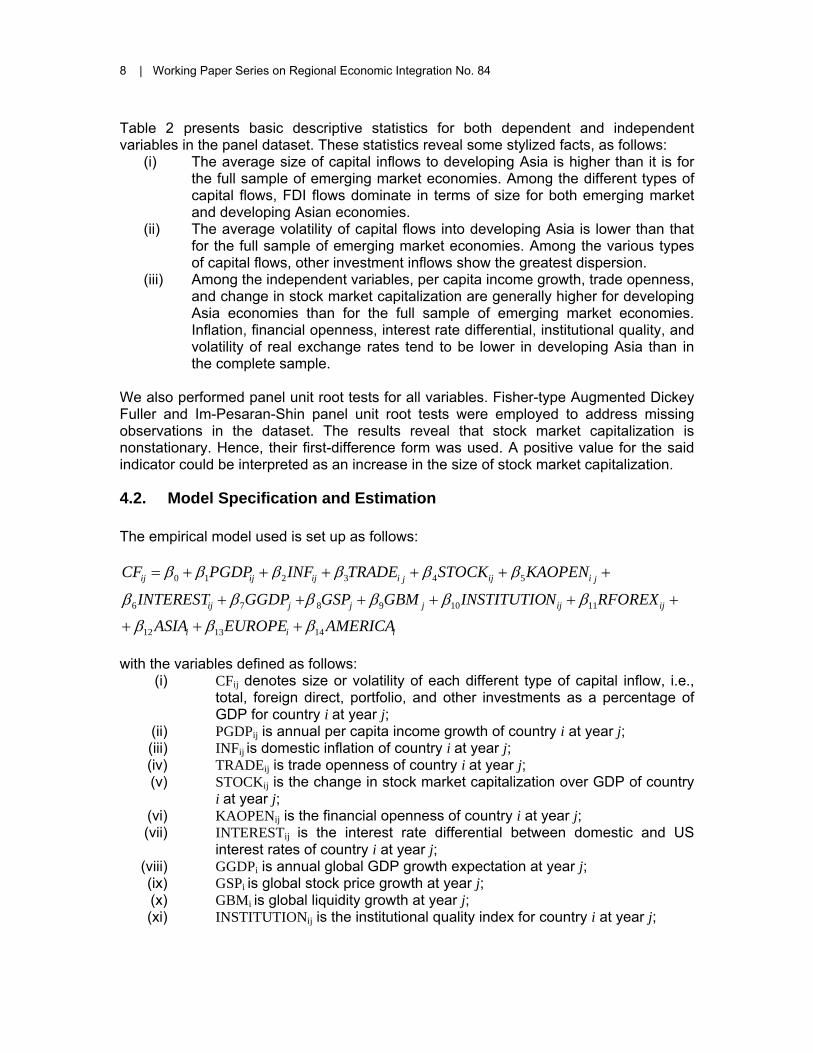
Overall, the composition of capital flows varies significantly across different regions and economies as well as over time. Admittedly, macroeconomic conditions, different development stages of financial systems, legal and institutional frameworks, and policies influence these variations. 2.1. Foreign Direct Investment Flows FDI flows to emerging market economies are more stable and less associated with output volatility in line with early empirical findings (Figure 2). Compared to other emerging market regions, developing Asia has been able to attract substantial capital flows in the form of FDI. However, the regionwide picture masks significant variance across individual economies (Figure 3). The People’s Republic of China (PRC) has been the dominant recipient of FDI flows in Asia; of the region’s total FDI inflows, almost half have gone to the PRC in recent years. An increasingly large proportion has also gone to India since 2006. The newly industrialized economies (NIEs)—Hong Kong, China; the Republic of Korea; Singapore; and Taipei,China— appear to be another attractive destination for FDI flows, reflecting their high-quality legal, social, and physical infrastructure. FDI flows into many Association of Southeast Asian Nations (ASEAN) economies have yet to fully recover from the 1997–1998 crisis, reflecting the lagging investment recovery in these economies, while inflows to other developing Asian economies rose in the run up to the recent global financial crisis but then dropped during the crisis. 2.2. Foreign Portfolio Investment Flows Foreign portfolio investment flows to emerging market economies have increased since the early 1990s, largely going to emerging Latin America economies and developing Asia (Figure 4). Portfolio investment inflows to developing Asia surged after the 1997–1998 crisis, partly reflecting the impact of post-crisis reform efforts of financial deregulation and liberalization (Figure 5). During 2003–2007, gross foreign portfolio investment inflows to developing Asia economies averaged 2.1% of gross domestic product (GDP), up from 1.2% in during 1998–2002. Geographically, NIEs account for a majority of the portfolio investment flows coming into the region, reflecting the openness of their markets and their role as globalized financial centers. The PRC and ASEAN economies have also stepped up their market liberalization efforts, contributing to an increase in inflows in recent years. Especially in the few years leading up to the recent crisis, some of these economies encouraged equity outflows to reduce appreciation pressure in the face of sharp increases in capital inflows. India has received increasing portfolio investment flows in recent years; its share to total portfolio flows to the region grew from an average of 8.6% in 2000–2004 to 12.6% in 2005–2009. Other developing Asia economies also experienced rising portfolio investment inflows from 2004 to 2007. However, like most countries in the region, these economies saw a reversal in capital flows during the recent global financial crisis. 2.3. Other Investment Flows Other investment flows to emerging market economies have been persistently more volatile and tend to be more susceptible to external shocks and currency instability
What Drives Different Types of Capital Flows and Their Volatilities? | 5
compared to FDI and foreign portfolio investment flows (Figure 6). In developing Asia, the Asian financial crisis and the recent global financial crisis saw other investment flows fall sharply and turn into relatively large net outflows (Figure 7). The NIEs received the largest share of other investment inflows in Asia, reflecting greater openness in their banking sectors. In contrast, ASEAN countries received a small portion of other investment inflows to the region, and the PRC is also taking an increasingly large share of these types of flows. A relatively rigid exchange rate regime in the PRC may be attracting speculative capital, betting on an eventual currency revaluation. For example, there was a strong rise in inflows just before the revaluation of the renminbi in 2005 and there was another surge in 2009 as the debate over revaluation intensified. India and other developing Asia economies have also experienced rising other investment flows in recent years. 3. Literature Review There are numerous empirical studies dealing with the determinants of capital flows into emerging market economies. Many studies have examined internal and external factors that cause capital flows to surge or drop in emerging market economies, including developing Asian economies. A growing body of literature also focuses on the determinants of different types of capital flows—direct investment, portfolio investment, and other investment. Carlson and Hernandez (2002) examined the determinants of the composition of capital flows in emerging market economies, using ordinary least squares and instrument variable regression on a panel dataset for eight emerging market economies with domestic economic and policy variables as regressors. Their findings suggest that both policy and real factors influence the share of FDI relative to other components of net capital inflows. For instance, flexible exchange rate regimes tend to discourage FDI, while increased sterilization raises short-term debt flows. Ito, Jongwanich, and Terada-Hagiwara (2009) investigated the external and internal factors affecting capital flows to selected highly integrated developing Asian economies. They developed a gravity model to estimate the determinants of foreign direct investment and employed a Tobit model to examine the drivers of portfolio and other investment flows. Their results show that internal factors—such as per capita income, labor cost, trade, and financial openness—attract FDI inflows, while growth in advanced economies significantly affects movements of bank loans and portfolio inflows to developing Asia. Their findings imply that both domestic and global factors determine the capital flows to developing Asia. Wei (2011) looked into the determinants of the shares of FDI, portfolio investment, and foreign borrowing to total foreign liabilities using standard ordinary least squares and two-stage least squares. The author measured the impact of financial development, institutional quality, and trade openness on attracting various types of capital flows. His results indicate that financial development is associated with less FDI inflows, while

6 | Working Paper Series on Regional Economic Integration No. 84
institutional quality is only significant in attracting portfolio investment inflows. Trade openness increases FDI and portfolio inflows but decreases other investment inflows. Recently, a group of studies has begun to assess the effect of these various factors on the volatility of capital flows directly in addition to their volumes. Various methods of volatility measure are proposed for this approach. While standard deviations for the rolling window of capital flows have been commonly used, some studies have also adopted alternative volatility measures, including the generalized autoregressive conditional heteroskedasticity (GARCH). Broto, Diaz-Cassou, and Erce-Dominguez (2008a) analyzed the determinants of volatility of the different types of capital inflows in emerging countries using GARCH, while the same authors (2008) later used a computed absolute value of residuals from an autoregressive integrated moving average (ARIMA) model estimated for every country and type of capital flow on a quarterly basis as the measure of volatility. The authors grouped the determinants into different categories: domestic (macroeconomic and financial), global, legal, institutional, and geopolitical. In their 2007 study, the authors find that global conditions have significant impact on the volatility of portfolio and other investment inflows, but not FDI inflows. In addition, the degree of domestic financial market development often reduces the volatility of portfolio inflows. Their findings also show that in recent years the significance of global factors has increased at the expense of country-specific factors. In terms of composition, in their 2008 study, the authors found that (i) domestic macroeconomic and financial variables have significant impact on the volatility of FDI, (ii) domestic financial variables and global factors play a major role in the volatility of portfolio investment flows, and (iii) global variables are more closely related to the volatility of other investment flows. The International Monetary Fund (IMF) also looked into the determinants of capital inflows in its Global Financial Stability Report 2007 (IMF 2007b). It used the generalized method of moments (GMM) technique which allows for cross-section fixed effects with two-stage least squares instrument weighting matrix. Both macroeconomic and financial indicators were used as explanatory variables for the volatility of capital inflows. The IMF estimates suggest that more open economies and increased global liquidity are associated with lower capital volatility for both the full sample dataset and emerging market economies. Neumann, Penl, and Tanku (2009) examined what drives the volatility of capital flows. They estimated the impact of domestic and global factors on capital flow instability using a panel dataset for mature and emerging market economies. They discovered that as industrial production becomes more variable in the advanced economies, capital flows into the mature economies become less volatile. For emerging market economies, portfolio and other investment flows both become more variable as global growth becomes unstable, while direct investment flows decrease in variability. Meanwhile, domestic growth variability generally increases volatility of other investment flows for both mature and emerging market economies. Broner and Rigobon (2005) examined why capital flows are more volatile in emerging markets than in advanced economies. They used the standard deviation method in
What Drives Different Types of Capital Flows and Their Volatilities? | 7
computing for the volatility of capital flows. They found that domestic and international macroeconomic variables explain very little of the dynamics of capital flows into emerging market economies. However, specific country characteristics explain a significant amount of the unconditional volatility of capital flows across countries. For instance, countries that have well-developed financial markets, good institutions, and high income per capita tend to be associated with lower capital flow volatility. Another strand of literature has studied the impact of capital flows on the broader economy. For instance, Lensink, Morrissey, and Osei (2002) examined the effects of uncertain capital inflows on economic growth in the 1990s for a panel of 60 developing countries. Three types of capital flows were defined and a measure of instability was developed based on the recursive instability equation for each type. They also used a GMM to explain the impact of uncertain capital flows on growth. They found that instability in capital flows has a negative effect on the growth of developing economies. 4. Empirical Methodology and Findings
4.1. Data and Descriptive Statistics
A panel dataset has been constructed for the empirical analysis (see appendix for the complete data description and sources). The dependent variables are the size and volatility of capital inflows. We collect annual data on capital inflows from the IMF’s international financial statistics for 50 emerging market economies: 17 from developing Asia (Bangladesh; PRC; Georgia; Hong Kong, China; India; Indonesia; Kazakhstan; the Republic of Korea; Malaysia; Pakistan; Papua New Guinea; Philippines; Singapore; Sri Lanka; Taipei,China; Thailand; and Viet Nam), 13 from emerging Europe (Bulgaria, Croatia, Czech Republic, Estonia, Hungary, Latvia, Lithuania, Poland, Russian Federation, Slovakia, Slovenia, Turkey, and Ukraine), 10 from emerging Latin America (Argentina, Brazil, Chile, Colombia, Ecuador, Mexico, Panama, Peru, Uruguay, and Venezuela), and 9 other emerging economies (Botswana, Ghana, Ivory Coast, Israel, Jordan, Kenya, Nigeria, Oman, Saudi Arabia, and South Africa). The annual series is from 1980 to 2009. The size of capital inflows is measured as the ratio of capital inflows to nominal GDP, while the volatility of capital inflows is computed as the standard deviation of the 5-year rolling window of capital inflows normalized by nominal GDP. Independent variables include domestic and global macroeconomic and financial indicators, institutional quality index, volatility of real exchange rate, and regional dummy variables. Domestic macroeconomic factors include per capita income growth, inflation, and trade openness. Domestic financial indicators are the change in stock market capitalization, financial openness, and nominal interest rate differential. Global economic indicators are global growth expectation (measured as the lagged value of the global GDP growth rate), global broad money growth, and growth of the world stock price index. Apart from the macrofinancial indicators, institutional quality index, volatility of real exchange rate, and regional dummy variables for developing Asia, emerging Europe, and emerging Latin America countries are added.
8 | Working Paper Series on Regional Economic Integration No. 84
Table 2 presents basic descriptive statistics for both dependent and independent variables in the panel dataset. These statistics reveal some stylized facts, as follows:
(i) The average size of capital inflows to developing Asia is higher than it is for the full sample of emerging market economies. Among the different types of capital flows, FDI flows dominate in terms of size for both emerging market and developing Asian economies.
(ii) The average volatility of capital flows into developing Asia is lower than that for the full sample of emerging market economies. Among the various types of capital flows, other investment inflows show the greatest dispersion.
(iii) Among the independent variables, per capita income growth, trade openness, and change in stock market capitalization are generally higher for developing Asia economies than for the full sample of emerging market economies. Inflation, financial openness, interest rate differential, institutional quality, and volatility of real exchange rates tend to be lower in developing Asia than in the complete sample.
We also performed panel unit root tests for all variables. Fisher-type Augmented Dickey Fuller and Im-Pesaran-Shin panel unit root tests were employed to address missing observations in the dataset. The results reveal that stock market capitalization is nonstationary. Hence, their first-difference form was used. A positive value for the said indicator could be interpreted as an increase in the size of stock market capitalization.
4.2. Model Specification and Estimation The empirical model used is set up as follows:
iii
ijijjjjij
jiijjiijijij
AMERICAEUROPEASIA
RFOREXNINSTITUTIOGBMGSPGGDPINTEREST
KAOPENSTOCKTRADEINFPGDPCF
141312
11109876
543210
βββ
ββββββ
ββββββ
+++
++++++
++++++=
with the variables defined as follows:
(i) CFij denotes size or volatility of each different type of capital inflow, i.e., total, foreign direct, portfolio, and other investments as a percentage of GDP for country i at year j;
(ii) PGDPij is annual per capita income growth of country i at year j; (iii) INFij is domestic inflation of country i at year j; (iv) TRADEij is trade openness of country i at year j; (v) STOCKij is the change in stock market capitalization over GDP of country
i at year j; (vi) KAOPENij is the financial openness of country i at year j; (vii) INTERESTij is the interest rate differential between domestic and US
interest rates of country i at year j; (viii) GGDPi is annual global GDP growth expectation at year j; (ix) GSPi is global stock price growth at year j; (x) GBMi is global liquidity growth at year j; (xi) INSTITUTIONij is the institutional quality index for country i at year j;

What Drives Different Types of Capital Flows and Their Volatilities? | 9
(xii) RFOREXij is the volatility of real exchange rate for country i at year j; (xiii) ASIAi is the dummy variable for economies in developing Asia; (xiv) EUROPEi is the dummy variable for emerging Europe economies; and (xv) AMERICAi is the dummy variable for emerging Latin America economies.
The value “1” is assigned if a country is part of the region, and “0” otherwise. A dummy variable for other emerging market economies was not added due to the inclusion of a constant term in the model. Estimating the above model using ordinary least squares could produce biased results as they would suffer from an endogeneity problem where both the independent and dependent variables could influence each other. To solve this problem, exogenous instrument variables are required. However, using such variables for a two-staged least squares estimation could also yield biased estimates as exogenous instrument variables may be weak. To avoid this problem, Arellano and Bond (1991) proposed the use of a generalized method of moments (GMM) to produce more efficient estimates where lagged values of the independent variables are used as instruments. Empirical estimation in this paper will employ the same approach and use lagged values of the independent variables and domestic GDP growth rate as instruments.
4.3. Empirical Findings Four panel estimation results are presented in this section. The first two show the impact of macroeconomic, financial, and global factors on the size and volatility of different types of capital inflows for the full sample of emerging market economies. The second two focus on the drivers for the size and volatility of capital inflows to developing Asia. Tables 3 and 4 present the results of the determinants of the size and volatility of capital inflows for the full sample of emerging market economies. The results show that institutional quality exerts a positive and relatively large influence on the size of total capital inflows driven primarily by other investment flows. Financial openness, per capita income growth, and change in stock market capitalization are also found to significantly increase the size of total capital inflows. Overall, various pull factors, or economic conditions and policies of the destination countries, seem to play an important role in attracting capital flows to emerging market economies, as institutional quality, financial openness, per capita income growth, change in stock market capitalization, and volatility of real exchange rates are the main determinants of the size of total capital inflows to emerging market economies. Among the push factors, global growth expectation is found to have a significant effect on the size of FDI flows. Yet, the effects of different factors vary across different types of capital inflows. Financial and trade openness together with global growth expectation significantly increase the size of FDI inflows. Institutional quality, per capita income growth, and change in stock market capitalization positively influence the size of other investment inflows. Volatility of real exchange rates lowers the size of total capital inflows mainly through a reduction in portfolio investment inflows. Similarly, the effects of different factors vary across the volatility of different types of capital inflows. Trade openness increases the volatility of all types of capital inflows. The

10 | Working Paper Series on Regional Economic Integration No. 84
volatility of real exchange rates is also found to increase the volatility of foreign portfolio investment inflows. However, change in stock market capitalization lowers the volatility of all but FDI inflows. Per capita income also lowers the volatility of total capital inflows, although its effect on any single type of capital inflow separately remains insignificant. The results also show the same factor may have a different effect on the volatility of different types of capital inflows. For example, financial openness increases the volatility of FDI inflows but reduces the volatility of portfolio investment flows. Regional factors also affect both the size and volatility of capital inflows to emerging market economies in Europe and Latin America, although a regional factor for developing Asia is found to be insignificant. Emerging European countries experience a significant and positive regional effect with regard to the size of FDI inflows and the volatility of FDI and portfolio investment inflows. The results show that there is a positive regional effect on the volatility of foreign portfolio investment inflows in emerging Latin America. Similar to the results for the full sample of emerging market economies, Tables 5 and 6 show that pull factors play a dominant role in determining the size and volatility of capital inflows to developing Asia. Per capita income growth, trade openness, and change in stock market capitalization increase the overall size of capital inflows. For FDI, per capita income growth and trade openness increase the size of inflows, while institutional quality and volatility of real exchange rates decrease the size. For other investment inflows, per capita income growth and an increase in stock market capitalization are significant and positive determinants. Trade openness again increases the volatility of all types of capital inflows. Change in stock market capitalization reduces the volatility of all but FDI inflows. Institutional quality lowers the size and volatility of FDI inflows to developing Asia. Global liquidity growth (a push factor) is also found to have a significant and negative effect on the volatility of FDI inflows. Per capita income growth appears to increase the size of capital inflows into both the full sample of emerging market economies and developing Asia economies. It also lowers the volatility of overall capital flows for the full sample. These results are similar to the findings of Broner and Rigobon (2005), who found a significant negative relationship between per capita GDP growth and volatility of total capital flows. Trade openness increases the size of FDI inflows for the full sample while it increases the size of total and FDI inflows to developing Asia economies. The estimates are positive and significant, and consistent with the results of Ito, Jongwanich, and Terada-Hagiwara (2009) and Wei (2011). Increased trade openness also leads to more volatile capital inflows for both the full sample and for developing Asia economies. The result is significant for all types of capital inflows and consistent with the findings of Broto, Diaz-Cassou, and Erce-Dominguez (2008b) for 2000–2006. These authors argue that countries that rely heavily on international trade tend to be more vulnerable to changes in global investment conditions. This may be especially true for those economies where foreign investments are mainly directed to the export sectors. We find that the impact of trade openness on the size of capital inflows (particularly FDI inflows) is bigger for the developing Asia sample, reflecting the importance of the region’s export sector.

What Drives Different Types of Capital Flows and Their Volatilities? | 11
Growth of stock market capitalization increases the size of other investment inflows (and hence total capital inflows) into emerging market economies, including those in developing Asia. This result is consistent with the findings of the IMF (2007b). It implies that investors take the growing equity market capitalization in emerging market economies as a signal of market liquidity. This liquidity helps investors to buy or sell more stocks in a given period. Higher stock market capitalization also lessens the volatility of portfolio and other investment flows into emerging market economies and developing Asia. This suggests that emerging economies may need to foster stock market development to lower the volatility of capital flows. Financial openness increases the size of capital flows, particularly in the form of FDI inflows, to emerging market economies. The estimates are consistent with the results of the IMF discussion paper (IMF 2007b). It also increases the volatility of FDI inflows, while decreasing that of foreign portfolio investment inflows. For developing Asia, however, financial openness has little effect on the size of FDI inflows, which may reflect the fact that many regional economies still have more important but less explicit barriers to investment, such as heavy administrations and reporting burdens. Financial openness is, however, found to increase the volatility of FDI inflows to developing Asia economies. As emerging markets ease capital movement, they may become subject to sudden surges, stops, or reversals of capital flows. Expectation of higher global GDP growth increases the size of FDI inflows to emerging market economies. However, its impact on the size of capital flows to developing Asia is insignificant. With regard to volatility, no significant effect is found in either of the samples. Broto, Diaz-Cassou, and Erce-Dominguez (2008b) and the IMF (2007b) suggested that the expectation of continued global economic expansion may dampen the volatility of capital flows, but as global economic growth falters it could trigger flight to safety and destabilize capital inflows to emerging economies. Our findings also suggest the effect of global growth expectation on the volatility of FDI inflows is inconclusive. Global broad money (liquidity) growth dampens the volatility of capital inflows to developing Asia. The effect is significant on the volatility of FDI flows. Our finding seems rather contradictory to earlier findings. Broto, Diaz-Cassou, and Erce-Dominguez (2008b) find that global liquidity growth generally increases the volatility of capital inflows to emerging market countries. This implies that when more liquidity is available in the global economy, some of this is channeled to emerging market economies in the form of more volatile portfolio and other investment flows. The shift in foreign investment towards shorter-term investment vehicles may result in a reduction in the volatility of FDI inflows. Better institutional quality leads to greater capital inflows to emerging market economies. The estimates of the effect of institutional quality are positive and significant for total capital inflows and other investment inflows to emerging market economies. For developing Asia, improved institutional quality reduces the volatility of FDI inflows, although its effect on the size is significantly negative. These results are generally consistent with the findings of Broner and Rigobon (2005), IMF (2007a), and Wei (2011). The results suggested that institutional quality increases capital flows and reduces the volatility of capital flows for emerging economies.

12 | Working Paper Series on Regional Economic Integration No. 84
Greater exchange rate volatility reduces the size of capital flows to emerging market and developing Asia economies. For the full sample of emerging market economies, the impact is significant for foreign portfolio investment flows; for developing Asia, its effect is significant on FDI flows. Greater exchange rate volatility also leads to higher volatility of capital inflows (especially foreign portfolio investment inflows) to emerging market economies. These findings suggest that greater exchange rate flexibility may help address volatile capital flows. Other factors—such as domestic inflation, the effects of higher interest rate differentials, and global stock price growth—have no significant effect on the size and volatility of capital inflows. Broto, Diaz-Cassou, and Erce-Dominguez (2008a) argue that investors view domestic inflation as a signal that emerging market economies might be undertaking distortionary policies, hence raising the volatility of capital flows. However, our finding shows no clear evidence of this. It is also often suggested that higher interest rate differentials may attract capital flows to emerging market economies; our finding provides no support for this. In fact, the IMF (2007b) found that greater disparity between domestic and US interest rates reduced the size of portfolio investment flows and capital flows to emerging market economies. While an increase in the global stock price index is expected to lower the size and increase the volatility of capital flows into emerging market economies, our finding is inconclusive. Strong stock market performance in advanced economies tends to reduce the incentive to invest in emerging market economies. As investors divert their funds into safer investments elsewhere, emerging market economies may experience a reduction in capital flows and an increase in volatility. However, recent stock market booms in emerging market economies may have limited the diversion of funds, despite the global boom. Finally, regional factors—such as a common regional culture; region-specific shocks; or the global perception of the region’s common economic, political, and social characteristics—exert a significant influence on the size and volatility of capital flows to emerging market economies. Our findings show a common regional factor influences positively and significantly the size of FDI flows and the volatility of FDI and foreign portfolio investment flows to emerging Europe. The effect of an emerging Latin America regional factor is also large and positive on the volatility of foreign portfolio investment inflows. For developing Asia, however, our finding suggests no regional factor significantly influences the size and volatility of capital inflows, although a relatively large and positive coefficient for other investment inflows appears to be consistent with developing Asia’s experience of attracting relatively large other investment flows.
What Drives Different Types of Capital Flows and Their Volatilities? | 13
5. Conclusion The ebb and flow of capital to developing Asia during the global financial crisis in 2008–2009 has reinvigorated policy discussion on how to effectively manage surging capital inflows. In this paper we have tried to (i) explain the factors that affect the size and volatility of various types of capital flows to emerging market economies, (ii) analyze the differences in these factors between developing Asia and other emerging market groups, and (iii) understand region-specific factors for developing Asia compared with other emerging market economies. Overall, the empirical findings of this paper suggest that institutional quality as well as traditional pull factors play an important role in determining the size and volatility of various types of capital flows, as follows:
(i) Better institutional quality is important to attracting more and stable capital inflows. Compared to other emerging market groups where institutional quality is important for other investment flows, institutional quality matters more for FDI flows to developing Asia.
(ii) The findings generally suggest that pull factors are important determinants of capital inflows for both the full sample of emerging markets and for developing Asian economies. For developing Asia, per capita income growth, trade openness, and change in stock market capitalization appear to have significant impact on the size of various types of capital flows. Significant factors for the volatility include trade and financial openness and change in stock market capitalization.
(iii) Volatility of real exchange rates reduces the size and increases the volatility of capital flows to emerging economies, including developing Asia.
(iv) The estimates for a panel dataset for the full sample of emerging market economies point to the importance of regional factors as determinants of capital flows. While no clear evidence is found as to how the regional factor works for developing Asia, significant and positive effects of a regional factor for emerging Europe and emerging Latin America imply that there is a role for regional integration and policy cooperation in managing the size and volatility of capital flows.
The findings suggest that sound macroeconomic management and institutional strength are key to attracting stable capital flows. Capital flows in and out of Asia have consistently increased, reflecting the pace of financial globalization and the growing attraction of the region’s growth potential. To maintain investor confidence, sound macroeconomic management is vital. Despite the visible improvement in developing Asia’s macroeconomic and financial policy management, the recent crisis is a strong reminder that further actions are needed to increase the region’s financial resilience. Of particular importance is governance. Institutional quality such as voice and accountability, political stability and absence of violence, government effectiveness, regulatory quality, rule of law, and control of corruption are of paramount importance in attracting the right kind of capital flow, i.e., stable and long term.

14 | Working Paper Series on Regional Economic Integration No. 84
Regional economic cooperation and policy coordination is also an important element in designing a framework to effectively manage capital inflows. The global financial crisis proved that cooperation is essential in responding to a systemic failure. Our findings also suggest there is a clear regional factor behind the size and volatility of capital flows. Further integration of the region’s financial markets may help attract capital flows to the region as a whole. Given the potential cost of financial contagion and crisis associated with financial integration, however, a regional approach needs to be taken to shape the regional financial market such that it is conducive to stable foreign investment. How to maximize the net benefits from financial opening and integration are key issues for emerging market economies in Asia. It is also necessary to ensure regional and global financial stability. Rapid financial liberalization must be accompanied by more effective financial supervisory and regulatory mechanisms at the national level and collective efforts to address the effect of spillovers and implications for financial stability at the regional and global level.

| 15
References M. Arellano and S. Bond. 1991. Some Tests of Specification for Panel Data: Monte Carlo
Evidence and An Application to Employment Equations. The Review of Economic Studies. 58. pp. 277–97.
I. Baek. 2006. Portfolio Investment Flows to Asia and Latin America: Pull, Push Or
Market Sentiment? Journal of Asian Economics. 17. pp. 363–73. C. Becker and C. Noone. 2008. Volatility and Persistence of Capital Flows. Bank for
International Settlements Papers. 42. F. Broner and R. Rigobon. 2005. Why are Capital Flows So Much More Volatile in
Emerging Than in Developed Countries. Central Bank of Chile Working Papers. 382.
C. Broto, J. Diaz-Cassou, and A. Erce-Dominguez. 2008a. The Sources of Capital Flows
Volatility: Empirical Evidence for Emerging Countries. Money Affairs. 21 (1). ———. 2008b. Measuring and Explaining the Volatility of Capital Flows Towards
Emerging Countries. Banco de España Working Paper Series. 0817. G. A. Calvo, L. Leiderman, and C. M. Reinhart. 1993. Capital Flows and Real Exchange
Rate Appreciation in Latin America: The Role of External Factors. IMF Staff Papers. 40 (1). pp. 108–51.
M. Carlson and L. Hernandez. 2002. Determinants and Repercussions of the
Composition of Capital Inflows. International Finance Discussion Papers. 717. United States Federal Reserve System.
T. Cavoli and R. Rajan. 2009. Managing Risks in a Volatile Environment: The Capital
Inflows Problem in Asia. International Economics. 62 (3). pp. 325–40. M. Chinn and H. Ito. 2008. A New Measure of Financial Openness. Journal of
Comparative Policy Analysis. 10 (3). pp. 309–22. P. Chuhan, S. Claessens, and N. Mamingi. 1993. Equity and Bond Flows to Asia and
Latin America. Policy Research Working Papers. 1160. Washington, DC: World Bank.
P. Chuhan, G. Perez-Quiros, and H. Popper. 1996. International Capital Flows: Do
Short-term Investment and Direct Investment Differ? Policy Research Working Papers. 1507. Washington, DC: World Bank.
A. A. Çulha. 2006. A Structural VAR Analysis of the Determinants of Capital Flows into
Turkey. Central Bank Review. 2. pp. 11–35.

16 | References
D. Dasgupta and D. Ratha. 2000. What Factors Appear to Drive Private Capital Flows to Developing Countries? And How Does Official Lending Respond? Policy Research Working Paper. 2392. Washington, DC: World Bank.
G. de Brouwer. 1999. Capital Flows to East Asia: The Facts. In Capital Flows and the
International Financial System. Reserve Bank of Australia. E. Fernandez-Arias. 1994. The New Wave of Private Capital Inflows: Push or Pull?
Policy Research Working Paper Series. 1312. Washington, DC: World Bank. L. Hernández, P. Mellado, and R. Valdes. 2001. Determinants of Private Capital Flows in
the 1970s and 1990s: Is there Evidence of Contagion? IMF Working Paper. WP/01/64.
International Monetary Fund (IMF). 2007a. Reaping the Benefits of Financial
Globalisation. IMF Discussion Paper. Washington, DC. http://www.imf.org/ external/np/res/docs/2007/0607.pdf
———. 2007b. Global Financial Stability Report October 2007. Washington, DC.
http://www.imf.org/External/Pubs/FT/GFSR/2007/02/index.htm H. Ito, J. Jongwanich, and A. Terada-Hagiwara. 2009. What Makes Developing Asia
Resilient in a Financially Globalized World? ADB Economics Working Paper Series. 181. Manila: Asian Development Bank.
Y. Kim. 2000. Causes of Capital Flows in Developing Countries. Journal of International
Money and Finance. 19. pp. 235–53. R. Lensink, O. Morrissey, and R. Osei. 2002. Volatility of Capital Inflows: Measures and
Trends for Developing Countries. Centre for Research in Economic Development and International Trade Research Paper. 02/20.
R. Neumann, R. Penl, and A. Tanku. 2009. Volatility of Capital Flows and Financial
Liberalization: Do Specific Flows Respond Differently? International Review of Economics and Finance. 18. pp. 488–501.
M. Taylor and L. Sarno. 1997. Capital Flows to Developing Countries: Long and Short-
Term Determinants. World Bank Economic Review. 11 (3). S-J. Wei. 2011. Not All Financial Integration is Created Equal: The Composition Matters.
In M. Devereux, P. Lane, C-Y. Park, and S-J. Wei, eds. The Dynamics of Asian Financial Integration: Facts and Analytics. Oxon and New York: Asian Development Bank/ Routledge.
Y-H Ying and Y. Kim. 2001. An Empirical Analysis on Capital Flows: The Case of Korea
and Mexico. Southern Economic Journal. 67 (4).

What Drives Different Types of Capital Flows and Their Volatilities? | 17
Table 1: Coefficient of Variation of Capital Inflows
Type of capital 1980–1989 1990–1999 2000–2009 1980–2009
Full Sample, Emerging Market Economies Total Capital Inflows 13.44 1.77 1.57 3.1 Foreign Direct Investment Inflows 2.13 1.17 1.22 1.5 Foreign Portfolio Investment Inflows 5.39 3.10 3.46 3.8 Other Investment Inflows 39.31 6.13 3.92 10.1
Developing Asia Economies Total Capital Inflows 1.18 2.45 2.03 2.0 Foreign Direct Investment Inflows 1.69 1.21 1.34 1.5 Foreign Portfolio Investment Inflows 2.92 4.08 3.10 3.7 Other Investment Inflows 1.30 15.37 7.90 5.3
Note: Values refer to coefficient of variation of capital inflows (over gross domestic product) measured by dividingthe standard deviation by the mean. Source: Authors' calculations.

18 | Working Paper Series on Regional Economic Integration No.
Table 2: Descriptive Statistics for the Variables Used in Panel Regression, 1980–2009
Item Full Sample Emerging Market Economies Developing Asia Economies
Mean Standard Deviation
Skewness Kurtosis Mean Standard Deviation
Skewness Kurtosis
Dependent Variables1
Total Capital Inflows 5.04 15.68 (7.60) 187.94 5.83 11.62 2.20 37.62 Foreign Direct Investment Inflows 2.91 4.31 3.83 29.15 3.24 4.77 2.80 13.20 Foreign Portfolio Investment Inflows 0.75 2.83 4.16 86.04 0.88 3.30 6.95 70.26 Other Investment Inflows 1.38 13.87 (10.00) 245.88 1.70 9.06 (3.03) 43.42 Volatility of Total Capital Inflows 5.25 12.55 9.04 97.18 4.43 7.71 4.78 29.10 Volatility of Foreign Direct Investment Inflows 1.39 1.90 4.61 38.48 1.24 1.85 3.68 21.11 Volatility of Foreign Portfolio Investment Inflows 1.24 2.38 5.39 39.15 1.29 2.85 5.45 37.12 Volatility of Other Investment Inflows 4.28 11.66 9.81 111.04 3.36 5.23 3.90 20.62
Independent Variables Per Capita Income Growth 2.15 5.39 (1.61) 9.89 3.62 5.04 (2.91) 23.69 Inflation 48.29 306.46 14.09 248.89 15.04 117.10 14.89 225.69 Trade Openness2 82.47 59.12 2.20 9.59 98.20 83.08 1.69 5.36 Change Stock Market Capitalization3 2.64 35.19 (3.22) 111.71 3.92 51.60 (2.70) 63.79 Financial Opennes4 0.17 1.52 0.38 1.69 0.05 1.40 0.63 2.09 Interest Rate Differential5 49.42 579.38 22.88 598.93 4.47 11.63 12.70 219.31 Global GDP Growth Expectation 3.41 1.11 (0.18) 2.52 3.41 1.12 (0.18) 2.52 Global Stock Price Growth6 9.64 17.82 (0.82) 3.78 9.64 17.83 (0.82) 3.78 Global Broad Money Growth7 29.46 33.24 2.23 7.38 29.46 33.26 2.23 7.38 Institution Quality Index8 0.03 0.64 0.14 2.18 (0.07) 0.67 0.71 2.41 Volatility of Real Foreign Exchange Rate9 64.97 509.34 13.52 226.06 34.80 237.70 13.28 213.77
Notes: 1 In percent of gross national product (GDP). Volatility is computed as the standard deviation of the 5-year rolling window of capital inflows normalized by nominal GDP. 2 Values refer to total trade of goods and services (exports + imports) over GDP (in percent). 3 Values are the first difference of stock market capitalization over GDP (in percent). 4 Capital account openness index taken from Chinn and Ito (2008). 5 Data refers to the difference between the domestic and US interest rates, in percent per annum. 6 Data refers to growth of MSCI Barra All Country World Index. 7 Data refers to GDP weighted growth of broad money (M2) of 20 large economies. 8 Data taken from the Worldwide Governance Indicators by Kaufmann, Kraay, and Mastruzzi. Available at http://info.worldbank.org/governance/wgi/index.asp 9 Computed as the annual standard deviation of monthly real foreign exchange rates. Source: International Financial Statistics Online, national sources, MSCI Barra, World Development Indicators, and World Economic Outlook Database (April 2010).
Henry
Text Box
18 | Working Paper Series on Regional Economic Integration No. 84

What D
rives Different Types of C
apital Flows and Their V
olatilities? | 19
What Drives Different Types of Capital Flows and Their Volatilities | 19
Table 3: Determinants of the Size of Capital Inflows (Full Sample Emerging Market Economies, 1980–2009)
Item
Total Inflows FDI Inflows FPI Inflows Other Investment Inflows
Coefficient Standard Errors
Coefficient Standard Errors
Coefficient Standard Errors
Coefficient Standard Errors
Constant (4.216) 5.725 (2.945) 2.398 1.054 2.228 (2.325) 4.883 Per Capita Income Growth 0.631 0.227* 0.077 0.095 0.036 0.088 0.517 0.193* Domestic Inflation 0.019 0.035 0.011 0.015 0.011 0.014 (0.002) 0.030 Trade Openness 0.020 0.020 0.038 0.009* 0.002 0.008 (0.020) 0.017 Change in Stock Market Capital 0.091 0.026* (0.017) 0.011 0.009 0.010 0.099 0.022* Financial Openness 1.425 0.645** 0.493 0.270*** 0.165 0.251 0.767 0.550 Interest Rate Differential (0.005) 0.012 (0.004) 0.005 (0.003) 0.005 0.002 0.010 Global Growth Expectation 1.305 0.794 0.840 0.333** 0.051 0.309 0.413 0.677 Global Stock Price Growth (0.034) 0.057 (0.009) 0.024 (0.000) 0.022 (0.025) 0.048 Global Broad Money Growth (0.005) 0.029 0.010 0.012 (0.001) 0.011 (0.013) 0.024 Institutional Quality 1.659 0.943*** (0.231) 0.395 0.369 0.367 1.521 0.804*** Volatility of Real Exchange Rate (0.006) 0.002* (0.001) 0.001 (0.005) 0.001* (0.000) 0.002 Dummy Asia 4.144 4.573 (0.866) 1.915 (0.715) 1.780 5.724 3.900 Dummy Europe 4.107 2.554 2.638 1.070** 0.608 0.994 0.861 2.178 Dummy Latin America (3.778) 9.094 (2.018) 3.809 (1.479) 3.539 (0.282) 7.756 Instrument Rank 25.000 25.000 25.000 25.000 J-statistics 29.133 26.557 16.754 16.817
FDI = foreign direct investment, FPI = foreign portfolio investment. Note: *, **, and *** denote significance at 1%, 5% and 10% confidence levels, respectively.

20 | Working Paper Series on Regional Economic Integration No.
20 | Working P
aper Series on R
egional Econom
ic Integration No. 84
Table 4: Determinants of the Volatility of Capital Inflows (Full Sample Emerging Market Economies, 1980–2009)
Item
Total Inflows FDI Inflows FPI Inflows Other Investment Inflows
Coefficient Standard Errors
Coefficient Standard Errors
Coefficient Standard Errors
Coefficient Standard Errors
Constant (3.681) 3.240 0.055 0.987 (2.642) 1.644 (0.352) 2.315 Per Capita Income Growth (0.227) 0.126*** (0.062) 0.038 (0.082) 0.064 (0.118) 0.090 Domestic Inflation 0.003 0.020 0.002 0.006 (0.006) 0.010 0.010 0.014 Trade Openness 0.086 0.012* 0.017 0.004* 0.028 0.006* 0.057 0.008* Change in Stock Market
Capital (0.078) 0.015* 0.007 0.004 (0.022) 0.007* (0.051) 0.011* Financial Openness (0.078) 0.373 0.228 0.114** (0.318) 0.189*** 0.148 0.267 Interest Rate Differential (0.002) 0.007 (0.001) 0.002 0.002 0.004 (0.004) 0.005 Global Growth Expectation (0.010) 0.450 0.040 0.137 (0.057) 0.229 (0.258) 0.322 Global Stock Price Growth 0.017 0.032 (0.006) 0.010 0.013 0.016 0.009 0.023 Global Broad Money Growth 0.013 0.016 (0.001) 0.005 0.009 0.008 0.012 0.012 Institutional Quality (0.698) 0.535 (0.222) 0.163 (0.201) 0.271 (0.532) 0.382 Volatility of Real Exchange
Rate 0.001 0.001 (0.000) 0.000 0.002 0.001** (0.000) 0.001 Dummy Asia (0.318) 2.525 (0.565) 0.769 1.285 1.281 (0.872) 1.804 Dummy Europe 2.056 1.436 1.383 0.438* 2.590 0.729* 0.119 1.026 Dummy Latin America 5.505 5.158 (0.016) 1.572 5.222 2.618** 1.150 3.686 Instrument Rank 25.000 25.000 25.000 25.000 J-statistics 9.784 10.266 22.602 5.697
*, **, and *** denote significance at 1%, 5% and 10% confidence levels, respectively. Note: FDI = foreign direct investment, FPI = foreign portfolio investment.

What D
rives Different Types of C
apital Flows and Their V
olatilities? | 21
What Drives Different Types of Capital Flows and Their Volatilities | 21
Table 5: Determinants of the Size of Capital Inflows (Developing Asia Economies, 1980–2009)
Item
Total Inflows FDI Inflows FPI Inflows Other Investment Inflows
Coefficient Standard Errors
Coefficient Standard Errors
Coefficient Standard Errors
Coefficient Standard Errors
Constant (13.116) 5.337 (5.242) 1.608 1.130 1.678 (9.004) 5.068 Per Capita Income Growth 1.058 0.354* 0.470 0.107* 0.010 0.111 0.577 0.336*** Domestic Inflation 0.671 0.438 0.106 0.132 (0.004) 0.138 0.568 0.416 Trade Openness 0.066 0.015* 0.055 0.005* 0.004 0.005 0.008 0.014 Change in Stock Market
Capital 0.093 0.027* (0.010) 0.008 0.012 0.008 0.092 0.026* Financial Openness 0.384 0.920 0.437 0.277 0.269 0.289 (0.322) 0.874 Interest Rate Differential (0.279) 0.366 0.090 0.110 (0.035) 0.115 (0.334) 0.348 Global Growth Expectation 1.035 1.176 0.185 0.354 0.006 0.370 0.843 1.117 Global Stock Price Growth 0.115 0.092 (0.011) 0.028 0.012 0.029 0.114 0.087 Global Broad Money Growth 0.019 0.038 (0.009) 0.011 (0.015) 0.012 0.044 0.036 Institutional Quality 0.532 1.693 (0.994) 0.510*** 0.805 0.532 0.721 1.607 Volatility of Real Exchange
Rate (0.003) 0.005 (0.003) 0.001** (0.001) 0.002 0.001 0.005 Instrument Rank 25.000 25.000 25.000 25.000 J-statistics 18.136 27.871 23.252 20.029
*, **, and *** denote significance at 1%, 5% and 10% confidence levels, respectively. Note: FDI = foreign direct investment, FPI = foreign portfolio investment.

22 | Working Paper Series on Regional Economic Integration No.
22 | Working P
aper Series on R
egional Econom
ic Integration No. 84
Table 6: Determinants of the Volatility of Capital Inflows (Developing Asia Economies, 1980–2009)
Item
Total Inflows FDI Inflows FPI Inflows Other Investment Inflows
Coefficient Standard Errors
Coefficient Standard Errors
Coefficient Standard Errors
Coefficient Standard Errors
Constant (1.911) 3.502 0.241 0.672 1.462 1.332 (1.759) 2.279 Per Capita Income Growth (0.069) 0.220 0.057 0.042 (0.058) 0.084 (0.018) 0.143 Domestic Inflation (0.041) 0.269 (0.018) 0.052 (0.071) 0.102 (0.083) 0.175 Trade Openness 0.072 0.010* 0.018 0.002* 0.018 0.004* 0.052 0.006* Change in Stock Market Capital (0.071) 0.017* 0.009 0.003* (0.018) 0.006* (0.050) 0.011* Financial Openness 0.559 0.580 0.226 0.111* 0.248 0.221 0.071 0.377 Interest Rate Differential 0.146 0.226 0.024 0.043 0.047 0.086 0.167 0.147 Global Growth Expectation 0.018 0.764 (0.226) 0.147 (0.230) 0.291 0.015 0.497 Global Stock Price Growth (0.020) 0.058 (0.004) 0.011 (0.016) 0.022 0.002 0.037 Global Broad Money Growth (0.017) 0.024 (0.010) 0.005** (0.015) 0.009 (0.003) 0.016 Institutional Quality 0.323 1.086 (0.601) 0.209* 0.282 0.413 0.588 0.707 Volatility of Real Exchange Rate (0.001) 0.003 (0.000) 0.001 (0.000) 0.001 (0.000) 0.002 Instrument Rank 25.000 25.000 25.000 25.000 J-statistics 16.464 27.390 23.948 16.160
*, **, and *** denote significance at 1%, 5% and 10% confidence levels, respectively. Note: FDI = foreign direct investment, FPI = foreign portfolio investment.

What Drives Different Types of Capital Flows and Their Volatilities? | 23
The People’s Republic of China and India | 23
0.0
0.5
1.0
1.5
2.0
2.5
3.0
3.5
4.0
4.5
5.0
-100
0
100
200
300
400
500
600
700
800
1980 1983 1986 1989 1992 1995 1998 2001 2004 2007
Other Emerging Economies (LHS)
Emerging Latin America (LHS)
Emerging Europe (LHS)
Developing Asia (LHS)
Emerging Markets (RHS)
% of GDP$ billions
2009
-1,000
-600
-200
200
600
1,000
1980 1982 1984 1986 1988 1990 1992 1994 1996 1998 2000 2002 2004 2006 2008
Other Investment Portfolio Investment Direct Investment Net Financial Account Flow
Outflows
2009
Inflows
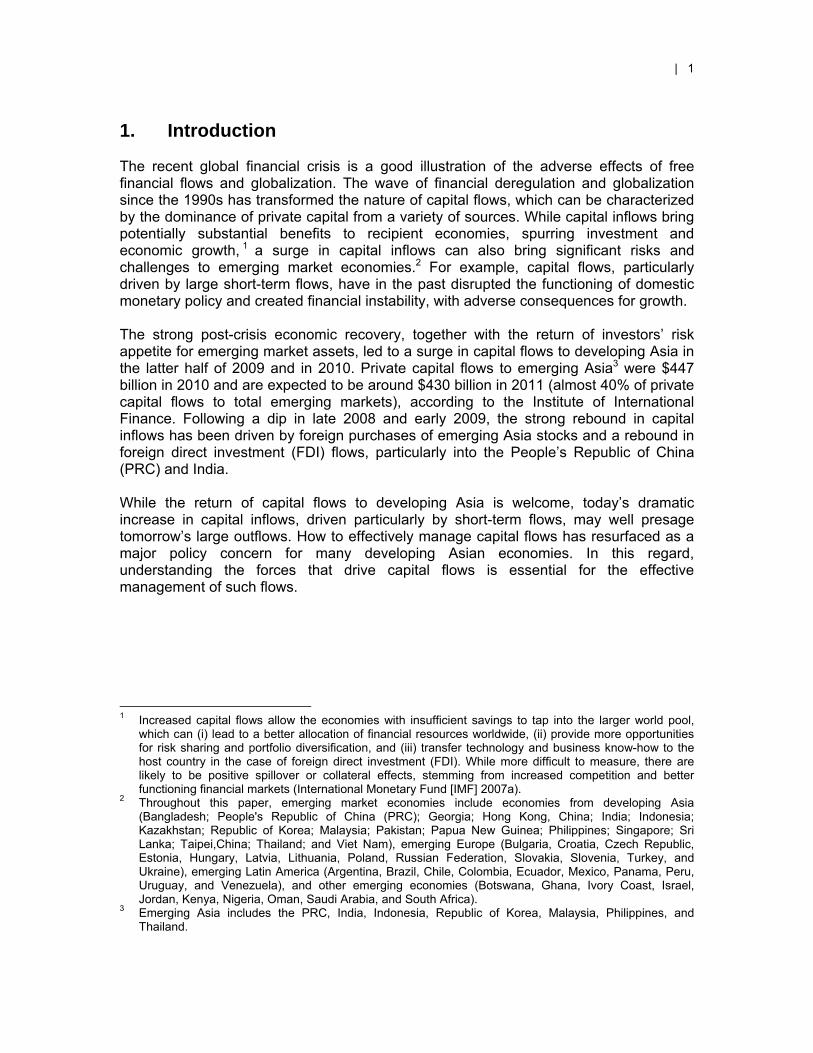
Figure 1: Financial Account Flows, Developing Asia ($ billion)
Figure 2: Foreign Direct Investment Inflows, Emerging Market Economies
LHS = left hand scale, RHS = right hand scale, GDP = gross domestics product. Note: Emerging market economies include those from developing Asia (Bangladesh; People's Republic of China; Georgia; Hong Kong, China; India; Indonesia; Kazakhstan; Republic of Korea; Malaysia; Pakistan; Papua New Guinea; Philippines; Singapore; Sri Lanka; Taipei,China; Thailand; and Viet Nam), emerging Europe (Bulgaria, Croatia, Czech Republic, Estonia, Hungary, Latvia, Lithuania, Poland, Russian Federation, Slovakia, Slovenia, Turkey, and Ukraine), emerging Latin America (Argentina, Brazil, Chile, Colombia, Ecuador, Mexico, Panama, Peru, Uruguay, and Venezuela), and other emerging economies (Botswana, Ghana, Ivory Coast, Israel, Jordan, Kenya, Nigeria, Oman, Saudi Arabia, and South Africa). Data refers to foreign direct investments in reporting country. Source: International Financial Statistics and World Economic Outlook Database, International Monetary Fund, and national sources.
Note: Developing Asia includes economies from the Association of Southeast Asian Nations (Indonesia, Malaysia, Philippines, Thailand, and Viet Nam), newly industrialized economies (Hong Kong, China; Republic of Korea; Singapore; and Taipei,China), People's Republic of China; India; and other developing Asia countries (Bangladesh, Georgia, Kazakhstan, Pakistan, Papua New Guinea, and Sri Lanka). Source: International Financial Statistics, International Monetary Fund; and national sources.

24 | Working Paper Series on Regional Economic Integration No. 84 24 | Working Paper Series on Regional Economic Integration No.
0.0
0.5
1.0
1.5
2.0
2.5
3.0
3.5
4.0
4.5
0
50
100
150
200
250
300
350
1980 1983 1986 1989 1992 1995 1998 2001 2004 2007
Other economies (LHS)
India (LHS)
People's Republic of China (LHS)
NIEs (LHS)
ASEAN (LHS)
Developing Asia (RHS)
$ billions % of GDP
2009
-1.0
-0.5
0.0
0.5
1.0
1.5
2.0
2.5
3.0
-200
-100
0
100
200
300
400
1980 1983 1986 1989 1992 1995 1998 2001 2004 2007
Other Emerging Economies (LHS)Emerging Latin America (LHS)Emerging Europe (LHS)Developing Asia (LHS)Emerging Markets (RHS)
% of GDP$ billions
2009
Figure 3: Foreign Direct Investment Inflows, Developing Asia
Figure 4: Foreign Portfolio Investment Inflows, Emerging Market Economies
LHS = left hand scale, RHS = right hand scale, GDP = gross domestics product. Note: Emerging economies include those from developing Asia (Bangladesh; People's Republic of China; Georgia; Hong Kong, China; India; Indonesia; Kazakhstan; Republic of Korea; Malaysia; Pakistan; Papua New Guinea; Philippines; Singapore; Sri Lanka; Taipei,China; Thailand; and Viet Nam), emerging Europe (Bulgaria, Croatia, Czech Republic, Estonia, Hungary, Latvia, Lithuania, Poland, Russian Federation, Slovakia, Slovenia, Turkey, and Ukraine), emerging Latin America (Argentina, Brazil, Chile, Colombia, Ecuador, Mexico, Panama, Peru, Uruguay, and Venezuela), and other emerging economies (Botswana, Ghana, Ivory Coast, Israel, Jordan, Kenya, Nigeria, Oman, Saudi Arabia, and South Africa). Data refers to foreign portfolio investment liabilities. Source: International Financial Statistics and World Economic Outlook Database, International Monetary Fund, and national sources.
LHS = left hand scale, RHS = right hand scale, GDP = gross domestics product, NIE = newly industrialized economy, ASEAN = Association of Southeast Asian Nations. Note: Developing Asia includes economies from ASEAN (Indonesia, Malaysia, Philippines, Thailand and Viet Nam), NIEs (Hong Kong, China; Republic of Korea; Singapore; and Taipei,China), People’s Republic of China, India and other developing Asia countries (Bangladesh, Georgia, Kazakhstan, Pakistan, Papua New Guinea, and Sri Lanka). Data refers to foreign direct investments in reporting country. Source: International Financial Statistics and World Economic Outlook Database, International Monetary Fund, and national sources.
What Drives Different Types of Capital Flows and Their Volatilities? | 25
The People’s Republic of China and India | 25
-1.5
-1.0
-0.5
0.0
0.5
1.0
1.5
2.0
2.5
3.0
-150
-100
-50
0
50
100
150
200
250
1980 1983 1986 1989 1992 1995 1998 2001 2004 2007
Other economies (LHS)
India (LHS)
People's Republic of China (LHS)
NIEs (LHS)
ASEAN (LHS)
Developing Asia (RHS)
$ billions % of GDP
2009
-3.0
-2.0
-1.0
0.0
1.0
2.0
3.0
4.0
5.0
-200
0
200
400
600
800
1980 1983 1986 1989 1992 1995 1998 2001 2004 2007
Other Emerging Economies (LHS)Emerging Latin America (LHS)Emerging Europe (LHS)Developing Asia (LHS)Emerging Markets (RHS)
% of GDP$ billions
2009
Figure 5: Foreign Portfolio Investment Inflows, Developing Asia
Figure 6: Other Investment Inflows, Emerging Market Economies
LHS = left hand scale, RHS = right hand scale, GDP = gross domestics product. Note: Emerging economies include those from developing Asia (Bangladesh; People's Republic of China; Georgia; Hong Kong, China; India; Indonesia; Kazakhstan; Republic of Korea; Malaysia; Pakistan; Papua New Guinea; Philippines; Singapore; Sri Lanka; Taipei,China; Thailand; and Viet Nam), emerging Europe (Bulgaria, Croatia, Czech Republic, Estonia, Hungary, Latvia, Lithuania, Poland, Russian Federation, Slovakia, Slovenia, Turkey, and Ukraine), emerging Latin America (Argentina, Brazil, Chile, Colombia, Ecuador, Mexico, Panama, Peru, Uruguay, and Venezuela), and other emerging economies (Botswana, Ghana, Ivory Coast, Israel, Jordan, Kenya, Nigeria, Oman, Saudi Arabia and South Africa). Data refers to other investment plus financial derivative liabilities. Source: International Financial Statistics and World Economic Outlook Database, International Monetary Fund, and national sources.
LHS = left hand scale, RHS = right hand scale, GDP = gross domestics produc, NIE = newly industrialized economy, ASEAN = Association of Southeast Asian Nations. Note: Developing Asia includes economies from ASEAN (Indonesia, Malaysia, Philippines, Thailand and Viet Nam), NIEs (Hong Kong, China; Republic of Korea; Singapore; and Taipei,China), People’s Republic of China, India and other developing Asia countries (Bangladesh, Georgia, Kazakhstan, Pakistan, Papua New Guinea, and Sri Lanka). Data refers to foreign portfolio investment liabilities. Source: International Financial Statistics and World Economic Outlook Database, International Monetary Fund, and national sources.

26 | Working Paper Series on Regional Economic Integration No. 84 26 | Working Paper Series on Regional Economic Integration No.
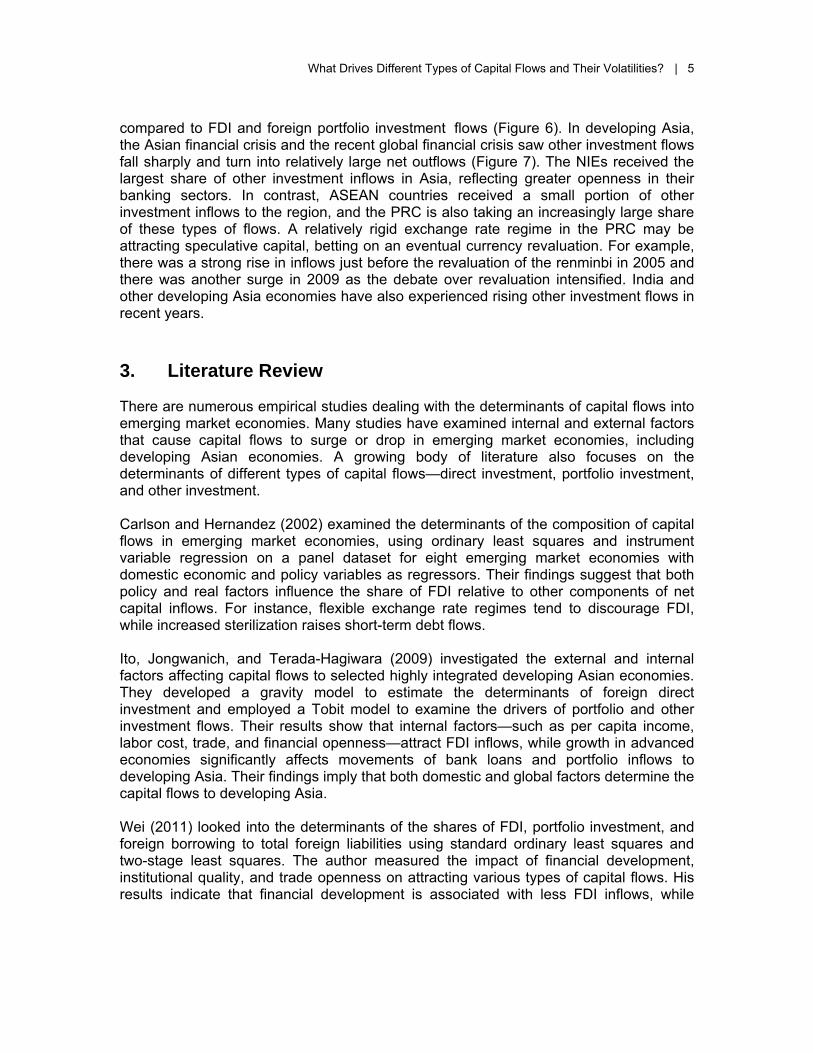
Figure 7: Other Investment Inflows, Developing Asia
-8.0
-6.0
-4.0
-2.0
0.0
2.0
4.0
6.0
-300
-200
-100
0
100
200
300
400
500
1980 1983 1986 1989 1992 1995 1998 2001 2004 2007
ASEAN (LHS) NIEs (LHS)
People's Republic of China (LHS) India (LHS)
Other economies (LHS) Developing Asia (RHS)
$ billions % of GDP
2009
LHS = left hand scale, RHS = right hand scale, GDP = gross domestics produc, NIE = newly industrialized economy, ASEAN = Association of Southeast Asian Nations. Note: Developing Asia includes economies from ASEAN (Indonesia, Malaysia, Philippines, Thailand and Viet Nam), NIEs (Hong Kong, China; Republic of Korea; Singapore; and Taipei,China), People’s Republic of China, India and other developing Asia countries (Bangladesh, Georgia, Kazakhstan, Pakistan, Papua New Guinea, and Sri Lanka). Data refers to other investment plus financial derivative liabilities. Source: International Financial Statistics and World Economic Outlook Database, International Monetary Fund, and national sources.

| 27
ADB Working Paper Series on Regional Economic Integration*
1. “The ASEAN Economic Community and the European Experience” by
Michael G. Plummer
2. “Economic Integration in East Asia: Trends, Prospects, and a Possible Roadmap” by Pradumna B. Rana
3. “Central Asia after Fifteen Years of Transition: Growth, Regional Cooperation, and Policy Choices” by Malcolm Dowling and Ganeshan Wignaraja
4. “Global Imbalances and the Asian Economies: Implications for Regional Cooperation” by Barry Eichengreen
5. “Toward Win-Win Regionalism in Asia: Issues and Challenges in Forming Efficient Trade Agreements” by Michael G. Plummer
6. “Liberalizing Cross-Border Capital Flows: How Effective Are Institutional Arrangements against Crisis in Southeast Asia” by Alfred Steinherr, Alessandro Cisotta, Erik Klär, and Kenan Šehović
7. “Managing the Noodle Bowl: The Fragility of East Asian Regionalism” by Richard E. Baldwin
8. “Measuring Regional Market Integration in Developing Asia: a Dynamic Factor Error Correction Model (DF-ECM) Approach” by Duo Qin, Marie Anne Cagas, Geoffrey Ducanes, Nedelyn Magtibay-Ramos, and Pilipinas F. Quising
9. “The Post-Crisis Sequencing of Economic Integration in Asia: Trade as a Complement to a Monetary Future” by Michael G. Plummer and Ganeshan Wignaraja
10. “Trade Intensity and Business Cycle Synchronization: The Case of East Asia” by Pradumna B. Rana
11. “Inequality and Growth Revisited” by Robert J. Barro
12. “Securitization in East Asia” by Paul Lejot, Douglas Arner, and Lotte Schou-Zibell
13. “Patterns and Determinants of Cross-border Financial Asset Holdings in East Asia” by Jong-Wha Lee
14. “Regionalism as an Engine of Multilateralism: A Case for a Single East Asian FTA” by Masahiro Kawai and Ganeshan Wignaraja
28 |
15. “The Impact of Capital Inflows on Emerging East Asian Economies: Is Too Much Money Chasing Too Little Good?” by Soyoung Kim and Doo Yong Yang
16. “Emerging East Asian Banking Systems Ten Years after the 1997/98 Crisis” by Charles Adams
17. “Real and Financial Integration in East Asia” by Soyoung Kim and Jong-Wha Lee
18. “Global Financial Turmoil: Impact and Challenges for Asia’s Financial Systems” by Jong-Wha Lee and Cyn-Young Park
19. “Cambodia’s Persistent Dollarization: Causes and Policy Options” by Jayant Menon
20. “Welfare Implications of International Financial Integration” by Jong-Wha Lee and Kwanho Shin
21. “Is the ASEAN-Korea Free Trade Area (AKFTA) an Optimal Free Trade Area?” by Donghyun Park, Innwon Park, and Gemma Esther B. Estrada
22. “India’s Bond Market—Developments and Challenges Ahead” by Stephen Wells and Lotte Schou- Zibell
23. “Commodity Prices and Monetary Policy in Emerging East Asia” by Hsiao Chink Tang
24. “Does Trade Integration Contribute to Peace?” by Jong-Wha Lee and Ju Hyun Pyun
25. “Aging in Asia: Trends, Impacts, and Responses” by Jayant Menon and Anna Melendez-Nakamura
26. “Re-considering Asian Financial Regionalism in the 1990s” by Shintaro Hamanaka
27. “Managing Success in Viet Nam: Macroeconomic Consequences of Large Capital Inflows with Limited Policy Tools” by Jayant Menon
28. “The Building Block versus Stumbling Block Debate of Regionalism: From the Perspective of Service Trade Liberalization in Asia” by Shintaro Hamanaka
29. “East Asian and European Economic Integration: A Comparative Analysis” by Giovanni Capannelli and Carlo Filippini
30. “Promoting Trade and Investment in India’s Northeastern Region” by M. Govinda Rao
| 29
31. “Emerging Asia: Decoupling or Recoupling” by Soyoung Kim, Jong-Wha Lee, and Cyn-Young Park
32. “India’s Role in South Asia Trade and Investment Integration” by Rajiv Kumar and Manjeeta Singh
33. “Developing Indicators for Regional Economic Integration and Cooperation” by Giovanni Capannelli, Jong-Wha Lee, and Peter Petri
34. “Beyond the Crisis: Financial Regulatory Reform in Emerging Asia” by Chee Sung Lee and Cyn-Young Park
35. “Regional Economic Impacts of Cross-Border Infrastructure: A General Equilibrium Application to Thailand and Lao PDR” by Peter Warr, Jayant Menon, and Arief Anshory Yusuf
36. “Exchange Rate Regimes in the Asia-Pacific Region and the Global Financial Crisis” by Warwick J. McKibbin and Waranya Pim Chanthapun
37. “Roads for Asian Integration: Measuring ADB's Contribution to the Asian Highway Network” by Srinivasa Madhur, Ganeshan Wignaraja, and Peter Darjes
38. “The Financial Crisis and Money Markets in Emerging Asia” by Robert Rigg and Lotte Schou-Zibell
39. “Complements or Substitutes? Preferential and Multilateral Trade Liberalization at the Sectoral Level” by Mitsuyo Ando, Antoni Estevadeordal, and Christian Volpe Martincus
40. “Regulatory Reforms for Improving the Business Environment in Selected Asian Economies—How Monitoring and Comparative Benchmarking can Provide Incentive for Reform” by Lotte Schou-Zibell and Srinivasa Madhur
41. “Global Production Sharing, Trade Patterns, and Determinants of Trade Flows in East Asia” by Prema-chandra Athukorala and Jayant Menon
42. “Regionalism Cycle in Asia (-Pacific): A Game Theory Approach to the Rise and Fall of Asian Regional Institutions” by Shintaro Hamanaka
43. “A Macroprudential Framework for Monitoring and Examining Financial Soundness” by Lotte Schou-Zibell, Jose Ramon Albert, and Lei Lei Song
44. “A Macroprudential Framework for the Early Detection of Banking Problems in Emerging Economies” by Claudio Loser, Miguel Kiguel, and David Mermelstein
45. “The 2008 Financial Crisis and Potential Output in Asia: Impact and Policy Implications” by Cyn-Young Park, Ruperto Majuca, and Josef Yap
30 |
46. “Do Hub-and-Spoke Free Trade Agreements Increase Trade? A Panel Data Analysis” by Jung Hur, Joseph Alba, and Donghyun Park
47. “Does a Leapfrogging Growth Strategy Raise Growth Rate? Some International Evidence” by Zhi Wang, Shang-Jin Wei, and Anna Wong
48. “Crises in Asia: Recovery and Policy Responses” by Kiseok Hong and Hsiao Chink Tang
49. “A New Multi-Dimensional Framework for Analyzing Regional Integration: Regional Integration Evaluation (RIE) Methodology” by Donghyun Park and Mario Arturo Ruiz Estrada
50. “Regional Surveillance for East Asia: How Can It Be Designed to Complement Global Surveillance?” by Shinji Takagi
51. “Poverty Impacts of Government Expenditure from Natural Resource Revenues” by Peter Warr, Jayant Menon, and Arief Anshory Yusuf
52. “Methods for Ex Ante Economic Evaluation of Free Trade Agreements” by David Cheong
53. “The Role of Membership Rules in Regional Organizations” by Judith Kelley
54. “The Political Economy of Regional Cooperation in South Asia” by V.V. Desai
55. “Trade Facilitation Measures under Free Trade Agreements: Are They Discriminatory against Non-Members?” by Shintaro Hamanaka, Aiken Tafgar, and Dorothea Lazaro
56. “Production Networks and Trade Patterns in East Asia: Regionalization or Globalization?” by Prema-chandra Athukorala
57. “Global Financial Regulatory Reforms: Implications for Developing Asia” by Douglas W. Arner and Cyn-Young Park
58. “Asia’s Contribution to Global Rebalancing” by Charles Adams, Hoe Yun Jeong, and Cyn-Young Park
59. “Methods for Ex Post Economic Evaluation of Free Trade Agreements” by David Cheong
60. “Responding to the Global Financial and Economic Crisis: Meeting the Challenges in Asia” by Douglas W. Arner and Lotte Schou-Zibell
61. “Shaping New Regionalism in the Pacific Islands: Back to the Future?” by Satish Chand
62. “Organizing the Wider East Asia Region” by Christopher M. Dent

| 31
63. “Labour and Grassroots Civic Interests In Regional Institutions” by Helen E.S. Nesadurai
64. “Institutional Design of Regional Integration: Balancing Delegation and Representation” by Simon Hix
65. “Regional Judicial Institutions and Economic Cooperation: Lessons for Asia?” by Erik Voeten
66. “The Awakening Chinese Economy: Macro and Terms of. Trade Impacts on 10 Major Asia-Pacific Countries” by Yin Hua Mai, Philip Adams, Peter Dixon, and Jayant Menon
67. “Institutional Parameters of a Region-Wide Economic Agreement in Asia: Examination of Trans-Pacific Partnership and ASEAN+α Free Trade Agreement Approaches” by Shintaro Hamanaka
68. “Evolving Asian Power Balances and Alternate Conceptions for Building Regional Institutions” by Yong Wang
69. “ASEAN Economic Integration: Features, Fulfillments, Failures, and the Future” by Hal Hill and Jayant Menon
70. “Changing Impact of Fiscal Policy on Selected ASEAN Countries” by Hsiao Chink Tang, Philip Liu, and Eddie C. Cheung
71. “The Organizational Architecture of the Asia-Pacific: Insights from the New Institutionalism” by Stephan Haggard
72. “The Impact of Monetary Policy on Financial Markets in Small Open Economies: More or Less Effective During the Global Financial Crisis?” by Steven Pennings, Arief Ramayandi, and Hsiao Chink Tang
73. “What do Asian Countries Want the Seat at the High Table for? G20 as a New Global Economic Governance Forum and the Role of Asia” by Yoon Je Cho
74. “Asia’s Strategic Participation in the Group of 20 for Global Economic Governance Reform: From the Perspective of International Trade” by Taeho Bark and Moonsung Kang
75. “ASEAN’s Free Trade Agreements with the People’s Republic of China, Japan, and the Republic of Korea: A Qualitative and Quantitative Analysis” by Gemma Estrada, Donghyun Park, Innwon Park, and Soonchan Park
76. “ASEAN-5 Macroeconomic Forecasting Using a GVAR Model” by Fei Han and Thiam Hee Ng
32 |
77. “Early Warning Systems in the Republic of Korea: Experiences, Lessons, and Future Steps” by Hyungmin Jung and Hoe Yun Jeong
78. “Trade and Investment in the Greater Mekong Subregion: Remaining Challenges and the Unfinished Policy Agenda” by Jayant Menon and Anna Cassandra Melendez
79. “Financial Integration in Emerging Asia: Challenges and Prospects” by Cyn-Young Park and Jong-Wha Lee
80. “Sequencing Regionalism: Theory, European Practice, and Lessons for Asia” by Richard E. Baldwin
81. “Economic Crises and Institutions for Regional Economic Cooperation” by C. Randall Henning
82. “Asian Regional Institutions and the Possibilities for Socializing the Behavior of States” by Amitav Acharya
83. “The People’s Republic of China and India: Commercial Policies in the Giants” by Ganeshan Wignaraja
*These papers can be downloaded from (ARIC) http://aric.adb.org/reipapers/ or (ADB) http://adb.org/Economics/publications.asp?fs=fm_9:999


What Drives Different Types of Capital Flows and Their Volatilities in Developing Asia?
The authors identify determinants for the size and volatility of various types of capital flows to emerging economies, with evidence generally pointing to the relative importance of “pull” factors. Significant influence of a regional factor also suggests the role of regional economic and policy cooperation for effective management of capital inflows to emerging economies.
About the Asian Development Bank
ADB’s vision is an Asia and Pacific region free of poverty. Its mission is to help its developing member countries reduce poverty and improve the quality of life of their people. Despite the region’s many successes, it remains home to two-thirds of the world’s poor: 1.8 billion people who live on less than $2 a day, with 903 million struggling on less than $1.25 a day. ADB is committed to reducing poverty through inclusive economic growth, environmentally sustainable growth, and regional integration.
Based in Manila, ADB is owned by 67 members, including 48 from the region. Its main instruments for helping its developing member countries are policy dialogue, loans, equity investments, guarantees, grants, and technical assistance.
Asian Development Bank6 ADB Avenue, Mandaluyong City1550 Metro Manila, Philippineswww.adb.org/povertyPublication Stock No. WPS113753 Printed in the Philippines