ADB Working Paper Series on Regional Economic … · ADB Working Paper Series on ... Global...
76
Global Production Sharing, Trade Patterns, and Determinants of Trade Flows in East Asia Prema–Chandra Athukorala and Jayant Menon No. 41 | January 2010 ADB Working Paper Series on Regional Economic Integration
Transcript of ADB Working Paper Series on Regional Economic … · ADB Working Paper Series on ... Global...

Global Production Sharing, Trade Patterns, and Determinants of Trade Flows in East Asia
Prema–Chandra Athukorala and Jayant MenonNo. 41 | January 2010
ADB Working Paper Series onRegional Economic Integration


Prema–Chandra Athukorala+ and Jayant Menon++
Global Production Sharing, Trade Patterns, and Determinants of Trade Flows in East Asia
ADB Working Paper Series on Regional Economic Integration
No. 41 January 2010
+Prema–Chandra Athukorala is Professor of Economics at the Arndt-Corden Division of Economics, Australian National University, Canberra, Australia. prema-chandra .athukorala @anu.edu.au++Jayant Menon is Principal Economist, Office of Regional Economic Integration, Asian Development Bank, 6 ADB Avenue, Mandaluyong City, 1550 Metro Manila, Philippines. Tel +63 2 632 6205, Fax +63 2 636 2342, [email protected]

The ADB Working Paper Series on Regional Economic Integration focuses on topics relating to regional cooperation and integration in the areas of infrastructure and software, trade and investment, money and finance, and regional public goods. The Series is a quick-disseminating, informal publication that seeks to provide information, generate discussion, and elicit comments. Working papers published under this Series may subsequently be published elsewhere. Disclaimer: The views expressed in this paper are those of the author(s) and do not necessarily reflect the views and policies of the Asian Development Bank or its Board of Governors or the governments they represent. The Asian Development Bank does not guarantee the accuracy of the data included in this publication and accepts no responsibility for any consequence of their use. By making any designation of or reference to a particular territory or geographic area, or by using the term "country" in this document, the Asian Development Bank does not intend to make any judgments as to the legal or other status of any territory or area. © 2010 by Asian Development Bank January 2010 Publication Stock No.

Contents . . . . . . . . . . . . . . . . . . . . . . . . . . . . . . . . . . . . . . . . . . . . . . . . . . . . . . . . . . . . . . . . . . . . . . . . . . . . . . . . . . . . . . . . . . . . . . . . . . . . . . . . .
Abstract v 1. Introduction 1 2. Global Production Sharing: An Overview 2
2.1 The Process 2 2.2 Determinants 4
3. Data Sources and Method of Data Compilation 6 4. Trends and Patterns of Global Production Sharing 8
4.1 Product Composition 10 4.2 The PRC Factor 11 4.3 Determinants of East Asia’s Growing Role in
Global Production Sharing 11 5. Global Production Sharing and Determinants of Trade Flows 12
5.1 US Demand for Manufacturing Imports 14 5.2 World Export Demand 17 5.3 Results 19
6. Concluding Remarks 20 References 59 ADB Working Paper Series on Regional Economic Integration 64
Tables
1. Parts and Components (P&C) in World Manufacturing Trade, 1992/93 – 2005/06 22
2. Geographic Profile of World Trade in Parts and Components, 1992/93 and 2005/06 23
3. Share of Parts and Components in Manufacturing Trade by Selected Country/regions and Major Product categories, 1992/3 and 2005/6 (%) 24
4. Parts and Components share in bilateral trade flows, 2005/06 30
5. Percentage Composition of Parts and Components Exports and Imports by two-digit SITC Categories, 2005/06 32
6. Hourly Compensation Cost of Manufacturing Production Workers in Selected Countries Relative to the United States (US) (%, 2-year averages) 34
7. World Bank Logistics Performance Index and Its Composite Indexes: Developing Asian Economies and Major Country Groups 35

8. US Import demand functions (Random-effect IV GLS regressions) 36
9. World Demand for Manufacturing Exports (Pooled OLS estimates) 38
Appendix Tables
1. A-1 List of Parts and Components 47
2. A-2 Products Covered in the Estimates of United States (US) Import Demand Functions 53
3. A-3 United States (US) Import Demand Functions: Fixed Effect (within) estimates 55
4. A-4 United States (US) Import Demand Functions: Random-Effects GLS Estimates 57
Figures
1. Share of Parts and Components (P&C) in Manufacturing Trade by Region, 1992–2006 45
2. Parts and Components (P&C) in the People’s Republic of China’s Manufacturing Trade, 1992–2007 46

Abstract Global production sharing—the breakup of a production process into vertically separated stages that are carried out in different countries—has become one of the defining characteristics of world trade over the past few decades. Any analysis of trade patterns or its determinants that ignores this phenomenon, and the trade in parts and components that it generates, is likely to result in erroneous conclusions. This study examines the extent and pattern of these flows, focusing on East Asia, and probes its implications for the analysis of the determinants of trade flows. World trade in parts and components increased from about 18.9% to 22.3% of total exports between 1992/93 and 2005/06. Most of this growth emanates from East Asia, with its share in total world exports increasing from 27% to 39% over the same period. There was a notable decline in Japan’s share toward the end of this period, but this was more than offset by the rising importance of the People's Republic of China (PRC). In East Asia, most of this trade is in electronics. The econometric analysis reveals that parts and components are remarkably less sensitive to changes in relative prices; as a result, the sensitivity of aggregate trade flows to relative price changes diminishes as its share increases. This implies that exchange rate policy may be less effective in balance of payments adjustment, in countries where component trade is high and growing. Keywords: Global production sharing, product fragmentation trade, determinants of trade flows, exchange rate policy JEL Classification: F10; F13; F23

Global Production Sharing, Trade Patterns, and Determinants of Trade Flows in East Asia | 1
1. Introduction Global production sharing—the breakup of a production process into vertically separated stages carried out in two or more countries—has become one of the defining characteristics of world trade over the past few decades.1 It began in electronics and garments in the late 1960s before spreading to other industries such as automobiles, televisions and radio receivers, office equipment, power and machine tools, cameras and watches, and pharmaceuticals, among others. As the scale of activities in a vertically integrated production process expands, so do the opportunities for reducing costs by locating parts of the production process in different countries. This has resulted in a steady rise in the trade in parts and components across national borders.2 And it has grown into a global phenomenon involving countries at varying stages of development. However, there is evidence that it is far more significant in East Asia and has played a major role in the region’s economic growth and structural transformation. Global production sharing opens up opportunities for firms to relocate slices (tasks) of the production process to different countries, depending on relative cost advantage and other economic fundamentals. Consequently, the final product that arrives on the retailer’s shelf appears as if it manufactured in a single country, where in reality it has gone through multiple factories across several different countries.
For production, the availability of domestic resources is no longer a binding constraint on international trade. A country that does not have factor inputs and technology required for the production of a good or service can now focus on a particular slice or segment of the production process that matches its capabilities. This dramatic transformation in the composition of world trade has implications for standard trade flow analysis as it affects the efficacy of exchange rate and tariff policies in influencing trade flows through changes in relative prices. There are many theoretical studies examining the causes and modalities of global production sharing, and implications of the growing dichotomy between parts and components (middle products) and final products for trade flow analysis and trade policy (Jones 2000, Jones and Kierzkowski 2001b, Helpman 2007, Feenstra 2008). A number of recent studies also document the increasing importance of global production sharing and the prominent role played by the People’s Republic of China (PRC) and other East Asian economies in promoting this type of exchange (Athukorala 2005 and 2009, Arndt 2008, Ng and Yeats 2001). However, applied trade economists have been rather slow to incorporate this new form of international specialization into trade flow analysis, which which continues to rely upon the traditional notion that countries trade goods that are produced from start to finish in a single country (products that are “made” in a given country). Global trade flow modeling is still carried out using trade elasticities estimated at highly aggregated levels, treating parts and components and final goods as a unified, homogeneous product.
1 In the recent literature on international trade, an array of alternative terms have been used to describe this phenomenon, including international production fragmentation, vertical specialization, slicing the value chain, and outsourcing.
2 Defined here as intermediate goods and goods in process.

2 | Working Paper Series on Regional Economic Integration No. 41
The purpose of this study is two-fold: (i) to examine the extent and emerging pattern of global production sharing, with an emphasis on the role played by East Asian economies; and (ii) to probe the implications of the dichotomy between trade in parts and components, and final goods, for analyzing determinants of trade flows. The analysis uses the most recent data from the United Nations (UN) trade database, based on Revision 3 of the Standard International Trade Classification (SITC Rev 3). For the purpose of this study, East Asia is defined to include Japan, the newly industrialized economies (NIEs) of the Republic of Korea [Korea]; Taipei,China; and Hong Kong, China), the PRC, and the six largest economies of the Association of Southeast Asian Nations (ASEAN)―Indonesia, Malaysia, Philippines, Thailand, Singapore, and Viet Nam. Brunei Darussalam, Cambodia, Lao People’s Democratic Republic (Lao PDR), and Myanmar have been excluded due to data limitations. The analysis is conducted in the wider global context, focusing on the region’s performance relative to the North American Free Trade Area (NAFTA) and the European Union (EU). The study is organized as follows. Section 2 provides an overview of the process of international product fragmentation, followed by a survey of theories on how new forms of international specialization are determined, along with what this means for trade flow analysis. Section 3 describes the UN Comtrade database, the methodology for separating parts and components from final goods, and other data issues. Section 4 examines the extent and pattern of global production sharing and the resultant dichotomy between trade in parts and components, and final (assembled) goods. Section 5 presents the results of a trade flow modeling exercise illustrating the implications of this dichotomy. And it discusses the implications of these findings on reshaping standard trade flow analysis to capture the growing importance of global production sharing in world trade. The final section summarizes key findings and considers implications for policy and further research. 2. Global Production Sharing: An Overview 2.1 The Process Production sharing and trade in parts and components3 is not a new phenomenon. Pollard (1981) tells a fascinating story of how at the height of the Industrial Revolution British textile and clothing manufactures began to shift labor intensive segments of the production process to countries in continental Europe due to domestic labor shortages and mounting wage pressures. Young (1928) observes that “over a large part of the field of industry, an increasingly intricate nexus of specialized undertakings has inserted itself between the production of raw materials and the consumer of the final product.” By the late 1950s, when national trade data reporting began producing disaggregated data to allow for tentative estimations, machinery components accounted for nearly 15% of the manufacturing exports of mature industrial countries.4
3 For simplicity, “components” is used henceforth to mean “parts and components.” 4 Calculation based on the data appendix of Maizels (1963).

Global Production Sharing, Trade Patterns, and Determinants of Trade Flows in East Asia | 3
What is new about the contemporary process of global production sharing is its increasingly wide product coverage and its rapid spread from mature industrial countries to developing countries (for example, from the developed North to the developing South). With a modest start in electronics and garments in the late 1960s, the North–South exchange within international production networks gradually evolved and spread to industries such as sports footwear, automobiles, radio receivers, sewing machines, office equipment, electrical machinery, power and machine tools, cameras, and watches. Cost competitiveness and economies of scale achieved this way provided the setting for product innovation and a growth in world trade much faster than world production.5 In its infancy, North–South production sharing was predominantly a two-way exchange between the home and host countries; components were exported to the low-cost, host country for assembly and the assembled components were re-imported to the home country for final sale or further processing (as in the case of electronics). Over the years, production networks have evolved to encompass multiple countries in different stages of the assembly process. Today, product fragments will typically have gone through multiple border crossings before being incorporated into a final product.
Two recent developments set the stage for the rapid increase in fragmentation-based trade as a share of world trade. First, some fragments of the production process in certain industries have become standard fragments, which can be effectively used in a number of products. For instance, long-lasting cellular batteries, which were originally developed by computer manufacturers, are now widely used in mobile phones and electronic organizers; transmitters, which were originally designed for radios, are now used in personal computers and missiles as well; and the use of electronic chips has spread well beyond computers to consumer electronics and motor vehicles, for example (Jones 2000; Jones and Kierzkowski 2001; Brown et al., 2004). Second, as international supply networks of components have become firmly established, producers in advanced countries have begun to move final assembly of an increasing range of consumer durables (such as computers, cameras, televisions, and automobiles) to overseas locations to be physically closer to final users and/or to take advantage of inexpensive labor.
In the case of standard consumer goods such as garments and footwear, global production sharing normally takes place through arm’s length relationships, with international buyers playing a key role in linking producers and sellers in developed countries.6 Global production sharing in electronics and other high-tech industries, on the other hand, evolved differently. Early on, the process essentially involved a multinational enterprise (MNE) establishing an overseas subsidiary to perform some functions it once did at home (Helleiner 1973; Gereffi, Humphrey, and Sturgeon 2005). As production in host countries became more firmly established, production fragmentation eventually
5 Many products such as laptop computers, hand phones, and various entertainment devices (such as music players) would not have been commercially available as early without the cost reductions associated with global production sharing.
6 For instance, for years the Swedish furniture firm IKEA outsourced actual manufacturing to subcontractors in countries like Poland and Viet Nam, retaining design engineering in Sweden. Also, the US-based sportswear producer Nike designs its products and does advertising at home, while doing most of its actual production in several Asian countries through arm’s length relationships.

4 | Working Paper Series on Regional Economic Integration No. 41
spread beyond the MNEs. These subsidiaries began to subcontract some activities to local (host-country) firms, providing detailed specifications and even fragments of their own technologies. At the same time, many firms that were not part of MNE networks began to procure components globally through arm’s length trade. These new developments suggest that an increase in fragmentation-based trade may or may not be accompanied by an increase in the host country’s stock of foreign direct investment (FDI) (Brown et al., 2004).
However, the bulk of global production sharing within high-tech industries still takes place under the aegis of MNEs. This is because the production of final goods requires highly customized and specialized components whose quality cannot be assured when a third party is involved. Even if possible, it is difficult to write a contract between the final producer and input supplier that would fully specify product quality characteristics. This is especially true when it comes to setting up production units in countries that are newcomers to global production networks. As the production unit becomes well established in the country and business links are forged with private and public sector agents, arm’s length subcontracting arrangements for component procurement could develop, assuming a conducive domestic business environment. A major development in the institutional setting for global production sharing has been the emergence of independent contract manufacturers, which produce and assemble components for original manufacturing MNEs (Sturgeon 2003, Brown and Linden 2005). Many of the original MNEs in electronics and related industries increasingly rely on contract manufacturers to operate their global production networks, allowing them to focus on more skill-intensive competencies such as product design and marketing. Helped by some component standardization and by advances in modular technology, this process has become a major contributor to the rapid spread of global production sharing. It has also allowed the original MNEs to rely almost entirely on foreign sources of production, retaining only design and coordination functions at home. Production sharing opens up new opportunities for countries previously unable to compete in producing final products. They can now specialize in one or more segments of the production process, given that parts and components, as well as capital and production technology, are mobile within global production networks. But, as the next section demonstrates, this does not depend alone on the availability of appropriately skilled labor at relatively low wages. A whole range of factors impacting the business climate is important in attracting FDI and other mobile inputs. Moreover, the quality of labor required for most unskilled tasks within the global value chain is generally higher than what the average worker in most labor-abundant countries can offer (Feenstra 2008). 2.2 Determinants In a series of papers, Jones and Kierzkowski (1990, 2001b) and Jones (2000) extended traditional (comparative-advantage-based) trade theory to account for global production sharing. Their framework identifies two mutually reinforcing developments that help explain production-sharing-based international exchange—comparative advantage and increasing returns. These, in turn, have been spurred by (i) rapid advancement in

Global Production Sharing, Trade Patterns, and Determinants of Trade Flows in East Asia | 5
production technology, which has enabled the industry to slice the value chain into finer, portable components; (ii) technological innovation in communication and transportation, which has not only shrunk physical distance, but also allows the establishment of services links that combine various fragments of the production process in a timely and cost-effective way; and (iii) policy reforms in both home and host countries, which have significantly reduced barriers to trade and investment. Splitting up vertically integrated production processes enables firms to locate production blocks across borders according to each country’s comparative advantage. It may be that workers in a particular country or region tend to have different skills from those in other countries or regions, and the skills required in each production block differ so that a dispersion of activity would lower the marginal cost of production (as in the Ricardian model). Alternatively, it may be that that the production blocks differ from each other in the proportion of factors required, enabling firms to locate labor intensive production blocks in countries or regions where productivity-adjusted labor costs are relatively low (as in the Heckscher–Ohlin model). In each case, the differences in factor proportions required for different parts of the production process permit global production sharing to lower marginal costs of production. However, the cross-border spread of production involves new fixed costs, including services links—arrangements for ensuring a smooth sequence in producing the final good. Innovations in communications technology and reductions in trade and investment barriers have eased linking the services required, thus substantially reducing the costs involved. Moreover, a more fragmented production process means that the fixed cost of services links gets spread over a larger output, enabling the firm to reap the benefits of lower average production costs based on international specialization.7 Within this framework, a number of recent studies have provided insight into the factors affecting the process of global production sharing that operates through the cost of services links. Quah (1996) demonstrates how new technological developments have led to the increasing “weightlessness” of production in the electronics industry and how this factor, combined with falling communication and transportation costs, has extended the tradability of electronic products. Venables (1999) and Harris (2001) specifically look at the role of transportation costs. Yi (2003) examines the impact of tariffs. Although the Jones–Kierzkowski framework represents a major improvement in our understanding of global production sharing, it is still based on the notion of trade between countries, with little scope for firms or other economic organizations to have any significant influence on trade patterns between countries. This contradicts empirical evidenceshowing that firms play a crucial role in determining how the value chain is sliced within vertically integrated global industries. Also, the bulk of trade based on global production sharing still takes place between developed countries. This casts doubt on the adequacy of the conventional approach in explaining this phenomenon based on the theory of comparative advantage.
7 For a simple graphical presentation of the Jones–Kierzkowski model, see Caves et al., (2007), pp.
141–147.

6 | Working Paper Series on Regional Economic Integration No. 41
In recent years, there have been some attempts to fill this analytical vacuum by incorporating firm-specific considerations into general equilibrium models, with a focus on both trade that is internal to MNEs and trade that occurs between firms that have special arm’s length relationships.8 This fledgling literature attempts to explain a firm’s decision to integrate globally in terms of the cost of market transactions under incomplete contracts. The decision to outsource production processes to another country―either by setting up an affiliated company or by establishing an arm’s length relationship with a local firm―entails country risk. In many instances, it is impossible to fully offset these risks because complete contracts cannot be written. Under incomplete contracts, the threat point (or outside option) indirectly determines the firm’s optimal engagement in global production sharing.
Thus, in addition to relative cost considerations, various institutional factors that affect the threat point are relevant to the decision. Hidden transaction costs associated with inadequate institutions can constrain trade just as much as tariffs or high labor costs. These costs are presumably much more important in fragmentation-based international exchange than in the conventional trade in goods because a single weak link could disrupt the entire production chain. If the costs associated with these incomplete contracts are too great, then firms buying inputs will tend to choose vertical integration over arm’s length relationships. This would favor the internalization of transactions as the cost of external transactions is too great. Thus, factors impacting incentives to operate affiliated firms in foreign countries, which generally go beyond factor price differences across countries, become relevant in explaining production-sharing-based trade patterns. 3. Data Sources and Method of Data Compilation There are two approaches to quantifying the magnitude and pattern of manufacturing trade that can be directly attributed to global production sharing.9 The first relies on records kept by Organisation for Economic Co-operation and Development (OECD) members, in particular the United States (US) and members of the EU. These include special tariff provisions on overseas processing and the assembly of domestically produced components—or outward processing trade (OPT) statistics. However, the OPT schemes only cover a limited range of products, whereas actual product coverage has varied significantly both within and among countries over time. Perhaps more important are the recent trends in unilateral trade and investment liberalization—as well as the proliferation of bilateral and regional economic integration agreements—which have significantly reduced the importance of these special tariff concessions in promoting global sourcing. They have also reduced the actual utilization of these schemes.
8 Spencer (2005) and Helpman (2006) provide a comprehensive survey of this literature. 9 A number of recent studies have used imported input content of industrial production—estimated using
input–output tables—to measure the growth of global production sharing in world trade at the industry and country level. In these studies, growth in the measured degree of imported input dependence between two time points is interpreted as an indicator of the growth of global production sharing (Dean et al., 2007; Hummels et al., 2001). This approach is not relevant for the present study, which aims to examine the patterns and determinants of production sharing driven trade flows.

Global Production Sharing, Trade Patterns, and Determinants of Trade Flows in East Asia | 7
The second approach, pioneered by Yeats (2001), involves delineating trade in parts and components from the final assembled goods, using country-level trade statistics based on the UN’s SITC. The analysis here adopts this second approach because it provides a more comprehensive and consistent coverage of fragmentation trade, given recent improvements in the UN trade data reporting system. This study uses data extracted from the UN trade database based on Revision 3 of the SITC. In its original form (SITC Rev 1), the UN trade data reporting system did not provide for the separation of fragmentation-based trade (in components) from final manufactured goods. SITC Revision 2―introduced by the UN in the late 1970s and implemented by most countries in the early 1980s―adopted a more detailed commodity classification that allowed for the separation of components for machinery and transport (SITC 7). There was, however, considerable overlap between some advanced-stage component production and assembly, and assembly of final goods in SITC Revision 2 (Ng and Yeats, 2001). SITC Revision 3, introduced in the mid-1980s, was a significant improvement. Apart from providing comprehensive coverage of components in SITC 7, it also separately reports components of some products belonging to SITC 8 (miscellaneous manufactures). Despite these improvements, SITC Revision 3 still does not provide for the construction of a data series covering the entire range of fragmentation-based trade. Although data coverage under SITC 7 is comprehensive, the same cannot be said for SITC 8. In the case of clothing, furniture, and leather products, for instance, where outsourcing is prevalent and increasing, related components such as pieces of textiles, parts of furniture, and parts of leather soles are recorded under other SITC categories. Moreover, there is evidence that production fragmentation has spread beyond SITC 7 and SITC 8 to other product categories, such as pharmaceuticals and chemical products, which fall under SITC 5, and machine tools and various metal products, which are under SITC 6. Assembly activities in software trade have likewise recorded impressive expansion in recent years. These are lumped together with special transactions under SITC 9. As a result, the magnitude of the parts and component trade as measured on the basis of SITC Revision 3 is downward-biased. However, the magnitude of the bias is unlikely to be substantial because fragmentation-based international specialization is predominantly concentrated in the machinery and transport equipment category (SITC 7) (Yeats 2001 and Krugman 2008).
The data are tabulated using importer records, which are considered to be more appropriate for analyzing trade patterns than corresponding exporter records. Compared with country records, importer records are also presumably less susceptible to double-counting and erroneous identification of the source and destination in entrepôt trade (for example, the PRC’s trade through Hong Kong, China and Indonesia’s trade through Singapore) (Ng and Yeats 2003, Appendix 1; Feenstra et al., 1999). Some countries also fail to properly report goods shipped from their own export-processing zones—as they tend to be grouped into one highly aggregated category called "special transactions", listed within SITC 9. It is difficult to resolve these problems, but it is generally believed that data compiled from importer records are less susceptible to recording errors and reveal the origin and composition of trade more accurately than other records. This is because there are normally significant legal penalties for

8 | Working Paper Series on Regional Economic Integration No. 41
incorrectly specifying this information on customs declarations. Within East Asia, Taipei,China is not covered in the UN data system; Viet Nam does not yet provide data using the standard UN format; and for political reasons, Singapore does not report data on bilateral trade with Indonesia. In these cases, data gaps were filled using the corresponding trading partner’s records. Most of the UN’s Comtrade import data are reported as cost including insurance and freight (CIF). CIF figures were used for consistency, even for countries with free-on-board (FOB) data.
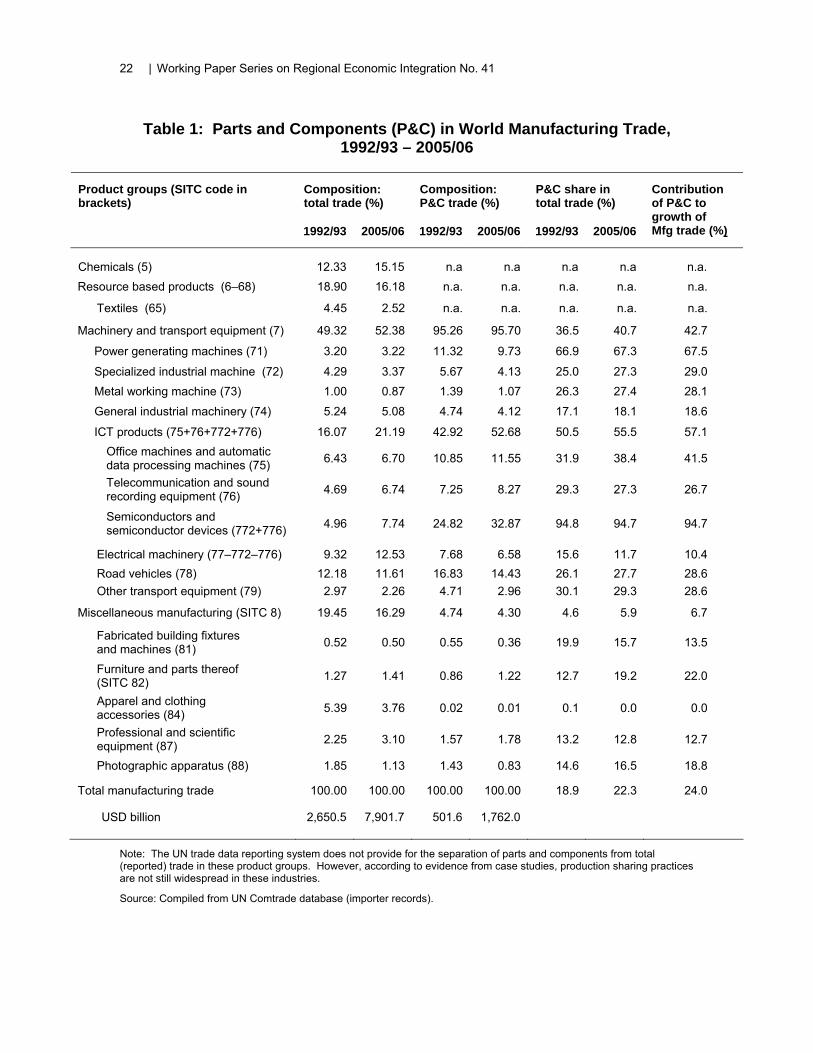
The analysis covers the 1992–2006 period. 1992 was selected as the starting point because countries accounting for over 95% of total world manufacturing trade had adopted the revised data reporting system by this time. Meanwhile, 2006 was the most recent year for which data were available for all reporting countries. The list of parts and components was prepared by carefully linking the parts and accessories identified in the United Nations Statistical Division: Classification Registry 10 with the 5-digit SITC products. The list contains a total of 225 5-digit products—168 products belonging to SITC 7 and 57 belonging to SITC 8 (Appendix Table A-1). In terms of country coverage, the analysis covers East Asia as defined,in the Introduction (second last paragraph). As Taipei,China is not covered in the UN data system, trade data from the Council of Economic Planning and Development based in Taipei,China is used. The data are in current USD terms. 4. Trends and Patterns of Global Production Sharing Table 1 depicts patterns of production sharing in world manufacturing trade, focusing on the share of components by major product categories and their contribution to export increments between 1992/93 and 2005/06.11 World trade in components increased from about USD502 billion (18.9% of total exports) in 1992/93 to USD1,762 billion (22.3%) in 2005/06. Components accounted for nearly a quarter of the total increase in world manufacturing exports over this period. There has been a palpable shift in global production sharing away from mature industrial economies toward developing countries (Table 2 and Figure 1). Developing countries’ share of total component trade increased from 27% in 1992/93 to 47% in 2005/06, driven primarily by the growing importance of East Asia in global production sharing. The share of East Asia (including Japan) in total world exports of components increased steadily from 27% in 1992/93 to 39% in 2005/06, despite a notable decline in Japan’s share in recent years. The share of developing East Asia increased from 17.8% to 32.3% in the same period. In 2005/06, developing East Asia accounted for over two thirds of the total component trade of developing countries. Developing countries, led by developing East Asia, accounted for over 70% of the expansion in the global
10 http:/unstats.un.org/unsd/cr/registry. 11 Throughout the paper, inter-temporal comparison calculations are made for the 2-year averages
relating to the end points of the period under study so as to reduce the impact of year-to-year fluctuations of trade flows.

Global Production Sharing, Trade Patterns, and Determinants of Trade Flows in East Asia | 9
components trade during 1995–2007. However, developed countries still accounted for the bulk of this trade, reflecting their high initial levels. The data reveal an uptrend in the world market shares of economies in developing East Asia. World market shares of ASEAN countries, with the exception of Singapore, have grown faster than the regional average. The mild decline in Singapore’s share reflects a marked shift in its role in global production networks for high-tech industries away from the standard assembly and testing activities to oversight functions, product design, and capital and technology-intensive tasks in the production process. Some, if not most, of these new activities are in the form of services and are, therefore, not captured in merchandise trade data (Wong 2007, Athukorala 2008).
India remains a relatively minor player in global production networks. In 2005/06, India accounted for a mere 0.3% of component exports and 0.2% of final good exports in world machinery trade. However, India has the potential to benefit more from this new form of international specialization in the future, given its relatively low-cost and trainable labor, and its location in a region that has become the world growth center for component production and assembly.
Table 3 presents comparative statistics on the share of components in total manufacturing exports, imports, and total manufacturing trade (imports + exports), disaggregated by major product categories. It is evident that the share of components in trade for East Asia is much higher than for all other regions in the world. In 2005/06, components accounted for over 35.0% of total manufacturing trade in developing East Asia, compared with the world average of 22.2%. Within East Asia, ASEAN countries stand out for their heavy dependence on production fragmentation trade, which is a critical part of their export dynamism. In 2005/06, components accounted for 44% of total manufacturing exports in the ASEAN Free Trade Area (AFTA), up from 29% in 1992/93. The data for all economies and country groups show that parts and components account for a much larger share of exports and imports of information and communication technologies (ICT) products and electrical goods sub-categories compared with other product categories. Also, the import and export shares of components in these two commodity groups are strikingly similar, reflecting two-way trade occurring within production networks. These patterns are much more prominent in East Asian economies than in the rest of the world. Components account for a relatively larger share of intra-regional exports and imports of East Asian economies compared with their trade with the rest of the world (Table 4). For instance, in 2005/6, components’ share of the total intra-regional manufacturing exports of developing East Asia amounted to 37% compared with 17.5% and 18.0% of manufacturing exports to NAFTA and the EU15, respectively. The component intensity of intra-ASEAN trade is even greater. In 2005/06, components accounted for nearly half of intra-ASEAN manufacturing exports compared with less than a third of ASEAN manufacturing exports to NAFTA and the EU-15. The data point to a clear dichotomy in the geographic profile of emerging trade patterns in East Asia; the expansion of final goods exports (total exports – components) of ASEAN countries depends more on extra-regional markets (particularly NAFTA and the EU), while there is a clear intra-regional bias in their trade in components.

10 | Working Paper Series on Regional Economic Integration No. 41
4.1 Product Composition Data on the composition of component exports are summarized by major country groups in Table 4. A striking feature of component trade in East Asia is its heavy concentration in electrical machinery, particularly semiconductors. In all countries and regions, component trade is heavily concentrated in the machinery and transport equipment sector, which accounts for over 90% of the combined component trade of SITC 7. Within SITC 7, East Asian component exports and imports are heavily concentrated in electronics and electrical industries. Semiconductors and other electronics components (SITC 77) alone accounted for 50% of component exports from East Asia in 2004/05. Adding components of telecommunication equipment (SITC 76) and office and automated data processing machines (SITC 75) to these items increases the concentration ratio to almost 90% of total exports of components. The balance consists largely of electrical machinery (SITC 77) and auto parts (SITC 78). The concentration of component trade in electronics is much larger in AFTA (over 60%) compared with the regional average. Electronics and electrical products are also major areas of activity in other countries and regions. But the trade patterns of these countries and regions are characterized by a significant presence of other items, especially automotive components (SITC 78) and other transport equipment (SITC 79). For instance, components of these two product categories accounted for a mere 4.7% of total component exports in developing East Asia in 2005/06 compared with more than one-third in NAFTA and the EU15. Moreover, unlike in NAFTA and the EU15, the share of automotive components in East Asian imports is much higher than exports. This asymmetry is an indication of automotive and transport equipment components’ relatively low level of participation in network trade. This cannot be explained in terms of a competitive edge in electronics and electrical industries alone. The total trade figures behind these export shares show that export growth in these products during 1995–2006 was much slower in East Asia—only 5% in current US dollar terms—compared with over 20% in NAFTA and over 15% in the EU15. There are two possible reasons for this contrast requiring further study. First, in most of East Asia, binding content protection requirements for the domestic production of automotives and tariffs on final products (usually existing side-by-side with low or zero tariffs on components) have remained relatively high until recently. Tariff protection and content protection requirements usually lead to more components being produced domestically. They also tend to retard exports not only because of the incentive bias against exports, but also because domestic market-oriented production usually does not achieve the quality standards and cost competitiveness required for export success. Second, unlike electronics and electrical industries, components in the automotive industry12 are generally characterized by low value-to-weight ratios, which make it too costly to use air transport for timely delivery (Hummels 2007). This could well be an important consideration for locating component production and assembly plants close to final assembly plants within automobile production networks, and is consistent with the
12 Air shipping is the mode of transport for over two-thirds of electronics exports from Singapore, the
Philippines, Thailand, and Malaysia. Estimates are based on US Trade Commission data on trade by mode of transport during 2000–2005.

Global Production Sharing, Trade Patterns, and Determinants of Trade Flows in East Asia | 11
heavy concentration of international trade in automotive components within NAFTA and the EU compared with other regions. 4.2 The PRC Factor East Asia’s involvement in global production networks clearly predates the emergence of the PRC as a major player in this area. Nonetheless, the PRC’s rapid rise has undoubtedly added a new dimension to East Asia’s position in global production sharing. Between 1992/93 and 2005/06, the PRC’s share of world exports and imports of components increased from 1.1% to 10.9% and from 2.4% to 11.5%, respectively (see Table 2). A comparison of the data on the share of components in total exports and imports highlights an important difference between the PRC and the rest of developing East Asia (see Table 3). In the PRC, components accounted for a much larger share of imports (60.4% in 2005/06) compared with exports (34.8%). In other East Asian countries, the percentage shares were broadly similar for both imports and exports, reflecting a predominant role in component production and assembly within regional production networks. Figure 2 illustrates the nature of PRC involvement within regional production networks. The bulk of components used in final assembly in the PRC comes from other economies in the region. At the same time, final goods (total exports minus component imports) account for an overwhelming share of PRC exports to the rest of the world—mostly the US and EU. In 2005/06, components accounted for only 12% of total PRC exports to the rest of the world. The share of components in total PRC manufactured imports from East Asia grew from 18% in 1994/95 to over 44% in 2006/07. Within manufacturing, the share is much larger for machinery and transport equipment imports—nearly 75% in 2006/07. Interestingly, although the PRC’s importance as a market for the rest of East Asia increased during the period under study, the importance of the region for PRC’s expanding exports has declined notably. For instance, only 32% of total PRC manufactured exports were destined for regional markets in 2006/07 compared with 53.3% in 1994/95. By contrast, the region’s share of PRC imports increased from 20.0% to 32.7% over the same period. Overall, these patterns reflect the PRC’s increasingly important role as the global economy’s premier final assembly center, linking East Asia with the rest of the world through global production networks.
To summarize, the patterns revealed by the trade data clearly debunk the so-called decoupling thesis—that East Asia has become a PRC-centered, self-contained economic entity, with the potential for maintaining its own growth dynamism independent of economic vicissitudes in traditional, developed market economies. 4.3 Determinants of East Asia’s Growing Role in Global Production
Sharing While the rapid growth of global production sharing is a global phenomenon, East Asia is unique for its preeminent position in this relatively new form of international exchange. Neither the formation of NAFTA in 1991, which enticed US MNEs’ to establish production bases in Mexico, nor the successive enlargement of the EU beginning in the

12 | Working Paper Series on Regional Economic Integration No. 41
late 1990s, which encompassed relatively low-wage countries in Eastern Europe, have diminished East Asia’s dominance in global production networks. Several factors appear to be behind East Asia’s continued attractiveness as a center of global production sharing. First, despite rapid economic growth, manufacturing wages in several of the region’s economies remain significantly lower than those in Mexico and the European periphery (Table 6). Perhaps more importantly, significant wage differences among economies in East Asia in fact encourage the rapid expansion of intra-regional product sharing systems, giving rise to increased cross-border trade in components. Second, the relative factor cost advantage of these economies has been supplemented by more favorable trade and investment policies along with better ports and communication systems—which facilitate trade by reducing the cost of maintaining services links (Carruthers et al., 2003). Most of the region’s economies, including the PRC, rank favorably in the World Bank’s global logistics performance index (LPI) (Table 7). Singapore—by far the biggest transshipment hub in the region—tops the world’s overall logistics quality rankings. The other major transshipment hub in the region—Hong Kong, China—ranks eighth. According to data on inward FDI, East Asia has been the most favored region in the world for MNEs setting up operations.
Third, as the early-birds of international specialization, Southeast Asia (in particular Malaysia, Singapore, and Thailand) seems to offer considerable agglomeration advantages for companies already located there. Site selection for MNE assembly operations are strongly influenced by the presence of other key market players in a given country or its neighbors. Having long enjoyed successful operations in the region, many MNEs (particularly US-owned MNEs) have significantly upgraded the technology employed by regional production networks and assigned greater global production responsibilities to local affiliates. This is especially true in Singapore and more recently Malaysia and Thailand (Athukorala 2008; Borrus et al., 2000; McKendrick et al.; 2000). In sum, the Asian experience substantiates the view that, the longer they stay, MNE affiliates tend to become increasingly entrenched in their host countries—particularly as longer-term reforms better the overall investment climate (Rangan and Lawrence, 1999).
Finally, the PRC’s emergence as the premier low-cost assembly hub for a wide range of electrical and electronics products has boosted component production and assembly in other economies in the region. Here, the PRC’s role is particularly important due to its hinterland advantage—its vast supply of labor readily brought into production activities and its ability to meet changing international demand without causing large factor price disturbances (Jones 2000). 5. Global Production Sharing and Determinants of Trade
Flows How does global production sharing affect the degree of sensitivity of trade flows to changes in international prices relative to domestic prices? Does it call for a serious re-

Global Production Sharing, Trade Patterns, and Determinants of Trade Flows in East Asia | 13
think of the role of exchange rate policy (and other domestic policies that affect relative prices) in balance of payments adjustments? In recent literature, two competing views have emerged on this issue. One view holds that global production sharing has increased the sensitivity of trade flows to relative price changes, thereby enhancing the efficacy of exchange rate policy (Obstfeld 2002). The increasing importance of global production sharing induces firms to respond swiftly to changes in relative prices (brought about by changes in exchange rates and tariffs) by switching between domestic and imported inputs, shifting tasks across borders, or changing procurement sources of final (assembled) products. Production networks not only open up greater opportunities for shifting production and procumbent sources in line with price changes, but also act as swift and efficient purveyors of market information among participants. The alternative view—which takes a broader perspective of the nature and modalities of international exchange based on global production sharing—holds that global production sharing could in fact weaken the link between international price changes and trade flows for several reasons (Arndt 2008, Jones and Kierzkowski 2001). First, in the process of global production sharing, international prices and cost differentials are only one consideration for firms in deciding on production location and procurement. Setting up overseas production bases and establishing services links entail high fixed costs. Once incurred, relative price and cost changes become less important in business decision making. This may be particularly true in business dealings with production bases located in developing countries, because the wage gap between these and home countries are so vast that even a large change in wages is unlikely to significantly impact profit margins. Second, activities within production networks are generally characterized by fixed-coefficient production techniques (Leontief technology) and, therefore, the substitutability of components obtained from various sources is rather limited. Within global production networks, production units located in different economies normally specialize on specific tasks that are not easily substituted elsewhere (Jones 2000). Third, global production sharing weakens the link between the domestic cost of production and export competitiveness. When a firm is engaged in a given segment (slice) of a vertically integrated production process, its export profitability depends not only on external demand and the domestic cost of production, but also on supply conditions in economies supplying components and their bilateral exchange rate. Consequently, the change in the price of imported inputs becomes an important determinant of export profitability, depending on the magnitude of the share of domestic content (value added + domestically produced inputs) in exported goods.
Fourth (and related to the first), changes in exchange rates affect component imports and end-product exports differently. If exports are made with imported components, then exchange rate depreciation (appreciation) of a given currency increases (reduces) the domestic price of its exports. But it also reduces (increases) the domestic price of its component imports. This reduces (increases) the overall profitability of exporting compared with products entirely based on locally-procured inputs. The relationship

14 | Working Paper Series on Regional Economic Integration No. 41
becomes more complicated when (i) components are procured from economies other than those for which the final products are destined, and (ii) the number of economies involved in the production chain increases (Arndt 2008). In some cases, exchange rate fluctuations have offsetting effects on imports and exports, with the net effect on exports consequently weaker than in cases where the entire product is produced in one economy.
Combined, these suggest that the impact of global production sharing on the price and income elasticities of world trade is very much an empirical issue. However, to date, it lacks sufficient empirical scrutiny despite its important implications for trade and macroeconomic policy in open economies. There are at least three relevant studies, however: Athukorala (2004), Jongwanich (2009), and Arndt and Huemer (2007). Athukorala (2004) examines determinants of manufacturing exports from Thailand at the one-digit SITC level for 1995–2003. The results suggest that the magnitude of price elasticity of exports of machinery and transport equipment (SITC 7), which is dominated by network trade, is rather small compared with that of the other three export categories. Jongwanich (2009) confirms this finding in a comparative analysis of determinants of manufacturing exports from nine East Asian countries between 1993-2008. Arndt and Huemer (2007) assess the extent to which the sensitivity of US–Mexico bilateral manufacturing trade to the key explanatory variables in the standard trade equation (relative price and home and foreign income) is affected by production networks. Their econometric estimates based on 1989–2002 data show that exports of automotive components do not respond to relative price changes and are solely determined by income levels in the two countries.
This section seeks to add to this fledgling literature using two new data sets—one for US manufactured imports and the other for world manufactured exports—put together from various sources. Together, the data sets allow the examination of the sensitivity of the standard import and export demand function estimation to trade flowing within global production networks, with broader commodity and country coverage than so far attempted. The methodology involves comparing the results (i) when the standard model is estimated for total imports and exports of different product categories, among which the relative importance of production sharing varies; and (ii) when the same model is applied to components and final goods within a given product category. It is important to emphasize at the outset that the purpose here is to examine the implications of global production sharing for price elasticities of trade, estimated using the standard trade model, rather than to formulate a best-fit model for explaining trade flows in the presence of global production sharing. 5.1 US Demand for Manufacturing Imports The analysis in this section is based on quarterly panel data put together from the electronic databases of the US Trade Commission (data on imports and import prices) and the US Bureau of Labor Statistics (data on domestic producer price indexes and gross national product [GNP]). The original data on manufacturing imports available at the 5-digit level of the SITC were first separated into components and final goods (following the procedure described in Section 3) and then aggregated to the SITC 3-digit level. The commodity coverage was determined based on the availability of import price
Global Production Sharing, Trade Patterns, and Determinants of Trade Flows in East Asia | 15
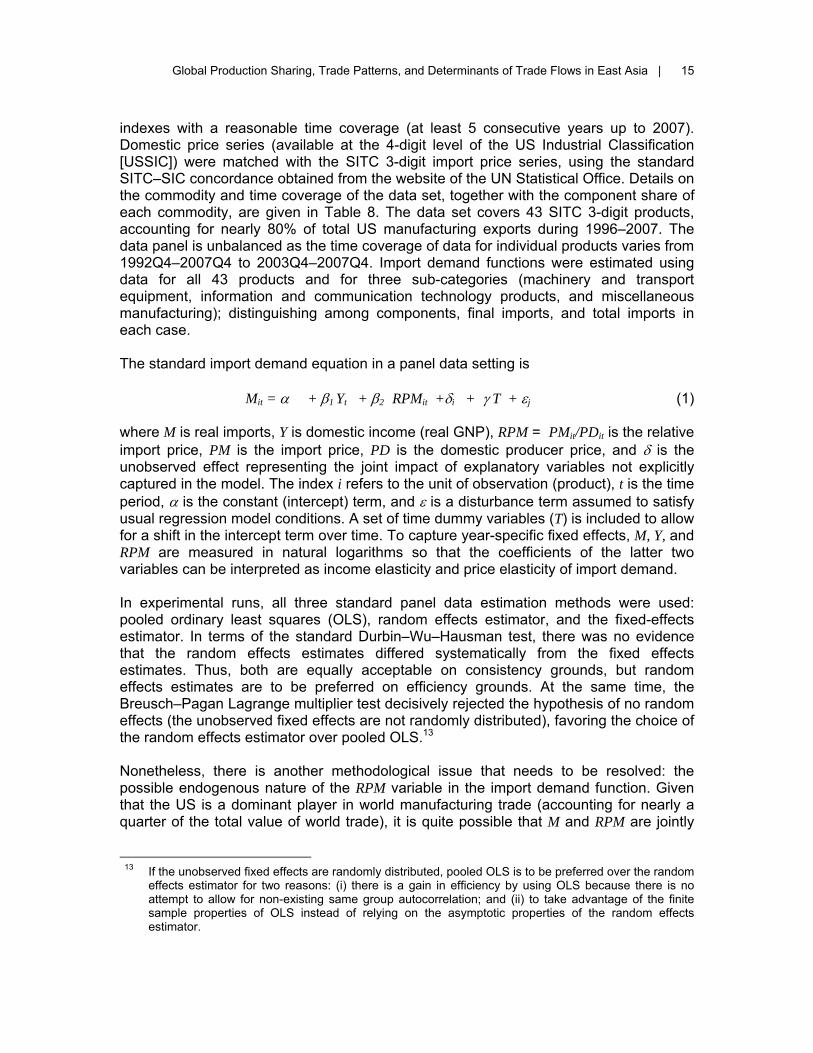
indexes with a reasonable time coverage (at least 5 consecutive years up to 2007). Domestic price series (available at the 4-digit level of the US Industrial Classification [USSIC]) were matched with the SITC 3-digit import price series, using the standard SITC–SIC concordance obtained from the website of the UN Statistical Office. Details on the commodity and time coverage of the data set, together with the component share of each commodity, are given in Table 8. The data set covers 43 SITC 3-digit products, accounting for nearly 80% of total US manufacturing exports during 1996–2007. The data panel is unbalanced as the time coverage of data for individual products varies from 1992Q4–2007Q4 to 2003Q4–2007Q4. Import demand functions were estimated using data for all 43 products and for three sub-categories (machinery and transport equipment, information and communication technology products, and miscellaneous manufacturing); distinguishing among components, final imports, and total imports in each case. The standard import demand equation in a panel data setting is
Mit = α + β1 Yt + β2 RPMit +δi + γ T + εj (1) where M is real imports, Y is domestic income (real GNP), RPM = PMit/PDit is the relative import price, PM is the import price, PD is the domestic producer price, and δ is the unobserved effect representing the joint impact of explanatory variables not explicitly captured in the model. The index i refers to the unit of observation (product), t is the time period, α is the constant (intercept) term, and ε is a disturbance term assumed to satisfy usual regression model conditions. A set of time dummy variables (T) is included to allow for a shift in the intercept term over time. To capture year-specific fixed effects, M, Y, and RPM are measured in natural logarithms so that the coefficients of the latter two variables can be interpreted as income elasticity and price elasticity of import demand. In experimental runs, all three standard panel data estimation methods were used: pooled ordinary least squares (OLS), random effects estimator, and the fixed-effects estimator. In terms of the standard Durbin–Wu–Hausman test, there was no evidence that the random effects estimates differed systematically from the fixed effects estimates. Thus, both are equally acceptable on consistency grounds, but random effects estimates are to be preferred on efficiency grounds. At the same time, the Breusch–Pagan Lagrange multiplier test decisively rejected the hypothesis of no random effects (the unobserved fixed effects are not randomly distributed), favoring the choice of the random effects estimator over pooled OLS.13 Nonetheless, there is another methodological issue that needs to be resolved: the possible endogenous nature of the RPM variable in the import demand function. Given that the US is a dominant player in world manufacturing trade (accounting for nearly a quarter of the total value of world trade), it is quite possible that M and RPM are jointly
13 If the unobserved fixed effects are randomly distributed, pooled OLS is to be preferred over the random
effects estimator for two reasons: (i) there is a gain in efficiency by using OLS because there is no attempt to allow for non-existing same group autocorrelation; and (ii) to take advantage of the finite sample properties of OLS instead of relying on the asymptotic properties of the random effects estimator.
16 | Working Paper Series on Regional Economic Integration No. 41
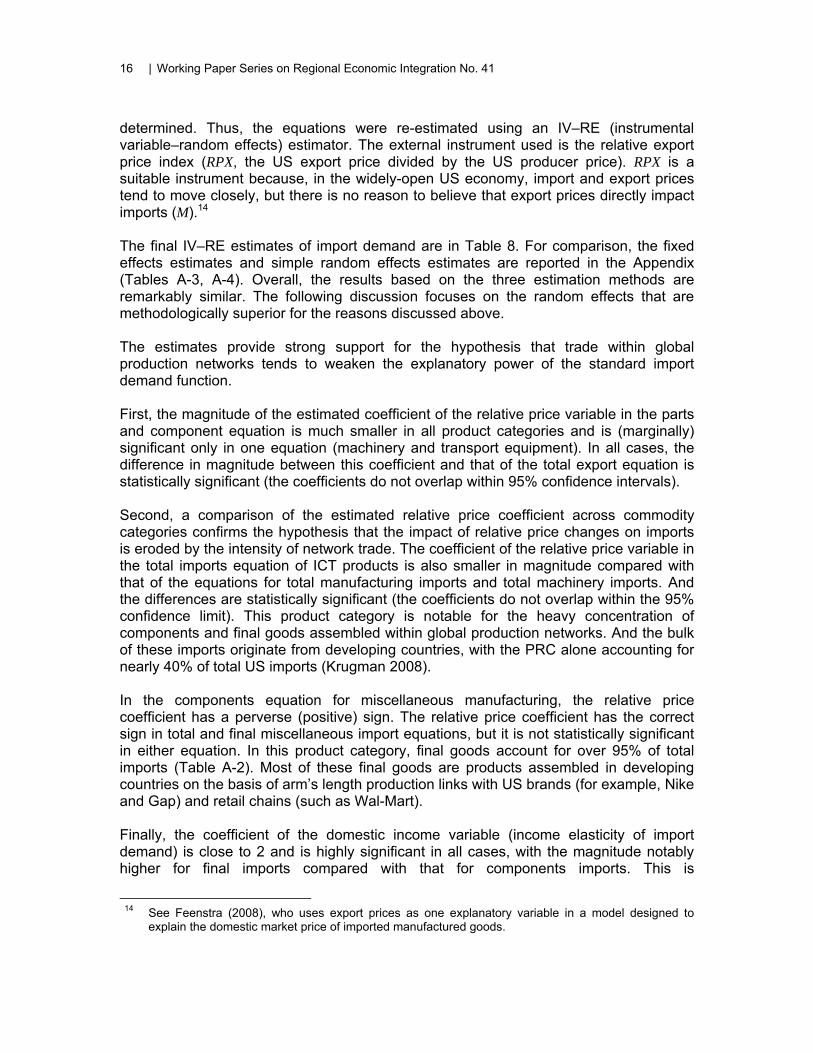
determined. Thus, the equations were re-estimated using an IV–RE (instrumental variable–random effects) estimator. The external instrument used is the relative export price index (RPX, the US export price divided by the US producer price). RPX is a suitable instrument because, in the widely-open US economy, import and export prices tend to move closely, but there is no reason to believe that export prices directly impact imports (M).14 The final IV–RE estimates of import demand are in Table 8. For comparison, the fixed effects estimates and simple random effects estimates are reported in the Appendix (Tables A-3, A-4). Overall, the results based on the three estimation methods are remarkably similar. The following discussion focuses on the random effects that are methodologically superior for the reasons discussed above. The estimates provide strong support for the hypothesis that trade within global production networks tends to weaken the explanatory power of the standard import demand function.
First, the magnitude of the estimated coefficient of the relative price variable in the parts and component equation is much smaller in all product categories and is (marginally) significant only in one equation (machinery and transport equipment). In all cases, the difference in magnitude between this coefficient and that of the total export equation is statistically significant (the coefficients do not overlap within 95% confidence intervals).
Second, a comparison of the estimated relative price coefficient across commodity categories confirms the hypothesis that the impact of relative price changes on imports is eroded by the intensity of network trade. The coefficient of the relative price variable in the total imports equation of ICT products is also smaller in magnitude compared with that of the equations for total manufacturing imports and total machinery imports. And the differences are statistically significant (the coefficients do not overlap within the 95% confidence limit). This product category is notable for the heavy concentration of components and final goods assembled within global production networks. And the bulk of these imports originate from developing countries, with the PRC alone accounting for nearly 40% of total US imports (Krugman 2008).
In the components equation for miscellaneous manufacturing, the relative price coefficient has a perverse (positive) sign. The relative price coefficient has the correct sign in total and final miscellaneous import equations, but it is not statistically significant in either equation. In this product category, final goods account for over 95% of total imports (Table A-2). Most of these final goods are products assembled in developing countries on the basis of arm’s length production links with US brands (for example, Nike and Gap) and retail chains (such as Wal-Mart). Finally, the coefficient of the domestic income variable (income elasticity of import demand) is close to 2 and is highly significant in all cases, with the magnitude notably higher for final imports compared with that for components imports. This is
14 See Feenstra (2008), who uses export prices as one explanatory variable in a model designed to
explain the domestic market price of imported manufactured goods.

Global Production Sharing, Trade Patterns, and Determinants of Trade Flows in East Asia | 17
understandable as demand for components is basically governed by the production process of user industries, whereas final demand is more closely linked with domestic income. 5.2 World Export Demand The starting point of the modeling exercise in this section is the standard export demand equation, which relates real exports to world income and the relative export price (world price as a ratio of domestic price). In estimating export demand using cross-country panel data, it is necessary to augment the original formulation by incorporating variables to capture inter-country heterogeneity. Thus, four control variables are added, guided by the standard practice in the recent literature on estimating cross-country trade equations.15 These are the precipitate income of the exporting country (PGDP), an index of the quality of trade-related logistics (LPI), trade-weighted distance to major markets (DST), and a dummy variable that distinguishes land-locked countries from other countries (LNDL). Among the control variables, PGDP is included to capture the impact of the initial level of economic advancement on export performance, operating through channels other than logistics quality. We can hypothesize that GDP per capita has a positive effect on export performance: as countries grow richer, the scale of industrial output becomes conducive to global production sharing. The quality of trade-related logistics has received increased emphasis in recent years as a key determinant of the trade performance of developing countries. In particular, a country with better infrastructure (for example, well-established broadband networking) is presumably a preferable location for global sourcing because of the lower cost of establishing service links. Distance (DST) is a proxy for transport (shipping) costs and other costs associated with time lags, including internet charges and spoilage; and costs associated with physical distance, including ignorance of foreign customs and tastes. Distance can, in fact, be a more important influence on component trade compared with final trade because of multiple border-crossings involved in the value-adding chain. LNDL is included to capture possible disadvantages for a landlocked country (such as the lack of direct access to sea routes) that are not captured by the standard distance measure. Country group dummies for the PRC, other developing East Asian economies, and other developing countries are also added, treating developed countries as the base dummy, to allow for possible deviation in the overall levels of exports from these country groups from that of developed countries after controlling for the other explanatory variables. Finally, the time-specific fixed effects (T) are included to control for general technological change and other time-varying factors. The estimation equation is: QX = α + β1RP + β2YW + β3PGDP + β4LP +β5DIST + β6LNDL + β7DCH
+β8DEA +β9ODC + γ T + εij (2)
15 Limao and Venables (2001), Soloaga and Winters (2001), and works cited therein.

18 | Working Paper Series on Regional Economic Integration No. 41
where QX is the volume of the country’s exports (export value deflated by world price). The explanatory variables are defined below, with the expected sign of the regression coefficient in brackets. RP Relative price: world price (expressed in domestic currency), PW relative
to domestic price (PD) (+) YW world income (weighted average GNP of major importing countries) PGDP Real GDP per capita (+) LPI an index of logistic performance (trade-related institutional setting and
infrastructure) (+) DST Distance to major export markets (–1) LDL A binary variable assuming the value 1 if i and j share a common land
border and 0 otherwise (+) DCH Intercept dummy variable for the PRC (+ or –) DEA Intercept dummy variable for developing East Asian economies (other
than the PRC) (+ or –) DODC Intercept dummy variable for other developing countries Korea (+ or –) T A set of time dummy variables to capture year-specific fixed effects α A constant term ε A stochastic error term, representing the omitted other influences on
bilateral trade RP, YW, PGDP, and DST are measured in logarithms so that the respective regression coefficients can be interpreted as elasticities. Data Estimates were done using the export demand equation for total manufactured exports (SITC 5–8 less SITC 68) and two subcategories: machinery and transport equipment (SITC 7) and miscellaneous manufacturing (SITC 8), each of which was decomposed into components and final goods. The main data source is the UN Comtrade database. For the purpose of the analysis, only countries with data on manufactured exports and components for at least 5 consecutive years up to 2005 or 2006 were included. There are 158 countries that met this criterion. The earliest starting year was set at 1992, which is when the SITC Rev 3 had been fully implemented by almost all countries under the coverage of the US trade data reporting system. Data on manufacturing exports were disaggregated into components and final goods following the procedures explained in Section 3. The US import price index (extracted from the US Trade Commission database) is used as the proxy for world price for all countries. For each country, the world price index is the weighted average of 3-digit US import price indexes computed using export shares in 2000 of that country. The domestic price is measured by the domestic implicit GDP deflator. The data on PGDP and GDP deflators come from the World Bank’s World Development Indicators database. Data on LPI came from the newly-developed Logistics Performance Index database of the World Bank (Arvis et al., 2007), which provides the first in-depth, cross-country assessment of trade-related logistic provisions. It covered 150 economies, including 28 in developing Asia. It is based on a worldwide survey of global freight forwarders and express carriers, complemented by a number of qualitative and quantitative indicators of

Global Production Sharing, Trade Patterns, and Determinants of Trade Flows in East Asia | 19
the domestic logistics environment, institutions, and performance of supply chains. Logistics quality is assessed using a 5-point scale (1 for the worst performance and 5 for the best), focusing on seven areas. 16 The composite LPI index is constructed by combining the seven sub-indexes using principal component analysis.17
DST is the export-share weighted distance between a given country and its 10 major export destinations, as reflected in export data for 2000. The data on bilateral distance come from the trade patterns database of the French Institute for Research on the International Economy (CEPII). The CEPIT distance measure is a composite measure of the bilateral great-circle distance between major cities of each economy compiled by taking into account the trading significance of each city in each economy. Export shares for 2000 are used in compiling the distance measure for a given economy. 5.3 Results The fixed-effects estimator is not appropriate because our model contains a number of time-invariant variables. Both pooled OLS and random-effects estimators were used, with the pooled OLS as the preferred estimator based on the Breusch–Pagan Lagrange multiplier test. The results are reported in Table 9. Regression estimates based on data for all countries (158) are reported in Panel A. Estimates undertaken separately for developed (22) and developing (136) economies are reported in Panel B and Panel C, with the latter estimates further distinguishing between developing Asian economies (9) and other developing countries (127) (Panels C1 and C2). For all economies (Table 9, Panel A), the coefficient of the relative price variable is smaller in magnitude and not statistically different from zero in the equation for machinery and transport equipment exports. In the equation for total manufacturing and miscellaneous manufacturing, the coefficient is statistically significant with the expected (positive) sign, but smaller in magnitude compared with total imports. Reflecting the dampening effect of the share of components on the overall price responsiveness of total exports, the price elasticity of demand for total machinery and transport equipment exports is 0.16% compared with 0.19% for total manufacturing exports. The world income elasticity coefficient is statistically significant in all equations with the expected positive sign. However, for machinery and transport equipment, the magnitude of this coefficient is much smaller in the components equation (0.19) compared with that for total exports (0.52). For miscellaneous manufacturing and total manufacturing, the comparable estimates are 0.46 and 1.07, and 0.62 and 0.82, respectively. All control variables included in the regression specification carry statistically significant coefficients with signs consistent with a priori expectations. Interestingly, the coefficient of the variable of per capita income of exporting economies is much larger in magnitude
16 These are (i) efficiency of the clearance process by customs and other border agencies, (ii) quality of
transport and information technology infrastructure, (iii) ease and affordability of arranging international shipments, (iv) competence of the local logistics industry, (v) ability to track and trace international shipments, (vi) domestic logistic costs, and (vii) timeliness of shipments in reaching their destination.
17 Arvis et al., (2007). Section 1 provides details on the overall concept of the LPI and the methodology underlying its construction.

20 | Working Paper Series on Regional Economic Integration No. 41
in all three cases compared with that of final and total export equations. This is consistent with the postulate that, when controlled for other relevant variables, the stage of development that captures various prerequisites needed for providing efficient services links has a positive impact on the attractiveness of an economy as a location for component production and assembly within global production networks. The results for the intercept dummies for the PRC and developing East Asia are consistent with the superior export performance of these economies from a comparative global perspective.
The disaggregated estimates point to an interesting contrast between developed and developing economies, and within the latter group between developing East Asian and other developing economies in relation to the implications of global production sharing on the explanatory power of the standard export equation. Relative price and world income do a much better job of explaining both exports of components and final goods from developed countries. The coefficients of both variables are much larger in magnitude and highly significant in equations for both total exports and components of total manufacturing and the two sub-categories. Interestingly, in all three cases, the magnitude of the coefficient of the relative price variable is larger compared with that of total and final exports.
By contrast, the coefficient of the relative price variable is either statistically insignificant and/or significant with the perverse sign in equations for developing economies, in particular for developing East Asian economies. Non-price factors—exporters’ per capita income, world income, and logistics performance—are the prime determinants of exports from these economies with respect to both components and final goods. The results for total manufacturing are strikingly similar to those for machinery and transport equipment. This is understandable given the dominant role played by machinery and transport equipment in the rapid export expansion of these economies during the study period. 6. Concluding Remarks Global production sharing has been one of the defining characteristics of economic globalization over the past three decades. Trade in parts and components has been expanding more rapidly than that of conventional final goods trade over this period. At the same time, geographical patterns of trade in final goods have undergone a dramatic transformation as the final assembly stages of vertically integrated global industries increasingly shift to low-cost economies. While production sharing is now a global phenomenon, the degree of dependence on this new form of international specialization is disproportionately high in East Asia. This is due to a number of factors, including a more favorable policy environment for international production, agglomeration benefits arising from the early entry into this new form of specialization, and considerable cross-border wage differentials in the region. Global production sharing is heavily concentrated in machinery and transport equipment (SITC 7). Within SITC 7, component trade in East Asia is heavily concentrated in electronics and electrical industries, especially semiconductors. The degree of concentration of component trade in electronics is much larger in AFTA (over 60%)

Global Production Sharing, Trade Patterns, and Determinants of Trade Flows in East Asia | 21
compared with the regional average. The degree of involvement of East Asian economies in global production sharing in the automotive industry is much lower compared with NAFTA and the EU15. A recent development has been the rapid rise of the PRC in regional production networks as the premier global assembly hub in electronics and electrical industries. The PRC’s import of components from East Asia has grown in line with the rapid expansion of its manufacturing exports, mostly to NAFTA and EU members. This is an important counterpoint to the popular belief that the PRC’s global integration will crowd out other countries’ opportunities for international specialization. At the same time, the data reported here on the nature of the PRC’s role within global production networks clearly reveals the fragility of the so-called decoupling thesis—that East Asia has become a PRC-centered, self-contained economic entity, with the potential for maintaining its own growth dynamism independent of economic vicissitudes in traditional, developed market economies. The rapid expansion of global production sharing poses a challenge to the standard approach to trade flow modeling, which continues to treat components and final goods as a unified, homogeneous product. The findings of the preliminary econometric analysis here suggest that components are remarkably less sensitive to changes in relative prices than one might expect. Consequently, the sensitivity of aggregate trade flows to relative price changes tends to diminish as trade cuts ever more rapidly into the production process. This seems to be a particularly important issue when it comes to modeling manufacturing trade flows in developing economies. The finding that a rapid expansion in network trade may dampen the degree of sensitivity of trade flows to changes in relative prices has important implications for the contemporary debate on the choice of exchange rate regime and the efficacy of exchange rate movements in balance of payments adjustments. For instance, a key concern underpinning the case against a more flexible (or floating) exchange rate regime is the likely adverse effects of exchange rate volatility on trade expansion. The rapid expansion of global production sharing could diminish the importance of this criticism to the extent that network-related trade erodes the influence of changes in relative price on overall trade flows. With regard to the role of the exchange rate in balance of payments adjustments, the finding has direct implications for the current policy concern about the role of the PRC’s exchange rate policy. It is alleged that the PRC maintains an artificially undervalued currency (yuan) in order to maintain or increase its trade surplus. But given the PRC’s pivotal role as the premier assembly hub within global production networks, the potency of exchange rate adjustment in determining the current account surplus could well be much less (or even virtually negligible) than generally anticipated.
22 | Working Paper Series on Regional Economic Integration No. 41
Table 1: Parts and Components (P&C) in World Manufacturing Trade, 1992/93 – 2005/06
Product groups (SITC code in brackets)
Composition: total trade (%)
Composition: P&C trade (%)
P&C share in total trade (%)
1992/93 2005/06 1992/93 2005/06 1992/93 2005/06
Contribution of P&C to growth of Mfg trade (%)
Chemicals (5) 12.33 15.15 n.a n.a n.a n.a n.a. Resource based products (6–68) 18.90 16.18 n.a. n.a. n.a. n.a. n.a.
Textiles (65) 4.45 2.52 n.a. n.a. n.a. n.a. n.a.
Machinery and transport equipment (7) 49.32 52.38 95.26 95.70 36.5 40.7 42.7
Power generating machines (71) 3.20 3.22 11.32 9.73 66.9 67.3 67.5
Specialized industrial machine (72) 4.29 3.37 5.67 4.13 25.0 27.3 29.0 Metal working machine (73) 1.00 0.87 1.39 1.07 26.3 27.4 28.1
General industrial machinery (74) 5.24 5.08 4.74 4.12 17.1 18.1 18.6
ICT products (75+76+772+776) 16.07 21.19 42.92 52.68 50.5 55.5 57.1 Office machines and automatic data processing machines (75) 6.43 6.70 10.85 11.55 31.9 38.4 41.5
Telecommunication and sound recording equipment (76) 4.69 6.74 7.25 8.27 29.3 27.3 26.7
Semiconductors and semiconductor devices (772+776) 4.96 7.74 24.82 32.87 94.8 94.7 94.7
Electrical machinery (77–772–776) 9.32 12.53 7.68 6.58 15.6 11.7 10.4 Road vehicles (78) 12.18 11.61 16.83 14.43 26.1 27.7 28.6 Other transport equipment (79) 2.97 2.26 4.71 2.96 30.1 29.3 28.6
Miscellaneous manufacturing (SITC 8) 19.45 16.29 4.74 4.30 4.6 5.9 6.7
Fabricated building fixtures and machines (81) 0.52 0.50 0.55 0.36 19.9 15.7 13.5
Furniture and parts thereof (SITC 82) 1.27 1.41 0.86 1.22 12.7 19.2 22.0
Apparel and clothing accessories (84) 5.39 3.76 0.02 0.01 0.1 0.0 0.0
Professional and scientific equipment (87) 2.25 3.10 1.57 1.78 13.2 12.8 12.7
Photographic apparatus (88) 1.85 1.13 1.43 0.83 14.6 16.5 18.8
Total manufacturing trade 100.00 100.00 100.00 100.00 18.9 22.3 24.0
USD billion 2,650.5 7,901.7 501.6 1,762.0
Note: The UN trade data reporting system does not provide for the separation of parts and components from total (reported) trade in these product groups. However, according to evidence from case studies, production sharing practices are not still widespread in these industries.
Source: Compiled from UN Comtrade database (importer records).

Global Production Sharing, Trade Patterns, and Determinants of Trade Flows in East Asia | 23
Table 2: Geographic Profile of World Trade in Parts and Components, 1992/93 and 2005/06
Exports Imports Trade
(exports + imports) 1992/93 2005/06 1992/93 2005/06 1992/93 2005/06
East Asia 30.1 40.6 24.4 38.1 27.3 39.4 Japan 15.7 10.0 3.3 4.0 9.5 7.0 Developing East Asia 14.4 30.6 21.1 34.1 17.8 32.3 ASEAN + 3 26.4 25.6 18.1 29.4 22.2 27.5 Republic of Korea 2.3 4.9 2.7 2.7 2.5 3.8 People’s Republic of China (PRC) 1.1 10.9 2.4 11.5 1.8 11.2 ASEAN 10 6.1 10.7 9.6 11.1 7.8 10.9 Indonesia 0.1 0.5 0.9 0.3 0.5 0.4 Malaysia 2.1 3.8 2.6 2.8 2.3 3.3 Philippines 0.6 2.1 0.5 1.4 0.5 1.8 Singapore 2.5 2.7 4.0 4.9 3.3 3.8 Thailand 0.8 1.4 1.6 1.4 1.2 1.4 Viet Nam 0.0 0.1 0.0 0.2 0.0 0.1 Other ASEAN 0.0 0.0 0.1 0.0 0.0 0.0 Taipei,China 3.3 3.3 2.8 2.6 3.1 3.0 Hong Kong, China 1.7 0.8 3.6 6.1 2.6 3.4 South Asia 0.1 0.3 0.6 0.7 0.4 0.5 India 0.1 0.3 0.4 0.6 0.2 0.5 Oceania 0.3 0.2 1.3 0.8 0.8 0.5 NAFTA 24.8 17.6 26.9 20.4 25.8 19.0 Mexico 2.4 2.7 1.9 3.4 2.1 3.1 EU15 36.0 27.7 38.3 28.7 37.2 28.2 Developed countries 76.2 53.9 69.7 51.6 72.9 52.7 Developing economies 23.8 46.1 30.3 48.4 27.1 47.3 World 100 100 100 100 100 100 502 1762 502 1762
Source: Compiled from UN Comtrade database (importer records).

24 | Working Paper Series on Regional Economic Integration No. 41
Table 3: Share of Parts and Components in Manufacturing Trade by Selected Country/regions and Major Product categories,
1992/3 and 2005/6 (%)
Country/region and product Exports Imports Trade
(exports + imports) 1992/93 2005/06 1992/93 2005/06 1992/93 2005/06
East Asia
Manufacturing (SITC 5 to 8 – 68) 20.1 26.9 21.5 35.9 20.7 30.6
Machinery and transport equipment (SITC 7) 35.3 43.3 41.4 59.3 37.7 49.7
ICT products (SITC 75+76+772+776) 47.4 55.4 67.4 76.6 54.6 64.1
Electrical machinery (SITC 77 – 772 – 776) 30.9 26.6 28.8 31.2 30.1 28.3
Road vehicles (SITC 78) 21.1 24.6 28.2 46.2 23.0 29.2
Miscellaneous manufacturing (SITC 8) 3.7 4.9 6.4 8.4 4.6 6.1
Japan
Manufacturing (SITC 5 to 8 – 68) 24.2 29.4 15.3 24.6 22.0 27.8
Machinery and transport equipment (SITC 7) 31.3 39.5 38.6 48.3 32.3 41.6
ICT products (SITC 75+76+772+776) 44.7 70.4 60.3 58.6 47.1 66.4
Electrical machinery (SITC 77 – 772 – 776) 38.0 40.0 26.1 34.1 35.6 38.0
Road vehicles (SITC 78) 19.1 20.1 17.6 32.6 19.0 21.2
Miscellaneous manufacturing (SITC 8) 10.9 14.7 4.0 5.8 7.5 9.7
Developing East Asia
Manufacturing (SITC 5 to 8 – 68) 17.0 26.2 18.9 31.8 18.1 28.8
Machinery and transport equipment (SITC 7) 40.9 44.6 32.8 51.0 35.7 47.8
ICT products (SITC 75+76+772+776) 49.5 52.8 55.2 69.1 52.5 60.2
Electrical machinery (SITC 77 – 772 – 776) 25.6 23.2 25.0 26.5 25.3 24.6
Road vehicles (SITC 78) 38.1 33.3 25.6 32.6 28.7 33.0
Miscellaneous manufacturing (SITC 8) 2.2 3.7 7.2 8.1 3.7 5.2
ASEAN + 3
Manufacturing (SITC 5 to 8 – 68) 21.2 18.6 22.7 35.8 21.8 25.0
Machinery and transport equipment (SITC 7) 35.4 29.8 41.7 59.0 37.7 40.4
ICT products (SITC 75+76+772+776) 48.2 37.5 69.9 77.5 55.0 51.9
Electrical machinery (SITC 77 – 772 – 776) 32.8 15.9 31.4 32.7 32.3 21.7
Road vehicles (SITC 78) 19.7 19.3 29.8 47.0 21.7 24.7

Global Production Sharing, Trade Patterns, and Determinants of Trade Flows in East Asia | 25
Country/region and product Exports Imports Trade
(exports + imports) 1992/93 2005/06 1992/93 2005/06 1992/93 2005/06
Miscellaneous manufacturing (SITC 8) 3.8 2.6 7.5 9.1 4.8 4.5
Taipei,China
Manufacturing (SITC 5 to 8 – 68) 21.3 32.7 26.0 34.3 23.2 33.4
Machinery and transport equipment (SITC 7) 43.7 56.2 46.7 57.6 45.1 56.8
ICT products (SITC 75+76+772+776) 54.6 74.9 79.3 84.3 64.1 78.8
Electrical machinery (SITC 77 – 772 – 776) 32.9 15.8 29.8 26.2 31.8 19.1
Road vehicles (SITC 78) 55.9 64.5 36.9 55.1 45.7 60.8
Miscellaneous manufacturing (SITC 8) 4.4 15.4 6.8 12.3 4.9 14.2
Republic of Korea
Manufacturing (SITC 5 to 8 – 68) 18.3 31.4 25.9 28.3 21.8 30.3
Machinery and transport equipment (SITC 7) 42.7 46.1 45.2 51.6 44.0 47.9
ICT products (SITC 75+76+772+776) 56.9 65.1 78.8 76.9 65.5 68.5
Electrical machinery (SITC 77 – 772 – 776) 30.9 26.2 36.8 28.7 33.0 27.4
Road vehicles (SITC 78) 10.5 17.4 77.2 54.3 27.1 21.6
Miscellaneous manufacturing (SITC 8) 1.3 4.8 9.3 9.7 3.4 7.2
People’s Republic of China (PRC)
Manufacturing (SITC 5 to 8 – 68) 4.7 18.1 16.0 37.6 9.1 24.7
Machinery and transport equipment (SITC 7) 20.2 34.2 29.4 60.2 25.8 43.9
ICT products (SITC 75+76+772+776) 26.2 38.3 62.7 81.3 40.8 53.1
Electrical machinery (SITC 77 – 772 – 776) 11.6 22.1 38.3 34.4 19.8 25.3
Road vehicles (SITC 78) 28.6 51.5 26.3 56.1 26.8 53.7
Miscellaneous manufacturing (SITC 8) 1.0 2.5 19.2 10.2 2.4 3.8
Hong Kong, China
Manufacturing (SITC 5 to 8 – 68) 17.4 24.6 15.4 36.8 16.0 34.8
Machinery and transport equipment (SITC 7) 50.5 50.4 36.3 61.4 39.9 59.9
ICT products (SITC 75+76+772+776) 66.4 58.2 52.6 70.5 56.6 68.9
Electrical machinery (SITC 77 – 772 – 776) 30.8 23.3 21.3 26.6 23.8 26.1
Road vehicles (SITC 78) 56.5 44.1 15.1 17.4 16.5 19.7
Miscellaneous manufacturing (SITC 8) 3.9 4.1 4.7 5.3 4.4 5.0

26 | Working Paper Series on Regional Economic Integration No. 41
Country/region and product Exports Imports Trade
(exports + imports) 1992/93 2005/06 1992/93 2005/06 1992/93 2005/06
ASEAN10
Manufacturing (SITC 5 to 8 – 68) 25.9 38.3 29.6 43.8 28.0 40.9
Machinery and transport equipment (SITC 7) 44.1 57.3 46.5 65.0 45.5 60.9
ICT products (SITC 75+76+772+776) 48.1 63.5 72.7 81.0 59.1 70.8
Electrical machinery (SITC 77 – 772 – 776) 30.0 30.6 30.6 31.7 30.4 31.1
Road vehicles (SITC 78) 57.5 39.0 35.7 49.0 38.4 44.6
Miscellaneous manufacturing (SITC 8) 2.7 4.2 9.8 13.6 5.1 7.2
Indonesia
Manufacturing (SITC 5 to 8 – 68) 3.1 18.6 20.5 16.9 13.4 17.9
Machinery and transport equipment (SITC 7) 31.4 46.8 34.8 34.1 34.5 41.3
ICT products (SITC 75+76+772+776) 27.4 47.9 63.8 31.3 53.1 45.3
Electrical machinery (SITC 77 – 772 – 776) 51.8 41.8 35.0 47.7 38.1 43.2
Road vehicles (SITC 78) 32.8 74.2 70.4 52.4 66.5 59.5
Miscellaneous manufacturing (SITC 8) 0.7 1.6 17.4 11.7 3.4 2.6
Malaysia
Manufacturing (SITC 5 to 8 – 68) 32.7 46.8 36.7 51.1 34.8 48.5
Machinery and transport equipment (SITC 7) 46.6 59.2 52.6 68.8 49.7 62.8
ICT products (SITC 75+76+772+776) 51.1 62.5 86.7 84.9 64.7 69.8
Electrical machinery (SITC 77 – 772 – 776) 19.1 20.5 32.4 30.2 26.9 25.6
Road vehicles (SITC 78) 45.1 76.0 18.9 37.7 25.0 46.1
Miscellaneous manufacturing (SITC 8) 3.2 7.2 18.0 20.6 7.8 11.6
Philippines
Manufacturing (SITC 5 to 8 – 68) 34.3 65.8 24.4 64.1 28.9 65.1
Machinery and transport equipment (SITC 7) 69.4 76.5 44.6 83.0 55.1 79.0
ICT products (SITC 75+76+772+776) 71.2 81.2 77.3 94.2 73.3 85.9
Electrical machinery (SITC 77 – 772 – 776) 60.8 43.6 32.0 33.9 48.3 41.1
Road vehicles (SITC 78) 92.1 77.5 19.4 33.2 26.1 49.3
Miscellaneous manufacturing (SITC 8) 2.9 5.9 11.9 29.7 4.1 11.5

Global Production Sharing, Trade Patterns, and Determinants of Trade Flows in East Asia | 27
Country/region and product Exports Imports Trade
(exports + imports) 1992/93 2005/06 1992/93 2005/06 1992/93 2005/06
Singapore Manufacturing (SITC 5 to 8 – 68) 31.6 41.6 32.5 52.7 32.2 48.1
Machinery and transport equipment (SITC 7) 40.7 60.7 49.1 69.5 45.4 66.1
ICT products (SITC 75+76+772+776) 43.7 67.1 64.7 79.4 53.7 74.0
Electrical machinery (SITC 77 – 772 – 776) 26.8 22.8 26.5 34.8 26.6 31.1
Road vehicles (SITC 78) 80.3 54.3 40.1 40.9 46.0 42.8
Miscellaneous manufacturing (SITC 8) 4.7 7.3 5.6 12.5 5.3 10.7
Thailand
Manufacturing (SITC 5 to 8 – 68) 19.2 25.3 24.5 30.0 22.4 27.5
Machinery and transport equipment (SITC 7) 41.0 39.3 41.8 53.8 41.5 45.4
ICT products (SITC 75+76+772+776) 47.2 48.1 78.6 74.7 61.8 57.9
Electrical machinery (SITC 77 – 772 – 776) 29.9 23.0 33.0 25.4 31.7 24.1
Road vehicles (SITC 78) 51.9 25.4 32.0 75.6 33.3 40.4
Miscellaneous manufacturing (SITC 8) 3.0 5.9 12.4 8.1 5.1 6.6
Viet Nam
Manufacturing (SITC 5 to 8 – 68) --- 8.0 --- 11.5 --- 10.0
Machinery and transport equipment (SITC 7) --- 41.2 --- 30.3 --- 33.3
ICT products (SITC 75+76+772+776) --- 36.2 --- 52.9 --- 46.7
Electrical machinery (SITC 77 – 772 – 776) --- 63.1 --- 25.6 --- 43.1
Road vehicles (SITC 78) --- 47.6 --- 34.9 --- 37.5
Miscellaneous manufacturing (SITC 8) --- 0.8 --- 7.6 --- 1.7
Other ASEAN
Manufacturing (SITC 5 to 8 – 68) 3.4 0.7 18.2 11.5 14.2 2.1
Machinery and transport equipment (SITC 7) 63.3 31.2 33.4 25.4 34.4 26.8
ICT products (SITC 75+76+772+776) 39.2 73.9 45.8 27.6 45.3 40.0
Electrical machinery (SITC 77 – 772 – 776) 37.9 44.6 47.9 16.5 47.8 27.2
Road vehicles (SITC 78) 19.4 1.4 15.1 4.9 15.1 4.1
Miscellaneous manufacturing (SITC 8) 0.3 0.1 1.4 1.8 0.7 0.1

28 | Working Paper Series on Regional Economic Integration No. 41
Country/region and product Exports Imports Trade
(exports + imports) 1992/93 2005/06 1992/93 2005/06 1992/93 2005/06
South Asia Manufacturing (SITC 5 to 8 – 68) 2.6 5.1 13.7 13.3 8.0 9.1
Machinery and transport equipment (SITC 7) 44.1 42.2 34.5 26.7 35.8 29.9
ICT products (SITC 75+76+772+776) 62.0 65.2 69.2 32.3 68.1 35.9
Electrical machinery (SITC 77 – 772 – 776) 49.9 41.9 43.3 33.9 44.4 37.2
Road vehicles (SITC 78) 42.6 43.2 23.3 43.8 27.3 43.5
Miscellaneous manufacturing (SITC 8) 0.3 0.7 9.8 6.4 1.5 1.6
India
Manufacturing (SITC 5 to 8 – 68) 3.6 6.5 15.2 14.4 8.8 10.5
Machinery and transport equipment (SITC 7) 44.5 41.4 44.8 28.9 44.7 31.8
ICT products (SITC 75+76+772+776) 57.0 63.8 75.1 35.5 71.4 39.0
Electrical machinery (SITC 77 – 772 – 776) 46.2 42.2 46.2 34.6 46.2 37.9
Road vehicles (SITC 78) 42.7 43.7 91.9 83.6 62.4 56.4
Miscellaneous manufacturing (SITC 8) 0.6 1.3 13.5 6.7 2.2 2.6
Oceania
Manufacturing (SITC 5 to 8 – 68) 14.4 14.9 15.1 11.8 15.0 12.5
Machinery and transport equipment (SITC 7) 39.2 37.2 28.3 20.6 29.9 23.1
ICT products (SITC 75+76+772+776) 45.7 60.8 38.5 27.7 39.3 31.0
Electrical machinery (SITC 77 – 772 – 776) 27.4 23.3 30.8 23.6 30.1 23.5
Road vehicles (SITC 78) 36.3 21.1 19.1 11.0 20.9 12.4
Miscellaneous manufacturing (SITC 8) 3.8 3.5 3.8 3.0 3.8 3.1
NAFTA
Manufacturing (SITC 5 to 8 – 68) 27.2 27.0 30.7 27.4 28.9 27.2
Machinery and transport equipment (SITC 7) 42.5 43.4 58.1 54.5 49.4 48.7
ICT products (SITC 75+76+772+776) 56.2 59.7 65.2 60.9 60.6 60.4
Electrical machinery (SITC 77 – 772 – 776) 39.9 35.3 42.5 35.8 41.3 35.6
Road vehicles (SITC 78) 31.5 30.2 68.5 66.8 45.8 44.7
Miscellaneous manufacturing (SITC 8) 8.4 10.1 5.1 6.2 6.3 7.6

Global Production Sharing, Trade Patterns, and Determinants of Trade Flows in East Asia | 29
Country/region and product Exports Imports Trade
(exports + imports) 1992/93 2005/06 1992/93 2005/06 1992/93 2005/06
EU 15 Manufacturing (SITC 5 to 8 – 68) 16.5 17.4 17.3 18.4 16.9 17.9
Machinery and transport equipment (SITC 7) 34.0 34.4 35.5 35.9 34.7 35.1
ICT products (SITC 75+76+772+776) 50.5 47.5 45.2 40.4 47.3 43.3
Electrical machinery (SITC 77 – 772 – 776) 33.2 32.2 32.9 32.0 33.0 32.1
Road vehicles (SITC 78) 25.7 26.6 25.4 28.4 25.5 27.4
Miscellaneous manufacturing (SITC 8) 4.8 6.1 4.3 5.1 4.5 5.5
Developed countries
Manufacturing (SITC 5 to 8 – 68) 19.9 20.9 18.5 18.6 19.2 19.7
Machinery and transport equipment (SITC 7) 35.4 37.9 36.1 35.0 35.7 36.4
ICT products (SITC 75+76+772+776) 50.4 58.2 45.6 40.3 47.9 47.8
Electrical machinery (SITC 77 – 772 – 776) 34.7 33.1 34.7 32.5 34.7 32.7
Road vehicles (SITC 78) 25.2 26.4 25.7 26.6 25.4 26.5
Miscellaneous manufacturing (SITC 8) 6.3 7.5 4.2 5.0 5.1 6.0
Developing economies
Manufacturing (SITC 5 to 8 – 68) 16.3 24.2 20.1 28.3 18.3 26.1
Machinery and transport equipment (SITC 7) 40.9 44.7 37.8 48.9 39.1 46.7
ICT products (SITC 75+76+772+776) 50.7 53.9 63.5 71.0 56.6 61.3
Electrical machinery (SITC 77 – 772 – 776) 29.9 28.5 29.9 29.4 29.9 28.9
Road vehicles (SITC 78) 35.8 32.7 26.9 30.8 30.0 31.7
Miscellaneous manufacturing (SITC 8) 2.6 4.6 6.3 7.7 3.7 5.6
World
Manufacturing (SITC 5 to 8 – 68) 18.9 22.3 19.0 22.3 19.0 22.3
Machinery and transport equipment (SITC 7) 36.5 40.7 36.6 40.7 36.6 40.7
ICT products (SITC 75+76+772+776) 50.5 55.5 51.2 55.5 50.9 55.5
Electrical machinery (SITC 77 – 772 – 776) 33.3 30.6 33.2 31.2 33.3 30.9
Road vehicles (SITC 78) 26.1 27.7 25.9 27.6 26.0 27.6
Miscellaneous manufacturing (SITC 8) 4.6 5.9 4.6 5.8 4.6 5.8
Source: Compiled from UN Comtrade database (importer records).

30 | Working Paper Series on Regional Economic Integration No. 41
Table 4: Parts and Components share in bilateral trade flows, 2005/06
Reporting country/region EA JPN DEA ASEAN3 PRC ASEAN SAS OCE NAFTA EU-15 World
(a) Export
East Asia (EA) 37.0 25.8 38.8 32.0 39.9 43.8 14.9 10.0 20.0 19.6 26.8
Japan (JPN) 35.8 35.8 33.2 35.1 42.5 14.6 10.1 27.3 25.0 29.7 Developing East Asia (DEA) 37.4 25.8 40.1 31.6 42.1 44.3 15.0 10.0 17.5 18.0 25.9
ASEAN +3 36.8 24.5 38.8 31.5 41.6 43.7 15.6 9.5 19.9 19.2 26.4 People’s Rep. of China (PRC) 27.2 16.9 30.6 28.7 48.3 35.0 12.7 6.3 11.9 11.5 17.5
Republic of Korea 40.8 39.8 40.9 34.3 36.4 41.6 15.3 7.6 24.0 18.5 29.1
ASEAN 49.7 34.7 52.6 31.1 53.5 49.7 20.1 14.4 27.4 29.5 38.1
Indonesia (IND) 28.7 17.1 32.2 5.2 18.8 40.9 7.3 6.0 9.3 8.9 18.6
Malaysia (MAL) 57.6 36.5 60.5 32.4 69.7 55.9 21.8 18.3 35.2 47.6 46.8
Philippines (PHI) 73.4 56.7 77.3 53.2 75.5 80.4 53.6 30.3 45.8 56.3 64.0
Singapore (SIN) 49.5 44.2 49.9 45.4 41.2 40.9 22.0 18.7 33.8 33.8 40.9
Thailand (THA) 35.2 28.8 37.1 17.1 35.5 40.3 17.0 9.0 17.2 15.9 25.5
Viet Nam (VIE) 22.1 24.1 19.8 2.7 8.9 28.3 14.7 6.7 1.4 1.1 7.1
Hong Kong, China (HKG) 40.5 26.7 41.2 22.8 35.9 42.4 7.7 17.1 8.4 17.7 25.2
Taipei,China (TAP) 38.7 41.6 38.4 35.9 28.9 45.6 17.2 17.6 25.7 29.0 33.0
South Asia (SAS) 5.6 9.2 5.2 2.7 5.4 8.6 3.6 5.1 3.9 4.8 4.7
Oceania (OEC) 17.1 7.5 18.8 9.4 10.4 23.0 15.9 8.5 17.3 17.9 14.8
NAFTA 39.7 30.8 42.5 17.6 28.5 64.1 17.2 19.9 25.6 26.9 27.6
EU-15 24.0 13.9 26.9 14.6 24.4 38.3 12.0 11.5 17.1 17.2 17.5
World 35.0 24.2 37.1 27.0 35.7 43.8 12.3 12.0 20.7 18.5 22.0
(b) Imports
East Asia (EA) 37.9 33.9 39.1 36.1 24.2 49.0 5.3 17.2 38.1 25.7 34.9
Japan (JPN) 27.4 27.4 26.5 17.3 39.1 7.1 10.7 26.9 15.8 23.5
Developing East Asia (DEA) 39.6 33.9 41.5 37.8 26.6 51.1 5.1 18.3 41.7 28.5 37.1
ASEAN +3 38.3 34.2 39.4 36.2 21.9 46.6 7.2 18.7 38.5 26.2 35.4
People’s Republic of China(PRC) 42.2 33.8 44.7 39.1 47.1 5.5 15.1 30.7 28.0 39.3
Republic of Korea 36.8 42.0 35.9 35.7 25.9 61.6 1.2 10.8 42.3 24.8 33.5
ASEAN 33.0 26.1 38.7 29.8 21.6 56.4 7.2 37.3 38.2 23.3 30.8

Global Production Sharing, Trade Patterns, and Determinants of Trade Flows in East Asia | 31
Reporting country/region EA JPN DEA ASEAN3 PRC ASEAN SAS OCE NAFTA EU-15 World
Indonesia (IND) 37.0 26.8 47.1 36.8 32.8 55.4 9.9 31.6 21.9 33.8
Malaysia (MAL) 41.7 39.6 42.4 41.4 29.2 48.2 7.9 17.6 54.9 35.3 40.8
Philippines (PHI) 33.9 36.8 33.1 34.8 18.7 40.1 7.7 17.7 23.3 21.4 31.7
Singapore (SIN) 48.9 42.2 50.4 49.6 38.9 56.6 14.7 16.4 69.6 51.1 51.5
Thailand (THA) 47.6 51.8 45.8 46.1 33.2 45.1 4.5 5.5 77.2 46.5 50.2
Viet Nam (VIE) 48.9 40.0 51.3 47.5 36.5 54.8 6.9 25.8 46.8 36.3 43.6
Hong Kong, China (HKG) 37.1 37.2 37.1 37.8 23.5 46.9 7.5 15.5 49.4 21.8 35.3
Taipei,China (TAP) 15.5 20.5 14.3 15.7 11.4 20.0 3.9 8.9 12.8 19.7 15.1
South Asia (SAS) 18.2 25.9 16.9 19.0 10.1 26.2 5.0 19.7 19.4 16.4 15.8
Oceania (OCE) 12.1 9.3 13.3 11.9 5.1 22.9 5.2 11.4 25.3 13.5 14.4
NAFTA 20.8 27.6 18.3 21.7 11.8 30.5 4.2 23.2 26.8 19.6 22.0
EU-15 36.5 45.4 32.0 37.2 21.5 38.0 11.1 15.9 34.8 23.5 32.4
World 20.9 27.0 19.1 21.1 11.8 33.1 5.3 19.8 27.3 16.6 18.1
Source: Compiled from UN Comtrade database (importer records).

32 | Working Paper Series on Regional Economic Integration No. 41
Table 5: Percentage Composition of Parts and Components Exports and Imports by two-digit SITC Categories, 2005/061
SITC code
Product East Asia NAFTA EU World
Total Japan Korea PRC AFTA Total Mexico
(a) Export
7 Machinery and transport equipment 96.3 94.3 98.5 95.7 98.5 94.4 97.6 94.5 93.5
71 Power-generating machinery and equipment 1.3 2.8 1.1 0.7 0.7 4.6 11.3 6.2 4.0
72 Specialized industrial machinery 2.2 2.9 2.8 2.0 1.8 4.9 3.1 7.6 5.2
73 Metalworking machinery 0.5 1.0 0.4 0.5 0.1 0.8 0.2 1.4 1.0
74 General industrial machinery 2.0 3.0 1.4 3.0 1.1 4.4 7.5 7.2 4.5
75 Office machines and automatic data-processing machines 18.3 12.3 19.1 30.8 17.1 10.0 0.2 9.3 13.1
76 Telecommunications and sound-recording equipment 12.4 8.3 14.5 21.9 5.3 6.0 12.7 5.4 8.2
77 Electrical machinery, apparatus and appliances 50.1 43.8 50.2 29.8 67.3 30.4 30.5 26.7 35.2
78 Road vehicles 8.4 18.8 8.7 6.4 3.1 26.0 30.6 23.4 23.0
79 Other transport equipment 1.1 1.4 0.5 0.8 1.5 9.7 2.2 7.3 4.8
8 Miscellaneous manufactured articles 3.7 5.7 1.5 4.7 1.7 5.6 2.4 5.5 6.5
81 Prefabricated buildings fixtures and fittings 0.1 --- 0.1 0.4 --- 0.1 --- 0.6 0.3
82 Furniture, and parts thereof 0.2 0.4 0.2 0.4 0.1 2.2 1.1 1.1 1.5
84 Apparel and clothing accessories 0.2 --- 0.1 0.4 --- 0.1 0.1 0.1 0.2
87 Professional, scientific instruments 1.3 2.9 0.3 0.7 0.8 3.1 0.6 2.4 2.0
88 Photographic apparatus, optical goods and watches and clocks 1.9 2.1 0.4 1.8 0.9 0.4 0.2 0.8 1.1
89 Miscellaneous manufactured articles, n.e.s. 0.2 0.2 0.2 0.4 0.1 1.6 0.9 0.6 0.5
7 + 8 Total 100 100 100 100 100 100 100 100 100
(b) Import 7 Machinery and transport equipment 96.7 92.5 95.5 96.5 97.3 93.5 96.4 94.0 94.6
71 Power-generating machinery and equipment 1.9 2.2 2.6 2.2 1.8 5.3 5.1 5.8 4.6
72 Specialized industrial machinery 2.7 3.2 2.3 2.4 3.2 3.1 1.6 5.4 4.3
73 Metalworking machinery 0.6 0.7 0.8 0.9 0.4 0.5 0.3 1.1 0.9
74 General industrial machinery 1.8 3.0 2.0 1.6 1.7 5.4 3.3 6.0 4.2

Global Production Sharing, Trade Patterns, and Determinants of Trade Flows in East Asia | 33
SITC code
Product East Asia NAFTA EU World
Total Japan Korea PRC AFTA Total Mexico
75 Office machines and automatic data-processing machines 13.6 16.1 5.6 11.3 15.9 13.5 9.5 11.4 13.5
76 Telecommunications and sound-recording equipment 9.7 10.4 6.8 11.3 4.1 6.6 8.4 5.6 7.2
77 Electrical machinery, apparatus and appliances 59.6 46.0 69.5 60.6 63.9 25.2 30.9 26.2 36.1
78 Road vehicles 3.3 7.5 5.5 4.5 4.4 28.8 32.4 27.8 24.9
79 Other transport equipment 1.4 2.7 1.0 1.2 1.8 6.2 2.7 7.3 3.8
8 Miscellaneous manufactured articles 4.0 7.5 4.5 4.5 3.7 6.5 3.6 6.0 5.4
81 Prefabricated buildings fixtures and fittings 0.1 0.2 0.1 --- --- 0.4 0.1 0.8 0.4
82 Furniture, and parts thereof 0.3 1.2 0.3 0.2 0.1 2.9 1.4 1.7 1.4
84 Apparel and clothing accessories 0.2 --- --- 0.1 0.1 0.1 0.1 --- 0.1
87 Professional, scientific instruments. 1.4 3.8 2.2 0.7 1.2 1.7 1.4 2.2 1.8
88 Photographic apparatus, optical goods and watches/clocks 1.7 2.1 0.9 1.4 1.2 0.6 0.3 0.8 1.1
89 Miscellaneous manufactured articles, n.e.s. 0.3 1.2 0.8 0.1 0.1 0.7 1.3 0.7 0.6
Total (SITC 7 + 8) 100 100 100 100 100 100 100 100 100
Notes: 1 5-digit SITC parts and components items aggregated at the 3-digit level. --- Zero or negligible (less than 0.05 per cent).
Source: Compiled from UN Comtrade database.
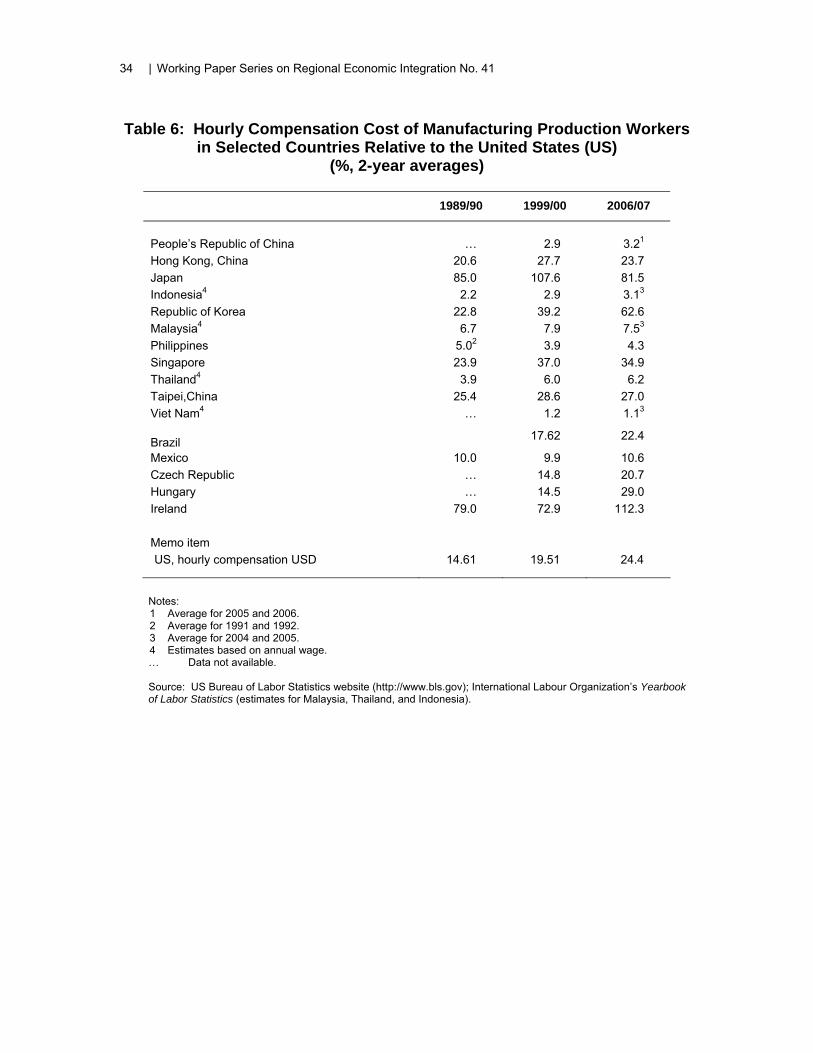
34 | Working Paper Series on Regional Economic Integration No. 41
Table 6: Hourly Compensation Cost of Manufacturing Production Workers in Selected Countries Relative to the United States (US)
(%, 2-year averages)
1989/90 1999/00 2006/07
People’s Republic of China … 2.9 3.21
Hong Kong, China 20.6 27.7 23.7 Japan 85.0 107.6 81.5 Indonesia4 2.2 2.9 3.13
Republic of Korea 22.8 39.2 62.6 Malaysia4 6.7 7.9 7.53
Philippines 5.02 3.9 4.3 Singapore 23.9 37.0 34.9 Thailand4 3.9 6.0 6.2 Taipei,China 25.4 28.6 27.0 Viet Nam4 … 1.2 1.13
Brazil 17.62 22.4
Mexico 10.0 9.9 10.6 Czech Republic … 14.8 20.7 Hungary … 14.5 29.0 Ireland 79.0 72.9 112.3 Memo item US, hourly compensation USD 14.61 19.51 24.4
Notes: 1 Average for 2005 and 2006. 2 Average for 1991 and 1992. 3 Average for 2004 and 2005. 4 Estimates based on annual wage. … Data not available. Source: US Bureau of Labor Statistics website (http://www.bls.gov); International Labour Organization’s Yearbook of Labor Statistics (estimates for Malaysia, Thailand, and Indonesia).

Global Production Sharing, Trade Patterns, and Determinants of Trade Flows in East Asia | 35
Table 7: World Bank Logistics Performance Index and Its Composite Indexes: Developing Asian Economies and Major Country Groups
Sub Indexes Composite Index
Country Customs Infrastructure International shipments
Logistics competence
Tracking& tracing
Domestic logistics Timeliness Index Global
ranking2
Republic of Korea 3.2 3.4 3.4 3.6 3.6 2.7 3.9 3.5 25People Republic of China (PRC) 3.0 3.2 3.3 3.4 3.4 3.0 3.7 3.3 30
Hong Kong, China 3.8 4.1 3.8 4.0 4.1 2.7 4.3 4.0 8Cambodia 2.2 2.3 2.5 2.5 2.5 3.2 3.1 2.5 82Indonesia 2.7 2.8 3.1 2.9 3.3 2.8 3.3 3.0 43Lao PDR 2.1 2.0 2.4 2.3 1.9 2.1 2.8 2.3 117Malaysia 3.4 3.3 3.4 3.4 3.5 3.1 4.0 3.5 27Philippines 2.6 2.3 2.8 2.7 2.7 3.3 3.1 2.7 65Singapore 3.9 4.3 4.0 4.2 4.3 2.7 4.5 4.2 1Thailand 3.0 3.2 3.2 3.3 3.3 3.2 3.9 3.3 31Viet Nam 2.9 2.5 3.0 2.8 2.9 3.3 3.2 2.9 53
Memorandum Items High income countries 3.45 3.66 3.52 3.64 3.71 2.58 4.05 3.67Upper middle income countries 2.64 2.7 2.84 2.8 2.83 2.94 3.31 2.85
Lower middle income 2.31 2.27 2.48 2.4 2.45 3.01 2.93 2.47Low income 2.12 2.06 2.32 2.29 2.25 2.99 2.71 2.29Europe 2.39 2.39 2.61 2.53 2.55 2.97 3.04 2.59Latin America & Caribbean 2.38 2.38 2.55 2.52 2.58 2.97 3.02 2.57
Sub-Saharan Africa 2.21 2.11 2.36 2.33 2.31 2.98 2.77 2.35
Note: Based on a worldwide survey of the global freight forwarders and express carriers complemented by a number of qualitative and quantitative indicators of the domestic logistics environment, institutions, and performance of supply chains. Logistic quality of the individual countries covered are assessed using a 5-point scale (1 for the worst performance and 5 for the best) focusing on seven areas of performance: (i) efficiency of the clearance process by customs and other border agencies; (ii) quality of transport and information technology infrastructure; (iii) Ease and affordability of arranging international shipments; (iv) Competence of the local logistics industry; (v) ability to track and trace international shipments, (vi) domestic logistic costs, (vii) timeliness of shipment in reaching destination. The composite LPI index was constructed by combining the seven sub-indices using the principal component analysis. Ranking (in descending order) among 150 countries.
Source: Arvis et al., (2007).

36 | Working Paper Series on Regional Economic Integration No. 41
Table 8: US Import demand functions (Random-effect IV GLS regressions)
Total Parts and components Final
(1) Total manufactured imports (SITC 5 to 8)
Relative price (RP) –1.43 (24.98)***
–0.05 (0.56)
–1.45 (10.53)***
Income 2.32 (61.62)***
2.51 (49.86)***
1.93 (21.29)***
Constant term 6.73 (11.55)***
9.28 (1.73)*
9.88 (7.14)***
R-sq Within 0.85 0.80 0.48 Between 0.02 0.02 0.01 Overall 0.15 0.05 0.05 Number of observation 2758 1609 2277 Number of groups 44 26 40 Wald chi2(2) 14188.13 6327.33 1941.46 (2) Machinery and transport
equipment (SITC 7)
Relative price (RP) –1.18 (20.59)***
–0.22 (1.96)*
–0.99 (5.50)***
Income 2.39 (60.80)***
2.53 (50.85)***
1.82 (14.20)***
Constant term 5.10 (8.50)***
–1.64 (1.65)*
8.63 (4.67)***
R-sq Within 0.83 0.82 0.33 Between 0.03 0.02 0.03 Overall 0.08 0.07 0.02 Number of observation 1548 1339 1251 Number of groups 24 21 20 Wald chi2(2) 9529.48 6379.15 528.97 (3) ICT products
(SITC 75 + 76 +
Relative price (RP) –1.13 (21.19)***
–0.02 (0.10)
–1.22 (16.08)***
Income 2.87 (41.90)***
2.79 (30.01)***
3.13 (35.39)***
Constant term 50.87 (1.05)*
–4.80 (3.05)***
–2.13 (1.77)*
R-sq Within 0.89 0.79 0.92 Between 0.31 0.09 0.38 Overall 0.25 0.03 0.03

Global Production Sharing, Trade Patterns, and Determinants of Trade Flows in East Asia | 37
Total Parts and components Final
Number of observation 686 595 491 Number of groups 10 9 8 Wald chi2(2) 9529.48 2176.37 5334.56 (5) Miscellaneous manufactured
goods (SIC 8)
Relative price (RP) –0.26 (1.25)
+ 0.01 (0.05)
–0.20 (0.98)
Income 2.86 (22.66)***
2.12 (9.60)***
2.93 (23.10)***
Constant term –3.75 (1.80)*
–1.39 (0.40)
–4.68 (2.24)**
R-sq Within 0.87 0.65 0.87 Between 0.01 0.02 0.02 Overall 0.26 0.04 0.25 Number of observation 481 270 477 Number of groups 9 5 9
Wald chi2(2) 3332.79 487.63 3261.57

38 | Working Paper Series on Regional Economic Integration No. 41
Table 9: World Demand for Manufacturing Exports (Pooled OLS estimates)1
Total Parts and components Final
(A) All countries (number: 158) (1) Total manufactured exports (SITC 5 to 8 – SITC 68)
Relative price (RP) + 0.19 (10.26)***
+0.16 (5.59)***
+0.18 (8.56)***
World income +0.82 (15.55)***
+0.62 (11.87)***
+0.82 (15.47)***
Per capita GNP of exporting country +0.23 (4.66)***
+0.56 (9.90)***
+0.21 (4.20)***
Logistic performance index of exporting country +2.27 (16.71)***
+2.80 (17.24)***
+2.29 (15.88)***
Land-locked dummy –0.65 (6.65)***
–0.24 (1.97)*
–0.73 (6.99)***
Distance to export markets –0.79 (13.77)***
–0.82 (12.12)***
–0.79 (13.97)***
PRC dummy +1.61 (4.41)***
+2.25 (4.92)***
+1.57 (4.01)***
DEA dummy +1.28 (10.77)***
+2.79 (14.37)***
+1.25 (9.32)***
ODC dummy –0.26 (1.76)*
–0.17 (0.87)
–0.27 (1.82)*
Constant term –9.58 (7.02)***
–9.28 (6.13)****
–9.73 (6.48)***
Number of observation 1679
1679
1675
Number of countries 153 153 153 R-sq 0.76 0.80 0.75 F 283.14 372.84 276.47 Root MSE 1.48 1.69 1.49 (2) Machinery and transport equipment (SITC 7)
Relative price (RP) + 0.16 (5.77)***
+0.08 (1.18)
+0.18 (6.65)***
World income +0.52 (10.02)***
+0.19 (2.48)**
+0.51 (8.57)***
Per capita GNP of exporting country +0.36 (6.17)***
+0.65 (8.77)***
+0.35 (5.79)***
Logistics performance index of exporting country +3.07 (20.36)***
+2.00 (7.47)***
+3.09 (19.63)***
Land-locked dummy –0.43 (3.95)***
–0.52 (3.34)***
–0.45 (3.80)***
Distance to export markets –0.79 (12.14)***
–0.31 (2.66)**
–0.80 (11.61)***
PRC dummy +1.82 (3.95)***
+2.66 (5.67)***
+1.61 (3.21)***
DEA dummy +2.24 (12.14)***
+0.92 (2.45)***
+2.19 (11.01)***
ODC dummy –0.23 (1.30)
–0.92 (2.91)***
–0.28 (1.53)*
Constant term –5.70 (3.98)***
+1.52 (0.60)
–5.65 (3.53)***

Global Production Sharing, Trade Patterns, and Determinants of Trade Flows in East Asia | 39
Total Parts and components Final
Number of observation
1679
1656
1614
R-sq 0.79 0.54 0.78 F 373.73 91.67 356.42 Root MSE 1.62 2.63 1.68
(2) Miscellaneous manufactured goods (SITC 8)
Relative price (RP) + 0.19 (5.78)***
+0.16 (4.59)
+0.20 (3.60)***
World income +1.07 (15.10)***
+0.46 (6.82)**
+1.26 (14.98)***
Per capita GNP of exporting country +0.42 (6.20)***
+0.64 (8.98)***
+0.34 (3.56)***
Logistics performance index of exporting country +1.84 (9.53)***
+2.22 (10.76)***
+1.33 (4.79)***
Land-locked dummy –0.63 (4.86)***
–0.88 (5.75)***
–0.56 (3.14)**
Distance to export markets –1.15 (16.12)***
–0.86 (11.24)***
–1.60 (18.48)***
PRC dummy +3.05 (7.60)***
+2.84 (6.24)***
+4.18 (12.40)***
DEA dummy +2.10 (11.94)***
+2.22 (10.58)***
+2.80 (12.51)***
ODC dummy +0.07 (0.41)
–0.37 (1.61)*
+0.34 (1.56)*
Constant term –14.72 (7.87)***
–5.11 (2.65)***
–16.18 (6.89)***
Number of observation 1650 1609 1641 R-sq 0.7o 0.73 0.55 F 190.10 259.47 94.00 Root MSE 1.81 1.94 2.37 B. Developed countries (Number 22)
(1) Total manufactured exports (SITC 5 to 8 – SITC 68)
Relative price (RP) + 0.28 (12.70)***
+0.35 (13.82)***
+0.27 (12.48)***
World income +0.40 (2.15)**
+0.43 (1.76)*
+0.41 (2.15)**
Per capita GNP of exporting country +1.47 (4.16)***
+2.02 (4.90)***
+1.35 (3.96)***
Logistics performance index of exporting country +1.81 (5.27)***
+2.20 (5.70)***
+1.75 (5.25)***
Land-locked dummy –3.06 (5.44)***
–3.76 (6.05)*
–2.94 (5.39)***
Distance to export markets –0.18 (0.86)
–0.12 (0.51)
–0.21 (1.08)
Constant term –4.94 (1.07)
–12.07 (2.15)**
–4.45 (1.02)
Number of observation 280 280 280 R-sq 0.47 0.51 0.46 F 66.10 85.94 63.96 Root MSE 1.10 1.32 1.06

40 | Working Paper Series on Regional Economic Integration No. 41
Total Parts and components Final
(2) Machinery and transport equipment (SITC 7)
Relative price (RP) + 0.34 (6.08)***
+0.43 (6.29)***
+0.33 (12.39)***
World income +0.49 (2.06)***
+1.07 (3.20)**
+0.45 (2.11)**
Per capita GNP of exporting country +1.98 (5.34)***
+6.78 (5.83)***
+1.73 (4.88)***
Logistics performance index of exporting country +2.35 (6.08)***
–4.01 (2.94)**
+2.64 (7.87)***
Land-locked dummy –3.64 (6.13)***
–8.93 (4.32)***
–3.65 (6.50)***
Distance to export markets –0.19 (0.88)
–0.60 (1.09)
–0.30 (1.45)
Constant term –13.93 (2.16)**
–17.67 (1.78)*
–10.24 (2.01)**
Number of observation 280 267 278 R-sq 0.51 0.35 0.55 F 40.01 30.89 35.87 Root MSE 1.30 2.65 1.18 (2) Miscellaneous manufactured goods (SITC 8)
Relative price (RP) + 0.29 (10.85)***
+0.31 (13.32)***
+0.21 (5.04)***
World income +0.21 (1.15)
+0.31 (1.35)*
+0.02 (0.12)
Per capita GNP of exporting country +1.29 (3.74)***
+2.27 (5.95)***
+0.64 (1.60)*
Logistics performance index of exporting country +1.25 (3.31)***
+1.39 (3.64)***
+0.48 (1.11)
Land-locked dummy –3.37 (5.50)***
–4.30 (7.46)***
Distance to export markets –0.15 (0.69)
–0.12 (0.52)
–0.12 (0.62)
Constant term –0.88 (0.09)
–9.02 (1.70)**
–12.20 (2.69)**
Number of observation 280 280 280 R-sq 0.36 0.46 0.13 F 77.16 29.91 3.70 Root MSE 1.19 1.32 1.35 C. Developing economies (136)
(1) Total manufactured exports (SITC 5 to 8 – SITC 68)
Relative price (RP) + 0.06 (0.98)
–0.22 (2.69)**
+0.07 (1.22)
World income +0.84 (15.32)**
+0.67 (12.11)***
+0.84 (15.18)***
Per capita GNP of exporting country +0.22 (4.24)***
+0.57 (9.68)***
+0.24 (4.50)***
Logistic performance index of exporting country +2.29 (14.38)***
+2.70 (15.22)***
+2.26 (14.05)***
Land-locked dummy –0.59 –0.11 –0.66

Global Production Sharing, Trade Patterns, and Determinants of Trade Flows in East Asia | 41
Total Parts and components Final
(5.79)*** (0.95) (6.36)***
Distance to export markets –0.90 (15.20)***
–0.96 (14.38)***
–0.89 (15.12)***
PRC dummy +1.97 (4.92)***
+2.60 (5.50)***
+1.92 (4.74)***
DEA dummy +1.82 (12.45)***
+3.10 (14.97)***
+1.59 (4.74)***
Constant term –9.53 (6.56)***
–7.21 (4.82)***
–9.47 (6.45)***
Number of observation 1399 1399 1395 R-sq 0.68 0.74 0.66 F 172.89 376.63 157.65 Root MSE 1.52 1.71 1.55 (2) Machinery and transport equipment (SITC 7)
Relative price (RP) –0.19 (2.70)**
–0.61 (4.98)**
–0.44 (3.52)***
World income +0.55 (10.21)***
+0.22 (2.98)**
+0.52 (8.58)***
Per capita GNP of exporting country +0.36 (5.98)***
+0.53 (7.32)***
+0.38 (5.87)***
Logistics performance index of exporting country +3.01 (18.20)***
+2.18 (7.87)***
+2.94 (16.87)***
Land-locked dummy –0.34 (3.22)***
–0.47 (3.09)***
–0.36 (3.15)***
Distance to export markets –0.94 (14.43)***
–0.46 (4.31)
–0.92 (13.10)
PRC dummy +0.93 (4.68)***
+3.54 (6.96)***
+2.11 (4.07)***
DEA dummy +2.59 (13.39)***
+1.80 (4.74)***
+2.62 (12.28)***
Constant term –3.75 (2.65)**
–3.72 (1.61)*
–2.07 (1.20)
Number of observation 1399 1389 1336 R-sq 0.72 0.45 0.69 F 280.80 57.69 174.89 Root MSE 1.65 2.50 1.73 (2) Miscellaneous manufactured goods (SITC 8)
Relative price (RP) + 0.04 (0.51)
–0.04 (0.28)
+0.08 (0.60)
World income +1.13 (15.28)***
+0.50 (6.99)***
+1.32 (14.63)
Per capita GNP of exporting country +0.39 (5.46)***
+0.70 (9.83)***
+0.26 (2.59)**
Logistics performance index of exporting country +1.84 (8.57)***
+2.17 (9.37)***
+1.66 (5.45)
Land-locked dummy –0.52 (4.03)***
–0.75 (4.98)***
–0.53 (3.02)**
Distance to export markets –1.32 (17.79)***
–1.05 (13.54)***
–1.78 (18.55)***

42 | Working Paper Series on Regional Economic Integration No. 41
Total Parts and components Final
PRC dummy +3.21 (7.61)***
+3.36 (6.87)***
+3.60 (9.05)***
DEA dummy +2.25 (11.87)***
+2.72 (12.42)***
2.29 (9.31)***
Constant term –14.25 (7.38)
–3.79 (2.13)**
–16.41 (2.50)**
Number of observation 1370 1329 1361 R-sq 0.64 0.64 0.53 F 121.50 146.60 79.49 Root MSE 1.88 2.01 2.25 C1: Developing East Asia (DEA) (Number 9) (1) Total manufactured exports (SITC 5 to 8 – SITC 68)
Relative price (RP) –2.25 (5.21)***
–3.82 (4.68)***
–1.97 (3.53)***
World income +2.25 (6.43)***
+4.07 (9.51)***
+2.42 (6.85)***
Per capita GNP of exporting country +0.36 (2.69)**
+1.03 (5.91)***
–0.09 (0.61)
Logistics performance index of exporting country +0.43 (1.17)
–0.86 (2.03)**
–1.58 (3.99)***
Distance to export markets –0.20 (0.72)
+1.55 (3.69)***
–0.99 (3.24)**
PRC dummy +2.51 (11.84)***
+2.94 (10.83)***
+2.03 (9.29)***
Constant term –38.01 (3.09)*
–100.23 (6.54)***
–40.33 (3.14)***
Number of observation 125 125 125 R-sq 0.82 0.88 0.89 F 88.41 38.81 77.82 Root MSE 0.43 0.70 0.42 (2) Machinery and transport equipment (SITC 7)
Relative price (RP) –3.00 (4.95)***
–3.82 (4.68)***
–2.42 (3.42)***
World income +4.47 (9.86)***
+5.32 (5.68)**
+5.61 (11.34)***
Per capita GNP of exporting country +0.80 (4.80)***
–2.34 (6.32)***
+0.71 (3.48)***
Logistics performance index of exporting country +0.05 (0.11)
+10.20 (9.58)***
–0.08 (0.16)
Distance to export markets +0.97 (2.62)**
+9.71 (14.68)***
+0.07 (0.08)***
PRC dummy +2.93 (11.30)***
+ 2.46 (4.32)***
+2.68 (9.03)***
Constant term –109.48 (16.48)***
–241.75 (8.12)
–137.61 (8.17)***
Number of observation 143 125 125 R-sq 0.73 0.91 0.85 F 57.67 73.57 72.22 Root MSE 0.73 1.01 0.76

Global Production Sharing, Trade Patterns, and Determinants of Trade Flows in East Asia | 43
Total Parts and components Final
(3) Miscellaneous manufactured goods (SITC 8)
Relative price (RP) –2.18 (4.37)***
–2.95 (4.31)
–1.45 (2.54)**
World income + 0.30 (0.68)
+3.20 (5.92)***
+ 0.01 (0.01)
Per capita GNP of exporting country +0.48 (2.88)**
+0.58 (2.85)**
+0.84 (3.49)***
Logistics performance index of exporting country –0.57 (1.21)
+0.39 (0.69)
–2.26 (3.32)***
Distance to export markets –0.25 (0.76)
+1.25 (3.81)***
–0.02 (0.04)
PRC dummy +3.39 (13.28)***
+3.25 (10.05)***
+3.82 (10.74)***
Constant term +20.67 (1.36)
–80.76 (4.45)***
+28.14 (1.43)
Number of observation 143 143 143 R-sq 0.85 0.92 0.67 F 101.27 72.65 76.03 Root MSE 0.50 0.54 0.78 C1: Other developing countries (Number 127)
(1) Total manufactured exports (SITC 5 to 8 – SITC 68)
Relative price (RP) + 0.05 (0.89)
–0.21 (2.67)**
+0.07 (1.19)
World income +0.79 (14.54)***
+0.59 (10.95)***
+0.78 (14.40)***
Per capita GNP of exporting country +0.30 (5.46)***
+0.65 (10.70)***
+0.28 (5.10)***
Logistics performance index of exporting country +2.47 (15.07)***
+2.98 (16.88)***
+2.42 (14.61)***
Land-locked dummy –0.50 (5.08)***
–0.02 (0.17)*
–0.58 (5.62)***
Distance to export markets –0.81 (13.56)***
–0.87 (12.83)***
–0.80 (13.47)***
Constant term –9.10 (6.30)***
–6.71 (4.54)***
–9.01 (6.18)***
Number of observation 1274 1274 1270 R-sq 0.60 0.66 0.58 F 94.07 131.98 90.53 Root MSE 1.55 1.70 1.57 (2) Machinery and transport equipment (SITC 7)
Relative price (RP) –0.17 (2.64)**
–0.63 (5.05)***
–0.44 (3.47)***
World income +0.48 (9.08)***
+0.19 (2.44)**
+0.44 (7.42)***
Per capita GNP of exporting country +0.43 (6.82)***
+0.70 (9.37)***
+0.46 (6.67)***
Logistics performance index of exporting country +3.26 (19.80)***
+2.00 (6.73)***
+3.26 (19.07)***
Land-locked dummy –0.25 –0.36 –0.28

44 | Working Paper Series on Regional Economic Integration No. 41
Total Parts and components Final
(2.41)*** (2.40)** (2.41)**
Distance to export markets –0.85 (13.66)***
–0.43 (3.99)***
–0.80 (11.16)***
Constant term –3.27 (3.17)***
+0.66 (2.86)*
–1.56 (0.92)
Number of observation 1274 1264 1211 R-sq 0.63 0.36 0.61 F 136.11 39.64 543.35 Root MSE 1.63 2.50 1.72 (2) Miscellaneous manufactured goods (SITC 8)
Relative price (RP) + 0.04 (0.43)
–0.04 (0.33)
+0.07 (0.51)
World income +1.06 (14.33)***
+0.42 (5.91)**
+1.24 (13.81)***
Per capita GNP of exporting country +0.46 (5.78)***
+0.75 (9.40)***
+0.37 (3.61)***
Logistics performance index of exporting country +2.04 (9.33)***
+2.44 (10.17)***
+1.97 (6.35)***
Land-locked dummy –0.40 (3.16)***
–0.61 (4.11)***
–0.40 (2.26)**
Distance to export markets –1.20 (15.75)***
–0.94 (11.66)***
–1.65 (16.79)***
Constant term –13.17 (7.11)***
–3.23 (1.57)*
–16.19 (6.46)***
Number of observation 1245 1204 1236 R-sq 0.57 0.55 0.46 F 86.84 86.05 59.04 Root MSE 1.92 2.05 2.57
1. T-ratios of regression coefficients (based on robust standard errors) are given in brackets with the level of statistical significance denoted as follows: *** 1%, ** 5%, and * 10%.

Global Production Sharing, Trade Patterns, and Determinants of Trade Flows in East Asia | 45
Figure 1: Share of Parts and Components (P&C) in Manufacturing Trade by Region, 1992–2006
(a) Total Manufacturing
(b) Machinery and Transport Equipment
Source: Based on data compiled from UN Comtrade database (importer records).
30
35
40
45
50
55
60
65
1992 1993 1994 1995 1996 1997 1998 1999 2000 2001 2002 2003 2004 2005 2006
Developing East Asia ASEAN+3 ASEAN World
Parts
and
com
pone
nts s
hare
(%)
10
15
20
25
30
35
40
45
1992 1993 1994 1995 1996 1997 1998 1999 2000 2001 2002 2003 2004 2005 2006
Developing East Asia ASEAN+3 ASEAN World
Parts
and
com
pone
nts s
hare
(%)

46 | Working Paper Series on Regional Economic Integration No. 41
Figure 2: Parts and Components (P&C) in the People’s Republic of China’s Manufacturing Trade, 1992–2007
A: Manufacturing Exports
0
10
20
30
40
50
60
70
1992
1993
1994
1995
1996
1997
1998
1999
2000
2001
2002
2003
2004
2005
2006
2007
Sha
re (%
)
P&C share in total total exports
P&c share in exports to East Asia
East Asian share in total P&C exports
B: Manufacturing Imports
0
5
10
15
20
25
30
35
40
45
50
1992
1993
1994
1995
1996
1997
1998
1999
2000
2001
2002
2003
2004
2005
2006
2007
shar
e ( %
)
P&C share in total imports
P&c share in imports from East Asia
East Asian share in total P&C imports
Source: Based on data compiled from UN Comtrade database (importer records).

Global Production Sharing, Trade Patterns, and Determinants of Trade Flows in East Asia | 47
Appendix Table A-1 List of Parts and Components
7 Machinery and Transport Equipment 711.91 Parts for the boilers of subgroup 711.1 711.92 Parts for the apparatus and appliances of subgroup 711.2 712.8 Parts for the turbines of subgroup 712.1 713.11 Spark-ignition reciprocating or rotary internal combustion piston engines for aircraft 713.19 Parts, n.e.s., of the aircraft engines of heading 713.11 713.21 Reciprocating piston engines of a cylinder capacity not exceeding 1,000 cc 713.22 Reciprocating piston engines of a cylinder capacity exceeding 1,000 cc 713.23 Compression-ignition engines (diesel or semi-diesel engines) 713.32 Other spark-ignition reciprocating or rotary engines 713.33 Compression-ignition engines (diesel or semi-diesel engines) 713.91 parts suitable for use solely or principally with spark-ignition internal combustion piston
engines 713.92 Parts suitable for use solely or principally with compression-ignition internal combustion piston
engines 714.41 Turbojets 714.49 Other than turbojets 714.81 Turbo propellers 714.89 Other gas turbines 714.91 Parts for turbojets or turbo propellers 714.99 Parts for the gas turbines of heading 714.89 716.9 Parts, n.e.s., suitable for use solely or principally with the machines falling within group 716 718.19 Parts, including regulators, of hydraulic turbines and water-wheels 718.78 Parts of nuclear reactors 718.99 Parts of the engines and motors of headings 714.49, 718.91, 718.92 and 718.93 721.19 Parts of the machinery of subgroup 721.1 721.29 Parts of the machines of headings 721.21 through 721.26 721.39 Parts for milking machines and dairy machinery 721.98 Parts of the machinery of heading 721.91 721.99 Parts of the machinery and appliances of headings 721.95 and 721.96 723.92 Bulldozer or angle dozer blades 723.93 Parts for boring or sinking machinery of heading 723.37 or 723.44 723.99 Other parts for the machinery of group 723 (excluding heading 723.48) and of subgroup 744.3 724.39 Parts of the machines and furniture of subgroup 724.3 724.49 Parts and accessories of machines of subgroup 724.4 or heading 724.54 or of their auxiliary
machinery 724.61 Auxiliary machinery for machines of headings 724.41, 724.42, 724.43, 724.51, 724.52 and
724.53 724.67 Parts and accessories of weaving machines (looms) of heading 724.51 or of their auxiliary
machinery 724.68 Parts and accessories of machines of headings 724.52 and 724.53 or of their auxiliary
machinery 724.88 Parts for the machinery of subgroup 724.8 724.91 Parts for the machine of subgroups 724.7 and 775.1 724.92 Parts for the machine of subgroups 724.7 and 775.1 for the machines of headings 724.72,
724.73, 724.74, 775.12 725.91 Parts of the machines of subgroup 725.1 725.99 Parts of the machines of subgroup 725.2

48 | Working Paper Series on Regional Economic Integration No. 41
726.35 Printing type, blocks, plates, cylinders and other printing components 726.89 Parts for bookbinding machinery 726.91 Parts for the machine of heading 726.31 and subgroups 726.5 and 726.6 for the machines of
heading 726.31 726.99 Parts for the machine of heading 726.31 and subgroups 726.5 and 726.6 726.6 727.19 Parts for the machines of headings 721.27 and 727.11 727.29 Parts for the food-processing machinery of heading 727.22 728.19 Parts and accessories suitable for use solely or principally with the machine tools of subgroup
728.1 728.39 Parts of the machinery of subgroup 728.3 728.51 Parts for the machines of heading 728.41 728.52 Parts for the machines of heading 728.42 728.53 Parts for the machines of heading 728.43 728.55 Parts, n.e.s., for the machines of headings 723.48, 727.21, 728.44, 728.46 and 728.49 735.11 Tool holders and self-opening die-heads 735.13 Work holders 735.15 Dividing heads and other special attachments for machine tools 735.91 Parts and accessories suitable for use solely or principally for machines of group 731 735.95 Parts and accessories suitable for use solely or principally for machines of group 731 for
machines of group 733 737.19 Parts 737.29 Rolls and other parts for metal-rolling mills 737.39 Parts for the machines and apparatus of subgroup 737.3 737.49 Parts for the machinery and apparatus of subgroup 737.4 741.28 Parts for the burners and other articles of subgroup 741.2 741.35 Parts for the equipment of headings 741.31 through 741.34 741.39 Parts for the furnaces and ovens of headings 741.36 through 741.38 741.49 Parts of refrigerators, freezers and other refrigerating or freezing equipment (electric or other) 741.59 Parts for the air-conditioning machines of subgroup 741.5 741.72 Parts for the generators of heading 741.71 741.9 Parts, n.e.s., for the machinery of headings 741.73 through 741.89 742.91 Parts of the pumps and liquid elevators of group 742, of pumps 742.95 Parts of the pumps and liquid elevators of group 742, of liquid elevators 743.8 Parts for the pumps, compressors, fans and hoods of subgroups 743.1 and 743.4 743.91 Parts of the machine and apparatus of subgroup 743.5 and 743.6 of centrifuges (including
centrifugal driers) 743.95 Parts of the machine and apparatus of subgroup 743.5 and 743.6 of filtering or purifying
machinery and apparatus 744.19 Parts of the trucks and tractors of headings 744.14 and 744.15 744.91 Parts suitable for use of machinery of subgroups 744.2 and 744.4 744.92 Parts suitable for use of machinery of headings 744.11, 744.12 and 744.13 744.93 Parts suitable for use of lifts, skip hoists or escalators 744.94 Parts suitable for use of other lifting, handling, loading or unloading machinery of subgroups
744.7 and 744.8 745.19 Parts of the tools of subgroup 745.1 745.29 Parts of the machinery of subgroup 745.2 and heading 775.3 745.39 Weighing-machine weights of all kinds; parts of the weighing machinery of subgroup 745.3 745.68 Parts of the appliances of subgroup 745.6 745.93 Cylinders and other parts for the machines of heading 745.91 745.97 Parts for the machines of heading 745.95

Global Production Sharing, Trade Patterns, and Determinants of Trade Flows in East Asia | 49
746.1 Ball-bearings 746.2 Tapered roller bearings (including cone and tapered roller assemblies) 746.3 Spherical roller bearings 746.4 Needle roller bearings 746.5 Other cylindrical roller bearings 746.8 Other ball- or roller bearings (including combined ball-/roller bearings) 746.91 Balls, needles and rollers 746.99 Other parts of ball- or roller bearings 747.1 Pressure-reducing valves 747.2 Valves for oleohydraulic or pneumatic transmissions 747.3 Check-valves 747.4 Safety- or relief valves 747.8 Taps, cocks, valves and similar appliances, n.e.s. 747.9 Parts for the appliances of group 747 748.1 Transmission shafts (including camshafts and crankshafts) and cranks 748.21 Bearing housings, incorporating ball- or roller bearings 748.22 Bearing housings, not incorporating ball- or roller bearings; plain shaft bearings 748.39 Parts of articulated link chain 748.4 Gears and gearing and other transmission elements presented separately) 748.5 Flywheels and pulleys (including pulley blocks) 748.6 Clutches and shaft couplings (including universal joints) 748.9 Parts, n.e.s., for the articles of group 748 749.2 Gaskets and similar joints of metal sheeting combined with other material 749.91 Ships' or boats' propellers and blades therefore 749.99 Other machinery parts, not containing electrical connectors, insulators, coils, contacts or other
electrical features 759.1 Parts and accessories of the photocopying and thermo copying apparatus of subgroup 751.3 759.91 Parts and accessories for the machines of subgroup 751.1 759.93 Parts and accessories for the machines of subgroup 751.9 759.95 Parts and accessories for the electronic calculating machines of subgroup 751.2 759.97 Parts and accessories for the machines of group 752 762.11 Radio broadcast receivers, incorporating sound-recording or reproducing apparatus 762.12 Radio broadcast receivers , not incorporating sound-recording or reproducing apparatus 764.91 Parts suitable for use with the apparatus of subgroup 764.1 764.92 Parts suitable for use with the apparatus and equipment of subgroup 764.2 764.93 Parts suitable for use with the apparatus and equipment of groups 761 and 762 and
subgroups 764.3 and 764.8 764.99 Parts suitable for use with the apparatus falling within group 763 771.29 Parts of the electric power machinery of group 771 772.2 Printed circuits 772.31 Fixed carbon resistors, composition- or film-type 772.32 Other fixed resistors 772.33 Wire-wound variable resistors (including rheostats and potentiometers) 772.35 Other variable resistors (including rheostats and potentiometers) 772.38 Parts for the electrical resistors of subgroup 772.3 772.41 Fuses 772.42 Automatic circuit-breakers for a voltage of less than 72.5 kV 772.43 Other automatic circuit-breakers

50 | Working Paper Series on Regional Economic Integration No. 41
772.44 Isolating switches and make-and-break switches 772.45 Lightning arresters, voltage limiters and surge suppressors 772.49 Other electrical apparatus for switching or protecting electrical circuits 772.51 Fuses 772.52 Automatic circuit-breakers 772.53 Other apparatus for protecting electrical circuits 772.54 Relays 772.55 Other switches 772.57 Lamp-holders 772.58 Plugs and sockets 772.59 Other electrical apparatus for switching or protecting electrical circuits 772.61 Boards, panels, consoles, desks, cabinets, and other bases equipped with for a voltage not
exceeding 1,000 V 772.62 Boards, panels, consoles, desks, cabinets, and other bases equipped with for a voltage
exceeding 1,000 V 772.81 Boards, panels, consoles, desks, cabinets and other bases for the goods of subgroup 772.6 772.82 Other parts 773.12 Co-axial cable and other co-axial conductors 773.13 Ignition wiring sets and other wiring sets of a kind used in vehicles, aircraft or ships 773.22 Electrical insulators of glass 773.23 Electrical insulators of ceramics 773.24 Electrical insulators of materials other than glass or ceramics 774.23 X-ray tubes 774.29 Other (including parts and accessories) 775.49 Parts of Hair Clipper 775.79 Parts of Food Grinders and mixers (Fruits or vegetable juice extractors) 775.89 Parts of the electrothermic appliances of subgroup 775.8 776.11 Television picture tubes, cathode-ray colour 776.12 Television picture tubes, cathode-ray black and white or other monochrome 776.21 Television camera tubes; image converters and intensifiers; other photocathode tubes 776.23 Other cathode-ray tubes 776.25 Microwave tubes (excluding grid-controlled tubes) 776.27 Other valves and tubes 776.29 Parts of the tubes and valves of subgroups 776.1 and 776.2 776.31 Diodes, other than photosensitive or light-emitting diodes 776.32 Transistors (excluding photosensitive transistors) with a dissipation rate of less than one watt 776.33 Transistors (excluding photosensitive transistors) with a dissipation rate of one watt or more 776.35 Thyristor, discs and triacs (excluding photosensitive devices) 776.37 Photosensitive semiconductor devices; light-emitting diodes 776.39 Other semiconductor devices 776.41 Digital monolithic integrated units 776.43 Non-digital monolithic integrated units 776.45 Hybrid integrated circuits 776.49 Other electronic integrated circuits and micro assemblies 776.81 Piezoelectric crystals, mounted 776.88 Parts of the devices of subgroup 776.3 and of the mounted piezoelectric crystals of item
776.81 776.89 Parts of the articles of subgroup 776.4 778.12 Electric accumulators (storage batteries)

Global Production Sharing, Trade Patterns, and Determinants of Trade Flows in East Asia | 51
778.17 Parts of primary cells and primary batteries 778.19 Parts of electric accumulators 778.22 Discharge lamps (other than ultraviolet lamps) 778.23 Sealed-beam lamp units 778.24 Ultraviolet or infrared lamps; arc lamps 778.29 Parts of electric flament or discharge lamps 778.31 Electrical ignition or starting equipment used for spark- ignition or compression-ignition
internal combustion engines 778.33 Parts of the equipment of heading 778.31 778.34 Electrical lighting or signalling equipment, windscreen wipers etc. used for cycles or motor
vehicles 778.35 Parts of the equipment of heading 778.34 778.48 Parts 778.69 Parts of electrical capacitors 778.79 Parts 778.83 Parts of the equipment of heading 778.82 778.85 Parts of the equipment of heading 778.84 778.86 Carbon electrodes, carbon brushes, lamp carbons, battery carbons and other carbon articles 778.89 Electrical parts of machinery or apparatus, n.e.s. 784.21 Special-purpose motor vehicles, for the vehicles of group 781 784.25 Special-purpose motor vehicles, for the vehicles of groups 722, 782 and 783 784.31 Bumpers, and parts thereof 784.32 Other parts and accessories of bodies (including cabs) 784.33 Brakes and servo-brakes and parts thereof 784.34 Gearboxes 784.35 Drive-axles with differential, whether or not provided with other transmission components 784.36 Non-driving axles, and parts thereof 784.39 Other parts and accessories 785.35 Parts and accessories of motorcycles (including mopeds) 785.36 Parts and accessories of invalid carriages 785.37 Parts and accessories of other vehicles of group 785 786.89 Parts of the trailers and semi-trailers of heading 786.1, subgroup 786.2 and headings 786.83
and 786.85 791.99 Parts of railway or tramway locomotives or rolling-stock 792.91 Propellers and rotors, and parts thereof 792.93 Undercarriages, and parts thereof 792.95 Other parts of aeroplanes or helicopters 792.97 Other parts of the goods of group 792 8 Miscellaneous manufacturing 812.19 Parts for the boilers of heading 812.17 813.8 Parts of the portable electric lamps of heading 813.12 (excluding storage batteries) 813.91 Parts NES, of lamps, light fitting etc of glass 813.92 Parts NES, of lamps, light fitting etc of plastics 813.99 Parts NES, of lamps, light fitting etc other 821.11 Seats of a kind used for aircraft 821.12 Seats of a kind used for motor vehicles 821.19 Parts of the seats of subgroup 821.1 848.48 Headbands, linings, covers, hat foundations, hat frames, peaks and chin-traps, for headgear

52 | Working Paper Series on Regional Economic Integration No. 41
871.19 Parts and accessories (including mountings) 871.39 Parts and accessories of microscopes 871.49 Parts and accessories 871.99 Parts and accessories of the articles of subgroup 871.9 873.19 Parts and accessories of gas, liquid or electricity meters 873.29 Parts and accessories of the articles of subgroup 873.2 874.12 Parts and accessories of navigational instruments and appliances 874.14 Parts and accessories for the articles of heading 874.13 874.24 Parts and accessories for the articles of headings 874.22 and 874.23 874.26 Parts and accessories for the articles of heading 874.25 874.39 Parts and accessories 874.54 Parts and accessories for the machines and appliances of heading 874.53 874.56 Parts and accessories for the instruments of heading 874.55 874.69 Parts and accessories for automatic regulating or controlling instruments and apparatus 874.79 Parts and accessories for the instruments and apparatus of subgroup 874.7 874.9 Parts and accessories for machines, appliances, instruments and apparatus, n.e.s. 881.12 Flash bulbs, flash-cubes and the like 881.13 Photographic flashlight apparatus (other than the discharge lamps of subgroup 778.2) 881.14 Parts and accessories for the photographic cameras of heading 881.11 881.15 Parts and accessories for photographic flashlight apparatus 881.23 Parts and accessories for the cinematographic cameras of heading 821.21 881.24 Parts and accessories for cinematographic projectors 881.34 Parts and accessories for the equipment of headings 881.31 through 881.33 881.36 Parts and accessories for the apparatus and equipment of heading 881.35 884.22 Parts for frames and mountings of spectacles, goggles or the like 884.31 Objective lenses for cameras, projectors or photographic enlargers or reducers 884.32 Other objective lenses 884.33 Filters 884.39 Mounted optical elements, n.e.s. 885.71 Instrument panel clocks and clocks of a similar type, for vehicles, aircraft, spacecraft or
vessels 885.91 Watch-cases, and parts thereof 885.97 Clock cases and cases of a similar type for other goods of group 885, and parts thereof 885.98 Complete watch or clock movements, unassembled or partly assembled (movement sets) 885.99 Clock or watch parts, n.e.s. 891.21 Cartridges for riveting or similar tools or for captive-bolt humane killers, and parts thereof 891.95 Other parts of shotguns and rifles of heading 891.31 894.23 Parts and accessories of dolls representing only human beings 898.9 Parts and accessories of musical instruments 899.35 Parts of lighters, n.e.s., other than flints or wicks 899.49 Parts, trimmings and accessories of articles falling under heading 899.41 or 899.42 899.84 Button moulds and other parts of buttons; button blanks 899.86 Parts of slide fasteners 899.92 Skins and other parts of birds with their feathers or down, feathers, parts of feathers, down
and articles thereof 899.94 Human hair, animal hair, or other textile materials, prepared for use in making wigs or the like
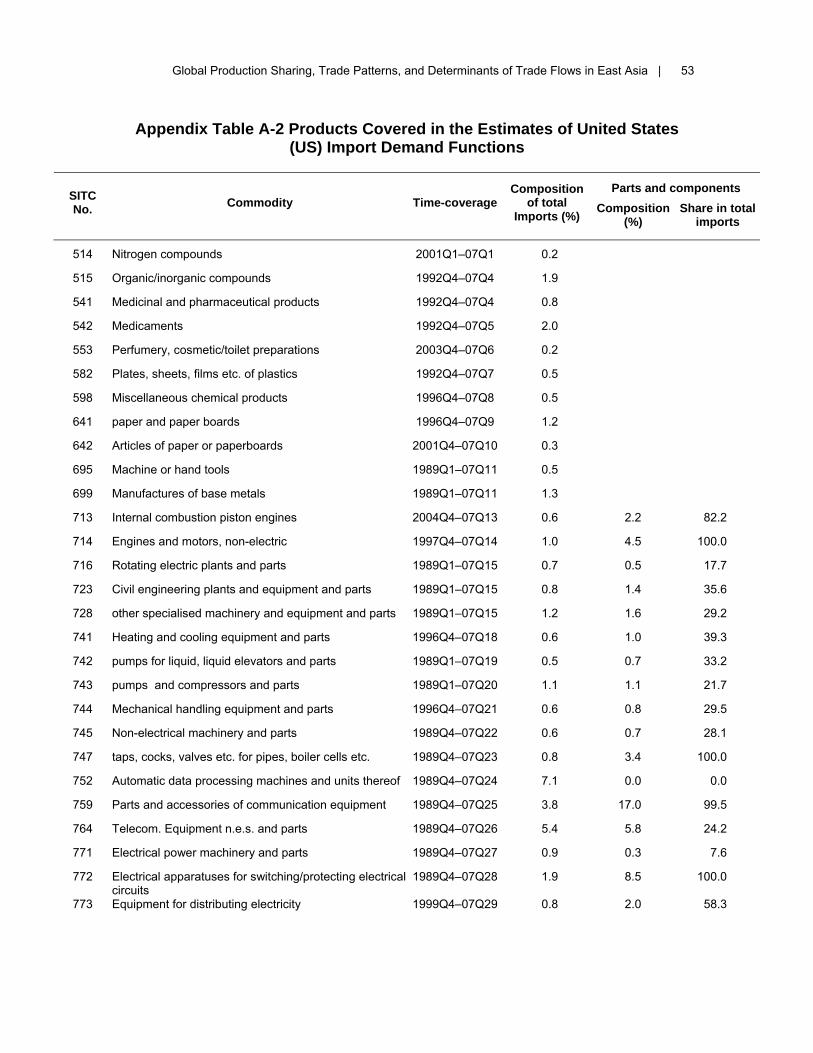
Global Production Sharing, Trade Patterns, and Determinants of Trade Flows in East Asia | 53
Appendix Table A-2 Products Covered in the Estimates of United States (US) Import Demand Functions
Parts and components SITC No. Commodity Time-coverage
Composition of total
Imports (%) Composition (%)
Share in total imports
514 Nitrogen compounds 2001Q1–07Q1 0.2
515 Organic/inorganic compounds 1992Q4–07Q4 1.9
541 Medicinal and pharmaceutical products 1992Q4–07Q4 0.8
542 Medicaments 1992Q4–07Q5 2.0
553 Perfumery, cosmetic/toilet preparations 2003Q4–07Q6 0.2
582 Plates, sheets, films etc. of plastics 1992Q4–07Q7 0.5
598 Miscellaneous chemical products 1996Q4–07Q8 0.5
641 paper and paper boards 1996Q4–07Q9 1.2
642 Articles of paper or paperboards 2001Q4–07Q10 0.3
695 Machine or hand tools 1989Q1–07Q11 0.5
699 Manufactures of base metals 1989Q1–07Q11 1.3
713 Internal combustion piston engines 2004Q4–07Q13 0.6 2.2 82.2
714 Engines and motors, non-electric 1997Q4–07Q14 1.0 4.5 100.0
716 Rotating electric plants and parts 1989Q1–07Q15 0.7 0.5 17.7
723 Civil engineering plants and equipment and parts 1989Q1–07Q15 0.8 1.4 35.6
728 other specialised machinery and equipment and parts 1989Q1–07Q15 1.2 1.6 29.2
741 Heating and cooling equipment and parts 1996Q4–07Q18 0.6 1.0 39.3
742 pumps for liquid, liquid elevators and parts 1989Q1–07Q19 0.5 0.7 33.2
743 pumps and compressors and parts 1989Q1–07Q20 1.1 1.1 21.7
744 Mechanical handling equipment and parts 1996Q4–07Q21 0.6 0.8 29.5
745 Non-electrical machinery and parts 1989Q4–07Q22 0.6 0.7 28.1
747 taps, cocks, valves etc. for pipes, boiler cells etc. 1989Q4–07Q23 0.8 3.4 100.0
752 Automatic data processing machines and units thereof 1989Q4–07Q24 7.1 0.0 0.0
759 Parts and accessories of communication equipment 1989Q4–07Q25 3.8 17.0 99.5
764 Telecom. Equipment n.e.s. and parts 1989Q4–07Q26 5.4 5.8 24.2
771 Electrical power machinery and parts 1989Q4–07Q27 0.9 0.3 7.6
772 Electrical apparatuses for switching/protecting electrical circuits
1989Q4–07Q28 1.9 8.5 100.0
773 Equipment for distributing electricity 1999Q4–07Q29 0.8 2.0 58.3

54 | Working Paper Series on Regional Economic Integration No. 41
774 Electro diagnostic apparatus 1996Q4–07Q30 0.4 0.4 18.5
775 household electrical and non–electrical equipment 1989Q1–07Q31 1.1 0.3 6.3
776 Thermionic, cold cathode or photo-cathode values and tubes
1989Q1–07Q32 4.7 21.2 100.0
778 Electrical machinery and apparatus n.e.s 1989Q1–07Q33 2.2 4.7 46.9
781 Passenger motor cars and other motor vehicles 1989Q1–07Q34 14.7 0.0 0.0
782 Motor vehicles for transport 1993Q4–07Q35 1.9 0.0 0.0
784 Parts & accessories of motor vehicles 1989Q1–07Q36 4.5 20.1 99.3
845 Arties of apparels, of textile fabrics 1992Q4–07Q37 2.6 0.0 0.0
872 Medical/surgical instruments and apparatus 1993Q4–07Q38 0.8 0.0 0.0
874 Measuring,/checking equipments and apparatus n.e.s. 1989Q1–07Q39 1.7 1.3 16.7
884 Optical goods, n.e.s. 1989Q1–07Q40 0.5 0.5 22.4
892 Printed matter 1993Q1–07Q41 0.5 0.0 0.0
893 Articles of plastic n.e.s. 1989Q1–07Q42 1.3 0.0 0.0
894 Bay carriages, toys, games and sporting goods 1989Q1–07Q43 3.1 0.1 0.5
898 Miscellaneous instruments and parts 1989Q1–07Q44 0.8 0.1 3.8
899 Miscellaneous manufactured articles n.e.s 1990Q2–07Q45 0.8 0.1 2.0
79.0 100.0 28.3
Other 21.0
Total 100.0
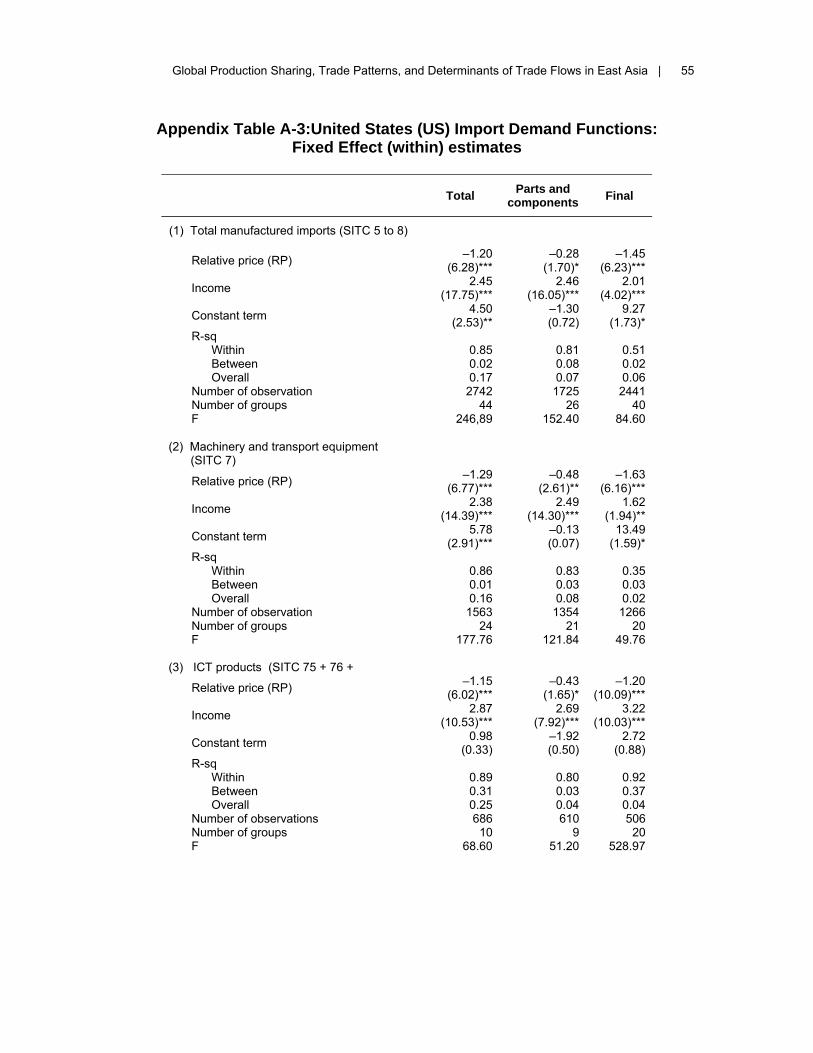
Global Production Sharing, Trade Patterns, and Determinants of Trade Flows in East Asia | 55
Appendix Table A-3:United States (US) Import Demand Functions: Fixed Effect (within) estimates
Total Parts and components Final
(1) Total manufactured imports (SITC 5 to 8)
Relative price (RP) –1.20 (6.28)***
–0.28 (1.70)*
–1.45 (6.23)***
Income 2.45 (17.75)***
2.46 (16.05)***
2.01 (4.02)***
Constant term 4.50 (2.53)**
–1.30 (0.72)
9.27 (1.73)*
R-sq Within 0.85 0.81 0.51 Between 0.02 0.08 0.02 Overall 0.17 0.07 0.06 Number of observation 2742 1725 2441 Number of groups 44 26 40 F 246,89 152.40 84.60
(2) Machinery and transport equipment
(SITC 7)
Relative price (RP) –1.29 (6.77)***
–0.48 (2.61)**
–1.63 (6.16)***
Income 2.38 (14.39)***
2.49 (14.30)***
1.62 (1.94)**
Constant term 5.78 (2.91)***
–0.13 (0.07)
13.49 (1.59)*
R-sq Within 0.86 0.83 0.35 Between 0.01 0.03 0.03 Overall 0.16 0.08 0.02 Number of observation 1563 1354 1266 Number of groups 24 21 20 F 177.76 121.84 49.76
(3) ICT products (SITC 75 + 76 +
Relative price (RP) –1.15 (6.02)***
–0.43 (1.65)*
–1.20 (10.09)***
Income 2.87 (10.53)***
2.69 (7.92)***
3.22 (10.03)***
Constant term 0.98 (0.33)
–1.92 (0.50)
2.72 (0.88)
R-sq Within 0.89 0.80 0.92 Between 0.31 0.03 0.37 Overall 0.25 0.04 0.04 Number of observations 686 610 506 Number of groups 10 9 20 F 68.60 51.20 528.97

56 | Working Paper Series on Regional Economic Integration No. 41
(4) Miscellaneous manufactured goods (SIC 8)
Relative price (RP) –66 (2.72)**
–0.15 (0.96)
–0.67 (2.66)
Income 2.59 (14.11)***
2.27 (6.59)***
2.93 (13.79)***
Constant term 0.69 (0.29)
–1.92 (0.53)
0.43 (0.18)
R-sq Within 0.89 0.76 0.89 Between 0.02 0.02 0.02 Overall 0.32 0.10 0.30 Number of observations 626 371 622 Number of groups 9 5 9 F 138.55 45.33 137.19

Global Production Sharing, Trade Patterns, and Determinants of Trade Flows in East Asia | 57
Appendix Table A-4: United States (US) Import Demand Functions: Random-Effects GLS Estimates
Total Parts and components Final
(1) Total manufactured imports (SITC 5 to 8)
Relative price (RP) –1.20 (26.28)***
–0.28 (3.30)*
–1.46 (25.62)***
Income 2.46 (75.13)***
2.47 (55.38)***
2.01 (25.73)***
Constant term 4.41 (9.14)***
–1.24 (1.41)
9.18 (10.15)*
R-sq Within 0.85 0.81 0.51 Between 0.02 0.08 0.02 Overall 0.17 0.07 0.06 Number of observation 2742 1725 2441 Number of groups 44 26 40 Wald chi2(2) 13232.75 5812.82 3557.40 Breusch–Pagan test, Ho: Var(v_i) = 0 Rejected Rejected Rejected
(2) Machinery and transport equipment (SITC 7)
Relative price (RP) –1.29 (25.45)***
–0.48 (3.55)***
–1.63 (22.11)***
Income 2.38 (59.12)***
2.49 (48.32)***
1.62 (12.92)***
Constant term 5.72 (9.59)***
–0.12 (0.11)
13.38 (9.85)***
R-sq Within 0.86 0.35 0.35 Between 0.01 0.03 0.03 Overall 0.16 0.02 0.02 Number of observation 1563 1266 1266 Number of groups 24 20 20 Wald chi2(2) 8708.22 5139.10 1337.84 Breusch–Pagan test, Ho: Var(v_i) = 0 Rejected Rejected Rejected
(3) ICT products (SITC 75 + 76 +
Relative price (RP) –1.15 (21.19)***
–0.43 (2.54)**
–1.20 (25.60)***
Income 2.88 (41.90)***
2.70 (32.08)***
3.21 (45.88)***
Constant term 0.87 (1.05)
–2.02 (1.28)
–2.99 (3.51)***
R-sq Within 0.89 0.80 0.92 Between 0.31 0.03 0.37 Overall 0.25 0.04 0.04 Number of observation 686 610 506 Number of groups 10 9 20 Wald chi2(2) 5455.51 1979.22 6301.75 Breusch–Pagan test, Ho: Var(v_i) = 0 Rejected Rejected Rejected

58 | Working Paper Series on Regional Economic Integration No. 41
(4) Miscellaneous manufactured goods (SIC 8)
Relative price (RP) –67 (9.93)***
–0.15 (1.83)*
–0.67 (9.82)***
Income 2.59 (14.11)***
2.27 (23.03)***
2.61 (50.18)***
Constant term 0.69 (0.97)
–1.95 (1.38)
0.44 (0.60)
R-sq Within 0.89 0.76 0.89 Between 0.02 0.02 0.02 Overall 0.32 0.10 0.30 Number of observation 626 371 622 Number of groups 9 5 9 Wald chi2(2) 5272.85 1060.39 5181.96 1Breusch–Pagan test, Ho: Var (v_i) = 0 Rejected Rejected Rejected
1 Breusch–Pagan Lagrange multiplier test for random effects. The null-hypothesis of no random effects is
rejected in all cases.

Global Production Sharing, Trade Patterns, and Determinants of Trade Flows in East Asia | 59
References Arndt, S. W. 2008. Production Networks and the Open Macroeconomy. Singapore
Economic Review. 53(3). pp. 509–521.
Arndt, S. W. and A Huemer. 2007. Trade, Production Networks and Exchange Rate. Journal of Economic Asymmetries. 4(1). pp. 11–39.
Arvis, J-F., M. Mustra, J. Panzer, L. Ojala and T. Naula. 2007. Connecting to Compete: Trade Logistics in the Global Economy: The Logistic Performance Index and Its Indicators. Washington DC: World Bank.
Athukorala, P-C. 2004. Post-crisis Export Performance in Thailand. ASEAN Economic Bulletin. 21(1). pp. 19–36.
Athukorala, P-C. 2005. Product Fragmentation and Trade Patterns in East Asia. Asian Economic Papers. 4(3). pp. 1–27.
Athukorala, P-C. 2008. Singapore and ASEAN in the New Regional Division of Labour. Singapore Economic Review. 53(3). pp. 479–508.
Athukorala, P-C. 2009a. The Rise of China and East Asian Export Performance: Is the Crowding-out Fear Warranted? World Economy. 32(2). pp. 234–66.
Athukorala, P-C. 2009b. Global Production Sharing and Sino–US Trade Relations. China and World Economy. 17(2).
Athukorala, P-C. and N. Yamashita 2008. Patterns and Determinants of Production Fragmentation in World Manufacturing Trade. In Filippo do Mauro, Stephanie Dees and Warwick McKibbin (eds.), Globalisation, Regionalism and Economic Interdependence. Cambridge, UK: Cambridge University Press. pp. 45–72.
Brown, C. and G. Linden 2005. Offshoring in the Semiconductor Industry: A Historical Perspective. In Brainard, L. and S. M. Collins, eds. The Brookings Trade Forum 2005: Offshoring White-Collar Work: The Issues and Implications. Washington DC: Brookings Institution Press. pp. 270–333.
Brown, D. K., A. V. Deardorff and R. M. Stern 2004. The Effect of Multinational Production on Wages and Working Conditions in Developing Countries. In Baldwin, R. E. and L. A. Winters, eds. Challenges of Globalization: Analyzing the Economics. Chicago: University of Chicago Press. pp. 279–332.
Borrus, M., D. Earnst and S. Haggard. 2000. International Production Networks in Asia: Rivalry or Riches? London: Rutledge.
Caves, R. R., J. A. Frankel and R. W. Jones. 2007. World Trade and Payments: An Introduction, 10th Edition. New York: Addison and Wesley.

60 | Working Paper Series on Regional Economic Integration No. 41
Dean, J., K.C. Fung and Zhi Wang. 2007. Measuring the Vertical Specialization in Chinese Trade. USITC Working Paper. Washington, DC: U.S. International Trade Commission.
Dobson, W. and S. Y. Chia. 1997. Multinationals and East Asian Integration. Singapore: Institute of Southeast Asian Studies.
Feenstra, R. 1998. Integration of Trade and Disintegration of Production in the Global Economy. Journal of Economic Perspectives. 14(4). pp. 31–50.
Feenstra, R. C., W. Hai, W. T. Woo and S. Uao. 1999. Discrepancies in International Trade Data: An Application to China–Hong Kong Entrepôt Trade. American Economic Review. 89(2). pp. 338–343.
Feenstra, R. C. 2008. Offshoring in the Global Economy (The Ohlin Lectures 2008). Stockholm School of Economics. Available from: www.econ.ucdavis.edu/faculty/ fzfeens/pdf/Feenstra_Ohlin_Lecture_2008.pdf
Feenstra, R. C., R.E. Lipsey, H. Deng, A.C. Ma and H. Mo. 2005. World Trade Flows, 1962–2000. National Bureau of Economic Research (NBER) Working Paper 11040. Cambridge, MA: NBER. http:/www.nber.org/papers/w11040.
Frankel, J. A. and S. Wei. 1997. The New Regionalism and Asia: Impact and Policy Options. In Panagariya, A., M.G. Quibria and N. Rao, eds. The Global Trading System and Developing Asia. Oxford: Oxford University Press. pp. 83–130.
Gereffi, G., J. Humphrey and T. Sturgeon. 2005. The Governance of Global Value Chains. Review of International Political Economy. 12(1). pp. 78–104.
Golub, S. S., R. W. Jones and H. Kierzkowski. 2007. Globalization and Country-Specific Service Links. Journal of Economic Policy Reforms. 10(2). pp. 63–88.
Gorg, H. 2000. Fragmentation and Trade: US Inward Processing Trade in the EU. Weltwirtschaftliches Archive. 136 (3). pp. 403–422.
Grossman, G. M. and E. Helpman. 2005. Outsourcing in a Global Economy. Review of Economic Studies. 72 (1). pp. 135–159.
Harris, R. 2001. A Communication Based Model of Global Production.
Arndt, S. W. and H. Kierzkowski, eds. Fragmentation: New Production Patterns in the World Economy. Oxford, UK: Oxford University Press. pp. 52–75.
Helleiner, G. K. 1973. Manufactured Exports from Less-Developed Countries and Multinational Firms. Economic Journal. 83(329). pp. 21–47.
Helpman, E. 1987. Imperfect Competition and International Trade: Evidence from Fourteen Industrial Countries. Journal of the Japanese and International Economics. (1). pp. 62–81.

Global Production Sharing, Trade Patterns, and Determinants of Trade Flows in East Asia | 61
Helpman, E. 2006. Trade, FDI, and the Organization of Firms. Journal of Economic Literature. 154. pp. 589–630.
Hummels, D. 2007. Transport Costs and International Trade in the Second Era of Globalization. Journal of Economic Perspectives. 21(2). pp. 131–154.
Hummels, D., J. Ishii and K-M. Yi. 2001. The Nature and Growth of Vertical Specialization in World Trade. Journal of International Economics. 54(1). pp. 75–96.
Jones, R. W. 2000. Globalization and the Theory of Input Trade. Cambridge, US: MIT Press.
Jones, R. W. and H.Kierzkowski. 1990. The Role of Services in Production and International Trade: a Theoretical Framework. In Jones, R.W. & A. O. Krueger, eds. The Political Economy of International Trade: Essays in Honor of Robert Baldwin. Oxford: Basil Blackwell. pp. 31–48.
Jones, R. W. and H. Kierzkowski. 2001a. Globalization and the consequences of international fragmentation. In Dornbusch, R., G. Calvo & M. Obstfeld, eds. Money, Factor Mobility and Trade: the Festschrift in Honor of Robert A. Mundell. Cambridge, US: MIT Press. pp. 365–381.
Jones, R. W. and H. Kierzkowski. 2001b. A Framework for Fragmentation. In Arndt, S. W. and H. Kierzkowski, eds. Fragmentation: New Production Patterns in the World Economy. Oxford, UK: Oxford University Press. pp.17–51.
Jones, R. W., H. Kierzkowski, and C. Lurong. 2004. ‘What Does the Evidence Tell Us About Fragmentation and Outsourcing? International Review of Economics and Finance. 14 (3): 305–316.
Jongwanich, J. 2009. Forthcoming. Determinants of Export Performance in East and Southeast Asia. World Economy.
Krugman, P. R. 2008. Trade and Wages, Reconsidered. Brookings Papers on Economic Activity 1: Macroeconomics. pp. 103–138.
Kierzkowski, H. 2001. Joining the Global Economy: Experience and Prospects of the Transition Economies. In Arndt, S.W. and H. Kierzkowski, eds. Fragmentation: New Production Patterns in the World Economy. Oxford, UK: Oxford University Press. pp. 231–253.
Limao, N. and A. J. Venables. 2001. Infrastructure, Geographic Disadvantage, Transport Costs, and Trade. World Bank Economic Review. 15(3). pp. 451–479.
Maizels, A. 1963. Industrial Growth and World Trade: An Empirical Study of Trends in Production. Cambridge, UK: Cambridge University Press.

62 | Working Paper Series on Regional Economic Integration No. 41
McKendrick, D. G., R. F Doner and S. Haggard. 2000. From Silicon Valley to Singapore: Location and Competitive Advantage in the Hard Disk Drive Industry. Stanford, US: Stanford University Press.
Ng, F. and A.Yeats. 2001. Production Sharing in East Asia: Who Does What for Whom, and Why?. In Cheng, L. K. & H. Kierzkowski, eds. Global Production and Trade in East Asia. Boston, US: Kluwer Academic Publishers. pp. 63–109.
Ng, F. and A.Yeats. 2003. Major Trade Trends in East Asia: What are Their Implications for Regional Cooperation and Growth? Policy Research Working Paper 3084. Washington DC, US: World Bank.
Obstfeld, M. 2002. Exchange Rates and Adjustment: Perspectives from the New Open-economy Macroeconomics. Centre for Economic Policy Research (CPER) Discussion Paper 3533. London, UK: CPER.
Quah, D. T. 1997. Increasingly Weightless Economies. Bank of England Quarterly Bulletin. February. pp. 49–56.
Pollard, S. 1981. The Silent Conquest: The Industrialization of Europe, 1760–1970. Oxford, UK: Oxford University Press.
Rangan, S. and R. Lawrence. 1999. A Prism on Globalization. Washington DC, US: Brookings Institution Press.
Rouch, J. E. and V. Trindale. 2003. Information, International Substitutability and Globalization. American Economic Review, papers and proceedings. pp. 775–778.
Sharpton, M. 1975. International Subcontracting. Oxford Economic Papers. 27(1). pp. 94–135.
Soloaga, I. and L.A. Winters. 2001. Regionalism in the Nineties: What Effect on Trade? North American Journal of Economics and Finance. 12(1). pp. 1–29.
Spenser, B. J. 2005. International Outsourcing and Incomplete Contracts. Canadian Journal of Economics. 38(4). pp. 1107–1135.
Sturgeon, T.J. 2003. What Really Goes on in Silicon Valley? Spatial Clustering and Dispersal in Modular Production Networks. Journal of Economic Geography. 3. pp. 199–225.
USITC (United State International Trade Commission) 1999. Production Sharing: Use of U.S. Components and Material in Foreign Assembly Operations, 1995–1998. USITC Publication 3265. Washington DC, US: USITC.
Venables, A. J. 1999. Fragmentation and Multinational Production. European Economic Review. 43(3). pp. 935–945.

Global Production Sharing, Trade Patterns, and Determinants of Trade Flows in East Asia | 63
Wong, H. K. 2007. The Remaking of Singapore’s High-Tech Enterprise System. In Rowen, H. S., M. G. Hancock and L. F. Miller, eds. Making IT: The Rise of Asian in High Tech. Stanford, US: Stanford University Press. pp. 123–174.
Yeats, A. 2001. Just How Big is Global Production Sharing? In Arndt, S. and H. Kierzkowski, eds. Fragmentation: New Production Patterns in the World Economy. New York, US: Oxford University Press. pp. 108–43.
Yi, K. 2003. Can Vertical Specialization Explain the Growth of World Trade? Journal of Political Economy. 111 (1). pp. 52–102.
Young, A. 1928. Increasing Returns and Economic Progress. Economic Journal. 38. pp. 527–542.

64 | Working Paper Series on Regional Economic Integration No. 41
ADB Working Paper Series on Regional Economic Integration*
1. “The ASEAN Economic Community and the European Experience” by Michael G. Plummer
2. “Economic Integration in East Asia: Trends, Prospects, and a Possible Roadmap” by Pradumna B. Rana
3. “Central Asia after Fifteen Years of Transition: Growth, Regional Cooperation, and Policy Choices” by Malcolm Dowling and Ganeshan Wignaraja
4. “Global Imbalances and the Asian Economies: Implications for Regional Cooperation” by Barry Eichengreen
5. “Toward Win-Win Regionalism in Asia: Issues and Challenges in Forming Efficient Trade Agreements” by Michael G. Plummer
6. “Liberalizing Cross-Border Capital Flows: How Effective Are Institutional Arrangements against Crisis in Southeast Asia” by Alfred Steinherr, Alessandro Cisotta, Erik Klär, and Kenan Šehović
7. “Managing the Noodle Bowl: The Fragility of East Asian Regionalism” by Richard E. Baldwin
8. “Measuring Regional Market Integration in Developing Asia: a Dynamic Factor Error Correction Model (DF-ECM) Approach” by Duo Qin, Marie Anne Cagas, Geoffrey Ducanes, Nedelyn Magtibay-Ramos, and Pilipinas F. Quising
9. “The Post-Crisis Sequencing of Economic Integration in Asia: Trade as a Complement to a Monetary Future” by Michael G. Plummer and Ganeshan Wignaraja
10. “Trade Intensity and Business Cycle Synchronization: The Case of East Asia” by Pradumna B. Rana
11. "Inequality and Growth Revisited" by Robert J. Barro
12. "Securitization in East Asia" by Paul Lejot, Douglas Arner, and Lotte Schou-Zibell
13. "Patterns and Determinants of Cross-border Financial Asset Holdings in East Asia" by Jong-Wha Lee
14. "Regionalism as an Engine of Multilateralism: A Case for a Single East Asian FTA" by Masahiro Kawai and Ganeshan Wignaraja

Global Production Sharing, Trade Patterns, and Determinants of Trade Flows in East Asia | 65
15. "The Impact of Capital Inflows on Emerging East Asian Economies: Is Too Much Money Chasing Too Little Good?" by Soyoung Kim and Doo Yong Yang
16. "Emerging East Asian Banking Systems Ten Years after the 1997/98 Crisis" by Charles Adams
17. "Real and Financial Integration in East Asia" by Soyoung Kim and Jong-Wha Lee
18. “Global Financial Turmoil: Impact and Challenges for Asia’s Financial Systems” by Jong-Wha Lee and Cyn-Young Park
19. “Cambodia’s Persistent Dollarization: Causes and Policy Options” by Jayant Menon
20. "Welfare Implications of International Financial Integration" by Jong-Wha Lee and Kwanho Shin
21. "Is the ASEAN-Korea Free Trade Area (AKFTA) an Optimal Free Trade Area?" by Donghyun Park, Innwon Park, and Gemma Esther B. Estrada
22. "India’s Bond Market—Developments and Challenges Ahead" by Stephen Wells and Lotte Schou- Zibell
23. “Commodity Prices and Monetary Policy in Emerging East Asia” by Hsiao Chink Tang
24. "Does Trade Integration Contribute to Peace?" by Jong-Wha Lee and Ju Hyun Pyun
25. “Aging in Asia: Trends, Impacts, and Responses” by Jayant Menon and Anna Melendez-Nakamura
26. “Re-considering Asian Financial Regionalism in the 1990s” by Shintaro Hamanaka
27. “Managing Success in Viet Nam: Macroeconomic Consequences of Large Capital Inflows with Limited Policy Tools” by Jayant Menon
28. “The Building Block versus Stumbling Block Debate of Regionalism: From the Perspective of Service Trade Liberalization in Asia” by Shintaro Hamanaka
29. “East Asian and European Economic Integration: A Comparative Analysis” by Giovanni Capannelli and Carlo Filippini
30. “Promoting Trade and Investment in India’s Northeastern Region” by M. Govinda Rao

66 | Working Paper Series on Regional Economic Integration No. 41
31. "Emerging Asia: Decoupling or Recoupling" by Soyoung Kim, Jong-Wha Lee, and Cyn-Young Park
32. “India’s Role in South Asia Trade and Investment Integration” by Rajiv Kumar and Manjeeta Singh
33. “Developing Indicators for Regional Economic Integration and Cooperation” by Giovanni Capannelli, Jong-Wha Lee, and Peter Petri
34. “Beyond the Crisis: Financial Regulatory Reform in Emerging Asia” by Chee Sung Lee and Cyn-Young Park
35. "Regional Economic Impacts of Cross-Border Infrastructure: A General Equilibrium Application to Thailand and Lao PDR" by Peter Warr, Jayant Menon, and Arief Anshory Yusuf
36. "Exchange Rate Regimes in the Asia-Pacific Region and the Global Financial Crisis" by Warwick J. McKibbin and Waranya Pim Chanthapun
37. “Roads for Asian Integration: Measuring ADB's Contribution to the Asian Highway Network” by Srinivasa Madhur, Ganeshan Wignaraja,and Peter Darjes
38. "The Financial Crisis and Money Markets in Emerging Asia" by Robert Rigg and Lotte Schou-Zibell
39. “Complements or Substitutes? Preferential and Multilateral Trade Liberalization at the Sectoral Level” by Mitsuyo Ando, Antoni Estevadeordal, and Christian Volpe Martincus
40. “Regulatory Reforms for Improving the Business Environment in Selected Asian Economies—How Monitoring and Comparative Benchmarking can Provide Incentive for Reform” by Lotte Schou-Zibell and Srinivasa Madhur
* These papers can be downloaded from: (ARIC) http://aric.adb.org/reipapers/ or (ADB) www.adb.org/publications/category.asp?id=2805


Global Production Sharing, Trade Patterns, and Determinants of Trade Flows in East Asia
Global production sharing has become a defining characteristic of world trade. Any analysis of trade patterns or its determinants can no longer ignore this phenomenon, or the trade in parts and components that it generates. In this paper, Prema-Chandra Athukorala and Jayant Menon examine the extent and pattern of these flows, focusing on East Asia, and probe its implications for trade flow analysis. They find that most of the growth in component trade emanates from East Asia, with its share in world exports increasing from 27% to 39% between 1992/93 and 2005/06. This type of trade is also relatively insensitive to changes in relative prices, implying a limited role for exchange rate policy in correcting trade imbalances. For countries like the People’s Republic of China, where component trade is high and growing, the assertion that its trade surplus can be addressed by revaluation may therefore be misplaced.
About the Asian Development Bank
ADB’s vision is an Asia and Pacific region free of poverty. Its mission is to help its developing member countries substantially reduce poverty and improve the quality of life of their people. Despite the region’s many successes, it remains home to two-thirds of the world’s poor: 1.8 billion people who live on less than $2 a day, with 903 million struggling on less than $1.25 a day. ADB is committed to reducing poverty through inclusive economic growth, environmentally sustainable growth, and regional integration.
Based in Manila, ADB is owned by 67 members, including 48 from the region. Its main instruments for helping its developing member countries are policy dialogue, loans, equity investments, guarantees, grants, and technical assistance.
Asian Development Bank6 ADB Avenue, Mandaluyong City1550 Metro Manila, Philippineswww.adb.org/povertyPublication Stock No. Printed in the Philippines