ADB Investor Presentation - May 2018 · $498 million Guarantees ... Support 6 ADB has raised ... $...
66
Asian Development Bank May 2018
Transcript of ADB Investor Presentation - May 2018 · $498 million Guarantees ... Support 6 ADB has raised ... $...
Asian Development BankMay 2018

▪ Asian Development Bank
▪ Funding Operations
▪ Green Bond Framework
▪ Appendices
2
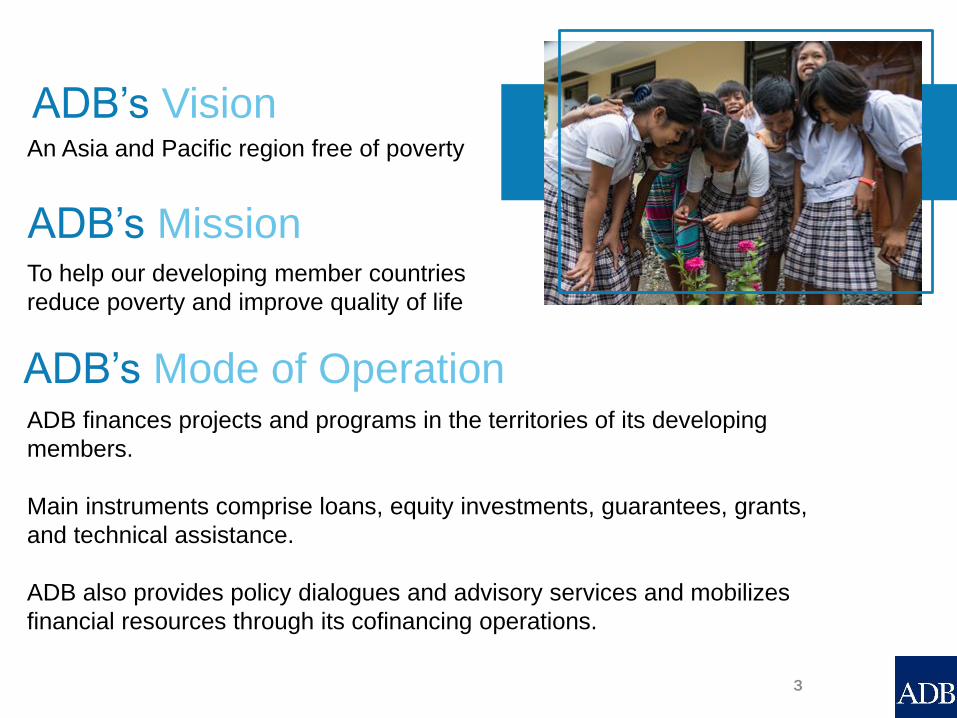
An Asia and Pacific region free of poverty
ADB’s Mission
ADB’s Vision
To help our developing member countries
reduce poverty and improve quality of life
ADB’s Mode of OperationADB finances projects and programs in the territories of its developing
members.
Main instruments comprise loans, equity investments, guarantees, grants,
and technical assistance.
ADB also provides policy dialogues and advisory services and mobilizes
financial resources through its cofinancing operations.
3

• An international development finance
institution
• President Takehiko Nakao
• Headquartered in Manila, Philippines
• Founded in 1966
• Owned by 67 members:
48 regional, 19 non-regional
• 31 field offices1
• 3,134 staff from 60 countries1
1/ As of 31 December 2017.
Total
commitments in
2017:
$32.2 billion
Our Structure How We Helped in 2017
$18,717 millionLoans
$11,922 million
Cofinancing
including Trust Funds
$597 millionGrants
$498 millionGuarantees
$201 millionTechnical Assistance
$287 millionEquity Investments
4

The Region’s
Poverty Challenge
▪ It remains home to a large share of
the world’s poor
▪ 330 million people are still living on less than $1.90 a day
▪ Approximately 1.2 billion people are below the poverty line of
$3.10 a day
▪ 0.3 billion people live without safe drinking water
▪ 1.5 billion people lack access to proper sanitation
▪ $1.7 trillion per year in infrastructure investments is needed up
to 2030
5

Shareholdings1 Shareholdings1
Non-Borrowing Shareholders Ratings2 2017 Borrowing Shareholders Ratings
2 2017
Japan A1/A+ 15.6% People's Republic of China A1/A+ 6.4%
United States Aaa/AA+ 15.6% India Baa2/BBB- 6.3%
Australia Aaa/AAA 5.8% Indonesia Baa2/BBB- 5.4%
Canada Aaa/AAA 5.2% Malaysia A3/A- 2.7%
Republic of Korea Aa2/AA 5.0% Philippines Baa2/BBB 2.4%
Germany Aaa/AAA 4.3% Pakistan B3/B 2.2%
France Aa2/AA 2.3% Thailand Baa1/BBB+ 1.4%
United Kingdom Aa2/AA 2.0% Bangladesh Ba3/BB- 1.0%
Italy Baa2/BBB 1.8% Others 5.4%
New Zealand AAA/AA 1.5%
Others 7.4%
27 Countries 66.8% 40 Countries 33.2%
Totals may not add up because of rounding.
1/ Percent of Total Subscribed Capital as of 31 December.
2/ Moody’s and Standard & Poor’s ratings are as of 25 May 2018. (Source: Bloomberg)
Strong Shareholder
Support
6

▪ ADB has raised its capital
base five times since 1966
▪ Callable capital is available
for the protection of ADB’s
bondholders
▪ ADB has never made a call
on its callable capital
Growth in ADB’s capital base
-10.0
10.0
30.0
50.0
70.0
90.0
110.0
130.0
150.0
19711976
19831994
20082017
GCI-I1.0
GCI-II3.7
GCI-III11.5
GCI-IV30.2
Pre-GCI-V54.9
GCI-V151.2
$ bn
Callable Capital Paid-In Capital
$billion
Paid-in capital 7.6
Callable capital 143.6
Subscribed capital 151.2
ADB Capital Structure as of 31 December 2017
Solid Capital
Structure
7

TOTAL – $264.4 billion
Cumulative OCR regular and concessional
lending1, as of 31 December 2017
Legend:
$0 - $500 million $5,001 - $10,000 million
$501 - $2,000 million $10,001 - $15,000 million
$2,001 - $5,000 million $15,001 million - and above
Indonesia
$34,587 mn
Papua New Guinea
$2,649 mn
Fiji
$509 mn
Nauru
$5 mn
Federated States
of Micronesia
$84 mn
Marshall
Islands
$93 mn
Regional
$561 mn
Republic of Korea
$6,338 mn
People’s Republic
of China
$38,424 mn
Thailand
$6,683 mn
Malaysia
$1,998 mn
Lao PDR
$1,794 mnIndia
$42,031 mn
Sri Lanka
$8,818 mn
Pakistan
$30,826 mn
Nepal
$4,498 mnAfghanistan
$952 mn
Kazakhstan
$5,003 mn
Uzbekistan
$6,789 mn
Mongolia
$2,041 mn
Azerbaijan
$4,177 mn
Hong Kong, China
$102 mn
Singapore
$181 mn
Philippines
$17,962 mnViet Nam
$15,844 mn
Taipei,China
$100 mnBangladesh
$19,916 mn
Cambodia
$2,373 mn
Georgia
$2,323 mn
Republic of the
Maldives
$158 mn
Bhutan
$499 mn
Republic
of the
Union of
Myanmar
$2,099 mn
Cook Islands
$102 mn
Armenia
$1,336 mn
Palau
$70 mn
Turkmenistan
$125 mnKyrgyz Republic
$1,113 mn
Timor-Leste
$228 mn
Tajikistan
$498 mn
Approved Loans
by Borrower
Kiribati
$35 mnSamoa
$191 mn
Solomon Islands
$123 mn
Tonga
$69 mn
Tuvalu
$8 mn
Vanuatu
$96 mn
1/ Includes concessional loans that were transferred from ADF to OCR effective 1 January 2017. OCR sovereign regular ($189.8 bn), OCR sovereign concessional ($57.3 bn) and nonsovereign ($17.3 bn).
8

India
1/ Includes concessional loans that were transferred from ADF to OCR effective 1 January 2017.2/ OCR Committed Loans include Loans Outstanding at $101.3 billion (gross) and Undisbursed Effective Loans at $40.0 billion. Regular sovereign at $97.0 billion (69%), concessional sovereign at $36.7 billion (26%)and nonsovereign at $7.6 billion (5%).
$141.3 billion1,2 as of 31 December 2017
Committed Loans
By
Borrower
By
Sector
8.4%
Viet Nam
8.8%
Indonesia
9.0%
Bangladesh
10.6%
Pakistan
16.7%
People’s Republic of China
17.0%
24.8%
Others 21.1%
Energy
9.9%
Public Sector
Management
10.3%
Water Urban
Infrastructure
7.7%
Agriculture and
Natural Resources
8.6%Finance4.6%
Education
31.4%Transport
3.2%Others
3.2%
Multi-Sector
Philippines
4.7%
9
Uzbekistan
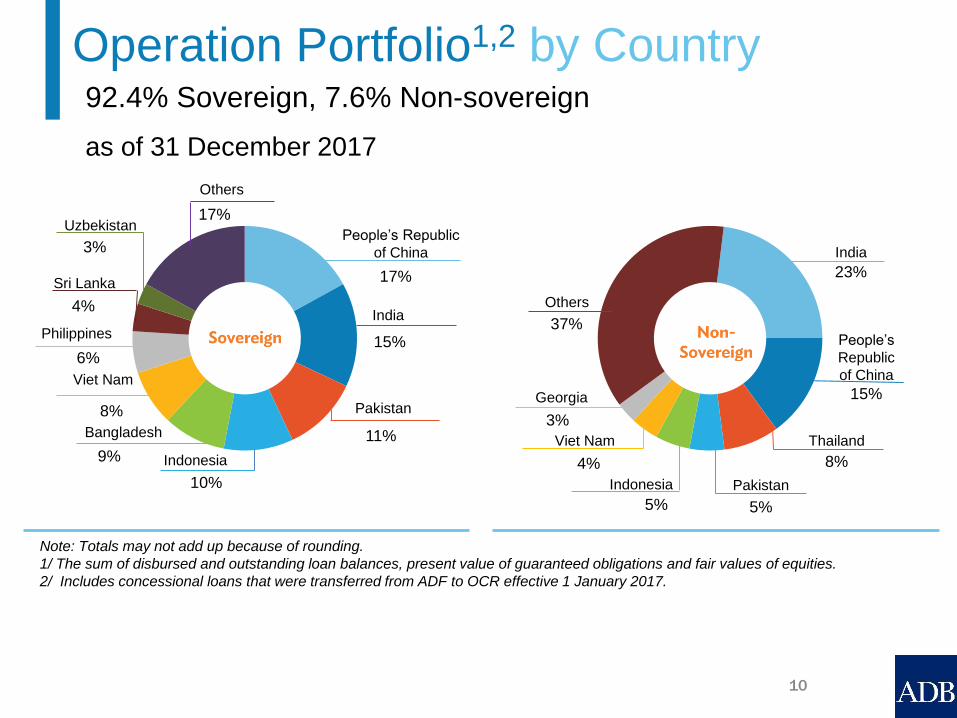
Note: Totals may not add up because of rounding.
1/ The sum of disbursed and outstanding loan balances, present value of guaranteed obligations and fair values of equities.
2/ Includes concessional loans that were transferred from ADF to OCR effective 1 January 2017.
92.4% Sovereign, 7.6% Non-sovereign
as of 31 December 2017
Operation Portfolio1,2 by Country
15%
India
11%
Pakistan
10%
Indonesia9%
Bangladesh
17%
Others
17%
People’s Republic
of China
37%
Others
5%
Indonesia
5%
Pakistan
23%
India
15%
People’s
Republic
of China
8%
Thailand
10
Viet Nam
8%
Philippines
6%
Sri Lanka
4%
3%
Viet Nam
4%
Georgia
3%

1/ Includes Loans Outstanding and Undisbursed Effective Loans as of 31 December 2017.
2/ Includes concessional loans that were transferred from ADF to OCR effective 1 January 2017.
ADB has strict policy with regard to non-accrual loans. If loan is overdue by:
• 60 days – no new loans
• 90 days – suspension of disbursements
• 6 months – non-accrual status
ADB lends primarily to the governments of member countries
who afford ADB preferred creditor status.
High Asset Quality
95%
Sovereign1,2
5%
Nonsovereign1 100%
Fully
Performing
Loans
0%
Loans innon-accrual
status
11

Net Loans 1
$101.0bn
Other 2
$44.9bn
Investments
$36.5bn
TOTAL = $182.4bn
Assets
Borrowings
$87.3bn
Other 2
$44.8bn
Equity
$50.3bn
TOTAL = $182.4bn
Liabilities and Equity
1/ Sovereign regular ($66.6 bn), sovereign concessional ($29.2 bn) and nonsovereign ($5.3 bn) less
allowance for loan losses ($0.1 bn).
2/ Mostly derivative assets and liabilities. Net derivative liability is $2.1 billion.
31 December 2017
Balance Sheet
Overview
12
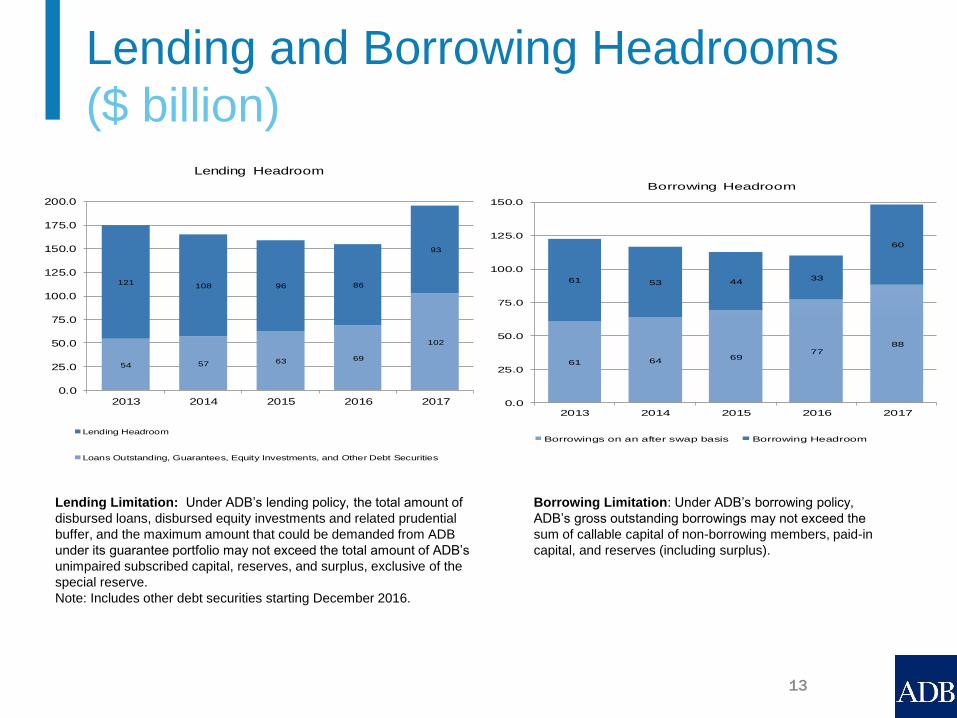
Lending and Borrowing Headrooms
($ billion)
54 57 63 69
102
121108 96 86
93
0.0
25.0
50.0
75.0
100.0
125.0
150.0
175.0
200.0
2013 2014 2015 2016 2017
Lending Headroom
Lending Headroom
Loans Outstanding, Guarantees, Equity Investments, and Other Debt Securities
Lending Limitation: Under ADB’s lending policy, the total amount of
disbursed loans, disbursed equity investments and related prudential
buffer, and the maximum amount that could be demanded from ADB
under its guarantee portfolio may not exceed the total amount of ADB’s
unimpaired subscribed capital, reserves, and surplus, exclusive of the
special reserve.
Note: Includes other debt securities starting December 2016.
61 6469
7788
61 53 44 33
60
0.0
25.0
50.0
75.0
100.0
125.0
150.0
2013 2014 2015 2016 2017
Borrowing Headroom
Borrowings on an after swap basis Borrowing Headroom
Borrowing Limitation: Under ADB’s borrowing policy,
ADB’s gross outstanding borrowings may not exceed the
sum of callable capital of non-borrowing members, paid-in
capital, and reserves (including surplus).
13

CONTENTS
▪ Asian Development Bank
▪ Funding Operations
▪ Green Bond Framework
▪ Appendices
14

“Our ratings on the Asian Development Bank (AsDB) reflect
our assessment of the bank's extremely strong business
profile and financial profile. A transfer of Asian Development
Fund (ADF) loans and certain other assets to AsDB's
Ordinary Capital Resources (OCR) took effect on Jan. 1,
2017. The move boosted AsDB's total lending capacity
substantially due to the addition of nonleveraged ADF equity
to the OCR.”– Standard and Poor’s, July 2017
“..credit profile reflects the bank's strong capital adequacy,
ample liquidity buffers and unfettered market access.
Additionally, the bank's preferred creditor status and strong
shareholder support enhance its financial performance. The
ADB’s credit strengths, which have remained intact through
recent periods of global and regional economic stress, reflect
in part its prudent financial management, including an
effective risk management framework.” – Moody’s, August
2017
“Capitalisation and concentration metrics in particular have
improved considerably, and have further enhanced the
AsDB’s solvency assessment.”
– FitchRatings, August 2017
AAA Rating based on
Strong Fundamentals▪ ADB is a leading AAA borrower in international and domestic capital markets, having issued bonds across various
markets in 35 currencies.
▪ Borrowings finance regular Ordinary Capital Resources (OCR) operations. Regular OCR loans are generally made
to developing members that have attained a higher level of economic development.
▪ ADB’s debt securities carry the highest possible investment ratings from major international credit rating agencies.
Capital Adequacy: Very HighLiquidity: Very HighStrength of Member Support: Very High
SACP: aaaRating: AAABusiness Profile: Extremely StrongFinancial Profile: Extremely Strong
Consolidation Credit PositiveExcellent CapitalisationMedium-Risk Business EnvironmentExcellent Liquidity
15

Source: S&P Global Ratings. Supranationals Special Edition October 2017.
Supranationals Ratings and Rating
Factors Summary SACP Rating* Outlook Business
ProfileFinancial Profile Financial Profile
with extraordinary shareholder support
AsianDevelopment Bank
aaa AAA Stable Extremely Strong
Extremely Strong
Extremely Strong
African Development Bank
aa+ AAA Stable Very Strong Very Strong Extremely Strong
Inter-AmericanDevelopment Bank
aa+ AAA Stable Very Strong Very Strong Extremely Strong
InternationalFinance Corporation
aaa AAA Stable Very Strong Extremely Strong
Extremely Strong
International Bank forReconstruction and Development
aaa AAA Stable Extremely Strong
Very Strong Extremely Strong
16
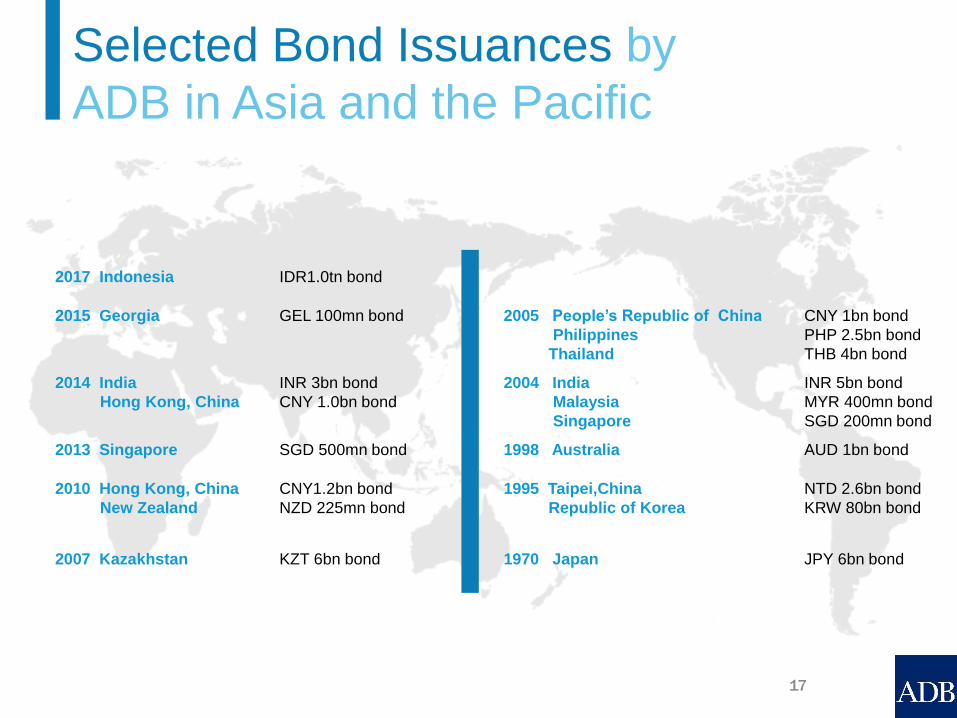
Selected Bond Issuances by
ADB in Asia and the Pacific
2017 Indonesia IDR1.0tn bond
2015 Georgia GEL 100mn bond 2005 People’s Republic of China
Philippines
Thailand
CNY 1bn bond
PHP 2.5bn bond
THB 4bn bond
2014 India
Hong Kong, China
INR 3bn bond
CNY 1.0bn bond
2004 India
Malaysia
Singapore
INR 5bn bond
MYR 400mn bond
SGD 200mn bond
2013 Singapore SGD 500mn bond 1998 Australia AUD 1bn bond
2010 Hong Kong, China
New Zealand
CNY1.2bn bond
NZD 225mn bond
1995 Taipei,China
Republic of Korea
NTD 2.6bn bond
KRW 80bn bond
2007 Kazakhstan KZT 6bn bond 1970 Japan JPY 6bn bond
17
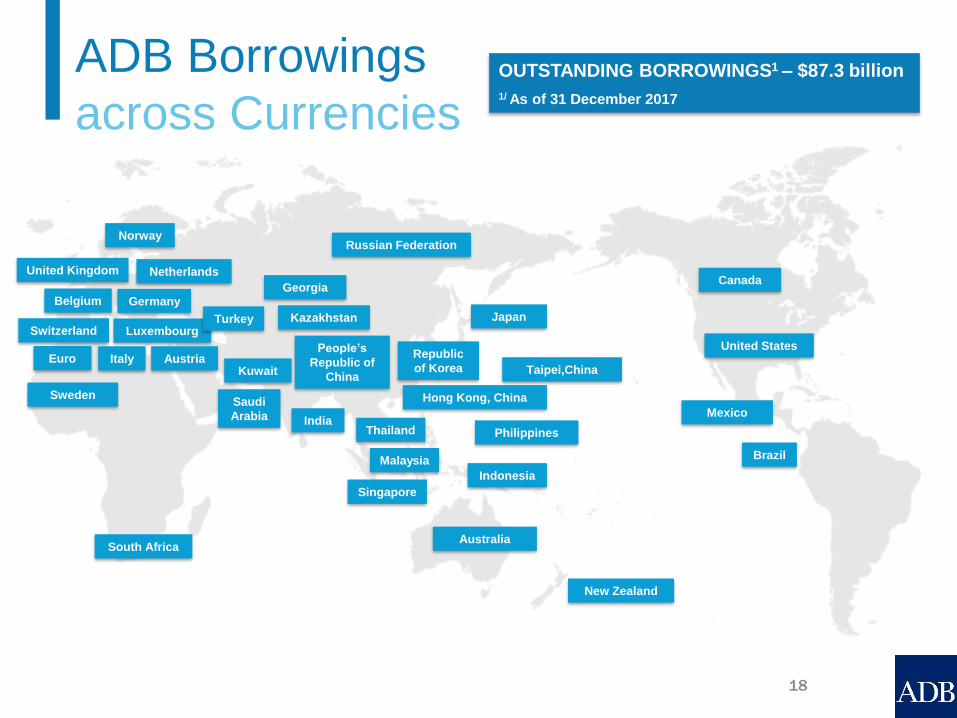
OUTSTANDING BORROWINGS1 – $87.3 billion
1/ As of 31 December 2017
United States
Canada
Norway
United Kingdom Netherlands
Germany
LuxembourgSwitzerland
Italy
Belgium
AustriaKuwait
Saudi
Arabia
Brazil
People’s
Republic of
China
IndiaThailand
Malaysia
Singapore
Philippines
New Zealand
Australia
Japan
Hong Kong, China
Republic
of Korea Taipei,China
Kazakhstan
Mexico
South Africa
Turkey
Euro
Georgia
ADB Borrowings
across Currencies
Russian Federation
Sweden
18
Indonesia

1/ YTD 2018 figures include trades up to 25 May 2018.
2/ ECP dealers include Banc of America Securities Limited, Barclays, Citigroup Global Markets
Limited, Goldman Sachs, ING Bank N.V., and UBS.
Ensure availability of funds at all times to meet operational needs
Benchmark issuance Public bond issuesStructured private placements
and other reverse inquiriesRetail targeted transactions Local currency bond issuance ECP $8 billion Program2
Funding Availability
at all times Borrowings: 2006 – YTD 20181
0.0
5.0
10.0
15.0
20.0
25.0
30.020
06
2007
2008
2009
2010
2011
2012
2013
2014
2015
2016
2017
2018
1.6
3.1 2.9
0.3 0.0 0.6
5.7
2.5 2.4
4.1
8.37.5
2.3
5
9 910
1514
1312
14
19
21
29
13
Indicative, 24
ECP Medium-Long-term borrowings$ billion
19

Denominated in US Dollar and
Euro
In 2, 3, 5, 7, 10, and 20-year
maturities
Typically about $1 billion to $4.0
billion in size1
Issued at least once a year
Documentation
GMTN Programme
Clearing
Federal Reserve Book-Entry
System
Euroclear and Clearstream
GLOBAL
BENCHMARK BONDS
ADB bonds issued in Australia, Canada,
New Zealand, Singapore, Switzerland, and
UK are repo-eligible
ADB Euro bonds are ECB-eligible
Included in various indices:
➢ Barclays Capital Global Aggregate Index
➢ Citigroup WBIG
➢ JPM Euro Sterling Index
➢ Markit iBoxx USD Indices
➢ UBS Composite Bond Index – Australia
➢ UBS Supra-Sovereign Index
Documentation and Clearing
GMTN Programme - Euroclear and
Clearstream; DTC
AUD MTN Programme - Austraclear;
Euroclear and Clearstream
NZD MTN Programme - Austraclear NZ
System; NZ Clearing System
ACN Programme - CDP; HKMA; BNM;
PDEx (if applicable), TDCC; Euroclear and
Clearstream
MYR MTN Programme – Bank Negara
Malaysia
FUNDING
PLATFORMS
Tailor-fit to meet investor
requirements (currency, size, tenor,
structure)
Thematic bonds: Water, Clean
Energy, Green, Health and Gender
bonds
Uridashi notes
Retail-targeted bonds
Structured notes
Documentation
GMTN Programme
ACNP Programme
PRIVATE
PLACEMENTS
Financing
Instruments
1/ Green bonds are typically $500 million and above.
20

0
1
2
3
4
5
6
7
0.0
5.0
10.0
15.0
20.0
25.0
30.0
35.0
2005 2006 2007 2008 2009 2010 2011 2012 2013 2014 2015 2016 2017May-18
Ave. maturity in years
$bn
Global $/€ Benchmark Bonds
Public Bond Issues
Local Currency
Other private placements(institutional,Uridashi,retail-targeted)Structured privateplacements
Average maturity(based on first call date)
Borrowings by Type: 2006 – YTD 2018
Note: Excluding Euro-Commercial Paper issuances (ECPs). Year 2018 figures include trades up to 25 May 2018.
Diversified Product
and Currency Mix
2006 2007 2008 2009 2010 2011 2012 2013 2014 2015 2016 2017 YTD 2018
No. of Currencies 13 13 7 7 9 9 8 10 11 11 14 15 10
No. of Transactions 51 94 113 44 92 68 77 58 50 56 74 91 56
21
2.102.00
1.151.25 1.25
3.25
1.00
1.50
0.65
1.05
0.80
2.25
1.151.00
2.20
3.10
2.25
1.50
0.50
1.00
0.50
3.15
4.00
1.9
1.1
1.35
3.75
0.75
4.00
1.10
0.50
1.50
3.75
1.0
3.25
1.6
0.00
0.50
1.00
1.50
2.00
2.50
3.00
3.50
4.00
4.50
201
8
201
8
201
8
201
8
201
8
201
9
201
9
201
9
201
9
201
9
201
9
202
0
202
0
202
0
202
0
202
0
202
0
202
1
202
1
202
1
202
1
202
1
202
1
202
2
202
2
202
2
202
2
202
3
202
5
202
5
202
6
202
6
202
7
202
7
202
7
202
8
Year of Maturity
22
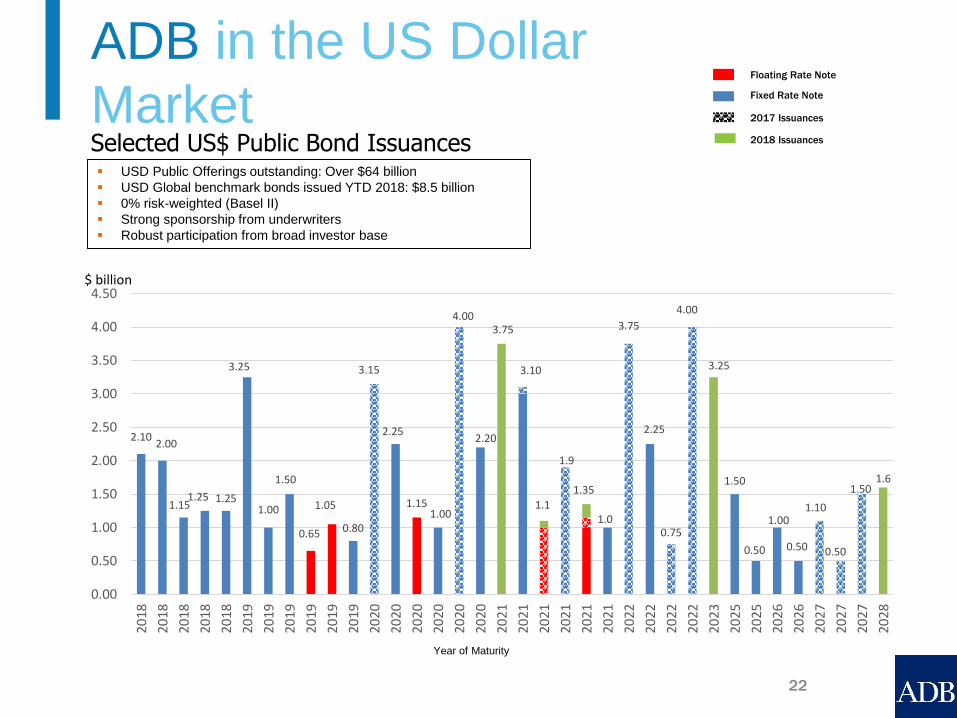
ADB in the US Dollar
MarketSelected US$ Public Bond Issuances
Floating Rate Note
Fixed Rate Note
2017 Issuances
$ billion
▪ USD Public Offerings outstanding: Over $64 billion
▪ USD Global benchmark bonds issued YTD 2018: $8.5 billion
▪ 0% risk-weighted (Basel II)
▪ Strong sponsorship from underwriters
▪ Robust participation from broad investor base
2018 Issuances

ADB in the US Dollar Market
Confidential 23
Note: Circle size represents issuance volume.
$4 bi llion $2 bi llion $1 bi llion

BY GEOGRAPHY (%) BY INVESTOR TYPE (%)
Notes: Distribution based on demand.
Includes fixed, floating rate note (FRN) and reopenings on Global format.
Investor Demand
for USD Global Bonds
40
27
29
32
33
33
23
37
29
29
27
28
12
9
8
9
4
7
19
21
19
20
27
21
6
6
15
10
9
11
2013
2014
2015
2016
2017
2018
Asia Europe Americas
ex-US
Middle East
and Africa
US Central Banks/
Official Institutions
Banks Fund Managers/
Insurance/Pension
Others
53
46
52
55
52
64
26
32
34
26
25
22
16
15
11
17
21
14
5
7
3
3
2
2013
2014
2015
2016
2017
2018
24

25
0.650
1.000
0.200
1.200
1.000
0.550
0.350
0.700
1.0501.000
0.600
0.800
0.185
0.400
0.800
0.00
0.20
0.40
0.60
0.80
1.00
1.20
1.40
2018 2019 2019 2020 2020 2021 2022 2022 2023 2023 2025 2026 2027 2028 2032
Year of Maturity
Floating Rate Note
Fixed Rate Note
2017 Issuances
2018 Issuances
A$ billion
▪ ADB has maintained a consistent presence in the Kangaroo market since 2006 with at least
one issuance per year. As of 25 May 2018, ADB has A$10.5 billion principal outstanding.
▪ Year to date, ADB has issued about A$1.2 billion in Kangaroo bonds.
ADB in the Kangaroo Market

Investors Demand
for Kangaroo Offerings
Note: Distribution based on demand.
BY GEOGRAPHY (%) BY INVESTOR TYPE (%)
39
41
38
30
20
11
57
40
45
59
62
71
2
18
12
6
11
10
1
5
5
7
8
22013
2014
2015
2016
2017
2018
Australia Asia Middle East
and Africa
Europe Americas Central Banks/
Official Institutions
Banks Fund Managers/
Insurance/Pension
Others
27
32
43
28
16
12
31
25
25
24
36
7
39
43
32
48
48
81
32013
2014
2015
2016
2017
2018
26
0.950
0.300
0.200
0.500
0.700
0.000 0.100 0.200 0.300 0.400 0.500 0.600 0.700 0.800 0.900 1.000
2019
2020
2021
2023
2024
NZ$ bn
Year of
Maturity
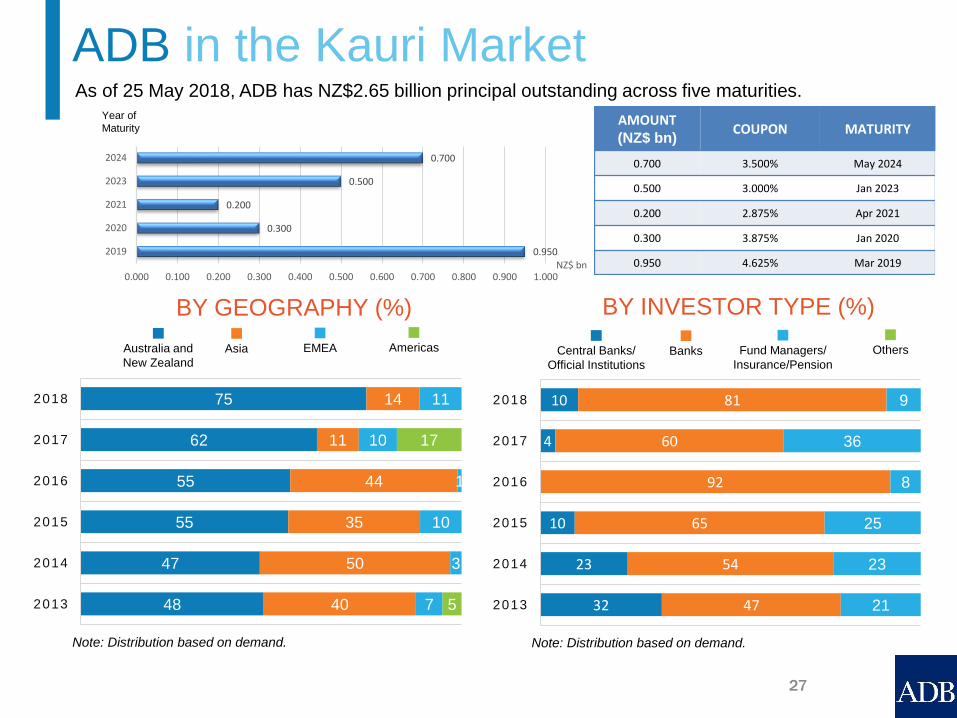
As of 25 May 2018, ADB has NZ$2.65 billion principal outstanding across five maturities.
ADB in the Kauri Market
Note: Distribution based on demand.
BY GEOGRAPHY (%) BY INVESTOR TYPE (%)
Note: Distribution based on demand.
Australia and
New Zealand
Asia EMEA Americas Central Banks/
Official Institutions
Banks Fund Managers/
Insurance/Pension
Others
48
47
55
55
62
75
40
50
35
44
11
14
7
3
10
1
10
11
5
17
2013
2014
2015
2016
2017
2018
32
23
10
4
10
47
54
65
92
60
81
21
23
25
8
36
9
2013
2014
2015
2016
2017
2018
AMOUNT(NZ$ bn)
COUPON MATURITY
0.700 3.500% May 2024
0.500 3.000% Jan 2023
0.200 2.875% Apr 2021
0.300 3.875% Jan 2020
0.950 4.625% Mar 2019
27

0.425
0.250
0.400
0.250
0.000 0.050 0.100 0.150 0.200 0.250 0.300 0.350 0.400 0.450
Dec 2018
Mar 2022
Dec 2022
Dec 2023
£ bn
Year of Maturity
BY GEOGRAPHY (%)
As of 25 May 2018, ADB has £1.325 billion principal outstanding across four
maturities.
ADB in the Sterling Market
BY INVESTOR TYPE (%)
AMOUNT(£ bn)
COUPON MATURITY
0.250 1.375% Dec 2023
0.400 1.000% Dec 2022
0.250 0.750% Mar 2022
0.425 1.000% Dec 2018
Asia UKMiddle East
and Africa
Europe
ex-UK
Americas Central Banks/
Official Institutions
Banks Fund Managers/
Insurance/Pension
Others
16 52
66
88
16
34
11
16
10
0% 20% 40% 60% 80% 100%
2016
2017
2018
31
33
15
60
1
74
9
65
11
1
0% 20% 40% 60% 80% 100%
2016
2017
2018
28
Note: Distribution based on demand.

AMOUNT(RMB bn)
COUPON MATURITY
1.200 2.85% Oct 2020
1.000 4.20% Dec 2019
1.700 3.20% Nov 20191.70
1.0
1.2
0.00 0.50 1.00 1.50 2.00
2019
2019
2020
Year of Maturity
Offshore
Onshore
RMB bn
▪ In 2005, ADB issued its inaugural RMB 1.0bn onshore RMB bonds (the "Panda Bonds")
in China. ADB is the first foreign issuer in the onshore RMB market.
▪ In 2010, ADB successfully launched its first offshore RMB bonds (the "Dimsum Bonds")
with a principal amount of RMB 1.2bn with a 10-year maturity, extending the yield
curve for the offshore RMB market.
▪ To date, ADB has RMB 3.9bn outstanding bonds, of which RMB 2.9bn are issued
offshore.
ADB in the Onshore/Offshore RMB Market
29

5.0
3.0
3.0
18.9
14.0
20.0
5.0
0.0 5.0 10.0 15.0 20.0
2014
2016
2020
Feb2021
Aug2021
2022
2026
Offshore Green BondOffshoreOnshore
AMOUNT COUPON MATURITY
INR20.0 bn 6.20% Oct 2026
INR14.0 bn 5.90% Dec 2022
INR18.9 bn1 6.45% Aug 2021
INR5.0 bn2 6.00% Feb 2021
INR3.0 bn 6.95% Jan 2020
INR3.0 bn 6.35% Aug 2016
INR5.0 bn 5.40% Feb 2014
▪ In 2004 ADB issued its inaugural Indian rupee bond issue: an INR 5.0bn “Maharaja” bond in the domestic market. ADB was the first foreign issuer in the onshore INR market.
▪ In 2014, ADB successfully launched its first offshore INR “Masala” bonds with a principal amount of INR 3.0bn and a 2-year maturity
▪ To date, ADB has issued INR 68.9bn bonds in the domestic and international markets
▪ ADB currently has INR 60.9bn in outstanding bonds all of which were issued offshore.
ADB in the Onshore & Offshore INR Markets
Year of Maturity
INR bn
1 ADB 6.45% bonds due Aug 2021 has been reopened three times since 20162 ADB 6.00% bonds due Feb 2021 is ADB’s first Green Bond issuance in Local currency
30

Responds to investor needs:
▪ Quick execution time
▪ Flexible issue size
▪ Broad maturity range
▪ Varied currency and interest
rate structure
Note: Includes structured notes, institutional and retail-targeted transactions. Year 2018 figures include trades up to 25 May 2018.
0.0
0.5
1.0
1.5
2.0
2.5
3.0
2006 2007 2008 2009 2010 2011 2012 2013 2014 2015 2016 2017YTD2018
43 issues
84 issues 102 issues
35 issues
72 issues52 issues 60 issues
36 issues24 issues
24 issues 30 issues
48 issues
37 issues
$ bn
Dynamic Participation
in Private Placements
31
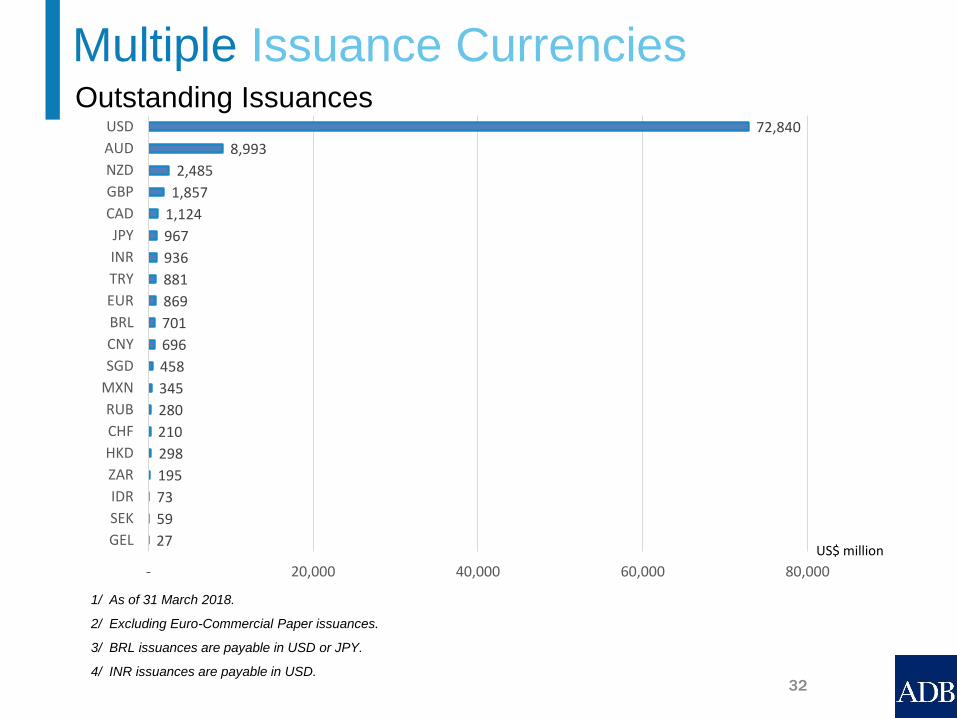
1/ As of 31 March 2018.
2/ Excluding Euro-Commercial Paper issuances.
3/ BRL issuances are payable in USD or JPY.
4/ INR issuances are payable in USD.
Outstanding Issuances
Multiple Issuance Currencies
32
27
59
73
195
298
210
280
345
458
696
701
869
881
936
967
1,124
1,857
2,485
8,993
72,840
- 20,000 40,000 60,000 80,000
GEL
SEK
IDR
ZAR
HKD
CHF
RUB
MXN
SGD
CNY
BRL
EUR
TRY
INR
JPY
CAD
GBP
NZD
AUD
USD
US$ million

ADB’s thematic bonds highlight its
efforts to support key initiatives such as
its water programs, clean energy
projects and health projects through its
AAA quality notes.
▪ ADB launched its first ever topical bonds (Uridashi) in 2010:
• Two-tranche Water Bonds (total amount of $638 million equivalent)
• Four-tranche Clean Energy Bonds (total amount of $233 million equivalent)
▪ ADB has raised an equivalent of about $192.8 million from its sale of water,
health, and gender bonds in 2017.
▪ ADB has issued approximately $2.5 billion equivalent in clean energy, water,
health, and gender bonds since 2010.
Foray into
Thematic Bonds
33

0.091
0.800
0.003
0.013
0.076
0.013
0.009
0.078
0.030
0.002
0.003
0.032
0.010
0.750
0.500 0.500
0.097
0.050
0.500
0.019
0.090
0.031
0.047
0.001
0.010
0.100
1.000
2019 2019 2019 2020 2020 2020 2020 2021 2021 2022 2022 2022 2022 2022 2025 2026 2027 2027 2027 2027 2027 2028 2028
US$bn equivalent
Year of Maturity
Water Bond issues
Green Bond PP
Gender Bond
Health Bond
Green Bond PO
ADB Outstanding
Thematic Bond Issuances • ADB has issued approximately $5.9 billion equivalent in thematic bonds since 20101.
34
1 As of 25 May 2018, the amount of outstanding topical bonds is approximately $3.7 billion equivalent.

Note: Based on notional amounts. Bonds with put and call options were considered maturing on the first put or call date. Includes ECPs.
Maturity Profile of Outstanding BorrowingsAs of 31 March 2018
Redemption Profile
35
0.00
2.00
4.00
6.00
8.00
10.00
12.00
14.00
16.00
18.00
20182019
20202021
20222023
20242025
20262027
onwards
14.86
11.68
17.29
15.2414.66
4.86
0.942.54
2.52
9.69
US$ bn
CONTENTSCONTENTS
▪ Asian Development Bank
▪ Funding Operations
▪ Green Bond Framework
▪ Appendices
36
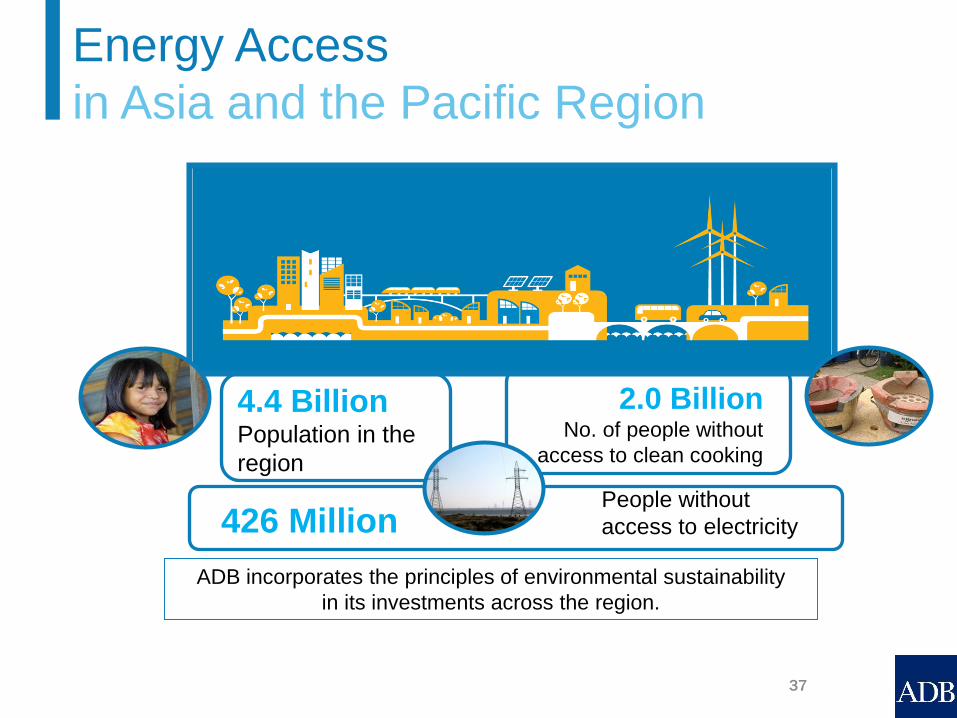
4.4 Billion Population in the
region
2.0 BillionNo. of people without
access to clean cooking
426 MillionPeople without
access to electricity
ADB incorporates the principles of environmental sustainability
in its investments across the region.
Energy Access
in Asia and the Pacific Region
37

▪ Asia’s overall national infrastructure needs
are estimated to be around $26 trillion over
2016-2030 or approximately $1.7 trillion per
year.*
▪ Of the total investment needs over 2016-
2030, $14.7 trillion will be for power and
$8.4 trillion for transport.
▪ ADB recognizes the importance of
sustainable investments in the region and
have been investing over $2 billion in clean
energy projects each year since 2011.
▪ ADB remains committed to scaling up
climate financing of $6 billion per year by
2020, of which $4 billion will target
mitigation and $2 billion adaptation.
* ADB 28 February 2017.
Background
38

1. Country Partnership
Strategy
ADB
Project
Cycle2. Preparation
3. Approval4. Implementation
5. Evaluation
Source: http://www.adb.org/projects/cycle
Overview:
ADB’s Project Cycle
39

1. Project eligibility: ADB’s Green Bond
Framework defines eligible projects to
support developing member countries
seeking to adapt to and mitigate the
consequences of climate change
2. Project Selection: The project selection
criteria will be implemented by sector
specialists in coordination with the treasury
department
3. Proceeds: Green bond proceeds will be
allocated to a subportfolio and tracked
against disbursement of eligible projects
4. Reporting: ADB will make available
eligible project list and green bond annual
newsletter online
1/ With second opinion.
Source: http://www.adb.org/sites/default/files/adb-green-bonds-framework.pdf
Green Bond
Framework1
40

Eligible Project Criteria▪ Eligible Projects: selected pool of projects funded, in whole or in part, by ADB that
promotes the transition to low-carbon and climate resilient growth as determined by ADB
Mitigation– Renewable Energy
• Solar
• Wind
• Geothermal
• Small Hydro ( 20MW and below)
– Energy Efficiency1
– Sustainable Transport (excluding roads)• Urban public transport
• Non-urban railway projects
• Non-motorized transport
Adaptation– Energy1
– Water and other Urban Infrastructure and Services
– Transport
1/ Excludes fossil fuels.
Source: ADB Green Bond Framework.
https://www.adb.org/sites/default/files/adb-green-bonds-framework.pdf
41
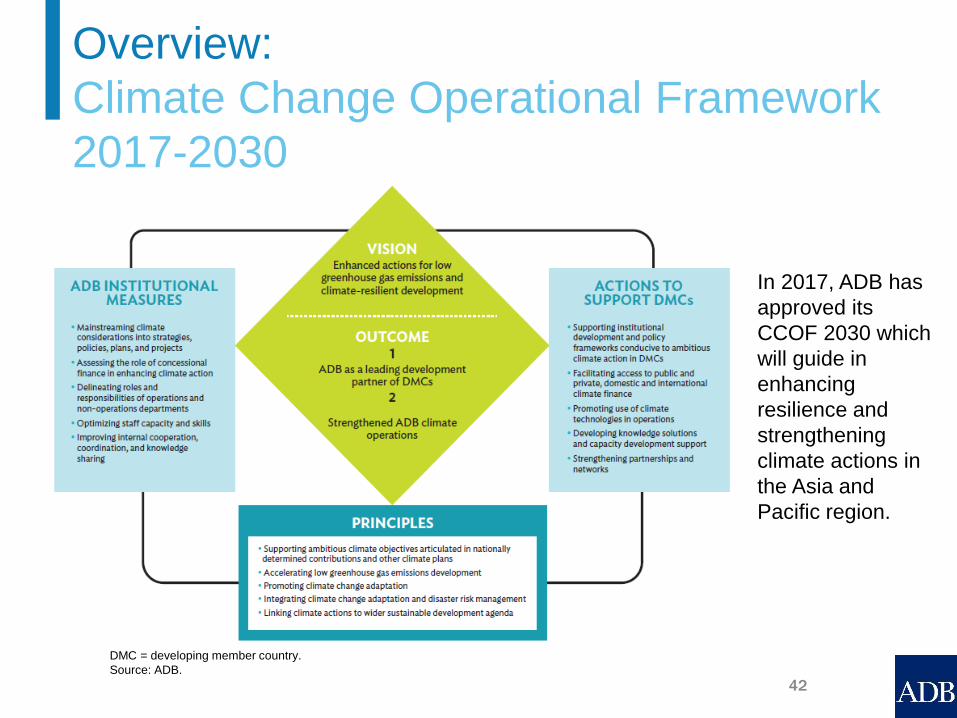
Overview:
Climate Change Operational Framework
2017-2030
DMC = developing member country.
Source: ADB.
In 2017, ADB has
approved its
CCOF 2030 which
will guide in
enhancing
resilience and
strengthening
climate actions in
the Asia and
Pacific region.
42
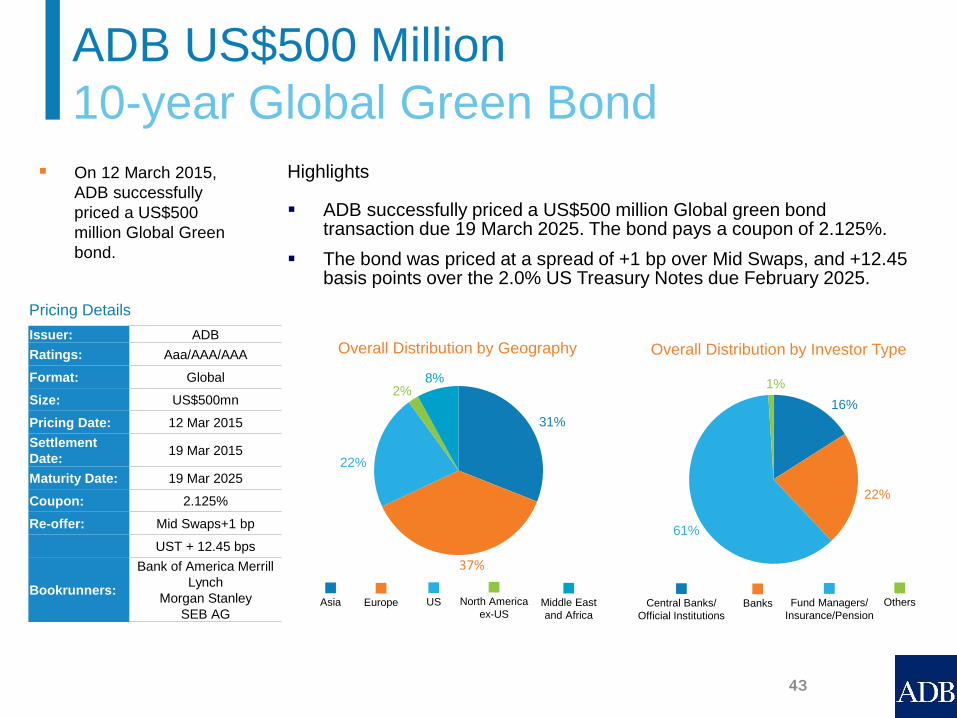
▪ On 12 March 2015,
ADB successfully
priced a US$500
million Global Green
bond.
Overall Distribution by Geography Overall Distribution by Investor TypeIssuer: ADB
Ratings: Aaa/AAA/AAA
Format: Global
Size: US$500mn
Pricing Date: 12 Mar 2015
Settlement
Date:19 Mar 2015
Maturity Date: 19 Mar 2025
Coupon: 2.125%
Re-offer: Mid Swaps+1 bp
UST + 12.45 bps
Bookrunners:
Bank of America Merrill
Lynch
Morgan Stanley
SEB AG
ADB US$500 Million
10-year Global Green Bond
Asia Europe Middle East
and Africa
US North America
ex-USCentral Banks/
Official Institutions
Banks Fund Managers/
Insurance/Pension
Others
31%
37%
22%
2%8%
16%
22%
61%
1%
Highlights
▪ ADB successfully priced a US$500 million Global green bond transaction due 19 March 2025. The bond pays a coupon of 2.125%.
▪ The bond was priced at a spread of +1 bp over Mid Swaps, and +12.45 basis points over the 2.0% US Treasury Notes due February 2025.
Pricing Details
43

58 5 37
▪ On 9 August 2016, ADB
successfully priced the
first ever dual tranche
Green Bond global
transaction by an SSA.
US$800 million 3-year
Distribution by Geography (%)US$800 million 3-year
Distribution by Investor Type (%)
ADB US$1.3 Billion Dual Tranche
Green Bond
Americas Asia Europe, Middle East
and AfricaCentral Banks/
Official Institutions BanksInsurance/
Pension/Others
Fund
Managers
Highlights
▪ ADB successfully priced the first ever dual tranche Green Bond global transaction from an SSA issuer consisting of US$800 million 3-year benchmark due August 2019 and US$500 million 10-year benchmark due August 2026.
▪ The 3-year was priced with a spread of +1bps over mid-swaps, equivalent to +22.75bps over the UST 0.75% due July 2019. The 10-year was priced with a spread of +33bps over Mid Swaps, equivalent to +21.9bps over the UST 1.625% due May 2026.
▪ It is ADB’s second Green Bond issue in benchmark format and its largest to date, which follows from ADB’s inaugural Global Green Bond issued in March 2015.
US$500 million 10-year
Distribution by Geography (%)
US$500 million 10-year
Distribution by Investor Type (%)
Pricing Details
Americas Asia Europe, Middle East
and Africa
Central Banks/
Official InstitutionsBanks
Fund Managers/
Insurance/Pension
Others
19 49 32
32 16 44 8
11 13 46 30
Issuer: ADB
Ratings: Aaa/AAA/AAA
Tranche: 3-year 10-year
Size: US$800
million
US$500
million
Pricing Date: 09-Aug-16 09-Aug-16
Settlement
Date:16-Aug-16 16-Aug-16
Maturity
Dates:16-Aug-19 14-Aug-26
Coupon: 1.00% 1.75%
Bookrunners:
Bank of America Merrill
Lynch
Credit Agricole CIB
J.P. Morgan
44

47 24 29
▪ On 1 August 2017, ADB
priced a dual tranche
Green Bond global
transaction.
US$750 million 5-year
Distribution by Geography (%)US$750 million 5-year
Distribution by Investor Type (%)
ADB US$1.25 Billion Dual Tranche
Green Bond
Americas Asia Europe, Middle East
and AfricaCentral Banks/
Official Institutions BanksInsurance/
Pension/Others
Fund
Managers
Highlights
▪ ADB successfully priced its third global Green Bond benchmark transaction consisting of US$750 million 5-year benchmark due August 2022 and US$500 million 10-year benchmark due August 2027.
▪ The 5-year was priced at 99.531% to yield 16.3 basis points over the 1.875% US Treasury notes due July 2022. The 10-year was priced at 99.172% to yield 20.5 basis points over the 2.375% US Treasury notes due May 2027.
▪ ADB’s third USD Green benchmark transaction reinforces commitment to a regular presence in the Green Bond market.
US$500 million 10-year
Distribution by Geography (%)
US$500 million 10-year
Distribution by Investor Type (%)
Pricing Details
Americas Asia Europe, Middle East
and Africa
Central Banks/
Official InstitutionsBanks
Fund Managers/
Insurance/Pension
Others
18 13 69
38 31 31
25 52 23
Issuer: ADB
Ratings: Aaa/AAA/AAA
Tranche: 5-year 10-year
Size: US$750
million
US$500
million
Pricing Date: 01-Aug-17 01-Aug-17
Settlement
Date:10-Aug-17 10-Aug-17
Maturity
Dates:10-Aug-22 10-Aug-27
Coupon: 1.875% 2.375%
Bookrunners:
Bank of America Merrill
Lynch
Credit Agricole CIB
J.P. Morgan
45

PROJECT CATEGORY: Renewable energy
TOTAL LOAN: $250 million
OUTPUTS:
▪ Approximately 350MW renewable power to
be commissioned
EXPECTED RESULTS:
▪ About 1.3 million tons of CO2 emissions
avoided per year (30 years project life)
Eligible Project: Sarulla Geothermal
Power Development, Indonesia
46

PROJECT CATEGORY: Renewable energy
TOTAL LOAN: $20 million
OUTPUTS:
▪ Installation and operation of 150 MW
utility-scale wind power plant
EXPECTED RESULTS:
▪ Approximately 370 GWh of wind power
delivered to the grid per year, on average,
starting 2015
▪ Over 160,000 tons CO2 equivalent avoided
per annum
Eligible Project: EDC Burgos Wind
Power Corporation, Philippines
47

▪ Asian Development Bank
▪ Funding Operations
▪ Green Bond Framework
▪ Appendices
48
Appendix 1:
ADB in the News
49
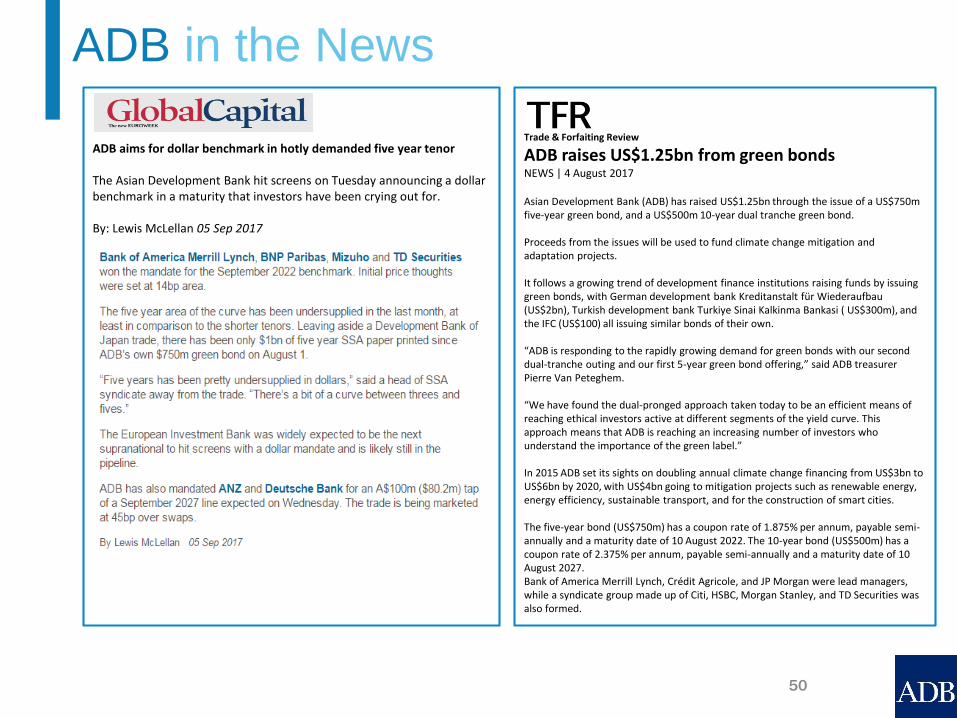
Trade & Forfaiting Review
ADB raises US$1.25bn from green bonds NEWS | 4 August 2017
Asian Development Bank (ADB) has raised US$1.25bn through the issue of a US$750m five-year green bond, and a US$500m 10-year dual tranche green bond.
Proceeds from the issues will be used to fund climate change mitigation and adaptation projects.
It follows a growing trend of development finance institutions raising funds by issuing green bonds, with German development bank Kreditanstalt für Wiederaufbau(US$2bn), Turkish development bank Turkiye Sinai Kalkinma Bankasi ( US$300m), and the IFC (US$100) all issuing similar bonds of their own.
“ADB is responding to the rapidly growing demand for green bonds with our second dual-tranche outing and our first 5-year green bond offering,” said ADB treasurer Pierre Van Peteghem.
“We have found the dual-pronged approach taken today to be an efficient means of reaching ethical investors active at different segments of the yield curve. This approach means that ADB is reaching an increasing number of investors who understand the importance of the green label.”
In 2015 ADB set its sights on doubling annual climate change financing from US$3bn to US$6bn by 2020, with US$4bn going to mitigation projects such as renewable energy, energy efficiency, sustainable transport, and for the construction of smart cities.
The five-year bond (US$750m) has a coupon rate of 1.875% per annum, payable semi-annually and a maturity date of 10 August 2022. The 10-year bond (US$500m) has a coupon rate of 2.375% per annum, payable semi-annually and a maturity date of 10 August 2027. Bank of America Merrill Lynch, Crédit Agricole, and JP Morgan were lead managers, while a syndicate group made up of Citi, HSBC, Morgan Stanley, and TD Securities was also formed.
ADB in the News
ADB aims for dollar benchmark in hotly demanded five year tenor
The Asian Development Bank hit screens on Tuesday announcing a dollar benchmark in a maturity that investors have been crying out for.
By: Lewis McLellan 05 Sep 2017
50

ADB adds A$350 million to its 2022 Kangaroo
Last Updated on Tuesday, 14 February 2017 16:10
Asian Development Bank (ADB) (AAA/Aaa/AAA) priced a tap to its January 2022 Kangaroo bond on 14 February. The transaction was upsized from A$200 million (US$153.3 million) minimum volume and priced in line with guidance of 40 basis points over semi-quarterly swap.
According to KangaNews data, the tap issue will be the first increase to ADB’s January 2022 Australian dollar line, after it was introduced for A$300 million at 42 basis points over swap on January 10.
ADB in the News
ADB joins $4bn club
The Asian Development Bank on Wednesday hit the $4bn mark for the first time with a dollar benchmark, taking advantage of a dearth of supply and offering a bit of juice to harvest a hefty amount of cash.By Craig McGlashan 26 Apr 2017
Leads BMO Capital Markets, Citi, Deutsche Bank, and RBC Capital Markets priced the $4 billion May 2020 global bond at minus 5bp after taking orders of over $5.4bn.
The deal moved through several pricing steps, first hitting screens on Tuesday with initial price thoughts of minus 4bp area.
“I was a bit surprised because I had the ADB’s January 2020 around minus 13bp and the IADB’s May 2020 [from April] at minus 8bp, so I thought it looked a bit generous in terms of new issue premium,” said a head of SSA DCM away from the trade.
“But in the end I understand ADB wanted size, so it was the right strategy.”
After taking indications of interest of over $2.9bn, books opened officially on
Wednesday morning around 8am with guidance unchanged. Just under two hours later, with orders over $3.7bn, the leads revised guidance to 5bp area before pricing in line with that. The final book was over $5.4bn.
It is the second time this year that ADB has broken its size record for a dollar benchmark, with a $3.75bn five year in February its previous biggest.
“This shows ADB has no problem doing larger deals to face its substantially larger funding programme this year,” said a head of SSA syndicate away from the deal. “It picked a good window, with none of the big guys looking and the capacity for new dollar supply quite high after a lack of deals over the last few weeks.”
51
Appendix 2:
Highlights of
Loan Operations
52

PROJECT SUMMARY:
Meeting the need for reliable and affordable electricity is a challenge for
Bangladesh as the country seeks to consolidate its transition to middle-
income country status by 2021. Apart from addressing infrastructure
constraints and improving the country’s transmission and distribution
networks, the project will also support productive energy usage in rural
areas, enhanced safety for customers, improvements in rural distribution
management, and interventions to support women employees in the
power sector.
The project includes the construction of a 174 kilometer (km) high-
voltage, 400 kV transmission link between southern Bangladesh and
Dhaka, design and installation of control and automation systems to
improve the distribution network in areas serviced by the Dhaka
Electricity Supply Company, rehabilitation and expansion of over 50,000
km of rural distribution network across the country, and support on
project design, investment planning, and regulatory compliance in the
power sector agencies.
The project will contribute to the Government of Bangladesh’s goal of
giving people 100% access to power by 2021, with about 875,000
households benefiting from the distribution investments by 2020. The
total cost of the project is $1.059 billion, with the government contributing
$441 million in counterpart funding.
Power System Enhancement and Efficiency
Improvement Project
Development
impact:
Access to efficient and reliable
electricity supply in Bangladesh
improved
Sector: Energy - Electricity transmission and
distribution- Energy efficiency and
conservation
Drivers of
Change:
Governance and capacity
development
Partnerships
Project Term: 2017 – 2020
ADB
Financing:
$600 million
Bangladesh:
Enhanced Power Systems
53
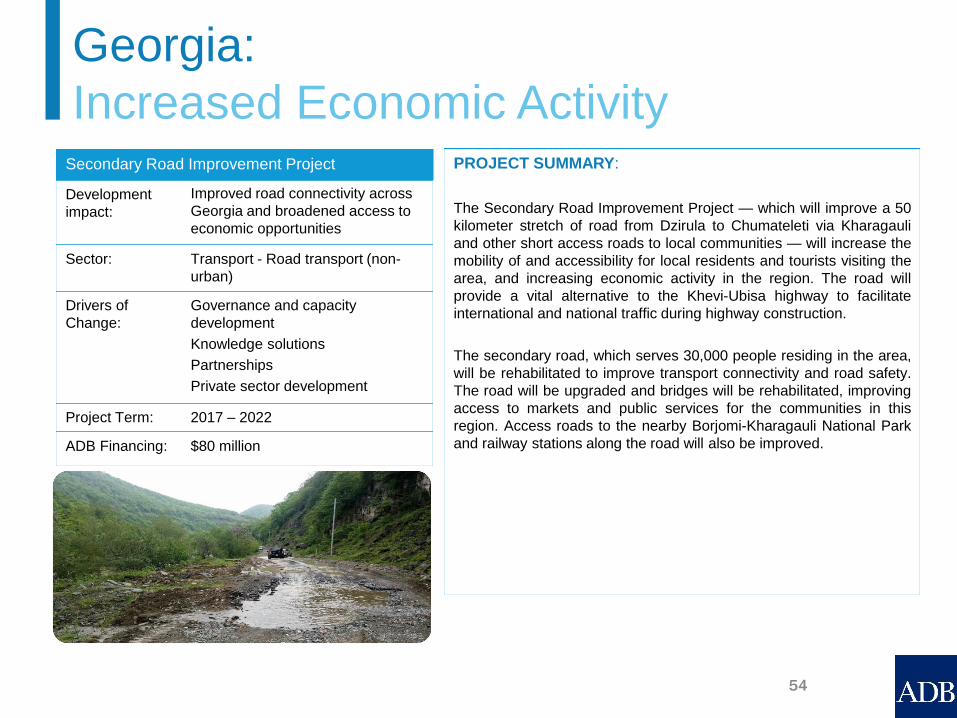
PROJECT SUMMARY:
The Secondary Road Improvement Project — which will improve a 50
kilometer stretch of road from Dzirula to Chumateleti via Kharagauli
and other short access roads to local communities — will increase the
mobility of and accessibility for local residents and tourists visiting the
area, and increasing economic activity in the region. The road will
provide a vital alternative to the Khevi-Ubisa highway to facilitate
international and national traffic during highway construction.
The secondary road, which serves 30,000 people residing in the area,
will be rehabilitated to improve transport connectivity and road safety.
The road will be upgraded and bridges will be rehabilitated, improving
access to markets and public services for the communities in this
region. Access roads to the nearby Borjomi-Kharagauli National Park
and railway stations along the road will also be improved.
Secondary Road Improvement Project
Development
impact:
Improved road connectivity across
Georgia and broadened access to
economic opportunities
Sector: Transport - Road transport (non-
urban)
Drivers of
Change:
Governance and capacity
development
Knowledge solutions
Partnerships
Private sector development
Project Term: 2017 – 2022
ADB Financing: $80 million
Georgia:
Increased Economic Activity
54
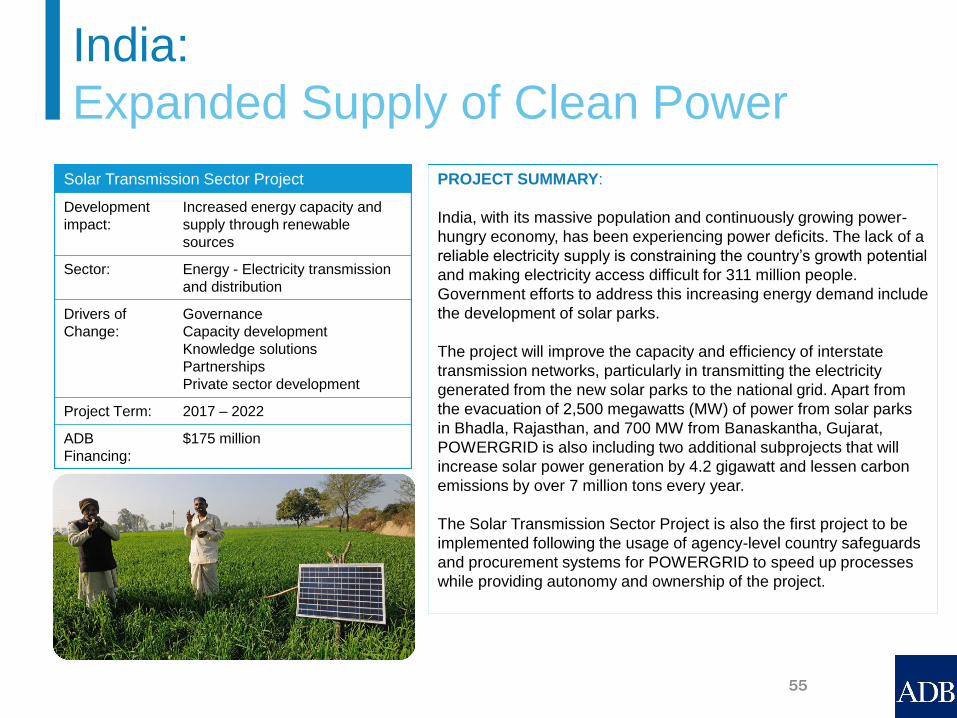
PROJECT SUMMARY:
India, with its massive population and continuously growing power-
hungry economy, has been experiencing power deficits. The lack of a
reliable electricity supply is constraining the country’s growth potential
and making electricity access difficult for 311 million people.
Government efforts to address this increasing energy demand include
the development of solar parks.
The project will improve the capacity and efficiency of interstate
transmission networks, particularly in transmitting the electricity
generated from the new solar parks to the national grid. Apart from
the evacuation of 2,500 megawatts (MW) of power from solar parks
in Bhadla, Rajasthan, and 700 MW from Banaskantha, Gujarat,
POWERGRID is also including two additional subprojects that will
increase solar power generation by 4.2 gigawatt and lessen carbon
emissions by over 7 million tons every year.
The Solar Transmission Sector Project is also the first project to be
implemented following the usage of agency-level country safeguards
and procurement systems for POWERGRID to speed up processes
while providing autonomy and ownership of the project.
Solar Transmission Sector Project
Development
impact:
Increased energy capacity and
supply through renewable
sources
Sector: Energy - Electricity transmission
and distribution
Drivers of
Change:
Governance
Capacity development
Knowledge solutions
Partnerships
Private sector development
Project Term: 2017 – 2022
ADB
Financing:
$175 million
India:
Expanded Supply of Clean Power
55
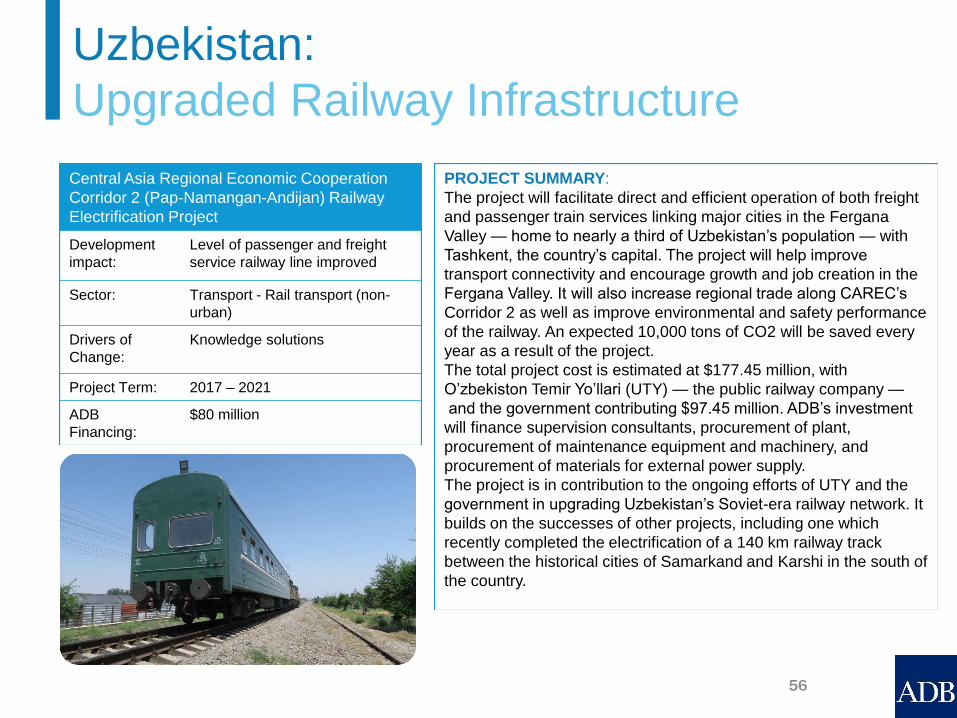
PROJECT SUMMARY:
The project will facilitate direct and efficient operation of both freight
and passenger train services linking major cities in the Fergana
Valley — home to nearly a third of Uzbekistan’s population — with
Tashkent, the country’s capital. The project will help improve
transport connectivity and encourage growth and job creation in the
Fergana Valley. It will also increase regional trade along CAREC’s
Corridor 2 as well as improve environmental and safety performance
of the railway. An expected 10,000 tons of CO2 will be saved every
year as a result of the project.
The total project cost is estimated at $177.45 million, with
O’zbekiston Temir Yo’llari (UTY) — the public railway company —
and the government contributing $97.45 million. ADB’s investment
will finance supervision consultants, procurement of plant,
procurement of maintenance equipment and machinery, and
procurement of materials for external power supply.
The project is in contribution to the ongoing efforts of UTY and the
government in upgrading Uzbekistan’s Soviet-era railway network. It
builds on the successes of other projects, including one which
recently completed the electrification of a 140 km railway track
between the historical cities of Samarkand and Karshi in the south of
the country.
Central Asia Regional Economic Cooperation
Corridor 2 (Pap-Namangan-Andijan) Railway
Electrification Project
Development
impact:
Level of passenger and freight
service railway line improved
Sector: Transport - Rail transport (non-
urban)
Drivers of
Change:
Knowledge solutions
Project Term: 2017 – 2021
ADB
Financing:
$80 million
Uzbekistan:
Upgraded Railway Infrastructure
56

Appendices 3-9
57

Lending Limitation: Under the policy, the total amount of disbursed loans, disbursed equity investments,
and the related prudential buffer, and the maximum amount that could be demanded from ADB under its
guarantee portfolio may not exceed the total of ADB’s unimpaired subscribed capital, reserves, and surplus,
exclusive of the special reserve.
Borrowing limitation: ADB’s borrowing policy limits ADB’s gross outstanding borrowings to no more than
the sum of callable capital of non-borrowing members, paid-in capital, and reserves (including surplus).
Risk Bearing Capacity: ADB assesses its capital adequacy using a stress test methodology that entails,
among other things, estimated non-accrual shocks and their impact on ADB's capital and income over the
next 5 years. The framework provides ADB with the ability to assess its capital adequacy based on
changes in risk exposure, as well as on its characteristics as an MDB, including callable capital, preferred
creditor status, and developmental mandate.
Conservative Investment Guidelines: The maximum allowable average duration of all investments
outstanding is 4 years, while the target policy duration for the USD core portfolio is 3 years, with +/- one
year allowable deviation. ADB’s investment guidelines permit only high quality instruments such as
government and government-agency debt and highly-rated corporate securities. As a second line of
defense, the Office of Risk Management monitors the investment portfolio on a daily basis and ensures
compliance with prescribed limits.
For further details, please see go to
http://www.adb.org/site/investors/credit-fundamentals/financial-and-risk-management-policies
Appendix 3:
Conservative Financial Policies
58

▪ Approved on 20 July 2009, the new Safeguard Policy Statement reaffirms and strengthens ADB’s
commitment to ensuring that borrowers/clients meet ADB safeguard requirements to avoid, minimize,
mitigate and/or compensate adverse impacts of ADB operations on the environment and project-
affected people.
▪ The policy commits ADB to assessing country safeguard systems, assisting borrowers/clients to
strengthen both their approaches and country capacity to manage environmental and social risks,
and to increasing ADB oversight during implementation.
▪ As a central part of ADB's mission to promote environmentally sustainable and inclusive economic
growth, the new Safeguard Policy Statement consolidates and builds upon current ADB policies on
Environment, Indigenous Peoples and Involuntary Resettlement that are already applied to all bank-
supported projects in developing member countries (DMCs).
▪ The policy ensures that ADB’s safeguards are harmonized with other multilateral development banks
and remain relevant to the evolving needs of DMCs and private sector clients.
▪ The policy contains new provisions on biodiversity conservation, community health and safety, and
physical cultural resources. Key features include emphasis on capacity development of borrowers
and more attention to safeguard implementation and supervision.
▪ The Safeguard Policy Statement became effective on 20 January 2010.
For further details, please see http://www.adb.org/site/safeguards/main
Appendix 4:
Safeguard Policy Statement
59
▪ Developing good governance and fighting corruption are core ADB strategic objectives and are crucial to effective, transparent and
accountable aid, to which ADB committed by endorsing the Paris Declaration on Aid Effectiveness.
▪ ADB’s Office of Anticorruption and Integrity (OAI), an independent body since October 2009, is the initial point of contact for allegations of
integrity violations involving ADB-related activities or ADB staff. Its mission is to ensure ADB and its partners maintain the highest ethical
and professional standards, and prevent resources intended to improve the lives of the poor from being used to line the pockets of the
unscrupulous.
▪ Any party found to have committed fraudulent, corrupt, coercive, collusive, obstructive practices, or other integrity violations identified by
ADB risks being sanctioned with debarment. Debarred entities are ineligible to participate in ADB-financed, administered or supported
activities. A debarred firm’s ineligibility extends to all employees and officers of a firm, and may extend to other principals and contractual
employees of the firm. Debarred individuals may not participate in ADB-related activity, as individuals or through nomination by an eligible
firm, unless they have completely disassociated themselves with an ineligible firm.
▪ Following the Harmonized Framework adopted by MDBs in 2006, the Agreement on Cross-Debarment was signed by ADB, the World Bank
Group, the African Development Bank (AfDB), the Inter-American Development Bank (IADB) and the European Bank for Reconstruction and
Development (EBRD) in Luxembourg on 9 April 2010. An important global milestone in the fight against corruption, this Agreement allows
that an entity debarred by one of the participating MDBs be subsequently cross-debarred by the other participating MDBs, and constitutes an
important step in strengthening global anticorruption efforts.
▪ The base sanction for integrity violations is 3-year debarment. The Integrity Oversight Committee (IOC) may impose a greater or lesser
debarment period depending on the circumstances of each case. The IOC will be guided by the following ranges: 1) First debarments
(including cases where a party has previously been given a reprimand) – 1 year to indefinite for individuals and 1 to 7 years for firms, 2)
Second debarments – up to indefinite for individuals and up to 10 years for firms, 3) Subsequent debarments – up to indefinite for individuals
and up to 20 years for firms.
▪ In accordance with ADB’s Anticorruption Policy, ADB’s zero tolerance to corruption is linked to broader support for governance and
improvement in the quality and capacities of developing member countries (DMCs), with fraud and corruption detection training given to
government agencies in several of these DMCs.
▪ ADB also organizes knowledge support activities to improve integrity awareness and skills. Since 2010 it is mandatory for all ADB staff to be
briefed on the importance of fighting corruption and adherence to ADB’s Anticorruption Policy.
For further details, please see http://www.adb.org/site/integrity/main
Appendix 5:
Anticorruption and Integrity Policies
60
▪ The Investment Climate Facilitation Fund (ICFF) was established by the Government of Japan (GOJ) and the Asian
Development Bank (ADB) in 2008 as a trust fund under the Regional Cooperation and Integration Financing Partnership
Facility (RCIFPF) of ADB.
▪ The objective of ICFF is to promote investments in ADB’s developing member countries (DMCs) and facilitate regional
cooperation and integration (RCI) through the construction of basic infrastructure, improvements in the investment climate,
capacity building, and promotion of good governance, among others.
▪ Activities to be supported by ICFF are projects that:
a. require collective efforts and actions of two or more countries to jointly respond to cross-border issues;
b. are national in nature, but with significant regional dimensions and/or implications;
c. facilitate regional policy dialogue, including the establishment of regional policies for greater RCI;
d. support research and promote knowledge generation and dissemination among DMCs in the area of RCI;
e. strengthen institutional capacity of regional and/or subregional groupings; or
f. support regional partnership building with international institutions.
▪ All ADB DMCs are eligible for support from ICFF. Funding priority will be given to projects that promote financial sector
development and regional investment. Likewise, projects which will promote the visibility of ICFF as well as those which
will be implemented in cooperation with Japanese aid agencies will be prioritized.
▪ ADB has been appointed by GOJ as the administrator of ICFF.
▪ Project implementation, supervision, and monitoring are conducted by the concerned departments and offices following
ADB’s standard policies, procedures, and guidelines, including consulting services and procurement, social and
environmental safeguards, financial management and reporting, and anticorruption and governance, as amended from
time to time.
▪ Total funds committed amounted to approximately $31.5 million as of 31 December 2017.
Appendix 6:
Investment Climate Facilitation Fund
61

ADB’s Strategic Priorities for 2014 – 2020:
A. Sharpening ADB’s Operational Focus 1. Poverty reduction and inclusive economic growth
2. Environment and climate change
3. Regional cooperation and integration
4. Infrastructure development
B. Responding to the New Business
Environment
5. Middle-income countries
6. Private sector development and operations
7. Knowledge solutions
C. Strengthening ADB’s Capacity and
Effectiveness
8. Financial resources and partnerships
9. Delivering value for money in ADB
10. Organizing to meet new challenges
Appendix 7:
Midterm Review of Strategy 2020
62

REGIONAL MEMBERS RatingYear of
MembershipRating
Year of
Membership
Afghanistan NR/NR 1966 Micronesia, Fed. States of NR/NR 1990
Armenia B1/NR 2005 Mongolia B3/B- 1991
Australia Aaa/AAA 1966 Myanmar NR/NR 1973
Azerbaijan Ba2/BB+ 1999 Nauru NR/NR 1991
Bangladesh Ba3/BB- 1973 Nepal NR/NR 1966
Bhutan NR/NR 1982 New Zealand Aaa/AA 1966
Brunei Darussalam NR/NR 2006 Pakistan B3/B 1966
Cambodia B2/NR 1966 Palau NR/NR 2003
People's Republic of China A1/A+ 1986 Papua New Guinea B2/B 1971
Cook Islands NR/B+ 1976 Philippines Baa2/BBB 1966
Fiji Ba3/B+ 1970 Samoa NR/NR 1966
Georgia Ba2/BB- 2007 Singapore Aaa/AAA 1966
Hong Kong, China Aa2/AA+ 1969 Solomon Islands NR/NR 1973
India Baa2/BBB- 1966 Sri Lanka B1/B+ 1966
Indonesia Baa2/BBB- 1966 Taipei,China Aa3/AA- 1966
Japan A1/A+ 1966 Tajikistan NR/NR 1998
Kazakhstan Baa3/BBB- 1994 Thailand Baa1/BBB+ 1966
Kiribati NR/NR 1974 Timor-Leste NR/NR 2002
Republic of Korea Aa2/AA 1966 Tonga NR/NR 1972
Kyrgyz Republic NR/NR 1994 Turkmenistan WR/NR 2000
Lao People's Democratic Rep. NR/NR 1966 Tuvalu NR/NR 1993
Malaysia A3/A- 1966 Uzbekistan NR/NR 1995
Republic of the Maldives NR/NR 1978 Vanuatu NR/NR 1981
Marshall Islands NR/NR 1990 Viet Nam B1/BB- 1966
NON-REGIONAL
MEMBERSRating
Year of
Membership
Austria Aa1/AA+ 1966
Belgium Aa3/AA 1966
Canada Aaa/AAA 1966
Denmark Aaa/AAA 1966
Finland Aa1/AA+ 1966
France Aa2/AA 1970
Germany Aaa/AAA 1966
Ireland A2/A+ 2006
Italy Baa2/BBB 1966
Luxembourg Aaa/AAA 2003
The Netherlands Aaa/AAA 1966
Norway Aaa/AAA 1966
Portugal Ba1/BBB- 2002
Spain Baa1/A- 1986
Sweden Aaa/AAA 1966
Switzerland Aaa/AAA 1967
Turkey Ba2/BB- 1991
United Kingdom Aa2/AA 1966
United States Aaa/AA+ 1966
Note: Moody’s and Standard & Poor’s ratings are as of 25 May 2018.
(Source: Bloomberg)
Appendix 8:
ADB’s Shareholders – 31 December 2017
63
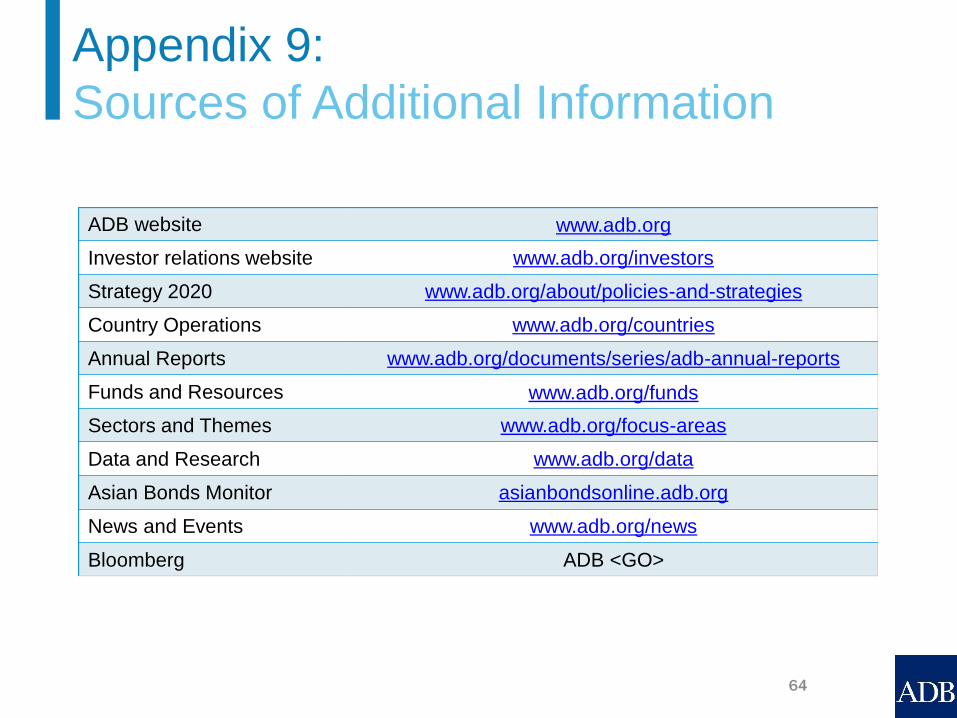
ADB website www.adb.org
Investor relations website www.adb.org/investors
Strategy 2020 www.adb.org/about/policies-and-strategies
Country Operations www.adb.org/countries
Annual Reports www.adb.org/documents/series/adb-annual-reports
Funds and Resources www.adb.org/funds
Sectors and Themes www.adb.org/focus-areas
Data and Research www.adb.org/data
Asian Bonds Monitor asianbondsonline.adb.org
News and Events www.adb.org/news
Bloomberg ADB <GO>
Appendix 9:
Sources of Additional Information
64

This presentation is for informational purposes only and does not constitute an offer to sell or solicitation
of an offer to buy any ADB securities in any jurisdiction to any person to whom it is unlawful to make such
an offer or solicitation.
- The term “country”, as used in the context of ADB, refers to a member of ADB and does not
imply any view on the part of ADB as to the member’s sovereignty or independent status.
- In this publication, $ refer to US dollars.
Disclaimer
Every effort has been made to ensure the accuracy
of the data used in this publication. Variations in
data in the Asian Development Bank (ADB)
publications often result from different publication
dates, although differences may also come from
source and interpretation of data. ADB accepts no
responsibility from any consequence of their use.
65

Asian Development Bank
Treasury Department
Funding Division
6 ADB Avenue, Mandaluyong City
1550 Metro Manila, Philippines
Email [email protected]
Investor Website www.adb.org/investors
Bloomberg ADB <GO>
Tel. No. +632 683-1204
Fax No. +632 632-4120
All images are from the ADB Photo Library.
Asian Development Bank
Fighting Poverty in Asia and the Pacific
66