Adaptive Traffic Light Control For Traffic Network
23
Adaptive Traffic Light Control For Traffic Network
description
Adaptive Traffic Light Control For Traffic Network. Abstract. Our objective is to reduce the delay experienced by the green wave in a traffic network . We propose two algorithms which based on two different baselines Adaptive Green W ave Algorithm (based on Conventional Green Wave) - PowerPoint PPT Presentation
Transcript of Adaptive Traffic Light Control For Traffic Network
Adaptive Traffic Light Control For Traffic Network
Abstract• Our objective is to reduce the delay experienced by the
green wave in a traffic network. • We propose two algorithms which based on two different
baselines– Adaptive Green Wave Algorithm (based on Conventional
Green Wave)• Adjust phase offset adaptively according to local queue
information – Predictive Algorithm (based on phase fairness)
• Introduces a predictive total waiting time as metric• Predicts the arrivals so that lights can turn green before cars arrive

Conclusion• Adaptive green wave algorithm decreaes the delay of cars in
the green wave direction (excluding cars that turn into the green wave)
• Predictive algorithm decreases the green wave delay compared to basic phase fairness, but does not create a green wave, however it improves overall system’s average delay
• What is a Conventional Green Wave?– Fixed sequence of phases to be green in one round– Fixed green length for each phase, divide the cycle time
according to the flow fraction– Consecutive traffic lights on dominant diretion has a fixed
offset
Baseline Description
Cars won’t stop if no cars waiting in the next light, if there is queue accumulating, then the flow has to be slowed down or even stopped
Problem:
Baseline Description
• What is a Phase Fairness Algorithm?– The objective is to minimize the sum of the waiting time for
each phase. A system is fair when we cannot reduce the sum of the waiting times for a phase without increasing the sum of the waiting times for a phase with a larger sum.
– Use the metric of computing the total waiting time every cycle and picks the largest one to be green next
– The vehicles in a phase with fewer vehicles may wait longer, but a single vehicle waiting at a red signal will eventually accumulate a longer delay than a larger number of vehicles in a more heavily travelled lane.
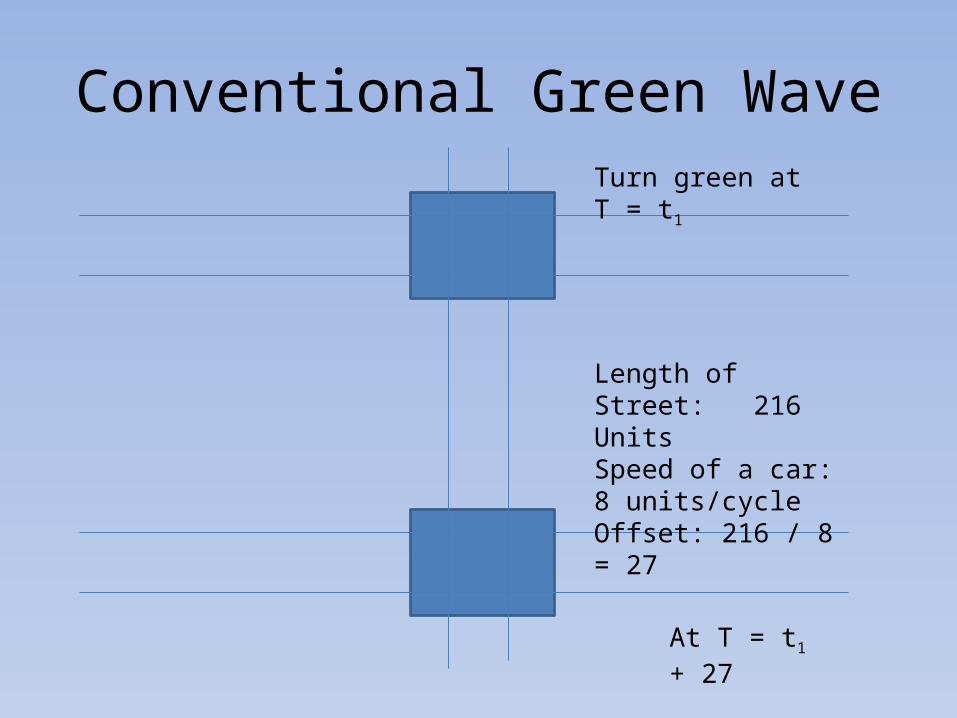
Conventional Green Wave
At T = t1 + 27
Turn green at T = t1
Length of Street: 216 UnitsSpeed of a car: 8 units/cycleOffset: 216 / 8 = 27
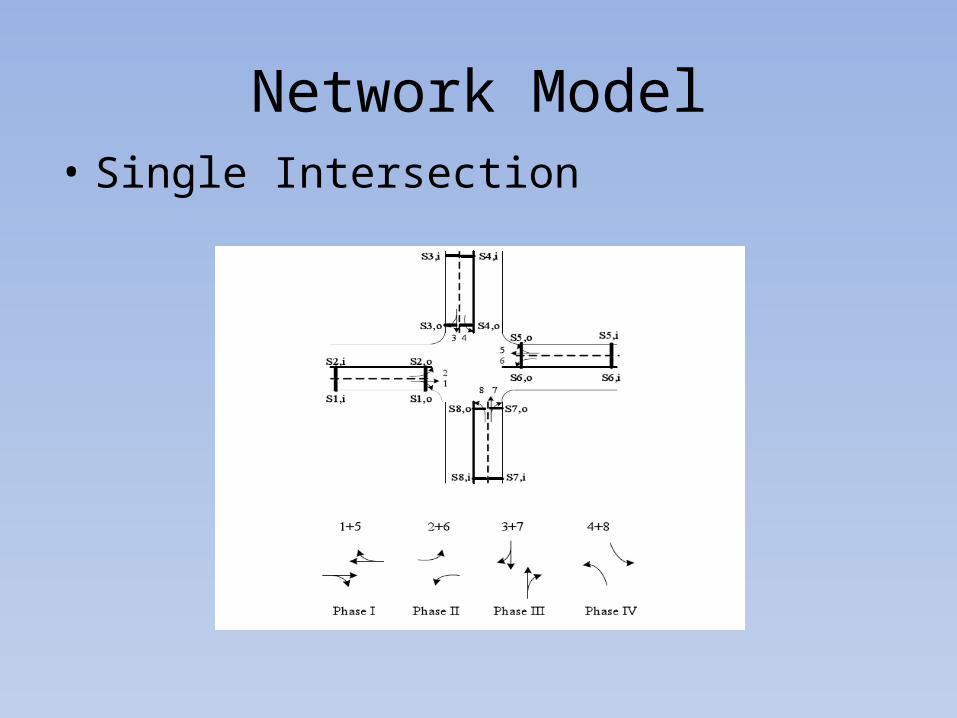
Network Model• Single Intersection
Network Model
• 10*10 Torroidal Network– Manhattan street network is torroidal in nature– Its a wrap-around system in which the cars go back from the
other side of the network when reaching the edge.– There is no edge – effect, every node is the same in the network
• Turn Ratios– Determine the traffic flows for four directions to create different
strength of green wave– If the turn ratio of other three directions is n times as the turn
ratio of green wave direction, then the flow of green wave is n times as each other three flows
Adaptive Green Wave Algorithm• Gives priority to the cars in the green wave direction.• Retrieve the time the previous intersection turned green to
adjust the timing of following light.• Offset of the green wave is shifted according to its current queue
length– Clear the queue length before the incoming traffic flow
• Fixed time allocation to green wave, and variable time allocation to other phases.– Fair allocation depends on the fraction of total waiting time for each
phase out of the all phases– The phase has largest fraction goes first– Due to satisfying the green wave always, the phase that goes last might
be punished, but it will get a higher chance to go first since it may have higher total waiting time
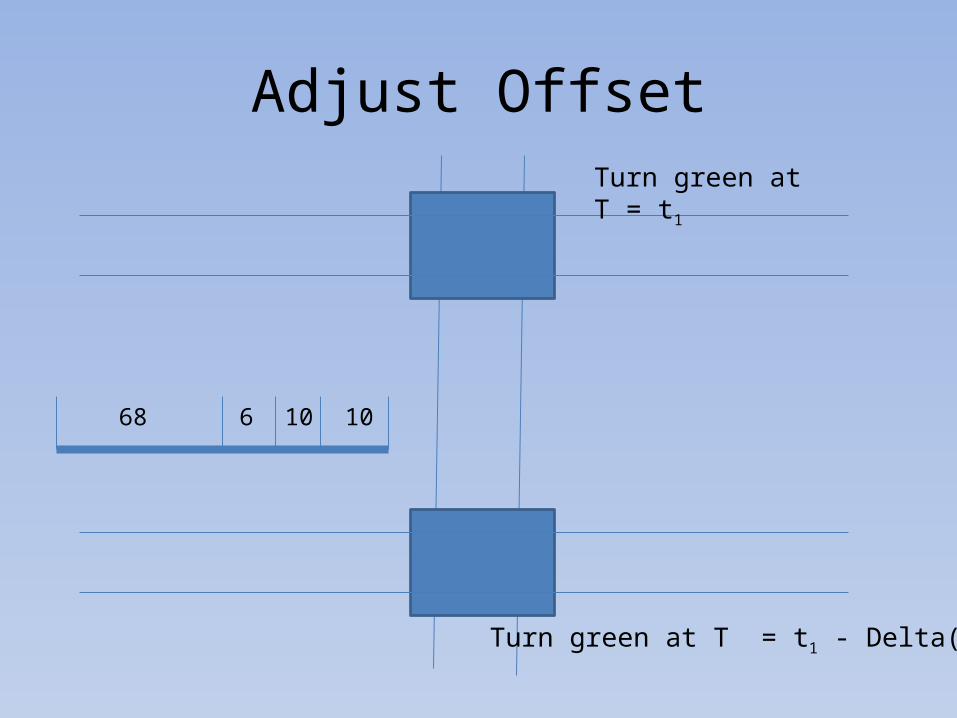
Adjust Offset
Turn green at T = t1 - Delta(t)
68 6 10 10
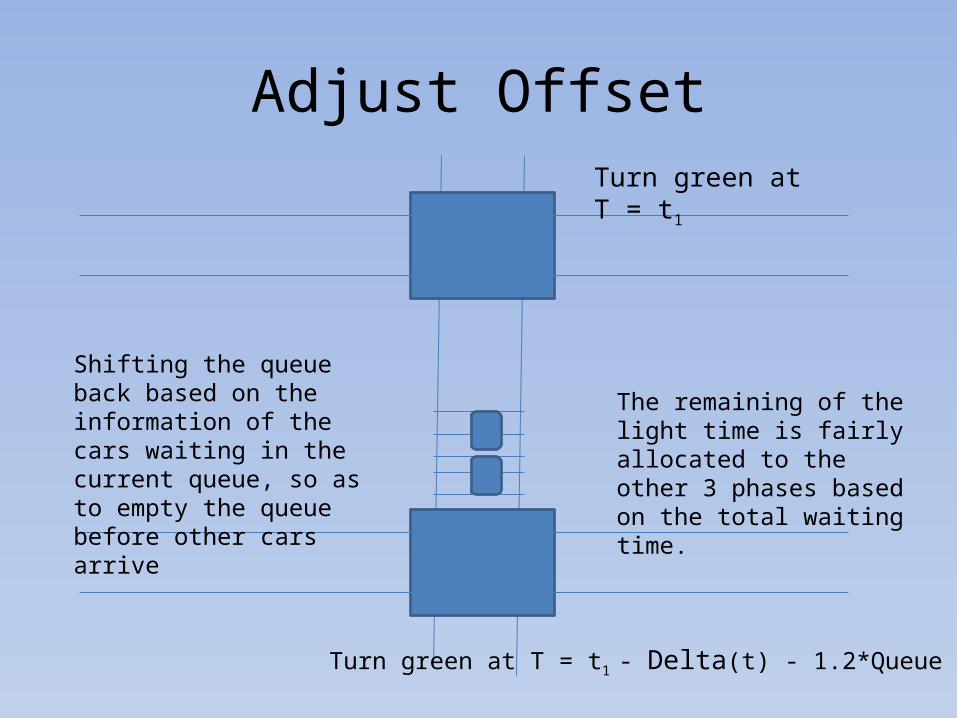
Turn green at T = t1
Adjust Offset
Turn green at T = t1 - Delta(t) - 1.2*Queue Length
Shifting the queue back based on the information of the cars waiting in the current queue, so as to empty the queue before other cars arrive
The remaining of the light time is fairly allocated to the other 3 phases based on the total waiting time.
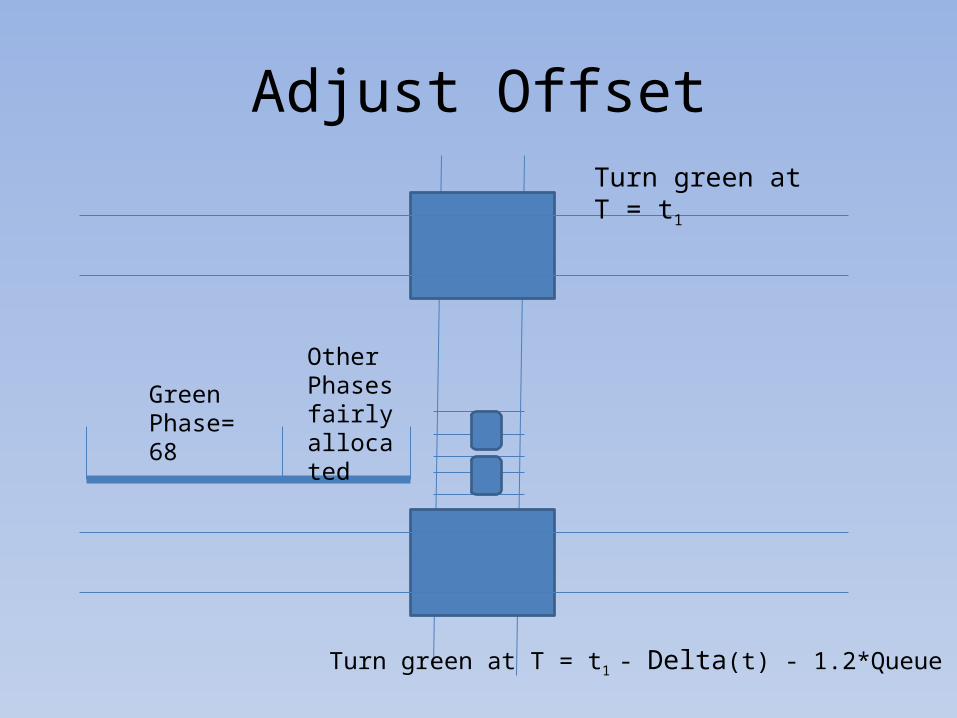
Turn green at T = t1
Adjust Offset
Green Phase=68
Other Phases fairly allocated
Turn green at T = t1
Turn green at T = t1 - Delta(t) - 1.2*Queue Length
Predictive Algorithm
• Based on the proportional fairness according to total waiting time
• Introducing a new factor, predicted waiting time, which predicts the total waiting time for each phase with following 5, 10 or 15 seconds assuming it will face red light
• The one who has the largest predictive total waiting time turns green
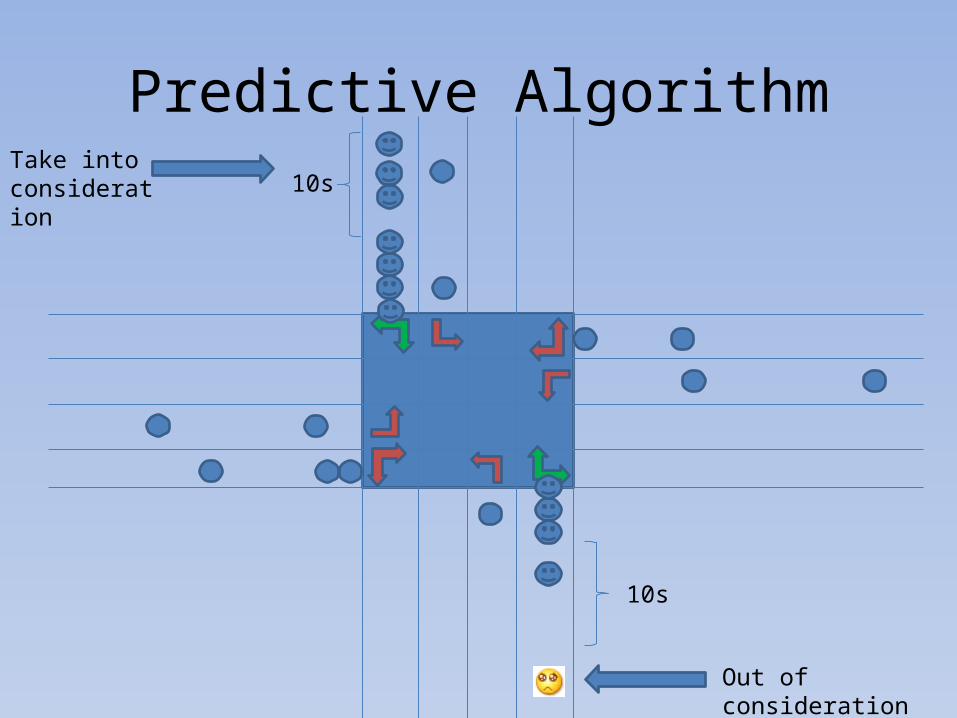
Predictive Algorithm10s
10s
Out of consideration
Take into consideration
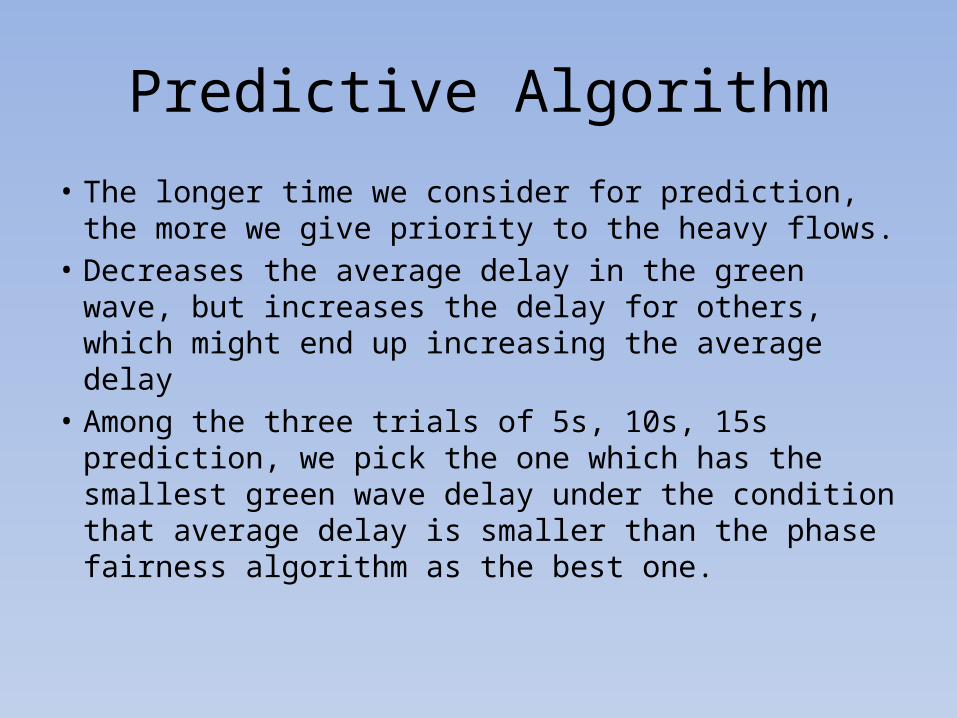
Predictive Algorithm
• The longer time we consider for prediction, the more we give priority to the heavy flows.
• Decreases the average delay in the green wave, but increases the delay for others, which might end up increasing the average delay
• Among the three trials of 5s, 10s, 15s prediction, we pick the one which has the smallest green wave delay under the condition that average delay is smaller than the phase fairness algorithm as the best one.
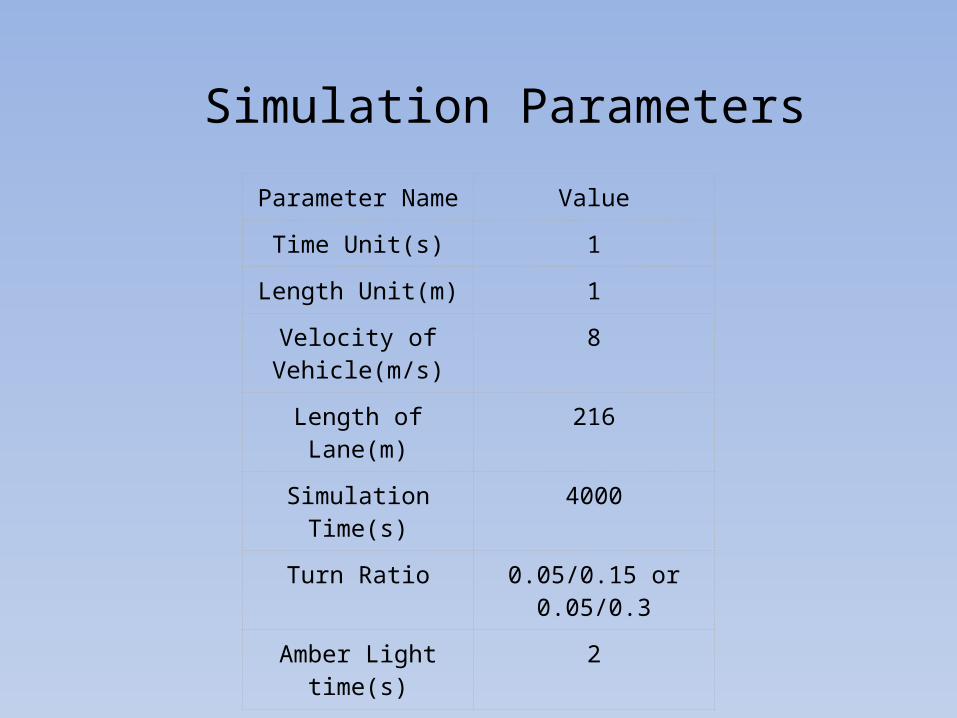
Parameter Name Value
Time Unit(s) 1
Length Unit(m) 1
Velocity of Vehicle(m/s)
8
Length of Lane(m) 216
Simulation Time(s) 4000
Turn Ratio 0.05/0.15 or 0.05/0.3
Amber Light time(s) 2
Simulation Parameters
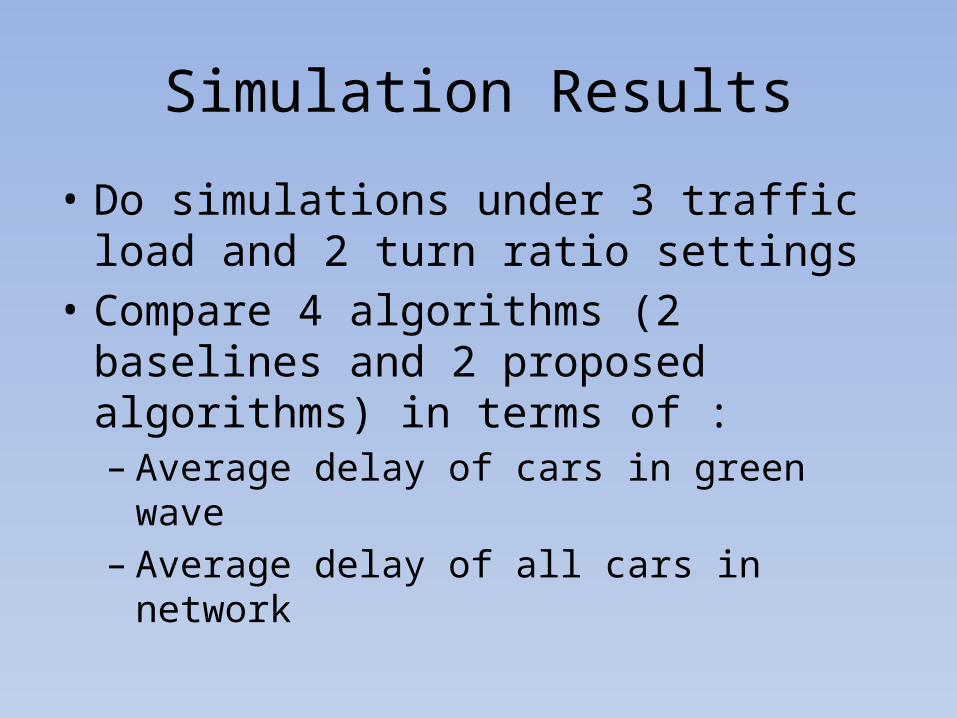
Simulation Results
• Do simulations under 3 traffic load and 2 turn ratio settings
• Compare 4 algorithms (2 baselines and 2 proposed algorithms) in terms of :– Average delay of cars in green wave– Average delay of all cars in network
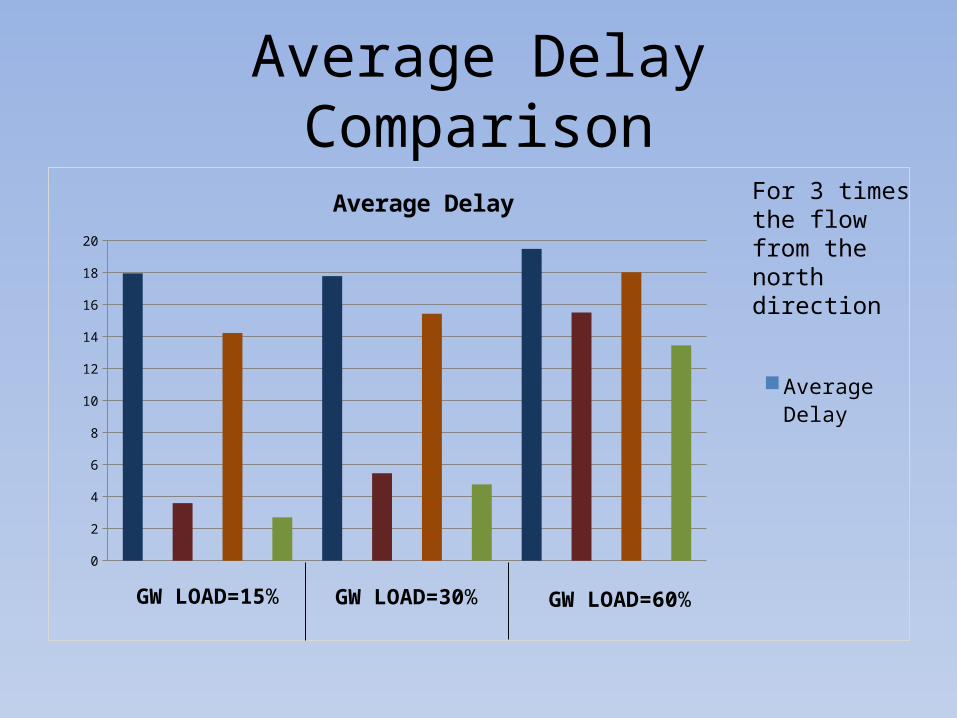
Average Delay Comparison
0
2
4
6
8
10
12
14
16
18
20
Average Delay
Average Delay
GW LOAD=30% GW LOAD=60%GW LOAD=15%
For 3 times the flow from the north direction
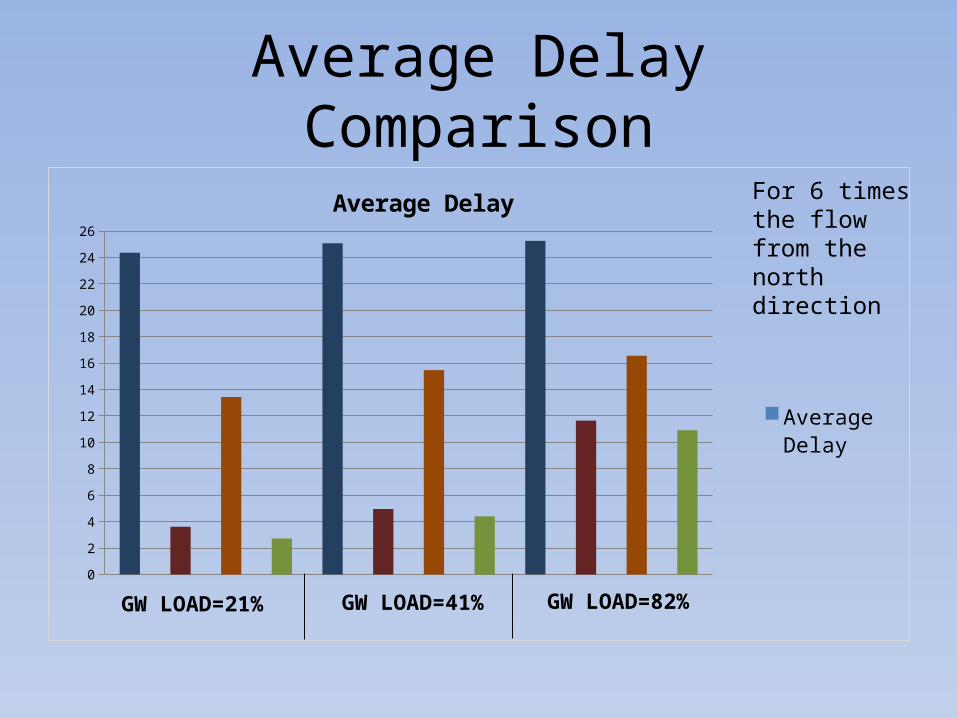
Average Delay Comparison
0
2
4
6
8
10
12
14
16
18
20
22
24
26
Average Delay
Average Delay
GW LOAD=41%
GW LOAD=82%GW LOAD=21%
For 6 times the flow from the north direction

Green Wave Delay Comparison
0
2
4
6
8
10
12
14
16
18
Green Wave Delay
GREEN WAVE DELAY
For 3 times the flow from the north direction
GW LOAD=15% GW LOAD=30% GW LOAD=60%
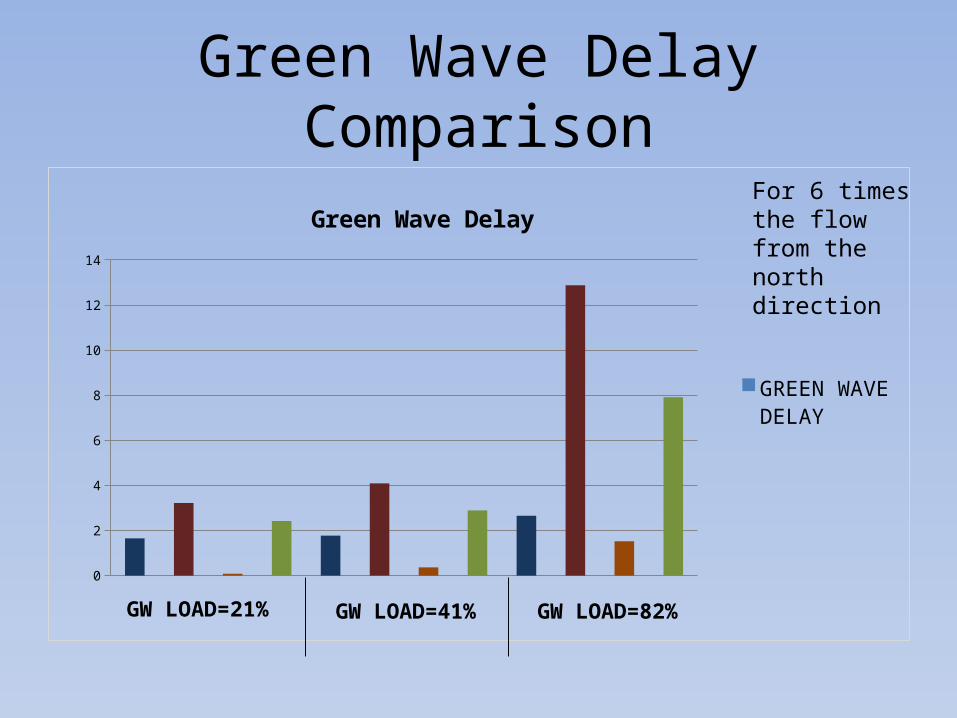
Green Wave Delay Comparison
0
2
4
6
8
10
12
14
Green Wave Delay
GREEN WAVE DELAY
GW LOAD=21%
For 6 times the flow from the north direction
GW LOAD=41% GW LOAD=82%
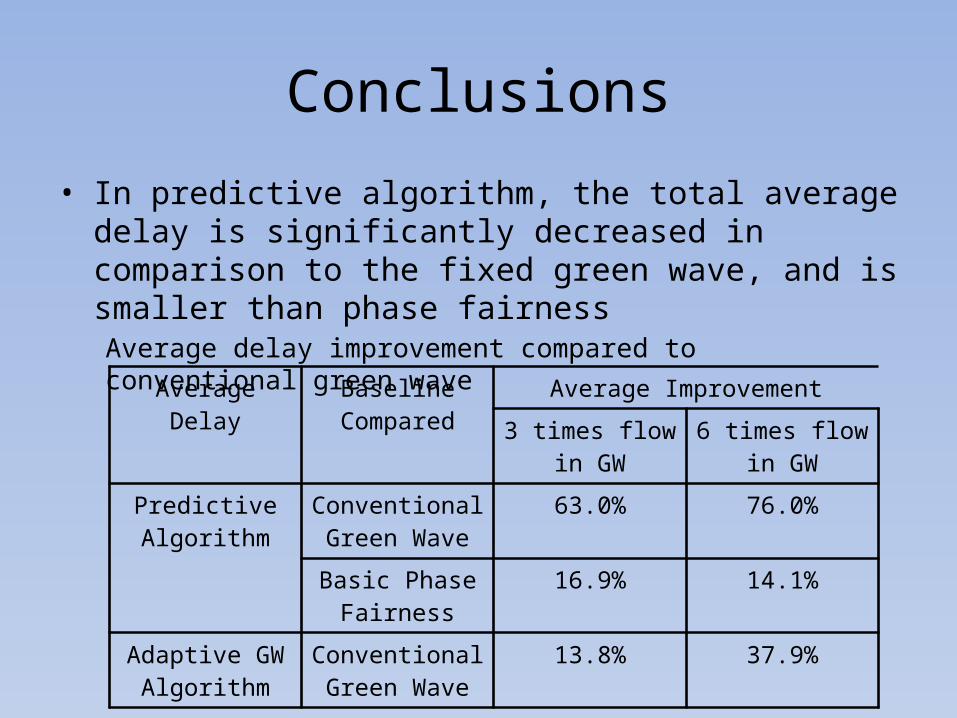
Conclusions• In predictive algorithm, the total average delay is significantly
decreased in comparison to the fixed green wave, and is smaller than phase fairnessAverage delay improvement compared to conventional green wave
Average Delay Baseline Compared
Average Improvement3 times flow in
GW6 times flow in
GWPredictive Algorithm
Conventional Green Wave
63.0% 76.0%
Basic Phase Fairness
16.9% 14.1%
Adaptive GW Algorithm
Conventional Green Wave
13.8% 37.9%
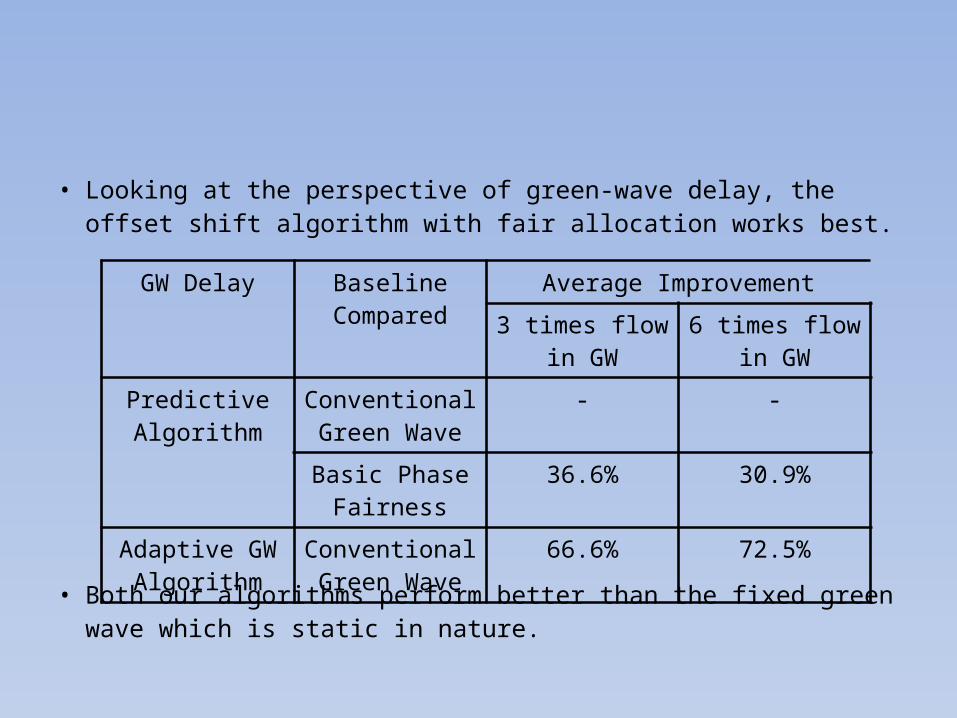
• Looking at the perspective of green-wave delay, the offset shift algorithm with fair allocation works best.
• Both our algorithms perform better than the fixed green wave which is static in nature.
GW Delay Baseline Compared
Average Improvement3 times flow in
GW6 times flow in
GWPredictive Algorithm
Conventional Green Wave
- -
Basic Phase Fairness
36.6% 30.9%
Adaptive GW Algorithm
Conventional Green Wave
66.6% 72.5%