Adaptive pitch control for ships with diesel mechanical ...
21
Delft University of Technology Adaptive pitch control for ships with diesel mechanical and hybrid propulsion Geertsma, R. D.; Visser, K.; Negenborn, R. R. DOI 10.1016/j.apenergy.2018.07.080 Publication date 2018 Document Version Final published version Published in Applied Energy Citation (APA) Geertsma, R. D., Visser, K., & Negenborn, R. R. (2018). Adaptive pitch control for ships with diesel mechanical and hybrid propulsion. Applied Energy, 228, 2490-2509. https://doi.org/10.1016/j.apenergy.2018.07.080 Important note To cite this publication, please use the final published version (if applicable). Please check the document version above. Copyright Other than for strictly personal use, it is not permitted to download, forward or distribute the text or part of it, without the consent of the author(s) and/or copyright holder(s), unless the work is under an open content license such as Creative Commons. Takedown policy Please contact us and provide details if you believe this document breaches copyrights. We will remove access to the work immediately and investigate your claim. This work is downloaded from Delft University of Technology. For technical reasons the number of authors shown on this cover page is limited to a maximum of 10.
Transcript of Adaptive pitch control for ships with diesel mechanical ...

Delft University of Technology
Adaptive pitch control for ships with diesel mechanical and hybrid propulsion
Geertsma, R. D.; Visser, K.; Negenborn, R. R.
DOI10.1016/j.apenergy.2018.07.080Publication date2018Document VersionFinal published versionPublished inApplied Energy
Citation (APA)Geertsma, R. D., Visser, K., & Negenborn, R. R. (2018). Adaptive pitch control for ships with dieselmechanical and hybrid propulsion. Applied Energy, 228, 2490-2509.https://doi.org/10.1016/j.apenergy.2018.07.080
Important noteTo cite this publication, please use the final published version (if applicable).Please check the document version above.
CopyrightOther than for strictly personal use, it is not permitted to download, forward or distribute the text or part of it, without the consentof the author(s) and/or copyright holder(s), unless the work is under an open content license such as Creative Commons.
Takedown policyPlease contact us and provide details if you believe this document breaches copyrights.We will remove access to the work immediately and investigate your claim.
This work is downloaded from Delft University of Technology.For technical reasons the number of authors shown on this cover page is limited to a maximum of 10.

Contents lists available at ScienceDirect
Applied Energy
journal homepage: www.elsevier.com/locate/apenergy
Adaptive pitch control for ships with diesel mechanical and hybridpropulsion
R.D. Geertsmaa,b,⁎, K. Vissera,b, R.R. Negenborna
a Department of Maritime & Transport Technology, Delft University of Technology, The Netherlandsb Faculty of Military Sciences, Netherlands Defence Academy, The Netherlands
H I G H L I G H T S
• A novel adaptive pitch control strategy is proposed.
• Fuel consumption, CO2, NOx and PM emissions are reduced.
• Improved acceleration and consistently limited thermal loading is demonstrated.
• The approach can save 5–15% fuel and emissions and reduce acceleration time by 30%.
• No more operator input is required to switch between fast and efficient sailing.
A R T I C L E I N F O
Keywords:Mechanical propulsionNon-linear control systemsMarine systemsModelling and simulationEmission reductionAutonomous systems
A B S T R A C T
Shipping urgently needs to reduce its impact on the environment, both due to CO2, NOx and particulate matter(PM) emissions and due to underwater noise. On the other hand, multifunction ships such as offshore supportvessels, anchor handling and towing vessels, naval vessels and wind farm construction and support vesselsrequire fast and accurate manoeuvring and need highly reliable systems to support reduced or no crew. Dieselmechanical propulsion with controllable pitch propellers provides high efficiency and low CO2 emissions, buthas traditionally been poor in manoeuvrability, can suffer from thermal overloading due to manoeuvring andrequires significant measures to meet NOx and PM emission regulations. The control strategy of diesel me-chanical propulsion with fixed combinator curves is one of the causes of the poor manoeuvrability, thermaloverloading and cavitation noise during manoeuvring, such as slam start and intermediate acceleration man-oeuvres. This paper proposes an adaptive pitch control strategy with slow integrating speed control that reducesfuel consumption, CO2, NOx and PM emissions and underwater noise, improves acceleration performance, limitsengine loading and prevents engine under- and overspeed. A simulation study with a validated model of a casestudy Holland class Patrol Vessel demonstrates 5–15% reduction in fuel consumption and CO2 emissions, com-pared to the baseline transit control mode in the ship speed range from 6 to 15 kts, during constant speed sailing.Moreover, the adaptive pitch control strategy reduces acceleration time from 0 to 15 kts with the slam startprocedure by 32% compared to the baseline manoeuvre control mode and by 84% for an intermediate accel-eration from 10 to 15 kts, while preventing thermal overloading of the engine, during straight line manoeuvres.Combining this control strategy with hybrid propulsion, running an electric drive in parallel with the propulsiondiesel engine, can potentially further reduce fuel consumption at low speeds while also improving accelerationperformance even more. Therefore, hybrid propulsion plants with controllable pitch propellers and adaptivepitch control can provide a significant contribution to the urgent reduction of environmental impact of shippingand to the need for more autonomous and reliable ship systems.
1. Introduction
The United Nations emissions gap report [1] identifies an urgentneed to increase the reduction in CO2 emissions across the globe to
meet the goals of the Paris Agreement. Thus, the 72nd Marine En-vironmental Protection Committee meeting of the International Mar-itime Organisation (IMO) agreed to ‘reduce total annual global shippingemissions by 50% over 2008 by 2050’, in its initial strategy on greenhouse
https://doi.org/10.1016/j.apenergy.2018.07.080Received 19 April 2018; Received in revised form 26 June 2018; Accepted 14 July 2018
⁎ Corresponding author at: Delft University of Technology, Faculty of 3ME, Building 34, Mekelweg 2, 2628CD Delft, The Netherlands.E-mail address: [email protected] (R.D. Geertsma).
Applied Energy 228 (2018) 2490–2509
0306-2619/ © 2018 The Authors. Published by Elsevier Ltd. This is an open access article under the CC BY license (http://creativecommons.org/licenses/BY/4.0/).
T

gas emissions reduction for ships [2]. While improved planning of vesseloperations [3,4], either with manned or autonomous vessels [5,6], andimproved route planning [7], taking into account weather and loadingconditions [8–10] can all help reduce emissions, single ships also needto reduce their emissions for a given operating profile with advances inpower and propulsion systems [11]. Economic studies suggest that, inshipping, the transition to alternative fuels, such as LNG, bio-methanolor synthetic fuels, will be gradual and that diesel engines will continueto provide most propulsion and electric power over the next decades[12]. Therefore, increasing efficiency of diesel mechanical and hybridpropulsion is even more important.
According to estimates in the UN emission gap report, shipping cancontribute 0.7 GtCO2 emission reduction by increasing its efficiency[1]. Brynolf et al. [13] provide estimates of the energy efficiency im-provement potential of various design and operation aspects. While thesavings potential of most design aspects, such as waste heat recovery[14–18], hull coatings and lubrications, hybrid power supply [19–21]and hull design have been quantified in [13,22], the savings potential ofengine-propeller interaction is qualified as significant, but not yet
quantified [23]. Geertsma et al. [24] quantify a savings potential forpitch control of up to 30% at certain speeds and operating modes forvessels with diesel mechanical propulsion and high manoeuvrabilityrequirements, at the expense of slow acceleration and increased enginethermal loading. How these fuel savings can be achieved while alsoaccelerating fast and limiting engine thermal loading has so far notbeen addressed.
1.1. Literature review
The most applied control strategy for pitch control is the use of afixed relationship between the setpoint: lever position or virtual shaftspeed; and the control actions: propeller pitch ratio and engine speed[25–27,21]. The optimum propeller pitch ratio and gearbox ratio isthen determined for the design point of the propulsion plant, accordingto the matching procedure proposed in [28] or, alternatively, in[29].Vrijdag et al. [30] conclude that one combinator curve cannotachieve optimal cavitation performance while maintaining engineloading limitations across all operating conditions, due to variations in
Nomenclature
Greek Symbols
αeff effective angle of attack in degαi shock free entry angle onto the leading edge of the pro-
peller profile in degαwk angle of the vertical wave movement at the propeller
centre in radβ hydrodynamic pitch angle in radλ air excess ratioωwv wave radial frequency in rad/sρsw density of seawater in kg/m3
σf stoichiometric air fuel ratio of the fuelσn cavitation numberθ pitch angle in radθred pitch angle reduction in radζ significant wave amplitude in m
Roman Symbols
c1 Vrijdag coefficient to calibrate the effective angle of attackDp propeller diameter in mfw wake fractiong standard gravity in m/s2
igb gearbox reduction ratioKI reset rateKQ propeller torque coefficientkw wave number in 1/mm1 trapped mass at the start of compression in kgMe engine torque in Nmmf fuel injection per cylinder per cycle in kgMp propeller torque in Nmne engine speed in Hznp shaft speed in Hznvirt virtual shaft speed in Hzp1 charge air pressure in Pap6 average pressure in the cylinder during exhaust opening in
Pa
∞p ambient water pressure at the center-line of the propellerin Pa
pv vapour pressure of water at ambient temperature in Papd pressure in the exhaust receiver in PaPos overspeed limitation gain
Ppd,0 pitch ratio at which zero thrust is achievedPpd propeller pitch ratioPus under-speed limitation gainQp open water propeller torque in kNmq23 specific heat release at constant volume in kJ/kgq34 specific heat release at constant pressure in kJ/kgq45 specific heat release at constant temperature in kJ/kgRa gas constant of air in J/kgKRv ship resistance in NRX,cav fuel increase rate limitation to prevent cavitationRX,therm fuel increase rate limitation to prevent thermal over-
loadingT1 temperature at the start of compression in KT6 average temperature in the cylinder during exhaust
opening in KTp propeller thrust in NV1 cylinder volume at the start of compression in m3
va advance speed of water into the propeller in m/svs ship speed in m/svw wakefield disturbance due to waves in m/swi specific indicated work during the Seiliger cycle in kNm/
kgXI fuel injection setpoint from integrating speed control in %XPI fuel injection setpoint from fast PI speed control in %X λlim, fuel injection limitation to limit air excess ratio λ in % of
nominalXset fuel injection setpoint in % of nominal fuel injectionz water depth in m at propeller center
Superscripts
∗ normalised relative to nominal value
Subscripts
ic slow integrating speed controlmax maximummins minimum speed setpointmin minimumos overspeedset setpointmax maximum valuenom nominal value
R.D. Geertsma et al. Applied Energy 228 (2018) 2490–2509
2491

weather, ship loading and hull fouling. Therefore, Vrijdag et al. [31]propose a control strategy that maintains an optimum inflow angle ofthe water onto the propeller blade, angle of attack, in the pitch controlregion of the combinator, and demonstrates the feasibility of this ap-proach in sea trials. The sea trials, in combination with simulationstudies, also demonstrate that the engines are not thermally overloadedand acceleration performance improves significantly [32–34]. The im-pact on fuel consumption of the ship and the influence of the primaryengine speed control strategy on system dynamics were not addressed.
While engine speed control is used as a standard for propulsionengines due to its robust control and under- and overspeed protection[21], speed control does lead to significant and potentially damagingload disturbances in waves [35–39]. Alternative speed control strate-gies, such as ∞H state feedback control [40], optimal speed feedbackusing speed signal amplification [39], multivariable adaptive extremumengine control [41] and Multiple Input and Multiple Output (MIMO)optimal speed and pitch ∞H control [38], can all reduce the load fluc-tuation, but still aim to reject disturbance of engine speed due to waveswith fuel injection control action. While a multivariable control schemeutilising a variable geometry turbocharger can improve manoeuvr-ability while maintaining smoke emission constraints, as proposed in[42], this requires a diesel engine with variable geometry turbocharger.Similarly, adaptive feedforward control of exhaust gas recirculation canreduce emissions in large diesel engines, but only if equipped withexhaust gas recirculation [43].
Alternatively, Sorensen and Smogelli [44] found that, for electricpropulsion, primary control based on torque, power or combinedtorque-and-power control all gave less thrust, torque and power var-iance in waves than speed control, while accurately following thrustcommands. While a slight increase in shaft speed fluctuation was ob-served, the stable nature of the propulsion system ensured shaft speedoscillations remained acceptable. For extreme situations, such as pro-peller emergence, thrust loss estimation and anti-spin thruster controlcan be added to prevent overspeed and thrust loss [45–47]. Similarly,Coraddu et al. [23] demonstrated with both simulation model experi-ments and free running model tests that torque and power control leadsto lower load fluctuation in turns. Moreover, Blanke et al. [48] de-monstrated in a tow-tank test environment that the propeller efficiencyin moderate waves increases with up to 2% for torque control comparedto speed control, due to the variation in advance speed from waves.Similarly, torque or power control for propulsion diesel engines hasbeen reported by [35,49,50]. Both Faber [35] and Blanke and Nielsen[49] discuss how power control can lead to reduced loading andthermal fluctuations on propulsion diesel engines, but neither quantifythe variance reduction or demonstrate the feasibility. Geertsma et al.[50] propose torque control and demonstrate torque control can elim-inate thermal loading fluctuation due to waves and significantly reducecylinder peak temperatures. However, practical feasibility and im-plementation with pitch control were not addressed.
1.2. Aim and contribution
While shipping urgently has to reduce its environmental impact dueto emissions and underwater noise, many ship types, such as offshorevessels, interterminal transport vessels, windturbine construction andsupport vessels, ferries, and naval vessels also require fast and accuratemanoeuvring and reduced maintenance to support reduced main-tenance and autonomous shipping [5,51]. This study investigates howmuch fuel consumption and emissions can be reduced with the noveladaptive pitch control strategy, while also improving straight line man-oeuvring performance and limiting engine thermal loading. Moreover,settings for this control strategy are proposed that minimise risk ofpropeller cavitation.
The novelty of this work is threefold: First, we propose a noveladaptive pitch control strategy for diesel mechanical and hybrid pro-pulsion with controllable pitch propellers, which combines the angle of
attack approach for propeller pitch control [31] with slow integratingspeed control for diesel engine fuel injection. Secondly, we demonstratehow this approach can be used in a control strategy that works acrossthe speed range of the ship to reduce fuel consumption and CO2
emissions and increase acceleration performance, while consistentlylimiting engine thermal loading. Finally, we quantify performance im-provement with the proposed control strategy for a case study patrolvessel compared to the current baseline control strategy.
1.3. Outline
The paper is organised as follows: in Section 2, we describe thediesel mechanical propulsion system with controllable pitch propellerof the case study Patrol Vessel, its modelling and model validation; inSection 3, we introduce the proposed control strategy and establish itssettings; in Section 4, we evaluate the control strategy and compare itsperformance with the baseline control strategy of the case study PatrolVessel; and finally, in Section 5, we present the main conclusions anddiscuss recommendations for further work.
2. System description
Diesel mechanical or hybrid propulsion with controllable pitchpropellers typically consists of two shafts with controllable pitch pro-pellers, a gearbox, and one or multiple diesel engines per shaft, as il-lustrated in Fig. 1. The two shafts with controllable pitch propellersprovide redundancy and manoeuvrability. The gearbox is required toreduce engine speed to the lower propeller speed, as we do not considerlarge transport ships with slow speed two stroke engines. This config-uration is typical for the multifunction ships that require silent, man-oeuvrable, highly reliable and low emission propulsion.
2.1. Propulsion system model
Propulsion system performance is investigated using the modular,hierarchical and causal propulsion system model proposed and vali-dated in [24]. The diesel mechanical propulsion system model is illu-strated schematically in Fig. 3. In the modular, hierarchical and causalmodelling paradigm proposed in [52], the direction of the arrows il-lustrates the causality of the coupled effort and flow variables. Thetorque Me from the diesel engine model drives gearbox and shaftlinedynamics, resulting in engine speed ne in Hz. Subsequently, shaft speednp determines propeller torque Mp of the propeller model, and propellerthrust Tp drives ship speed vs in m/s through the hull dynamics. Wavesact as a disturbance on the propeller with wave orbital speed vw andadded resistance in the resistance function R v( )v s . The fuel injectionsetpoint Xset in % and pitch ratio setpoint Pp,set act as control actions onthe system, while the operator provides the control reference virtualshaft speed nvirt in rps. This virtual shaft speed is the fictive shaft speedthat results from the product of propeller pitch ratio Pp and shaft speednp, as follows:
(1)
(2)
(4)
Legend:(1) Diesel engine(2) Gearbox(3) Sha(4) Controllable pitch propeller(5) Hull(6) Waves and wind
(1)
(2)
(4)
(3)
(3)
(5)
(6)
Fig. 1. Typical mechanical propulsion system layout for a ship, from [50].
R.D. Geertsma et al. Applied Energy 228 (2018) 2490–2509
2492

=−
−n tP t P
PP n( )
( ),tvirt
pd pd,0
pd,nompd,0 p( )
(1)
where Ppd0 is the pitch ratio at which zero thrust is achieved and Ppd,nomis the nominal pitch ratio.
For the complete description of the model we refer to [24]. Thewave model was improved to include the state wakefield disturbancedue to waves vw in m/s and better represent the dynamic behaviour ofwaves as a function of ship speed vs in m/s and wave radial frequencyωwv in rad/s. In this section, we will summarise the model and its sub-models and discuss the wave model improvement to this model.
2.1.1. Diesel engineThe diesel engine model is a mean value first principle model with
state variables fuel injection per cylinder per cycle mf in kg, charge airpressure p1 in Pa and pressure in the exhaust receiver pd in Pa. Themodel assumes an ideal gas, perfect scavenging, the six point Seiligercycle, Büchi power and flow balance between compressor and turbine,Zinner blowdown for the temperature in the exhaust receiver andisentropic expansion with heat loss in the turbocharger. The model thusconsists of a system of differential and algebraic equations with threestate variables, control action fuel injection setpoint Xset in %, inputengine speed ne in Hz and output engine torque Me in kNm, and isdescribed in detail in [24].
This mean value first principle model accurately represents meanvalues of engine efficiencies, temperatures, cylinder and scavengingflows and turbocharger pressures, based on calibration with FAT re-sults. The model does not accurately capture all physical mechanisms,such as the turbocharger equation of motion and the gas exchangemechanism [53], as the models using compressor and turbine maps in[54–56]. This results in a significant reduction in simulation time togenerate the performance map, shown in Fig. 9, from hours with the
model in [56] to 23 s with this model. This reduced simulation timeallows investigating hull-propeller-engine interaction shown in Fig. 4,and the benchmark manoeuvres proposed in [24]. Moreover, the modeldoes not capture crank angle dynamics as in [57,58], combustion dy-namics as in [59,60], or fluid dynamics as in [61]. For a short review ofdiesel engine models, we refer to [24].
The schematic presentation in Fig. 4 provides the interaction be-tween the engine model subsystems and the governing equations asdescribed in [24]. The summarising equations are as follows:
=dm tdt
f X t m t( ) ( ( ), ( ))f1 set f (2)
=m t f m t p t n t( ) ( ( ), ( ), ( ))1 2 f 1 e (3)
=λ t f m t p t n t( ) ( ( ), ( ), ( ))3 f 1 e (4)
=q t f m t m t n t( ) ( ( ), ( ), ( ))23 4 f 1 e (5)
=q t f m t m t n t( ) ( ( ), ( ), ( ))34 5 f 1 e (6)
=q t f m t m t n t( ) ( ( ), ( ), ( ))45 6 f 1 e (7)
=T t f m t m t q t q t q t( ) ( ( ), ( ), ( ), ( ), ( ))6 7 f 1 23 34 45 (8)
=p t f m t m t q t q t q t( ) ( ( ), ( ), ( ), ( ), ( ))6 8 f 1 23 34 45 (9)
=w t f m t m t q t q t q t( ) ( ( ), ( ), ( ), ( ), ( ))i 9 f 1 23 34 45 (10)
=dp t
dtf m t m t T t p t
( )( ( ), ( ), ( ), ( ))d
10 f 1 6 6 (11)
=dp t
dtf m t m t T t p t
( )( ( ), ( ), ( ), ( ))d
111 f 1 6 (12)
=M t f w t m t n t( ) ( ( ), ( ), ( )),e 12 i 1 e (13)
where m1 is the trapped mass at the start of compression in kg, λ is theair excess ratio, q23 is the specific heat release at constant volume in kJ/kg, from state 2 to state 3 of the Seiliger cycle, q34 is the specific heatrelease at constant pressure in kJ/kg, from state 3 to state 4 of theSeiliger cycle, q45 is the specific heat release at constant temperature inkJ/kg, from state 4 to state 5 of the Seiliger cycle, T6 and p6 are theaverage temperature and pressure in the cylinder during exhaustopening in K and Pa, at state 6 of the Seiliger cycle, and wi is the specificindicated work during the complete Seiliger cycle in kNm/kg.
2.1.2. Gearbox and shaft-lineThe gearbox and shaft-line model consists of the equation of motion
for shaft-line dynamics, assuming rigid coupling between the engine,gearbox, shaft-line and propeller, a linear torque loss model based on[62] and constant relative shaft-line losses. This model thus consists of asystem of differential and algebraic equations with as inputs engine andpropeller torque Me and Mp in kNm, as state variable shaft speed np in
Fig. 2. HNLMS Holland.
Diesel engine
Gearbox and
sha line
Me
Propeller
Hull
Diesel engine
Gearbox and
sha line
Me
Propeller
np
np
Mp
ne
ne
Mp
Tp
Tp
Waves
Rs
vw
vw
vs
vs
Control ac ons
Xset
Xset
Ppd,setSpeed setpoint
nvirt
vs
Fig. 3. Schematic presentation of direct drive propulsion system for navalvessel showing causal coupling between models.
Me
p1
wi
p6
T6
ne
q45
q34
q23Xset
p1
m1
mf
Air excess
ra o, AE (3)-(4)
Fuel pump,DAE (2) Heat
release, AE
(5)-(7)
Seiliger cycle, AE(8)-(10)
m1, mf
Exhaust receiver and
turbocharger, DAE
(11)-(12)
m1, mf
Mechanical conversion
AE (13)m1, ne
Fig. 4. Schematic presentation of the diesel engine model and the interactionbetween its subsystems, consisting of Algebraic Equations (AE) or Differentialand Algebraic Equations (DAE).
R.D. Geertsma et al. Applied Energy 228 (2018) 2490–2509
2493

Hz and as outputs shaft propeller speed and engine speed np and ne inHz [24]. The summarising equation is as follows:
=dn t
dtf M t M t
( )( ( ), ( )).p
13 e p (14)
2.1.3. PropellerThe propeller model uses the well-established open water test re-
sults and in particular the Wageningen C-series for Controllable PitchPropellers [63,64]. For the pitch actuation system the model assumes alinear first order transfer function with a fixed time constant τP to re-present the time delay between changing the pitch setpoint and theactual movement of the pitch [24,65–67,27]. Thus, the propeller modelconsists of a system of differential and algebraic equations with statevariable propeller pitch ratio Ppd, control action propeller pitch ratiosetpoint Ppd,set, input variables propeller speed np in Hz, ship speed vs inm/s and wave orbital speed vw in m/s, and output variables propellertorque Mp in kNm and propeller thrust Tp in kN, represented by thefollowing summarising equations:
=dP t
dtf P t P t
( )( ( ), ( ))pd
14 pd pdset (15)
=M f P t n t v t v t( ( ), ( ), ( ), ( ))p 15 pd p s w (16)
=T f P t n t v t v t( ( ), ( ), ( ), ( )).p 16 pd p s w (17)
2.1.4. HullThe hull model represents ship motion in surge direction, as surge is
most relevant for engine loading and loading effects due to turning canbe represented as a disturbance after establishing its magnitude with 6degrees of freedom models [68,27] or by applying a wake fractionvariation δw, as proposed in [23]. The size of these wake variations canthen be estimated based on the general trends reported in [23], al-though in this work we only consider straight line acceleration. Themodel represents the equation of motion with a system of differentialand algebraic equations, including state variable ship speed vs, inputvariables ship resistance R v( )s in kN and propeller thrust Tp in kN, andoutput variable ship speed vs in m/s. The summarising equation is asfollows [24]:
=dv tdt
f R v t T t( ) ( ( ( )), ( )).s17 s p (18)
2.1.5. WavesThe wave model takes two disturbances into account: the added
resistance due to sea state, wind speed, fouling and displacement andthe disturbance on the average speed of the water entering the propeller[24]. Additional effects, such as variances in the mean wake speed as aresult of the pitching motion of the ship [69] or oblique inflow into thepropeller [70] are neglected. The main cause of the disturbance onengine loading is the fluctuating wake speed of the water flowing intothe propeller, as previously discussed in [50]. The orbital movement ofwater causes a disturbance on the average speed of the water enteringthe propeller, an exponential distribution of water speed along thedepth of the propeller and an oblique inflow. In this study, we are in-terested in the significant disturbance of the wave orbital movement onthe propeller loading, due to the significant wave height. We thereforeconsider the wake speed relative to the propeller center vw in m/s, asfollows [71,72]:
=v t ζω e α t( ) cos( ( ))k zw wv wkw (19)
= +dα tdt
k v t ω( ) ( )wkw s wv (20)
=kω
g,w
wv2
(21)
where ζ is the significant wave amplitude in m, ωwv is the wave radialfrequency in rad/s, kw is the wave number in 1/m, z is the water depthin m at the propeller center, αwk is the angle of the vertical wavemovement at the propeller centre in rad, and g is the standard gravity inm/s2.
The resulting model consists of a system of differential and algebraicequations with state variable angle of the vertical wave movement αwk,input ship speed vs in m/s, and output wake speed disturbance due towaves vwk in m/s. The summarising equations are as follows:
=dα tdt
f α t v t( ) ( ( ), ( ))wk18 wk s (22)
=v f t α t( )( ( )).wk 19 wk (23)
2.2. Baseline conventional control
The baseline conventional control strategy using two fixed combi-nator curves, rate limitations for acceleration and deceleration, and apitch reduction strategy to prevent thermal overloading of the engine isdescribed in [24]. The schematic representation of this control strategyis illustrated in Fig. 5 and the combinator curves for the case studypatrol vessel are illustrated in Fig. 6. The transit mode aims to provide‘high propulsion efficiency within engine overloading limitations indesign conditions’ and the manoeuvring mode aims to provide ‘highmanoeuvrability within engine overloading limitations in design con-ditions’ [24].
The control objectives and the tuning of the baseline conventionalcontrol strategy have been described in [73] and the resulting para-meters are described and listed in [24]. In summary, the tuning pro-cedure has led to conservative settings, in order to prevent overloadingin the worst possible operating conditions. While the risk of thermaloverloading has been eliminated, this might lead to reduced perfor-mance on Measures of Effectiveness [74] manoeuvrability, cavitationnoise and fuel consumption. Ref. [24] concluded that the two operatingmodes led to very significant differences in performance: the transitmode reduces fuel consumption by up to 30% at 7 kts ship speed, re-duces engine thermal loading by 90 K and reduces the risk of cavitation,
neXact
Xset
Xlim
ne
Pset
Xlimne
P1
nref
Pref
Lsetnvirt
Virtual shaspeed se ng
Legend:nvirt virtual sha speedLset lever setpointPref pitch referencenref speed referencePrate pitch change ratePset pitch setpointXset fuel injec on setpointXact actual fuel injec onXlim fuel injec on limita on
Lever setpoint
and limita on
Combinator curve
Figure 6
Fuel limita on %
Fuel injec on margin
Xmar
Pitch reduc on
PID speed control
ne
P1Fuel
limita on %
Fig. 5. Schematic representation of baseline control strategy for diesel me-chanical propulsion with CPP.
R.D. Geertsma et al. Applied Energy 228 (2018) 2490–2509
2494

while the manoeuvring mode reduces acceleration time from 0 to 15 ktsby 41% compared to the transit mode.
2.3. Model validation
This model was validated with a case study Patrol Vessel, shown inFig. 2, as described extensively in [24]. The diesel engine model(2)–(13) has been validated with Factory Acceptance Test measure-ments of the main diesel engines and the integrated propulsion systemmodel consisting of (2)–(13), (14), (15)–(17), ()(18)–(21), with SeaAcceptance Trial measurements of the case study Holland-class PatrolVessel, shown in Fig. 2. The model validation used the baseline con-ventional control strategy of the actual vessel described in Section 2.2.The parameters used for the model and the baseline control strategy arealso described in detail in [24]. The validation demonstrates that ‘thepropulsion system model credibly predicts propulsion system behaviourwithin 5% accuracy’ [24]. Moreover, the comparison of the modelperformance in waves with measurements on a Doorman class frigate asreported in [24], demonstrates the size and orientation of the ellipses inwaves of sea state 6, which can also be observed for sea state 4 inFig. 22, is representative for the effect in real waves, although quanti-fication is not possible, as the exact wave height was not measuredduring the measurements at sea.
3. Adaptive pitch control strategy
The adaptive pitch control strategy aims to achieve many controlobjectives with essentially the same control actions as the baseline pitchcontrol strategy. These control actions are propeller pitch ratio setpointand fuel pump injection setpoint: =u t P X( ) [ , ]p,set set . While the baselinecontrol strategy uses measured system outputs propeller pitch ratio Ppand engine speed ne, the adaptive pitch control strategy additionallyuses the estimated hydrodynamic pitch angle: =z t P n β( ) [ , , ]p e . Thecomparison of the simplified representation of both feedback controlstrategies is presented in Fig. 7. The following section extensively dis-cusses the control objectives and how the proposed adaptive pitchcontrol strategy achieves highly improved and near optimal perfor-mance for these objectives, within the physical limitations of the pro-pulsion system components.
3.1. Control objectives
The control objective for the adaptive pitch control strategy is to
optimise for the Measures of Effectiveness (MOEs) fuel consumption,manoeuvrability, engine thermal loading and, in some cases, cavitationnoise, while providing the requested virtual shaft speed. In order toquantify the performance against these MOEs, we use the Measures ofPerformance (MOPs) [74] proposed in [24]. The control objectivesderived from these MOPs are:
1. Provide requested virtual shaft speed nvirt as defined in (1) [31].2. Maintain operation within the cavitation bucket for the widest
possible operating conditions.3. Minimise fuel consumption across the ship speed profile and for all
operating conditions.4. Maintain engine air excess ratio λ within predefined limits. We will
investigate system performance against a number of minimum va-lues of the air excess ratio λ.
5. Prevent engine overspeed and under-speed.
The proposed control strategy is presented schematically in Fig. 8.Next, we will discuss the proposed control laws and constraints, andhow they achieve the control objectives.
3.1.1. Virtual shaft speedThe first control objective is to provide the requested virtual shaft
speed as defined in (1). In the conventional control strategy, this isachieved with fixed combinator curves, as shown in Fig. 6. While theproposed adaptive pitch control strategy changes pitch based on oper-ating conditions, the speed setpoint needs to be adjusted to compensatepitch changes. Therefore, the speed setpoint is determined from theactual pitch, as previously proposed in [31], as follows:
=−−
n tP PP t P
n t( )( )
( ).setpd,nom pd,0
pd pd,0virt,set
(24)
3.1.2. Maintain operation within the cavitation bucketAfter experimentally determining the propeller cavitation bucket,
Vrijdag [33] has developed a control strategy that is aimed at main-taining the optimum inflow angle of the water onto the propeller blade,the angle of attack, near its optimum value. Experiments demonstratethe effectiveness of this strategy in the −α σeff n phase plane, which willbe referred to as a cavitation plot in the remainder of this paper. Thiseffective angle of attack αeff , is defined as follows:
⎜ ⎟⎜ ⎟= ⎛⎝
⎞⎠
− ⎛⎝
⎞⎠
−α tP t
πc v tπn t D
α( ) arctan( )
0.7arctan ( )
0.7 ( ),eff
pd 1 a
p pi
(25)
where αi is the shock free entry angle onto the leading edge of thepropeller profile in deg, and c1 is the coefficient to calibrate the effectiveangle of attack with the centre point of the cavitation bucket such that
telegraph position setpoint [%]0 10 20 30 40 50 60 70 80 90 100
shaf
t spe
ed [%
] and
rela
tive
pitc
h se
tpoi
nt [%
]
0
10
20
30
40
50
60
70
80
90
100Combinator curves
shaft speed for manoeuvring mode combinatorrelative pitch setpoint for manoeivring mode combinatorshaft speed for transit mode combinatorrelative pitch setpoint for transit mode combinator
Fig. 6. Combinator curves for baseline control strategy in manoeuvring andtransit modes.
Legend:ne,set speed setpointPpd,set pitch ra o setpointne engine speedPpd propeller pitch ra o
e ,set angle of a ack setpointhydrodyamic pitch angle
u(t) control ac onsx(t) state variablesz(t) measured system
outputsr(t) disturbances
Propulsion systemx(t)
z(t)PIcontrolne,set
u(t)Ppd,set
z=[Ppd , ne]
Propulsion systemx(t)
z(t)PIcontrolne,set
u(t)e ,set
z=[Ppd , ne , ]
baseline control strategy
adap ve pitch control strategy
r(t)
r(t)
Fig. 7. Simplified representation of baseline control strategy and proposedadaptive pitch control strategy for diesel mechanical propulsion with CPP.
R.D. Geertsma et al. Applied Energy 228 (2018) 2490–2509
2495

the cavitation bucket can be represented as two lines in the −α σeff nphase plane. Vrijdag [33, Ch. 7 pp. 115–120] describes the procedure todetermine c1 and Vrijdag [33, Ch. 7 pp. 147–159] describes the sche-matic cavitation bucket in the −α σeff n phase plane, with the cavitationnumber σn defined as follows:
=−∞σ t
p pρ n t D
( )1/2 ( ( ))
,nv
sw p2
p2
(26)
where ∞p is the ambient water pressure at the center-line of the pro-peller in Pa, pv is the vapour pressure of water at the ambient tem-perature in Pa, ρsw is seawater density in kg/m3, and Dp is the propellerdiameter in m.
The proposed control strategy forms the basis for the controlstrategy proposed in this paper. While the implementation of the angleoff attack strategy in [33] was aimed at minimising cavitation, the workalready concluded that this control strategy improves acceleration be-haviour and prevents the loss of ship speed due to pitch reduction whenpreventing engine loading. This study aims to quantify the benefits ofthe adaptive pitch control strategy and proposes an integrated controlstrategy aimed at achieving all control objectives mentioned above. Theangle of attack setpoint αeff,set can be defined as a function of the virtualshaft speed, but in this case is taken constant and determines the nor-malised pitch control setpoint ∗Ppd,set, as follows:
=− +
−∗P t
π θ t θ t PP P
( )0.7 tan( ( ) ( ))
pd,setset red pd,0
pd,nom pd,0 (27)
= + +θ t α α c β t( ) arctan( tan( ( )))set eff,set i 1 (28)
⎜ ⎟= ⎛⎝
⎞⎠
β t arctan v tπn t D
( ) ( )0.7 ( )
a
p p (29)
= − +v t v t f v t( ) ( )(1 ) ( ),a s w w (30)
where θset is the pitch angle setpoint in rad, θred is the pitch angle set-point reduction in rad, β is the hydrodynamic pitch angle in rad, va isthe advance speed of the water relative to the propeller in m/s, and fw isthe wake fraction, which is considered constant.
While the actual hydrodynamic pitch angle cannot be directlymeasured, we assume this value is available. In [33] a method is pro-posed to derive the hydrodynamic pitch angle by measuring thrust andusing the inverse of the four quadrant open water diagram. Moreover, a
pitch angle reduction term θred is added, which is proportional to themargin of the unlimited fuel injection setpoint to the fuel injectionlimitations, as follows:
=θ t P X t( ) ( )θred mar (31)
⩽ ⩽θ t θ0 ( ) ,red red,max (32)
where Pθ is the proportional pitch angle reduction gain, Xmar is the fuelinjection margin as defined in (39) and θred,max indicates the maximumvalue of the pitch angle reduction.
When the control objective to minimise acceleration time is alsostrived for, the air excess ratio limitation of the engine causes pitchreduction. Subsequently, the angle of attack is not maintained at itsoptimum value. In a separate low cavitation mode the air excess ratiolimitation is prevented by limiting the fuel injection increase rate lim-itation, RX,cav .
3.1.3. Minimise fuel consumptionThe operating points of four components determine the fuel con-
sumption of a direct mechanical propulsion plant with controllablepitch propeller: the diesel engine, the gearbox, the shaft-line and thepropeller. The speed and fuel injection of the diesel engine, in combi-nation with the charge pressure, determine the specific fuel consump-tion of the engine. The speed and torque of the shaft-line and gearboxdetermine their losses, which are relatively small and will not be con-sidered for the control strategy. Finally, the propeller open water effi-ciency is determined by the operating point of the propeller, governedby ship speed, wake-field disturbance from waves and propeller speedand pitch. Moreover, automotive and maritime research has shown thatquasi static behaviour to a large extent determines the fuel consumptionof cars and ships [75–77], although Blanke et al. [48] have demon-strated the engine control strategy can utilise the varying inflow velo-city to increase the propeller efficiency in moderate seas, as will beaddressed in Section 3.1.4.
The operating point at which the diesel engine consumes theminimum amount of fuel for a given power can be established from thespecific fuel consumption contour plot, shown for the case study dieselengine in Fig. 9. At the lowest fuel consumption for a given power, thegradient of the specific fuel consumption is zero. The theoretical cubelaw propeller curve with a design point at full speed at 90% of ratedpower is also shown in Fig. 9. On this propeller curve, the fuel con-sumption is very close to its lowest value for a give power, as thegradient of the specific fuel consumption is close to zero. Moreover, thediesel engine project guide recommends operating the diesel engine on
Virtual shaspeed se ng
Legend:nvirt virtual sha speedPpd pitch ra o
e , set angle of a ack setpointnset engine speed setpointp1 engine charge pressurene actual engine speed
u undisturbed hydrodynamic pitch anglered angle of a ack reduc on
Xlim fuel injec on limita onXmin minimum fuel injec onPpd,set pitch ra o setpointXset fuel injec on setpoint
angle of a ack setp.Obj. 2, 3, 5
nvirt
Speedsetpoint
Obj. 1Ppd
integra ngspeed
controlObj. 1, 3 - 5
nset
angle of a ack control
Obj. 2, 3, 5e , set
u
fuel limita ons
Obj. 4, 6
pitch angle reduc on
Obj. 2
Ppd,set
Xset
red
Xlim
ne
p1
ne
p1
Xmin
Fig. 8. Schematic representation of proposed adaptive pitch control strategy fordiesel mechanical propulsion with CPP.
400 600 800 1000speed [rpm]
0
500
1000
1500
2000
2500
3000
3500
4000
4500
5000
pow
er [k
W]
rake specific fuel consumption [g/kWh]
197
198
199
200
205
210
220
240260
260
300300
400 400600 600
power limit [kW]bsfc [g/kWh]propeller curve [kW]
400 600 800 1000speed [rpm]
0
500
1000
1500
2000
2500
3000
3500
4000
4500
5000
pow
er [k
W]
ir excess ratio contour
1.4
1.6
1.6
1.8
1.8
1.8
1.8
2
2
2
2.2
2.2
2.6
2.6
33
4 45
power limit [kW]air excess ratio [-]propeller curve [kW]
Fig. 9. Specific fuel consumption and air excess ratio contour plot in engineoperating envelope with theoretical cube law propeller curve.
R.D. Geertsma et al. Applied Energy 228 (2018) 2490–2509
2496

this propeller curve, as the margin to the engines power limit is suffi-cient [78].
Similarly, the control objective to operate the engine at or close tothe operating point defined by the theoretical propeller curve also leadsto the highest possible open water efficiency of the propeller, as theopen water efficiency typically is highest at the highest possible pitchand the operating envelope of the engine does not allow increasingpitch, and thus the load, above the theoretical propeller curve. Forengines with wide operating envelopes, alternative control strategiesmight lead to lower fuel consumption. One such strategy can reducefuel consumption in part load by up to 7%, by using hybrid propulsionwith power take-off for a sequentially turbocharged diesel engine, asdiscussed in [79]. In conclusion, the second resulting control objectiveis to operate the engine at or close to the operating point defined by thetheoretical propeller curve with a design point at 90% rated power.
This control objective can be achieved by governing control actionpropeller pitch ratio setpoint Pp,set and can be translated in maintaininga constant propeller torque coefficient KQ, which is defined as [25]:
=K tQ t
ρ n t D( )
( )( ( ))
,Qp
sw p2
p4
(33)
where Qp is the open water propeller torque in kNm, and Dp is thepropeller diameter in m. However, control objectives 3, 4 and 6 benefitfrom maintaining a constant effective angle of attack αeff , instead of aconstant pitch or propeller torque coefficient KQ. Moreover, for the casestudy Patrol Vessel, with a nearly cubed resistance curve due to its lowFroude number, maintaining a constant angle of attack also leads tooperating the propeller at an almost constant propeller torque coeffi-cient KQ and at or close to the theoretical propeller curve. Therefore,the propeller pitch ratio setpoint Pp,set is controlled to maintain theangle of attack at its setpoint value αeff,set, as defined in (27) and (28).
3.1.4. Maintain engine air excess ratioThe engine air excess ratio, the relative amount of air that is left
after complete combustion of all fuel, is an important indicator forengine thermal loading, as demonstrated in [80,81,56,24], and Figs. 9and 10. While the air excess ratio contour plot in Fig. 9 illustrates theair excess ratio in stationary conditions, the air excess ratio duringdynamic conditions, such as acceleration and wave induced dis-turbances, can be significantly lower or higher due to the turbochargerlag. In this section, we will first address wave induced disturbances andpropose integrating speed control to resolve these and then propose afuel injection constraint that maintains the air excess ratio at aminimum value during acceleration.
Geertsma et al. [50] have demonstrated that engine torque controlas opposed to engine speed control can completely eliminate thermalloading fluctuation due to disturbance from waves. Moreover, Blankeet al. [48] have demonstrated with model experiments that torquecontrol can lead to 2% fuel consumption reduction in moderate seas byutilising the varying inflow velocity onto the propeller blade, thus in-creasing the propeller efficiency. However, the first control objective isto provide the requested virtual shaft speed and torque control wouldrequire an additional torque sensor, that might be less reliable thanspeed sensing. Therefore, we propose to use integrating speed control,without a proportional gain on the speed error, similar to the slow in-tegrating speed control strategy that Rubis and Harper [82] proposedfor gas turbine mechanical propulsion, due to its good performance inheavy waves. Slow integrating speed control exhibits a similar dynamicbehaviour in waves as torque control and, in combination with (24),also provides the requested virtual shaft speed. Thus, the followingcontrol algorithm is proposed to achieve slow integrating speed control:
∫ ⎜ ⎟= ⎛⎝
− ⎞⎠
X t Kn t i
nn tn
dt( )( ) ( ) ,
tI I,ic 0
set gb
e,nom
e
e,nom (34)
where XI is the fuel injection setpoint from integrating speed control,
KI,ic is the reset rate for slow integrating speed control, igb is the gearboxreduction ratio, and ne,nom is the nominal engine speed in Hz.
During an acceleration, the charge pressure will lag at a lower valuedue to the turbocharger inertia, which causes a higher thermal loadingthan in stationary conditions. In order to prevent thermal overloading,the objective thus is to maintain the air excess ratio at a minimumvalue. This can be achieved by first limiting the fuel pump positionbased on the charge pressure and secondly reducing the angle of attacksetpoint when the fuel pump position is limited. The fuel pump positionlimitation is defined as follows, as derived from [24, Eqs. (4) and (5)]:
=X tp t V
R T σ m λ( )
( ),λ
minlim,
1 1
a 1 f f,nom (35)
where X λlim, is the fuel injection limitation to limit the air excess ratio λin % of nominal fuel injection mf,nom, V1 is the cylinder volume at thestart of compression in m3, Ra is the gas constant of air in J/kg K, T1 isthe temperature at the start of compression in K and σf is the stoi-chiometric air fuel ratio of the fuel.
Another important parameter to limit engine thermal loading is therate of increase of exhaust valve temperature dT dt/ev during an accel-eration, which is mainly determined by the rate of increase of torqueand therefore fuel injection X. In order to limit this rate of increase, theproposed adaptive pitch control strategy incorporates a fuel injectionincrease rate limitation RX,therm to prevent thermal overloading due to ahigh dT/dt. Moreover, in order to prevent cavitation due to runninginto the air excess ratio limitation, a second setting for this rate is de-termined for the low cavitation mode: the torque increase rate limita-tion for reduced cavitation RX,cav .
3.1.5. Minimise acceleration timeThe objective to minimise acceleration time is restricted by the
objective to prevent engine thermal overloading [38] and thus by theobjective to maintain engine air excess ratio. In traditional controlstrategies this is achieved by limiting the rate of the increase in enginespeed during an acceleration manoeuvre, as demonstrated in[50,21].Vrijdag [31] has demonstrated, through a combination of si-mulation and validation, that the acceleration behaviour improves dueto the proposed angle of attack control strategy with an acceptableengine thermal loading. In essence, the acceleration manoeuvre isfaster, because the pitch is increased more slowly during the accelera-tion manoeuvre, leading to higher engine speed. Geertsma et al. [24]have demonstrated that indeed a reduced pitch during an accelerationmanoeuvre increases engine speed and reduces engine thermal loading,
400 600 800 1000speed [rpm]
0
500
1000
1500
2000
2500
3000
3500
4000
4500
5000
pow
er [k
W]
xhaust valve temperature [K]
650700 800800
900900
10001050
1050
1100
1100
1100
1175
1175
1175
1250
1340
power limit [kW]exhaust valve temperature [K]
400 600 800 1000speed [rpm]
0
500
1000
1500
2000
2500
3000
3500
4000
4500
5000
pow
er [k
W]
utlet receiver temperature [K]
600 650650700
700
750
750
750
008
008
800
800
850
058
058
850
power limit [kW]outlet receiver temperature [K]
Fig. 10. Exhaust valve and receiver temperature plot in engine operating en-velope with theoretical cube law propeller curve.
R.D. Geertsma et al. Applied Energy 228 (2018) 2490–2509
2497

because the turbo charger pressure and thus the air excess ratio in-creases faster at higher engine speeds. In the proposed slow integratingspeed control strategy, according to (34), speed increase rate limitersare not required, as will be demonstrated in the results of this paper.Therefore, the setting of the reset rate KI determines the speed of ac-celeration and needs to be determined in a trade-off between accel-eration behaviour and engine thermal loading during an acceleration.
3.1.6. Prevent engine overspeed and under-speedSlow integrating speed control as defined in (34) introduces the risk
of engine overspeed or under-speed due to disturbances, as integratingspeed control follows the speed setpoint significantly slower than anaggressive PI controller. To prevent engine overspeed, the followingfuel limitation is introduced:
=−
X tn n t
nP( )
( ),lim,os
e,max e
e,nomos
(36)
where Xlim,os is the fuel injection limitation to prevent overspeed, ne,maxis maximum engine speed, and Pos is the overspeed limitation gain.Similarly, the following minimum fuel injection Xmin prevents engineunder-speed:
=−
X tn n t
nP( )
( ),min
e,min e
e,nomus
(37)
where ne,min is minimum engine speed, and Pus is the under-speed lim-itation gain. Moreover, the fuel injection limitation and the fuel injec-tion margin Xmar are defined as:
=X t X t X t( ) max( ( ), ( ))λlim lim,os lim, (38)
= −X t X t X t( ) ( ) ( ). ,mar I lim (39)
where Xlim is the fuel injection limitation in %. Finally, the fuel injec-tion is limited between the minimum fuel injection Xmin and the fuelinjection limitation Xlim, as follows:
< =X t X X t X( ) : ( )setI min min (40)
⩽ ⩽ =X t X t X t X t X t( ) ( ) ( ): ( ) ( )lim setmin I I (41)
> =X t X t X t X t( ) ( ): ( ) ( ).lim set limI (42)
With a traditional combinator curve, reducing pitch at low speedsettings while maintaining minimum engine speed prevents engineunder-speed. When applying the adaptive pitch control strategy thepitch should also be constrained to the value associated with minimumengine speed, as follows:
=∗P tn t i
n( )
( )pd,max
virt,set gb
e,mins (43)
= + −∗ ∗P t P P t P t P P( ) max( ( ), ( ))( ),pd,set pd,0 pd,max pd,set pd,nom pd,0 (44)
where ne,mins is the minimum engine speed setpoint.Finally, when pitch is limited to prevent engine under-speed, engine
speed should be kept constant at minimum engine speed ne,min. In thisregion, slow integrating speed control can lead to excessive speedfluctuation, which will be limited by the under-speed fuel injectionlimitation described in (37). Nevertheless, in this region engine speed isbetter kept constant by applying traditional fast PI speed control, asdescribed in [24], as follows:
∫⎜ ⎟ ⎜ ⎟= ⎛⎝
− ⎞⎠
+ ⎛⎝
− ⎞⎠
X t Kn t n t
nK
n t n tn
dt( )( )
100( ) ( )
100( ) ,PI P
ref e
eI
t ref e
e0nom nom (45)
where XPI is the unlimited fuel injection setpoint for speed control, KP isthe proportional gain and KI is the reset rate. PI speed control replacesslow integrating speed control when the engine speed setpoint is less orequal to minimum engine speed ne,min with a hysteresis of 2.5%. Ef-fectively, PI gain scheduling [83] is applied in this case with a clearswitching value, when the engine speed setpoint is at its minimum
value with a hysteresis of 2.5% to prevent repetitious switching be-tween the gain values. While repetitious switching is prevented byusing the speed setpoint as switching variable, alternatively, a con-tinuous function for the proportional gain P could be derived, as used inpitch control with gain scheduling for wind turbines [84].
3.2. Controller settings
With the traditional control strategy, many of the control para-meters require extensive tuning [24,85,73, Section 3.3]. The resultingparameters of the traditional control strategy are listed in [24, Table 2-6]. Alternatively, the proposed control strategy primarily requireslimitations for physical parameters and a number of gains. The onlyparameters that require tuning are the gain and reset rate for speedcontrol at minimum engine speed KP,sc and KI,sc, and the reset rate forslow integrating speed control KI,ic.
Various tuning strategies for PI control are discussed in literature[83,86–88]. While Aström and Häggelund [83] provide an overview oftuning strategies, Xiros [86] proposes an improved PID tuning methodfor marine engine speed regulation to meet sensitivity ∞H require-ments. However, the stability of the system does not require stringentengine speed disturbance rejection criteria, as demonstrated in [50] andwe aim to minimise torque fluctuations. Moreover, the reset rate forslow integrating speed control KI,ic physically primarily influences therate of temperature increase dT dt/ev during an acceleration and there-fore is tuned to achieve gradual dT dt/ev . Moreover, the influence of thegain and reset rate for speed control K K&p i on the behaviour in wavescan be investigated with linearised propulsion system models as pro-posed in [87,88]. The parameters in this paper were based on this ap-proach and the results in this paper demonstrate the stability of theused settings. The resulting control parameters for the proposed adap-tive pitch control strategy are listed in Table 1.
4. Results
4.1. Simulation experiments
The simulation experiments for the case study Holland class PatrolVessel in this paper aim to compare the proposed control strategy withthe baseline control strategy of the actual vessel, which has been usedfor the validation of the simulation model in [24]. We use two types ofstraight line manoeuvres to establish the Measures of Performance(MOP): sailing at constant speed and two acceleration manoeuvres.First, the slam start manoeuvre proposed in [89] is used to establish theshortest possible acceleration time from 0 kts to 15 kts ship speed, bysetting the virtual shaft speed to the maximum value at the start of themanoeuvre. Second, intermediate sprints are used to establish MOPsduring regular acceleration. For intermediate sprints, the virtual shaftspeed setting is increased from the setting that provides the starting
Table 1Control parameters for the proposed adaptive pitch control strategy.
Control parameter Value
Effective angle of attack setpoint αeff,set in deg 10.5Reset rate slow integrating speed control KI,ic 0.2Proportional gain speed control KP,sc 2Reset rate speed control KI,sc 0.5Minimum engine speed ne,min 350 rpmMaximum engine speed ne,max 1050 rpmUnder-speed limitation gain Pus 8Overspeed limitation gain Pos 22Fuel injection rate for thermal loading RX,thermal 1.67%Fuel injection rate for cavitation RX,cav in % 0.42%Conservative air excess ratio limitation λmin 1.6Regular air excess ratio limitation λmin 1.45
R.D. Geertsma et al. Applied Energy 228 (2018) 2490–2509
2498

ship speed to the setting that achieves the speed at the end of themanoeuvre. These benchmark manoeuvres can be used to demonstratethat the proposed control strategy meets the objectives described inSection 3.1. Moreover, we have performed the proposed benchmarkmanoeuvres to establish the Measures of Performance (MOPs) proposedin [24].
As reported in [24], ‘the ship resistance and the wave model para-meters very strongly depend on the conditions in which the ship op-erates’. In this study, we consider the following two typical conditions:
• Trial condition, defined as Sea State 0, wind speed of 3m/s and nofouling.
• Design condition, defined as Sea State 4, wind speed of 11m/s, headseas and wind and 6months out of dock fouling.
The parameters that represent these conditions are shown in Table 2and Fig. 11, from [24].
The simulation results have been obtained with MATLAB SimulinkR2016b software on a PC with Intel Core i7 processor and 16 GBmemory. The simulation to establish the slam start and intermediate
sprint accelerations requires 6 s simulation time in trial conditions and77 s in design conditions. Both these simulations cover 9000 s, or 2.5 hsimulated time. The difference in simulation time is caused by the dy-namics introduced by waves, limiting the maximum step time for de-sign conditions. The simulation to establish the static operating pointfor design conditions over 22 virtual shaft speeds, allowing stabilisationof each operating point for 1000 s, takes 256 s for 22,000 s simulatedtime. In conclusion, the simulation requires approximately 1/100 s si-mulation time for 1s simulated time in design conditions.
Table 2Hull and wave model parameters in trial and design conditions, from [24].
Condition Trial Design
Ship mass m in 103kg 3800 3800Number of propellers m 2 2Thrust deduction factor t 0.155 0.155Propeller center depth z in m 6.5 6.5Wave amplitude ζ in m 0 1Wave frequency ωwv in rad/s – 0.966Wave number k – 0.095
ship speed [kts]0 5 10 15 20 25
ship
resi
stan
ce [k
N]
0
200
400
600
800
1000
1200
1400resistance from model tests corrected for envronmental conditions and fouling
trial conditiondesign conditionoff-design condition
Fig. 11. Ship resistance from model tests corrected for environmental condi-tions and fouling in trial, design and off-design condition, from [24].
Table 3Control strategies, modes and settings evaluated in simulation experiments reported in Section 4.
Control strategy name Mode Increase rate +RL or RX Air excess ratio λmin
Baseline manoeuvre speed control Manoeuvre +RL =1.5%/sBaseline transit speed control Transit +RL =0.75%/sAdaptive pitch control (APC) Fast APC RX,therm =1.67%/s λmin =1.45Adaptive pitch control (APC) APC with limited air excess ratio λ RX,therm =1.67%/s λmin =1.6Adaptive pitch control (APC) Slow APC to prevent cavitation RX,cav =0.42%/s λmin =1.6
5000 5200 5400 5600 5800 6000 6200 6400 6600 6800 7000time (s)
0
50
100
150
200
250
n virt
(rpm
)
a. setpoint tracking behaviour for virtual shaft speed in trial conditions
virtual speed setpoint apcvirtual speed apcvirtual speed setpoint transitvirtual speed transit
5000 5200 5400 5600 5800 6000 6200 6400 6600 6800 7000time (s)
0
50
100
150
200
250
n virt
(rpm
)
b. setpoint tracking behaviour for virtual shaft speed in design conditions
virtual speed setpoint apcvirtual speed apcvirtual speed setpoint transitvirtual speed transit
Fig. 12. Setpoint tracking behaviour for virtual shaft speed in trial and designconditions for baseline transit control and adaptive pitch control with limitedair excess ratio.
5000 5200 5400 5600 5800 6000 6200 6400 6600 6800 7000time (s)
0
5
10
15
20
25
ship
spe
ed (k
ts)
apc, trial conditionsapc, design conditionstransit, trial conditionstransit, design conditions
Fig. 13. Ship speed during intermediate sprint acceleration in trial and designconditions for baseline transit control and adaptive pitch control with limitedair excess ratio.
R.D. Geertsma et al. Applied Energy 228 (2018) 2490–2509
2499

4.2. Evaluated control strategies
In the simulation experiments, the baseline transit and manoeuvremode control strategies, as described in [24], are compared with theadaptive pitch control strategy as described in Section 3, with varioussettings as reported in Table 1. An overview of the 5 control strategies,their modes and settings used for the evaluation in Section 4 is listed inTable 3.
4.3. Evaluation of control objectives
4.3.1. Virtual shaft speedThe first control objective is to provide the requested virtual shaft
speed. This objective is one of the key reasons to employ traditionalspeed control, as feedback control on speed can robustly handle theuncertainty associated with weather conditions, ships course relative tothe wind and waves, hull fouling and ships displacement. Figs. 12 and13 present the results of the intermediate acceleration from 0 kts to5 kts, 5 kts to 10 kts, 10 kts to 15 kts and 15 kts to maximum speed for
trial conditions and for design conditions, reflecting two very differentconditions and thus the described uncertainty.
The baseline control strategy provides the requested shaft speedunless pitch is reduced to prevent overloading, as described in [24,Section 3.2, pp. 1618–1619]. While engine speed control robustlymaintains engine speed at the requested speed from the combinatorcurve, the pitch reduction strategy reduces pitch and therefore virtualshaft speed. Therefore, in conditions with a high ship resistance, such asdesign conditions, the traditional control strategy does not actuallyprovide the requested virtual shaft speed, as shown in Fig. 12. Actually,even in trial conditions, at certain engine speed the requested virtualshaft speed is not achieved. The operator can achieve the required shipspeed by requesting a higher virtual shaft speed than the virtual shaftspeed required for that ship speed, which is clearly demonstrated by thehigh virtual speed setpoint of 200 rpm required to achieve 15 kts shipspeed with baseline transit control in design conditions in Fig. 12b.
The proposed adaptive pitch control strategy, in this case withlimited air excess ratio, follows the virtual shaft speed setpoint
-2 0 2 4 6 8 10 12effective angle of attack [deg]
1
2
3
4
5
6
7
8
9
10
Cav
itatio
n nu
mbe
r
baseline transit modebaseline manoeuvring modeadaptive pitch control with limited air excessadaptive pitch control without limited air excessfictive cavitation bucket
Fig. 14. Cavitation plot from low speed to maximum speed for trial conditionsin manoeuvring and transit mode and with adaptive pitch control with andwithout limited air excess ratio.
2 3 4 5 6 7 8 9 10 11 12effective angle of attack [deg]
1
2
3
4
5
6
7
8
9
10
Cav
itatio
n nu
mbe
r
baseline transit modebaseline manoeuvring modeadaptive pitch control with limited air excessadaptive pitch control without limited air excessfictive cavitation bucket
Fig. 15. Cavitation plot at constant speed from low speed to maximum speedfor baseline transit and manoeuvre mode and for adaptive pitch control with(1.6) and without (1.45) limited air excess ratio in design conditions.
4 6 8 10 12 14 16effective angle of attack [deg]
1
2
3
4
5
6
7
8
9
10
11
Cav
itatio
n nu
mbe
r
fictive cav bucket0 to 5 kts5 to 10 kts10 to 15 kts15 kts to maximum0 kts5 kts10 kts15 kts
Fig. 16. Cavitation plot in design conditions during intermediate sprints from 0to 5 kts, 5 to 10 kts, 10 to 15 kts, and 15 kts to maximum ship speed, foradaptive pitch control with limited air excess ratio (1.6) and a fuel injectionincrease rate to only prevent thermal overloading RX,therm.
4 6 8 10 12 14 16effective angle of attack [deg]
0
2
4
6
8
10
12
14C
avita
tion
num
ber
fictive cav bucket0 to 5 kts5 to 10 kts10 to 15 kts15 kts to maximum0 kts5 kts10 kts15 kts
Fig. 17. Cavitation plot in design conditions during intermediate sprints from 0to 5 kts, 5 to 10 kts, 10 to 15 kts, and 15 kts to maximum ship speed, for slowadaptive pitch control to prevent cavitation RX,cav .
R.D. Geertsma et al. Applied Energy 228 (2018) 2490–2509
2500

accurately, because higher or lower pitch than nominal pitch is com-pensated with a proportional decrease or increase in speed setpoint dueto (24). Only if the air excess ratio limitation λmin is higher than the airexcess ratio on the theoretical propeller curve, for this engine higherthan 1.50, the virtual shaft speed will not reach its setting as the airexcess ratio limitation is not compensated by increased engine speed.Slow integrating speed control responds more slowly to changes inengine speed and therefore ship speed, leading to a slight overshoot invirtual shaft speed during acceleration, as shown in Fig. 12. However,this overshoot only leads to an overshoot in ship speed of 0.3 kts, andonly in light trial conditions. During design conditions, when the enginemargin is smaller, constant ship speed is only reached when the virtualshaft speed overshoot has already stabilised. Therefore, this overshootis acceptable, also because it leads to significantly faster acceleration.The robust virtual shaft speed following capability under large un-certainties is a significant advantage of the proposed adaptive pitch
control compared to the baseline strategy, that does not accuratelyfollow the virtual shaft speed setpoint, and this behaviour is achievedwith simple feedback control as opposed to complex algorithms asproposed in [90].
4.3.2. Maintain operation within the cavitation bucketWhile the propeller of the patrol vessel has not been designed for
low noise operation, the angle of attack at the design point of thepropeller is too high for low cavitation behaviour. However, for theevaluation of the control objective to maintain operation within thecavitation bucket, we assume the cavitation bucket is centred aroundthe angle of attack at the design point, which could be achieved at alower angle of attack with a similar propeller with a larger diameter.Therefore, the objective of the control strategy is to maintain the angleof attack centred around the design angle of attack: 10.5 deg.
The cavitation plots at constant speed for trial and design conditionsin Figs. 14 and 15 demonstrate that the adaptive pitch control strategymaintains the effective angle of attack at the desired angle of 10.5degrees, irrespective of the uncertainties in weather conditions, whilethe effective angle of attack of the baseline transit and manoeuvre mode
5000 5200 5400 5800 6200 6400 66000
5
10
15
angl
e of
atta
ck [d
egre
es]
a. angle of attack during intermediate sprints
regular apcslow acceleration apc
5000 5200 5400 5600 5800 6000 6200 6400 6600time [s]
0
20
40
60
80
100
rela
tive
pitc
h to
nom
inal
[%]
5600 6000time [s]
b. pitch during intermediate sprints
regular apcslow acceleration apc
Fig. 18. Angle of attack and pitch during intermediate sprints in design con-ditions from 0 to 5 kts, 5 to 10 kts, 10 to 15 kts, and 15 kts to maximum shipspeed comparing adaptive pitch control with limited air excess ratio (1.6) andfuel injection increase rate RX,therm, with slow adaptive pitch control with fuelinjection increase rate RX,cav .
5000 5200 5400 5600 5800 6000 6200 6400 6600
400
600
800
1000
engi
ne s
peed
[rpm
]
a. engine speed during intermediate sprints
regular apcslow acceleration apc
5000 5200 5400 5600 5800 6000 6200 6400 6600time [s]
0
5
10
15
20
ship
spe
ed s
peed
[kts
]
time [s]
b. ship speed during intermediate sprints
regular apcslow acceleration apc
Fig. 19. Engine and ship speed during intermediate sprints in design conditionsfrom 0 to 5 kts, 5 to 10 kts, 10 to 15 kts, and 15 kts to maximum ship speedcomparing adaptive pitch control with limited air excess ratio (1.6) and fuelinjection increase rate RX,therm, with slow adaptive pitch control with fuel in-jection increase rate RX,cav .
Fig. 20. Cavitation plot in design conditions during intermediate sprints from 0to 5 kts, 5 to 10 kts, 10 to 15 kts, and 15 kts to maximum ship speed withbaseline transit mode.
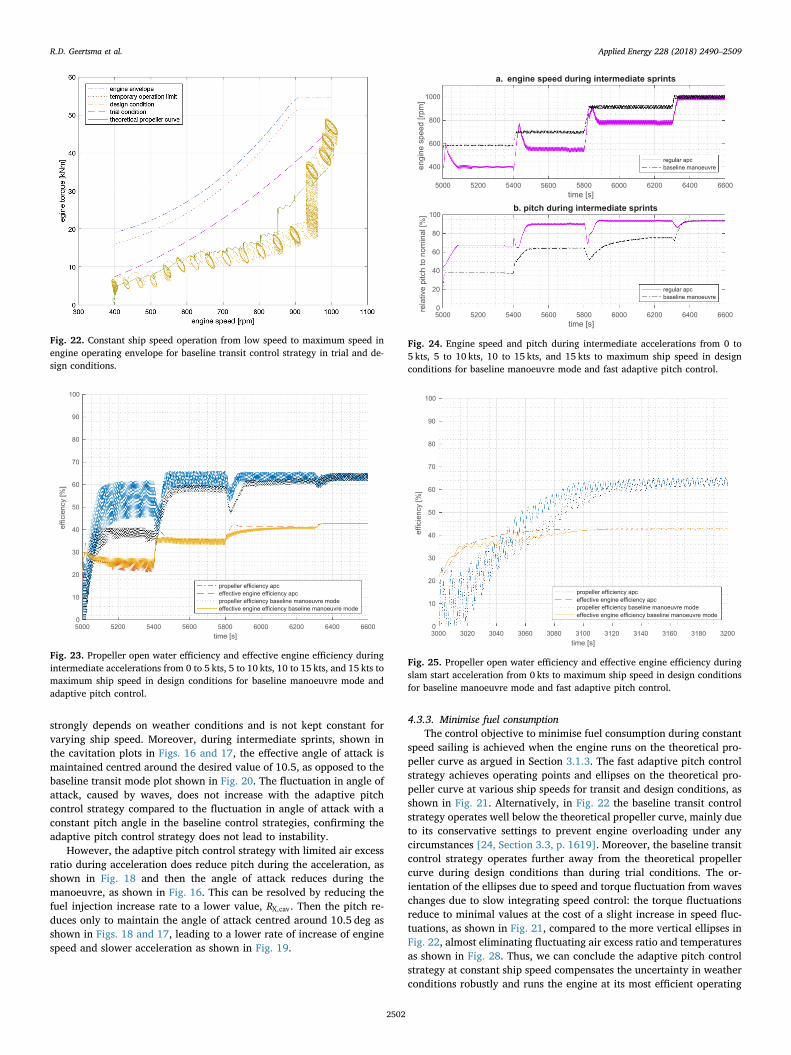
Fig. 21. Constant ship speed operation from low speed to maximum speed inengine operating envelope for fast adaptive pitch control strategy (with airexcess ratio limitation =λ 1.45lim ) in trial and design conditions.
R.D. Geertsma et al. Applied Energy 228 (2018) 2490–2509
2501
strongly depends on weather conditions and is not kept constant forvarying ship speed. Moreover, during intermediate sprints, shown inthe cavitation plots in Figs. 16 and 17, the effective angle of attack ismaintained centred around the desired value of 10.5, as opposed to thebaseline transit mode plot shown in Fig. 20. The fluctuation in angle ofattack, caused by waves, does not increase with the adaptive pitchcontrol strategy compared to the fluctuation in angle of attack with aconstant pitch angle in the baseline control strategies, confirming theadaptive pitch control strategy does not lead to instability.
However, the adaptive pitch control strategy with limited air excessratio during acceleration does reduce pitch during the acceleration, asshown in Fig. 18 and then the angle of attack reduces during themanoeuvre, as shown in Fig. 16. This can be resolved by reducing thefuel injection increase rate to a lower value, RX,cav . Then the pitch re-duces only to maintain the angle of attack centred around 10.5 deg asshown in Figs. 18 and 17, leading to a lower rate of increase of enginespeed and slower acceleration as shown in Fig. 19.
4.3.3. Minimise fuel consumptionThe control objective to minimise fuel consumption during constant
speed sailing is achieved when the engine runs on the theoretical pro-peller curve as argued in Section 3.1.3. The fast adaptive pitch controlstrategy achieves operating points and ellipses on the theoretical pro-peller curve at various ship speeds for transit and design conditions, asshown in Fig. 21. Alternatively, in Fig. 22 the baseline transit controlstrategy operates well below the theoretical propeller curve, mainly dueto its conservative settings to prevent engine overloading under anycircumstances [24, Section 3.3, p. 1619]. Moreover, the baseline transitcontrol strategy operates further away from the theoretical propellercurve during design conditions than during trial conditions. The or-ientation of the ellipses due to speed and torque fluctuation from waveschanges due to slow integrating speed control: the torque fluctuationsreduce to minimal values at the cost of a slight increase in speed fluc-tuations, as shown in Fig. 21, compared to the more vertical ellipses inFig. 22, almost eliminating fluctuating air excess ratio and temperaturesas shown in Fig. 28. Thus, we can conclude the adaptive pitch controlstrategy at constant ship speed compensates the uncertainty in weatherconditions robustly and runs the engine at its most efficient operating
Fig. 22. Constant ship speed operation from low speed to maximum speed inengine operating envelope for baseline transit control strategy in trial and de-sign conditions.
5000 5200 5400 5600 5800 6000 6200 6400 6600time [s]
0
10
20
30
40
50
60
70
80
90
100
effic
ienc
y [%
]
propeller efficiency apceffective engine efficiency apcpropeller efficiency baseline manoeuvre modeeffective engine efficiency baseline manoeuvre mode
Fig. 23. Propeller open water efficiency and effective engine efficiency duringintermediate accelerations from 0 to 5 kts, 5 to 10 kts, 10 to 15 kts, and 15 kts tomaximum ship speed in design conditions for baseline manoeuvre mode andadaptive pitch control.
5000 5200 5400 5800 6200 6400 6600
400
600
800
1000
engi
ne s
peed
[rpm
]
engine speed during intermediate sprints
regular apcbaseline manoeuvre
5000 5200 5400 5600 5800 6000 6200 6400 6600time [s]
0
20
40
60
80
100
rela
tive
pitc
h to
nom
inal
[%]
5600 6000time [s]
b. pitch during intermediate sprints
regular apcbaseline manoeuvre
Fig. 24. Engine speed and pitch during intermediate accelerations from 0 to5 kts, 5 to 10 kts, 10 to 15 kts, and 15 kts to maximum ship speed in designconditions for baseline manoeuvre mode and fast adaptive pitch control.
3000 3020 3040 3060 3080 3100 3120 3140 3160 3180 3200time [s]
0
10
20
30
40
50
60
70
80
90
100
effic
ienc
y [%
]
propeller efficiency apceffective engine efficiency apcpropeller efficiency baseline manoeuvre modeeffective engine efficiency baseline manoeuvre mode
Fig. 25. Propeller open water efficiency and effective engine efficiency duringslam start acceleration from 0 kts to maximum ship speed in design conditionsfor baseline manoeuvre mode and fast adaptive pitch control.
R.D. Geertsma et al. Applied Energy 228 (2018) 2490–2509
2502

point with sufficient margin to the engine operating envelope.While the efficiency during acceleration does not heavily impact the
fuel consumption over the operating profile of the ship, the efficiencyduring acceleration is also an indicator for acceleration performance.Therefore, Figs. 23 and 25 present the propeller open water efficiencyand the effective engine efficiency during intermediate sprints and theslam start acceleration. During these accelerations, the engine effi-ciency and propeller efficiency are consistently higher for the fastadaptive pitch control strategy than for the baseline manoeuvrestrategy. This has two reasons: first, the pitch in adaptive pitch controlis higher and therefore the propeller operates at a higher open waterefficiency; secondly, engine speed and engine load increase fasterduring acceleration, thus operating the engine at higher efficiency,because the adaptive pitch control strategy retracts pitch during theacceleration procedure to maintain the effective angle of attack asshown in Figs. 24 and 26.
The approach to minimise fuel consumption works very well withthe proposed angle of attack approach, because fuel consumption isclose to its minimum for a constant angle of attack for this particularengine. Nevertheless, if an engine has a different specific fuel con-sumption plot or if the trade-off between quasi-static NOx emissions andfuel consumption should be taken into account, still an optimum quasi-static relationship between engine speed and torque could be estab-lished, which can be either translated into a relationship between shaftspeed np and effective angle of attack αeff or shaft speed np and pro-peller torque coefficient KQ. The input for the development of the set-ting for this approach are static specific fuel consumption or NOx
emission maps, such as Fig. 9, Fig. 4 in [21], or Fig. 1 to 3 in [91].Nuesch et al. [91] practically demonstrate NOx emissions can be ad-dressed with a quasi-static approach, as opposed to particulate matter(PM) emissions, which are sensitive to turbo charger lag and primarilybenefit from a smooth torque trajectory, one of the benefits of theproposed slow integrating speed control strategy. Moreover, the staticPM emission map in Fig. 2, in [91], shows that PM emissions for thatspecific automotive diesel engine appears near its minimum around thetheoretical propeller curve. Therefore, future work could be aimed atconfirming the expectation that the proposed adaptive pitch controlstrategy with slow integrating torque control also has a positive influ-ence on PM emissions, and at investigating the trade-off between fuelconsumption and NOx emissions.
4.3.4. Maintain engine air excess ratioFigs. 27 and 28 demonstrate that the proposed control strategy
maintains the air excess ratio within the predefined limits, either abovethe minimum value of 1.45 or above the value of 1.6. When the airexcess ratio λmin is kept at a higher value, the temperatures during theslam start and intermediate acceleration are significantly lower. Thebaseline manoeuvre mode maintains even higher air excess ratiosduring all manoeuvres and therefore maintains lower temperatures, butthat is caused by the very conservative settings to prevent overloadingin heavy off-design conditions. In the nominal operating point on thetheoretical propeller curve at 700 rpm and 1650 kW, the air excess ratioalso is 1.35 and the exhaust valve temperature 1350 K. Therefore, an airexcess ratio of 1.45 and an exhaust valve temperature of 1350 K doesnot lead to engine thermal overloading.
In almost all manoeuvres the maximum exhaust valve temperatureremains below 1350 K, suggesting that the proposed control strategywith a minimum air excess ratio does not lead to thermal overloading.However, during the intermediate sprint from 10 to 15 kts the max-imum cylinder temperature peaks to 1400 K, while the air excess ratio λis maintained at a minimum value of 1.45. During this acceleration,engine speed ranges from 600 to 800 rpm, the range in which the airexcess ratio is lowest and exhaust valve temperature highest duringstatic conditions. Nevertheless, the higher temperature during thismanoeuvre compared to other manoeuvres with the same minimum airexcess ratio proves that the exhaust valve temperature is not directlydependant on the in-cylinder air excess ratio λ.
Close inspection of the simulation results shows that during thisacceleration, the charge pressure lags, causing a reduced scavenge flowand therefore reduced exhaust valve cooling. This dependency of sca-venge flow on charge pressure is clear from Eq. (29) and (30) in [24]and the relationship between scavenge flow and exhaust temperature isexpressed in Eq. (51) in [24]. While further research would be requiredto establish whether this would indeed lead to thermal overloading ofthe engine, an alternative maximum fuel injection value as a function ofcharge pressure p1 slightly more conservative than (35), could be usedto reduce thermal loading during this specific case. Then, the re-lationship would either have to be experimentally established or haveto be determined with the simulation model used in this study using theengine model in isolation and fixing the charge pressure model input.
Alongside the maximum temperature that is reached during accel-eration, the rate of change of the exhaust valve temperature dT dt/ev
during an acceleration is also important for thermal stresses in theengine. Figs. 27 and 28 illustrate that for the adaptive pitch controlstrategy the average rate of change of the exhaust valve temperature
3000 3020 3040 3060 3080 3100 3120 3140 3160 3180 3200
400
600
800
1000
engi
ne s
peed
[rpm
]
a. engine speed during slam start acceleration
regular apcbasline manoeuvre
3000 3020 3040 3060 3080 3100 3120 3140 3160 3180 3200time [s]
0
20
40
60
80
100
rela
tive
pitc
h to
nom
inal
[%]
time [s]
b. pitch during slam start acceleration
regular apcbaseline manoeuvre
Fig. 26. Engine speed and pitch during slam start acceleration from 0 kts tomaximum ship speed in design conditions for baseline manoeuvre mode andfast adaptive pitch control.
3000 3020 3040 3060 3080 3100 3120 3140 3160 3180 3200time [s]
1
1.5
2
2.5
3
3.5
4
air e
xces
s ra
tio
a. air excess ratio during slam start acceleration
adaptive pitch control with lambda min 1.45slow adaptive pitch controladaptive pitch control with lambda min 1.6baseline manoeuvre mode
3000 3020 3040 3060 3080 3100 3120 3140 3160 3180 3200time [s]
600
800
1000
1200
1400
exha
ust v
alve
tem
pera
ture
[K] b. exhaust valve temperature during slam start acceleration
adaptive pitch control with lambda min 1.45slow adaptive pitch controladaptive pitch control with lambda min 1.6baseline manoeuvre mode
Fig. 27. Air excess ratio and exhaust valve temperature during slam start ac-celeration from stationary to maximum speed for adaptive pitch controlstrategy with various settings and baseline manoeuvre mode in design condi-tions.
R.D. Geertsma et al. Applied Energy 228 (2018) 2490–2509
2503

dT dt/ev during the initial phase of the acceleration is similar to thebaseline manoeuvre mode, but that the fluctuation due to waves doesnot occur for the adaptive pitch control strategy, due to the slow in-tegration speed control. Moreover, close to the peak temperature, whenthe thermal stresses are highest, the increase rate of the temperaturereduces, again without the fluctuation due to waves. While further re-search would be necessary to accurately determine the thermal stressescaused by the two control strategies, Figs. 27 and 28 suggest the be-haviour of the adaptive pitch control strategy is more gradual andtherefore less likely to cause thermal overloading.
4.3.5. Minimise acceleration timeThe control objective to minimise acceleration time is a trade-off
with the control objective to prevent engine thermal overloading. Inorder to reduce engine thermal loading during an acceleration man-oeuvre, charge pressure needs to increase as fast as possible as a highercharge pressure provides a higher air excess ratio and scavenge flow
increases at higher charge pressures. Increasing charge pressure duringan acceleration can be best achieved by increasing engine speed andthus air flow in the engine. However, the fuel injection limitation of thebaseline control strategy and the air excess ratio limitation of the pro-posed strategy limit the fuel injection during the acceleration man-oeuvre and therefore the torque available for acceleration. Reducingpitch during the acceleration manoeuvre, which is an indirect effect ofthe effective angle of attack control strategy, helps increasing enginespeed during an acceleration manoeuvre due to (1).
Fig. 24 demonstrates how, with fast adaptive pitch control, enginespeed is increased during intermediate sprints due to pitch reduction,well above the engine speed after reaching constant speed, and Fig. 29shows that this engine speed increase leads to a faster increase in chargepressure than during an intermediate sprint with the baseline man-oeuvre mode. During a slam start acceleration with adaptive pitchcontrol, engine speed and charge pressure do rise faster than with thebaseline manoeuvre mode, but the increase in engine speed then islimited by the air excess ratio limitations due to the turbocharge lag, as
5000 5200 5400 5600 5800 6000 6200 6400 66000
5
10
15
20
25
ship
spe
ed [k
ts]
a. ship speed during intermediate sprints
regular apcbaseline manouevre mode
3000 3020 3040 3060 3080 3100 3120 3140 3160 3180 3200time [s]
0
5
10
15
20
25
ship
spe
ed [k
ts]
time [s]
b. ship speed during slam start accleration
regular apcbaseline manouevre mode
Fig. 30. Ship speed during intermediate sprints from 0 to 5 kts, 5 to 10 kts, 10to 15 kts, and 15 kts to maximum ship speed and slam start acceleration forbaseline manoeuvre control strategy and adaptive pitch control strategy (apc)in design conditions.
300 400 500 600 700 800 900 1000 1100engine speed [rpm]
0
10
20
30
40
50
60
egin
e to
rque
[kN
m]
engine envelopetemporary operation limitacceleration 0 to max speedtheoretical propeller curve
Fig. 31. Slam start acceleration from stationary to maximum speed in engineoperating envelope for fast adaptive pitch control strategy with air excess ratiolimitation =λ 1.45lim in trial and design conditions.
5400 5500 5600 5700 5800 5900 6000 6100 6200 6300 6400 6500time [s]
1
1.5
2
2.5
3
3.5
4
air e
xces
s ra
tio
a. air excess ratio during intermediate sprints
adaptive pitch control with lambda min 1.45slow adaptive pitch controladaptive pitch control with lambda min 1.6baseline manoeuvre mode
5400 5500 5600 5700 5800 5900 6000 6100 6200 6300 6400 6500time [s]
600
800
1000
1200
1400
exha
ust v
alve
tem
pera
ture
[K] b. exhaust valve temperature during intermediate sprints
adaptive pitch control with lambda min 1.45slow adaptive pitch controladaptive pitch control with lambda min 1.6baseline manoeuvre mode
Fig. 28. Air excess ratio and exhaust valve temperature during intermediatesprints from 0 to 5 kts, 5 to 10 kts, 10 to 15 kts and 15 kts to maximum speed foradaptive pitch control strategy with various settings and baseline manoeuvremode in design conditions.
5000 5200 5400 5600 5800 6000 6200 6400 66000
1
2
3
4
char
ge p
ress
ure
[bar
]
a. engine charge pressure during intermediate sprints
regular apcbaseline manoeuvre
3000 3020 3040 3060 3080 3100 3120 3140 3160 3180 3200time [s]
0
1
2
3
4
char
ge p
ress
ure
[bar
]
time [s]
b. engine charge pressure during slam start acceleration
regular apcbaseline manoeuvre
Fig. 29. Charge air during intermediate sprints from 0 to 5 kts, 5 to 10 kts, 10 to15 kts, and 15 kts to maximum ship speed and slam start acceleration forbaseline manoeuvre control strategy and adaptive pitch control strategy (apc)in design conditions.
R.D. Geertsma et al. Applied Energy 228 (2018) 2490–2509
2504
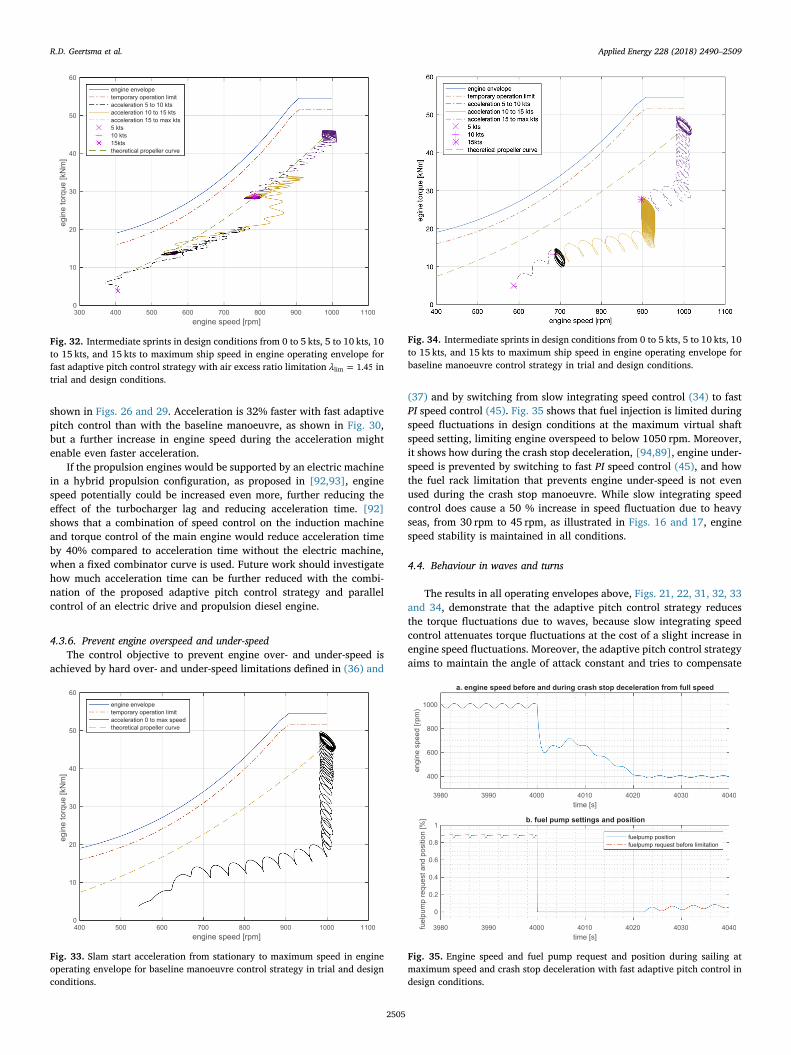
shown in Figs. 26 and 29. Acceleration is 32% faster with fast adaptivepitch control than with the baseline manoeuvre, as shown in Fig. 30,but a further increase in engine speed during the acceleration mightenable even faster acceleration.
If the propulsion engines would be supported by an electric machinein a hybrid propulsion configuration, as proposed in [92,93], enginespeed potentially could be increased even more, further reducing theeffect of the turbocharger lag and reducing acceleration time. [92]shows that a combination of speed control on the induction machineand torque control of the main engine would reduce acceleration timeby 40% compared to acceleration time without the electric machine,when a fixed combinator curve is used. Future work should investigatehow much acceleration time can be further reduced with the combi-nation of the proposed adaptive pitch control strategy and parallelcontrol of an electric drive and propulsion diesel engine.
4.3.6. Prevent engine overspeed and under-speedThe control objective to prevent engine over- and under-speed is
achieved by hard over- and under-speed limitations defined in (36) and
(37) and by switching from slow integrating speed control (34) to fastPI speed control (45). Fig. 35 shows that fuel injection is limited duringspeed fluctuations in design conditions at the maximum virtual shaftspeed setting, limiting engine overspeed to below 1050 rpm. Moreover,it shows how during the crash stop deceleration, [94,89], engine under-speed is prevented by switching to fast PI speed control (45), and howthe fuel rack limitation that prevents engine under-speed is not evenused during the crash stop manoeuvre. While slow integrating speedcontrol does cause a 50 % increase in speed fluctuation due to heavyseas, from 30 rpm to 45 rpm, as illustrated in Figs. 16 and 17, enginespeed stability is maintained in all conditions.
4.4. Behaviour in waves and turns
The results in all operating envelopes above, Figs. 21, 22, 31, 32, 33and 34, demonstrate that the adaptive pitch control strategy reducesthe torque fluctuations due to waves, because slow integrating speedcontrol attenuates torque fluctuations at the cost of a slight increase inengine speed fluctuations. Moreover, the adaptive pitch control strategyaims to maintain the angle of attack constant and tries to compensate
Fig. 34. Intermediate sprints in design conditions from 0 to 5 kts, 5 to 10 kts, 10to 15 kts, and 15 kts to maximum ship speed in engine operating envelope forbaseline manoeuvre control strategy in trial and design conditions.
3980 3990 4000 4010 4020 4030 4040time [s]
400
600
800
1000
engi
ne s
peed
[rpm
)
a. engine speed before and during crash stop deceleration from full speed
3980 3990 4000 4010 4020 4030 4040time [s]
0
0.2
0.4
0.6
0.8
1
fuel
pum
p re
ques
t and
pos
ition
[%] b. fuel pump settings and position
fuelpump positionfuelpump request before limitation
Fig. 35. Engine speed and fuel pump request and position during sailing atmaximum speed and crash stop deceleration with fast adaptive pitch control indesign conditions.
300 400 500 600 700 800 900 1000 1100engine speed [rpm]
0
10
20
30
40
50
60
egin
e to
rque
[kN
m]
engine envelopetemporary operation limitacceleration 5 to 10 ktsacceleration 10 to 15 ktsacceleration 15 to max kts5 kts10 kts15ktstheoretical propeller curve
Fig. 32. Intermediate sprints in design conditions from 0 to 5 kts, 5 to 10 kts, 10to 15 kts, and 15 kts to maximum ship speed in engine operating envelope forfast adaptive pitch control strategy with air excess ratio limitation =λ 1.45lim intrial and design conditions.
400 500 600 700 800 900 1000 1100engine speed [rpm]
0
10
20
30
40
50
60
egin
e to
rque
[kN
m]
engine envelopetemporary operation limitacceleration 0 to max speedtheoretical propeller curve
Fig. 33. Slam start acceleration from stationary to maximum speed in engineoperating envelope for baseline manoeuvre control strategy in trial and designconditions.
R.D. Geertsma et al. Applied Energy 228 (2018) 2490–2509
2505

the wake speed fluctuations from waves. However, due to the slowresponse of pitch actuation, the angle of attack during waves is not keptconstant. While faster pitch actuation might enable the adaptive pitchcontrol strategy to better maintain a constant angle of attack duringhigh frequency wake fluctuations, we expect that the adaptive pitchcontrol strategy can compensate for the relative slow wake speedfluctuations due to turns, particularly in stabilised conditions, as re-ported in [23, Fig. 3]. Moreover, the method to establish the angle ofattack as described in [33] also uses the assumption of constant pro-peller characteristics, which [23] suggests also to hold for estimatingthe effect in turns, even though effects such as non-uniform wake dis-tribution and oblique propeller inflow due to turns will have an impacton the accuracy of this assumption. Therefore, future work should beperformed, first with simulation models and subsequently with modelor full scale trials, to establish whether the adaptive pitch controlstrategy can also maintain the angle of attack in turns, thus reducingcavitation noise and increasing propeller and propulsion efficiency.
4.5. Measures of performance
The MOPs of the proposed adaptive pitch control strategy with andwithout a limited air excess ratio can now be compared with the MOPsof the transit and manoeuvre mode of the baseline control strategy asdiscussed in [24]. The fuel consumption plot for trial and design con-ditions, the air excess ratio plot for trial conditions, the cavitation plotsfor trial and design conditions and the angle of attack plot for trialconditions are shown in Figs. 36, 37, 38, 14, 15 and 39, for the threecontrol strategies. Moreover, the acceleration time, minimum air excessratio and maximum angle of attack of the transit and manoeuvre modeof the baseline control strategy and the proposed adaptive pitch controlstrategy with a limited air excess ratio are presented in Table 4.
From the comparison of the MOPs, we can draw the followingconclusions:
• The adaptive pitch control strategy reduces fuel consumption indesign conditions by 5–15% compared to the baseline transit modein the ship speed range from 6 to 15 kts, and by 5–30% compared tothe baseline manoeuvre mode in the speed range up to 15 kts. This is
2 4 6 8 10 12 14 16 18 20 22ship speed [kts]
1
1.5
2
2.5
3
3.5
4
4.5
air e
xces
s ra
tio
baseline transit modebaseline manoeuvring modeadaptive pitch control with limited air excessadaptive pitch control without limited air excess
Fig. 38. Air excess ratio plot as a function of ships speed for trial conditions inmanoeuvring and transit mode and with adaptive pitch control with andwithout limited air excess ratio.
2 4 6 8 10 12 14 16 18 20 22ship speed [kts]
-2
0
2
4
6
8
10
12
effe
ctiv
e an
gle
of a
ttack
baseline transit modebaseline manoeuvring modeadaptive pitch control with limited air excessadaptive pitch control without limited air excess
Fig. 39. Angle of attack plot from low speed to maximum speed for trial con-ditions in manoeuvring and transit mode and with adaptive pitch control withand without limited air excess ratio.
0 5 10 15 20 25ship speed [kts]
0
5
10
15
20
25
30
35
40
45
50
fuel
con
sum
ptio
n [1
000
kg/m
ile]
baseline transit modebaseline manoeuvring modeadaptive pitch control with limited air excessadaptive pitch control without limited air excess
Fig. 36. Fuel consumption plot as a function of ships speed for trial conditionsin manoeuvring and transit mode and with adaptive pitch control with andwithout limited air excess ratio.
0 5 10 15 20 25ship speed [kts]
0
5
10
15
20
25
30
35
40
45
50
fuel
con
sum
ptio
n [k
g/m
ile]
baseline transit modebaseline manoeuvring modeadaptive pitch control with limited air excessadaptive pitch control without limited air excess
Fig. 37. Fuel consumption plot as a function of ships speed for design condi-tions in manoeuvring and transit mode and with adaptive pitch control withand without limited air excess ratio.
R.D. Geertsma et al. Applied Energy 228 (2018) 2490–2509
2506

achieved by running the engine at the theoretical propeller curve onthe associated air excess ratio. When the air excess ratio is limited at1.6, in the engine speed range from 600 to 800 rpm the enginetorque is actually limited at a value below the theoretical propellercurve, causing a slight increase in fuel consumption of up to 2%,because the air excess ratio at 700 rpm on the propeller curve is 1.5,as shown in Fig. 9. Nevertheless, this would be a very conservativesetting as the theoretical propeller curve lies well within the oper-ating envelope of the engine.
• The adaptive pitch control strategy reduces acceleration time from 0to 15 kts with the slam start procedure by 32% compared to thebaseline manoeuvre mode and by 63% compared to the transitmode, while consistently maintaining the air excess ratio at aminimum value of 1.6. For an intermediate acceleration from 10 to15 kts, acceleration time reduces by 84%. While faster accelerationcan be achieved by using the slam start procedure [89], requestingmaximum virtual start speed in stead of the virtual shaft speed as-sociated with 15 kts, the adaptive pitch control strategy does pro-vide a more consistent acceleration time, also for intermediate ac-celeration, without thermally overloading the engine.
• During acceleration, the angle of attack is kept around the designvalue of 10.5 deg, as shown in Figs. 14–17. The wake flow fluctua-tion causes the angle of attack to fluctuate with a similar amplitudeas with the baseline control strategy.
In summary, the adaptive pitch control strategy accelerates muchfaster and much more consistently than the baseline manoeuvre mode,while also reducing fuel consumption significantly, without thermallyoverloading the engine and reducing cavitation risk for a propellerdesigned for low cavitation. Moreover, the control strategy does notneed operator input to switch between fuel efficient or manoeuvrableoperation.
5. Conclusions and future research
While shipping urgently needs to reduce its impact on the en-vironment due to emissions and noise, multifunction ships also need tomanoeuvre fast and accurate with a reliable propulsion plant to supportmore autonomous operation. This study has proposed an adaptive pitchcontrol strategy for diesel mechanical or hybrid propulsion with slowintegrating speed control and demonstrated the following: it robustlyfollows the requested virtual shaft speed; operates the propeller aroundits effective angle of attack; reduces fuel consumption and has the po-tential to improve NOx and particulate matter (PM) emissions; main-tains the air excess ratio λ at its required minimum value, thus limitingengine thermal loading; reduces acceleration time particularly duringintermediates sprints, due to its consistent acceleration behaviour; and
robustly prevents engine over- and under-speed. For the case studypatrol vessel, the adaptive pitch control strategy reduces fuel con-sumption by 5–15% compared to the baseline transit mode in the shipspeed range from 6 to 15 kts, and reduces acceleration time from 0 to15 kts with the slam start procedure by 32% compared to the baselinemanoeuvre mode and by 84% for an intermediate acceleration from 10to 15 kts, without thermally overloading the engine.
Future work should establish how much NOx and particulate matter(PM) emissions can be reduced with this strategy, as an initial analysisin this study suggests the proposed approach can be used to address thequasi-static trade-off between fuel consumption and NOx emissionsbased on static maps, and the smooth torque trajectory due to slowintegrating speed control is expected to have a positive impact on PMemissions. Moreover, the exact relation between charge pressure andengine thermal loading, indicated by exhaust valve and exhaust re-ceiver temperatures should be established with simulation studiesverified by experiments, to improve the fuel injection limitation thatprevents engine thermal overloading. Finally, the maximum accelera-tion improvement and fuel consumption reduction with hybrid pro-pulsion should be established, with an electric drive assisting the engineduring acceleration and allowing more freedom of control in operatingthe main engine at its best possible fuel consumption.
With the proposed adaptive control strategy and these additionalimprovements, the freedom of control provided by controllable pitchpropeller can be optimally utilised to contribute to the urgently re-quired reduction of the environmental impact of shipping, both due toemissions and noise, without operator input. Moreover, the improve-ments in acceleration performance and reduction in engine thermalloading ensure the ships can be used for its increasingly divers taskswithout operator input and with minimum time in port for main-tenance, thus supporting more autonomous operation.
Acknowledgement
This project is partially supported by project ‘ShipDrive: A NovelMethodology for Integrated Modelling, Control, and Optimization ofHybrid Ship Systems’ (project 13276) of the Netherlands Organisationfor Scientific Research (NWO), domain Applied and EngineeringSciences (TTW) and by the Royal Netherlands Navy. The RoyalNetherlands Navy supplied Fig. 2. Special thanks goes to dr. ArthurVrijdag for providing advice to improve the scientific quality andreadability of this article.
Appendix A. Supplementary data
Supplementary data associated with this article can be found, in theonline version, at https://doi.org/10.1016/j.apenergy.2018.07.080.
References
[1] UN. The emissions gap report 2017, Tech. rep. United Nations EnvironmentProgramme, November 2017.
[2] IMO MEPC 72. Initial strategy on greenhouse gas emissions from ship, Tech. rep.International Maritime Organisation (IMO), April 2018.
[3] Li S, Negenborn RR, Lodewijks G. Closed-loop coordination of inland vessels op-erations in large seaports using hybrid logic-based benders decomposition.Transport Res Part E: Logist Transport Rev 2017;97:1–21. https://doi.org/10.1016/j.tre.2016.10.013.
[4] Li S, Negenborn RR, Lodewijks G. Planning inland vessel operations in large sea-ports using a two-phase approach. Comp Indust Eng 2017;106:41–57. https://doi.org/10.1016/j.cie.2017.01.027.
[5] Zheng H, Negenborn RR, Lodewijks G. Closed-loop scheduling of waterborne AGVsfor energy-efficient inter terminal transport. Transport Res Part E: Logist TransportRev 2017;105:261–78. https://doi.org/10.1016/j.tre.2016.07.010.
[6] Zheng H, Negenborn RR, Lodewijks G. Fast ADMM for distributed model predictivecontrol of cooperative waterborne agvs. IEEE Trans Control Syst Technol2017;25(4):1406–13. https://doi.org/10.1109/TCST.2016.2599485.
[7] Chen L, Yip TL, Mou J. Provision of emission control area and the impact onshipping route choice and ship emissions. Transport Res Part D: Transport Environ2017, doi:https://doi.org/10.1016/jtrd.2017.07.003 [in press].
Table 4Acceleration time, minimum air excess ratio and maximum angle of attackduring acceleration with baseline control in manoeuvring (man) and transit(tran) mode compared with the proposed adaptive pitch control (apc) strategy(design condition).
Control strategy tran man apc Slow apc
Acceleration time (s): 0–5 kts 418 332 325 329Acceleration time (s): 5–10 kts 253 154 87 98Acceleration time (s): 10–15 kts 452 382 64 96Acceleration time (s): 0–15 kts 203 111 89 139Air excess ratio: 0–5 kts 2.43 2.50 1.93 2.07Air excess ratio: 5–10 kts 1.68 1.66 1.45 1.51Air excess ratio: 10–15 kts 1.69 1.62 1.45 1.45Air excess ratio: 0–15 kts 1.75 1.70 1.47 1.51Angle of attack (deg): 0–5 kts 13.6 10.0 12.5 12.7Angle of attack (deg): 5–10 kts 10.9 9.0 12.3 12.5Angle of attack (deg): 10–15 kts 10.8 9.1 11.4 11.7Angle of attack (deg): 0–15 kts 10.3 11.1 12.5 12.7
R.D. Geertsma et al. Applied Energy 228 (2018) 2490–2509
2507

[8] Vettor R, Guedes Soares C. Development of a ship weather routing system. OceanEng 2016;123:1014. https://doi.org/10.1016/j.oceaneng.2016.06.035.
[9] Perera LP, Soares CG. Weather routing and safe ship handling in the future ofshipping. Ocean Eng 2017;130:684–95. https://doi.org/10.1016/j.oceaneng.2016.09.007.
[10] Coraddu A, Figari M, Savio S. Numerical investigation on ship energy efficiency bymonte carlo simulation. Proc IMechE Part M: J Eng Marit Environ2014;228(3):220–34. https://doi.org/10.1177/1475090214524184.
[11] Roskilly AP, Palacin R, Yan J. Novel technologies and strategies for clean transportsystems. Appl Energy 2015;157:563–6. https://doi.org/10.1016/j.apenergy.2015.09.051.
[12] Taljegard M, Brynolf S, Grahn M, Andersson K, Johnson H. Cost-effective choices ofmarine fuels in a carbon-constrained world: results from a global energy model.Environ Sci Technol 2014;48:12986–93. https://doi.org/10.1021/es5018575.
[13] Brynolf S, Baldi F, Johnson H. Shipping and the environment. Berlin (Heidelberg):Springer; 2016. p. 295–339, doi:https://doi.org/10.1007/978-3-662-49045-7 [Ch.Energy Efficiency and Fuel Changes to Reduce Environmental Impacts].
[14] Shu G, Liang Y, Wei H, Zhao J, Liu l. A review of waste heat recovery on two-strokeic engine aboard ships. Renew Sustain Energy Rev 2013;19:385–401. https://doi.org/10.1016/j.rser.2012.11.034.
[15] Cignitti S, Andreasen JG, Haglind F, Woodley JM, Abildskov J. Integrated workingfluid-thermodynamic cycle design of organic rankine cycle power system for wasteheat recovery. Appl Energy 2017;203:442–53. https://doi.org/10.1016/j.apenergy.2017.06.031.
[16] Mondejar ME, Ahlgren F, Thern M, Genrup M. Quasi-steady state simulation of anorganic rankine cycle for waste heat recovery in a passenger vessel. Appl Energy2017;185(2):1324–35. https://doi.org/10.1016/j.apenergy.2016.03.024.
[17] Benvenuto G, Campora U, Trucco A. Comparison of ship planting layouts for powerand propulsion systems with energy recovery. J Mar Eng Technol 2014;13(3):3–15.https://doi.org/10.1080/20464177.2014.11658117.
[18] De La Fuente SS, Greig AR. Making shipping greener: comparative study betweenorganic fluids and water for rankine cycle waste heat recovery. J Mar Eng Technol2015;14:2:70–84. https://doi.org/10.1080/20464177.2015.1077601.
[19] Georgescu I, Godjevac M, Visser K. Efficiency constraints of energy storage for on-board power systems. Ocean Eng 2018;162:239–47. https://doi.org/10.1016/j.oceaneng.2018.05.004.
[20] Zahedi B, Norum LE, Ludwigsen KB. Optimised efficiency of all-electric ship by dchybrid power systems. J Power Sour 2014;255:341–54.
[21] Geertsma RD, Negenborn RR, Visser K, Hopman JJ. Design and control of hybridpower and propulsion systems for smart ships: a review of developments. ApplEnergy 2017;194:30–54. https://doi.org/10.1016/j.apenergy.2017.02.060.
[22] Schulten PJM, Geertsma RD, Visser K. Energy as a weapon, part 2. In: Proceedingsof the engine as a weapon VII conference. Bristol (UK); 2017.
[23] Coraddu A, Dubbioso G, Mauro S, Viviani M. Analysis of twin screw ships asym-petric propeller behaviour by means of free running model tests. Ocean Eng2013;68:47–64. https://doi.org/10.1016/j.oceaneng.2013.04.013.
[24] Geertsma RD, Negenborn RR, Visser K, Hopman JJ. Pitch control for ships withmechanical and hybrid propulsion: modelling, validation and performance quan-tification. Appl Energy 2017;206:1609–31. https://doi.org/10.1016/j.apenergy.2017.09.103.
[25] Klein Woud H, Stapersma D. Design of propulsion and electric power generationsystems. London (UK): IMarEST; 2012.
[26] Martelli M, Figari M. Real-time model-based design for CODLAG propulsion controlstrategies. Ocean Eng 2017;14:265–76. https://doi.org/10.1016/j.oceaneng.2017.06.029.
[27] Martelli M. Marine propulsion simulation. Warsaw/Berlin: De Gruyter Open Ltd;2014.
[28] Stapersma D. Matching propulsion engine with propulsor. J Mar Eng Technol2005;4(2):25–32.
[29] Coraddu A, Gaggero S, Villa D, Figari M. A new approach in engine-propellermatching. In: Proceedings of the 14th international congress of the internationalmaritime association of the mediterranean, IMAM 2011, vol. 2. p. 631–7.
[30] Vrijdag A, Stapersma D, van Terwisga T. Trade-offs in ship propulsion control:engine overloading and cavitation inception in operational conditions. In:Proceedings of the 9th international naval engineering conference. Hamburg(Germany); 2008. p. 82–93.
[31] Vrijdag A, Stapersma D, van Terwisga T. Control of propeller cavitation in opera-tional conditions. J Mar Eng Technol 2010;16:15–26. https://doi.org/10.1080/20464177.2010.11020228.
[32] Vrijdag A, Schulten PJM, Stapersma D, van Terwisga T. Efficient uncertainty ana-lysis of a complex multidisciplinary simulation model. J Mar Eng Technol 2007:10.
[33] Vrijdag A. Control of propeller cavitation in operational conditions, PhD thesis. TUDelft (The Netherlands): Faculty Mechanical, Maritime and Materials Engineering;2009.
[34] Vrijdag A, Stapersma D, van Terwisga T. Systematic modelling, verification, cali-bration and validation of a ship propulsion simulation model. Proc IMarEST Part A:J Mar Eng Technol 2009;8(15):3–20.
[35] Faber E. Some thoughts in diesel marine engineering. SNAME Trans1993;101:537–82.
[36] Stapersma D, Schulten PJM, Grimmelius HT. A fresh view on propulsion control. In:Proceedings of the 7th international naval engineering conference. Amsterdam (TheNetherlands); 2004. p. 221–40.
[37] Stapersma D, Vrijdag A, Grimmelius HT. A fresh view on propulsion control II. In:Proceedings of the 14th international ship control systems symposium. Ottawa(Canada); 2009.
[38] Van Spronsen P, Toussain R. An optimal control approach to preventing marine
diesel engine overloading aboard Karel Doorman class frigates. IFAC Proc Vol2001;34(7):23–30. https://doi.org/10.1016/S1474-6670(17)35130-3.
[39] Guillemette JR, Bussières P. Proposed optimal controller for the Canadian patrolfrigate diesel propulsion system. In: Proceedings of the 11th ship control systemssymposium. Southampton (UK); 1997. p. 507–30.
[40] Xiros N. Robust control of diesel ship propulsion. London (UK): Springer-Verlag;2002.
[41] Mizuno N, Miyazaki Y, Kudo Y. Marine engine control with multivariable adaptiveextremum control scheme. IFAC Proc Vol 2010:155–60. https://doi.org/10.3182/20100915-3-DE-3008.00042.
[42] Stefanopoulou A, Smith R. Maneuverability and smoke emission constraints inmarine diesel propulsion. Control Eng Pract 2000;8:1023–31.
[43] Nielsen KV, Blanke M, Eriksson L. Control-oriented model of molar scavenge oxygenfraction for exhaust recirculation in large diesel engines. Trans ASME, J DynamSyst, Measur Control 2017;139:0210071–9.
[44] Sorensen AJ, Smogeli ON. Torque and power control of electrically driven marinepropellers. Control Eng Pract 2009;17:1053–64. https://doi.org/10.1016/j.conengprac.2009.04.006.
[45] Smogeli ON, Sorensen AJ, Minsaas KJ. The concept of anti-spin thruster control.Control Eng Pract 2008;16:465–81. https://doi.org/10.1016/j.conengprac.2006.06.004.
[46] Bakkeheim J, Johansen TA, Smogelli ON, Sorensen AJ. Lyapunov-based integratorresetting with application to marine thruster control. IEEE Trans Control SystTechnol 2008;16(5):908–17. https://doi.org/10.1109/TCST.2007.916340.
[47] Sorensen AJ. Structural issues in the design and operation of marine control sys-tems. Ann Rev Control 2005;29:125–49. https://doi.org/10.1016/j.arcontrol.2004.12.001.
[48] Blanke M, Pivano L, Johansen TA. An efficiency optimizing propeller speed controlfor ships in moderate seas - model experiments and simulation. IFAC Proc Vol2007;7(1):329–36.
[49] Blanke M, Nielsen PB. The marine engine governor. In: Proceedings of the 2ndmaritime communications and control conference; 1990. p. 11–9.
[50] Geertsma RD, Negenborn RR, Visser K, Hopman JJ. Torque control for diesel me-chanical and hybrid propulsion for naval vessels. In: Proceedings of the 13th in-ternational naval engineering conference. Bristol (UK); 2016. p. 476–92.
[51] Kretschmann L, Burmeister H, Jahn C. Analyzing the economic benefit of unmannedautonomous ships: an exploratory cost-comparison between an autonomous and aconventional bulk carrier. Res Transport Bus Manage 2017;25:76–86. https://doi.org/10.1016/j.rtbm.2017.06.002.
[52] Colonna P, van Putten H. Dynamic modelling of steam power cycles. Part I -modelling paradigm and validation. Appl Therm Eng 2007;27(2):467–80. https://doi.org/10.1016/j.applthermaleng.2006.06.011.
[53] Schulten PJM, Stapersma D. Mean value modelling of the gas exchange of a 4-strokediesel engine for use in powertrain applications. In: SAE Technical Papers; 2003,doi:https://doi.org/10.4271/2003-01-0219.
[54] Theotokatos G. On the cycle mean value modelling of a large two-stroke marinediesel engine. Proc IMechE, Part M: J Eng Marit Environ 2010;224(3):193–205.https://doi.org/10.1243/14750902JEME188.
[55] Guan C, Theotokatos G, Zhou P, Chen H. Computational investigation of largecontainership propulsion engine operation at slow steaming conditions. ApplEnergy 2014;130:370–83. https://doi.org/10.1016/j.apenergy.2014.05.063.
[56] Sapra H, Godjevac M, Visser K, Stapersma D, Dijkstra C. Experimental and simu-lation-based investigations of marine diesel engine performance against static back-pressure. Appl Energy 2017;204:78–92. https://doi.org/10.1016/j.apenergy.2017.06.111.
[57] Baldi F, Theotokatos G, Andersson K. Development of a combined mean value-zerodimensional model and application for a large marine four-stroke diesel enginesimulation. Appl Energy 2015;154:402–15. https://doi.org/10.1016/j.apenergy.2015.05.024.
[58] Benvenuto G, Campora U. Dynamic simulation of a high-performance sequentiallyturbocharged marine diesel engine. Int J Engine Res 2002;3(3):115–25.
[59] Scappin F, Stefansson SH, Haglind F, Andreasen A, Larsen U. Validation of a zero-dimensional model for prediction of nox and engine performance for electronicallycontrolled marine two-stroke diesel engines. Appl Therm Eng 2012;37:252–344.https://doi.org/10.1016/j.applthermaleng.2011.11.047.
[60] Raptosasios S, Sakellaridis NF, Papagiannakis RG, Hountalas DT. Application of amulti-zone combustion model to investigate the nox reduction potential of two-stroke marine diesel engines using EGR. Appl Energy 2015;157:814–23. https://doi.org/10.1016/j.apenergy.2014.12.041.
[61] Pang KM, Karvounis N, Walther JH, Schramm J. Numerical investigation of sootformation and oxidation processes under large two-stroke marine diesel engine-likeconditions using integrated CFD-chemical kinetics. Appl Energy 2016;169:874–87.https://doi.org/10.1016/j.apenergy.2016.02.081.
[62] Godjevac M, Drijver J, de Vries L, Stapersma D. Evaluation of losses in maritimegearboxes. Proc IMechE, Part M: J Eng Marit Environ 2016;230(4):623–38. https://doi.org/10.1177/1475090215613814.
[63] Dang J, van den Boom H, Ligtelijn JT. The Wageningen C- and D-series propellers.In: Proceedings of the 12th FAST conference. Amsterdam (The Netherlands); 2013.
[64] Dang J, Brouwer J, Bosman R, Pouw C. Quasi-steady two-quadrant open water testsfor the Wageningen Propeller C- and D-series. In: Proceedings of the 29th sympo-sium on naval hydrodynamics. Gothenburg (Sweden); 2012.
[65] Grimmelius HT, Bakker JC, Wesselink AF. The use of non linear models in theanalysis of cpp actuator behaviour. In: Marine engineering systems. London (UK):IMarEST; 2006. p. 240–54.
[66] Wesselink AF, Stapersma D, van den Bosch D. Non-linear aspects of propeller pitchcontrol. In: Proceedings of the 8th international naval engineering conference.
R.D. Geertsma et al. Applied Energy 228 (2018) 2490–2509
2508

London (UK); 2006.[67] Godjevac. Wear and friction in a controllable pitch propeller, PhD thesis. Faculty
Mechanical, Maritime and Materials Engineering, Delft University of Technology;2009.
[68] Schulten PJM. The interaction between diesel engines, ship and propellers duringmanoeuvring, PhD thesis. Faculty Mechanical, Maritime and Materials Engineering,Delft University of Technology; 2005.
[69] Taskar B, Yum KK, Steen S, Pedersen E. The effect of waves on engine-propellerdynamics and propulsion performance of ships. Ocean Eng 2016;122:262–77.https://doi.org/10.1016/j.oceaneng.2016.06.034.
[70] Amini H, Steen S. Theoretical and experimental investigation of propeller shaftloads in transient conditions. Int Shipbuild Prog 2012;59:55–82. https://doi.org/10.3233/ISP-2012-0079.
[71] Gerritsma J, Beukelman W. Analysis of the resistance increase in waves of a fastcargo ship. Int Shipbuild Prog 1972;19(217):285–93.
[72] Gerritsma J. Bewegingen en sturen 1 - Golven, MT513, report 473-K. FacultyMechanical, Maritime and Materials Engineering, Delft University of Technology;1989.
[73] van Straaten OFA, de Boer MJ. Optimum propulsion engine configuration from fueleconomic point of view. In: Proceedings of the 11th international naval engineeringconference. Edinburgh (UK); 2012.
[74] Roedler GJ, Jones C. Technical measurement, a coll. project of PSM, INCOSE andindustry, Technical Report INCOSE-TP-2003-020-01 v1.0. INCOSE; 2005.
[75] Sciarretta A, Serrao L, Dewangan PC, Tona P, Bergshoeff END, Bordons C, et al. Acontrol benchmark on the energy management of a plug-in hybrid electric vehicle.Control Eng Pract 2014;29:287–98. https://doi.org/10.1016/j.conengprac.2013.11.020.
[76] Shi W. Dynamics of energy system behaviour and emissions of trailing suctionhopper dredgers, PhD thesis. The Netherlands: Faculty Mechanical, Maritime andMaterials Engineering, Delft University of Technology; 2013.
[77] Shi W, Grimmelius HT, Stapersma D. Analysis of ship propulsion system behaviourand the impact on fuel consumption. Int Shipbuild Prog 2010;57:35–64.
[78] MAN Diesel SE. Project guide for marine plants diesel engine 28/33d prelim., Tech.rep. Augsburg (Germany): MAN Diesel SE, May 2008.
[79] Geertsma RD, Vollbrandt J, Negenborn RR, Visser K, Hopman JJ. A quantitativecomparison of hybrid diesel-electric and gas-turbine-electric propulsion for futurefrigates. In: Proceedings of the 2017 IEEE electric ship technologies symposium;2017. p. 451–8.
[80] Grimmelius HT, Stapersma D. Control optimisation and load prediction for marinediesel engines using a mean value first principle model. In: Proceedings of the MS&TES conference. Newcastle-upon-Tyne (UK); 2000. p. 212–9.
[81] Grimmelius HT, Stapersma D. The impact of propulsion plant control on dieselengine thermal loading. In: Proceedings of the 22nd CIMAC world congress.Hamburg (Germany); 2001.
[82] Rubis CJ, Harper TR. Governing ship propulsion gas turbine engines. SNAME Trans1986;94:283–308.
[83] Astrom KJ, Hagglund T. The future of PID control. Control Eng Pract2001;9(11):1163–75. https://doi.org/10.1016/S0967-0661(01)00062-4.
[84] Ren Y, Li L, Brindley J, Jiang L. Nonlinear PI control for variable pitch wind turbine.Control Eng Pract 2016;50:84–94. https://doi.org/10.1016/j.conengprac.2016.02.004.
[85] de Boer M, Hardy I. Final dynamic simulations ps, Tech. Rep. E40800/E1200.58.Damen Schelde Naval Shipbuilding; 2011.
[86] Xiros NI. PID marine engine speed regulation under full load conditions for sensi-tivity −∞h norm specifications against propeller disturbance. J Mar Eng Technol2014;3(2):3–11. https://doi.org/10.1080/20464177.2004.11020179.
[87] Stapersma D, Vrijdag A. Linearisation of a ship propulsion system model. Ocean Eng2017;142:441–57. https://doi.org/10.1016/j.oceaneng.2017.07.014.
[88] Vrijdag A, Stapersma D. Extension and application of a linearised ship propulsionsystem model. Ocean Eng 2017;143:50–65. https://doi.org/10.1016/j.oceaneng.2017.07.023.
[89] Altosole M, Martelli M. Propulsion control strategies for ship emergency man-oeuvres. Ocean Eng 2017;137:99–109. https://doi.org/10.1016/j.oceaneng.2017.03.053.
[90] Haseltalab A, Negenborn R. Adaptive control for a class of partially unknown non-affine systems: applied to autonomous surface vessels. IFAC Proc Vol 2007;50-1:4252–7. https://doi.org/10.1016/j.ifacol.2017.08.830.
[91] Nuesch T, Wang M, Isenegger P, Onder CH, Steiner R, Macri-Lassus P, et al. Optimalenergy management for a diesel hybrid electric vehicle considering transient pmand quasi-static nox emissions. Control Eng Pract 2014;29:266–76. https://doi.org/10.1016/j.conengprac.2014.01.020.
[92] Geertsma RD, Negenborn RR, Visser K, Hopman JJ. Parallel control for hybridpropulsion of multifunction ships. IFAC Proc Vol 2017;50(1):2296–303. https://doi.org/10.1016/j.ifacol.2017.08.229.
[93] Topaloglou S, Paplambrou G, Kyrtatos N. Energy management controller design forhybrid ship propulsion during transient operation. In: Proceedings of the 28thCIMAC, 50. Helsinki (Finland); 2016. p. 1–9.
[94] Altosole M, Marteli M, Vignolo S. A mathematical model of the propeller pitchchange mechanism for the marine propulsion control design. In: Proceedings of the14th congress of the international maritime association of the Mediteranean 2.Genova (Italy); 2012. p. 649–56.
R.D. Geertsma et al. Applied Energy 228 (2018) 2490–2509
2509