
Adaptive Doubly Trained Evolution Control for the ...ceur-ws.org/Vol-1885/120.pdf · Adaptive...
9
Adaptive Doubly Trained Evolution Control for the Covariance Matrix Adaptation Evolution Strategy Zbynˇ ek Pitra 1,2,3 , Lukáš Bajer 3,4 , Jakub Repický 3,4 , and Martin Hole ˇ na 3 1 National Institute of Mental Health Topolová 748, 250 67 Klecany, Czech Republic [email protected] 2 Faculty of Nuclear Sciences and Physical Engineering, Czech Technical University in Prague Bˇ rehová 7, 115 19 Prague 1, Czech Republic 3 Institute of Computer Science, Academy of Sciences of the Czech Republic Pod Vodárenskou vˇ eží 2, 182 07 Prague 8, Czech Republic [email protected], [email protected], [email protected] 4 Faculty of Mathematics and Physics, Charles University in Prague Malostranské nám. 25, 118 00 Prague 1, Czech Republic Abstract: An area of increasingly frequent applications of evolutionary optimization to real-world problems is con- tinuous black-box optimization. However, evaluating real- world black-box fitness functions is sometimes very time- consuming or expensive, which interferes with the need of evolutionary algorithms for many fitness evaluations. Therefore, surrogate regression models replacing the orig- inal expensive fitness in some of the evaluated points have been in use since the early 2000s. The Doubly Trained Surrogate Covariance Matrix Adaptation Evolution Strat- egy (DTS-CMA-ES) represents a surrogate-assisted ver- sion of the state-of-the-art algorithm for continuous black- box optimization CMA-ES. The DTS-CMA-ES saves ex- pensive function evaluations through using a surrogate model. However, the model inaccuracy on some functions can slow-down the algorithm convergence. This paper in- vestigates an extension of DTS-CMA-ES which controls the usage of the model according to the model’s error. Results of testing an adaptive and the original version of DTS-CMA-ES on the set of noiseless benchmarks are re- ported. 1 Introduction Evolutionary algorithms have become very successful in continuous black-box optimization. That is, in optimiza- tion where no mathematical expression of the optimized function is available, neither an explicit nor implicit one, and it is necessary to empirically evaluate the fitness func- tions through series of measurements or simulations. Considering real-world applications, the evaluation of a black-box function can be very time-consuming or ex- pensive. Taking into account this property, the optimiza- tion method should evaluate as small amount of points as possible and still reach the target distance to the function optimal value. The Covariance Matrix Adaptation Evolution Strategy (CMA-ES) [4] is considered to be the state-of-the-art op- timization algorithm for continuous black-box optimiza- tion. On the other hand, the CMA-ES can consume many evaluations to find the optimum of the expensive fitness function. This property resulted in the development of several surrogate-assisted versions of the CMA-ES (an overview can be found in [11]), where a part of evalua- tions is performed by a regression surrogate model instead of the original fitness function. The local meta-model CMA-ES (lmm-CMA-ES), pro- posed in [7] and later improved in [1], builds a quadratic regression model for each point using a set of points already evaluated by the fitness function. The conver- gence of the algorithm is speeded-up by using a control of changes in population ranking after the fraction of the offspring is evaluated by the original fitness. A different surrogate-assisted approach, utilizing an or- dinal SVM to estimate the ranking of the fitness function values, called s* ACM-ES, has been introduced in [8] and later improved in BIPOP- s* ACM-ES-k [9] to be more ro- bust against premature convergence to local optima. The parameters of the SVM surrogate model are themselves optimized using the CMA-ES algorithm. In 2016, the Doubly Trained Surrogate CMA-ES (DTS- CMA-ES) algorithm, using the ability of Gaussian pro- cesses to provide the distribution of predicted points, was introduced in [10]. The algorithm employs uncertainty cri- teria to choose the most promising points to be evaluated by the original fitness. Results obtained with the three above-mentioned surrogate-assisted algorithms on noiseless functions [11] suggest that on some fitness functions (e. g., attractive sec- tor function) the surrogate model happens to suffer from a loss of accuracy. Whereas the first of these algorithms controls the number of points evaluated by the original fit- ness function to prevent the model from misleading the search, the DTS-CMA-ES has the amount of evaluated points fixed. Therefore, some control of the amount of points evaluated by the original fitness in each generation could speed-up the DTS-CMA-ES convergence. This paper extends the original DTS-CMA-ES with an online adaptation of the number of the points evaluated by the original fitness. This extended version of DTS- J. Hlavᡠcová (Ed.): ITAT 2017 Proceedings, pp. 120–128 CEUR Workshop Proceedings Vol. 1885, ISSN 1613-0073, c 2017 Z. Pitra, L. Bajer, J. Repický, M. Holeˇ na
Transcript of Adaptive Doubly Trained Evolution Control for the ...ceur-ws.org/Vol-1885/120.pdf · Adaptive...
Adaptive Doubly Trained Evolution Controlfor the Covariance Matrix Adaptation Evolution Strategy
Zbynek Pitra1,2,3, Lukáš Bajer3,4, Jakub Repický3,4, and Martin Holena3
1 National Institute of Mental HealthTopolová 748, 250 67 Klecany, Czech Republic
[email protected] Faculty of Nuclear Sciences and Physical Engineering, Czech Technical University in Prague
Brehová 7, 115 19 Prague 1, Czech Republic3 Institute of Computer Science, Academy of Sciences of the Czech Republic
Pod Vodárenskou veží 2, 182 07 Prague 8, Czech [email protected], [email protected], [email protected]
4 Faculty of Mathematics and Physics, Charles University in PragueMalostranské nám. 25, 118 00 Prague 1, Czech Republic
Abstract: An area of increasingly frequent applications ofevolutionary optimization to real-world problems is con-tinuous black-box optimization. However, evaluating real-world black-box fitness functions is sometimes very time-consuming or expensive, which interferes with the needof evolutionary algorithms for many fitness evaluations.Therefore, surrogate regression models replacing the orig-inal expensive fitness in some of the evaluated points havebeen in use since the early 2000s. The Doubly TrainedSurrogate Covariance Matrix Adaptation Evolution Strat-egy (DTS-CMA-ES) represents a surrogate-assisted ver-sion of the state-of-the-art algorithm for continuous black-box optimization CMA-ES. The DTS-CMA-ES saves ex-pensive function evaluations through using a surrogatemodel. However, the model inaccuracy on some functionscan slow-down the algorithm convergence. This paper in-vestigates an extension of DTS-CMA-ES which controlsthe usage of the model according to the model’s error.Results of testing an adaptive and the original version ofDTS-CMA-ES on the set of noiseless benchmarks are re-ported.
1 Introduction
Evolutionary algorithms have become very successful incontinuous black-box optimization. That is, in optimiza-tion where no mathematical expression of the optimizedfunction is available, neither an explicit nor implicit one,and it is necessary to empirically evaluate the fitness func-tions through series of measurements or simulations.
Considering real-world applications, the evaluation ofa black-box function can be very time-consuming or ex-pensive. Taking into account this property, the optimiza-tion method should evaluate as small amount of points aspossible and still reach the target distance to the functionoptimal value.
The Covariance Matrix Adaptation Evolution Strategy(CMA-ES) [4] is considered to be the state-of-the-art op-timization algorithm for continuous black-box optimiza-tion. On the other hand, the CMA-ES can consume many
evaluations to find the optimum of the expensive fitnessfunction. This property resulted in the development ofseveral surrogate-assisted versions of the CMA-ES (anoverview can be found in [11]), where a part of evalua-tions is performed by a regression surrogate model insteadof the original fitness function.
The local meta-model CMA-ES (lmm-CMA-ES), pro-posed in [7] and later improved in [1], builds a quadraticregression model for each point using a set of pointsalready evaluated by the fitness function. The conver-gence of the algorithm is speeded-up by using a controlof changes in population ranking after the fraction of theoffspring is evaluated by the original fitness.
A different surrogate-assisted approach, utilizing an or-dinal SVM to estimate the ranking of the fitness functionvalues, called s∗ACM-ES, has been introduced in [8] andlater improved in BIPOP-s∗ACM-ES-k [9] to be more ro-bust against premature convergence to local optima. Theparameters of the SVM surrogate model are themselvesoptimized using the CMA-ES algorithm.
In 2016, the Doubly Trained Surrogate CMA-ES (DTS-CMA-ES) algorithm, using the ability of Gaussian pro-cesses to provide the distribution of predicted points, wasintroduced in [10]. The algorithm employs uncertainty cri-teria to choose the most promising points to be evaluatedby the original fitness.
Results obtained with the three above-mentionedsurrogate-assisted algorithms on noiseless functions [11]suggest that on some fitness functions (e. g., attractive sec-tor function) the surrogate model happens to suffer froma loss of accuracy. Whereas the first of these algorithmscontrols the number of points evaluated by the original fit-ness function to prevent the model from misleading thesearch, the DTS-CMA-ES has the amount of evaluatedpoints fixed. Therefore, some control of the amount ofpoints evaluated by the original fitness in each generationcould speed-up the DTS-CMA-ES convergence.
This paper extends the original DTS-CMA-ES with anonline adaptation of the number of the points evaluatedby the original fitness. This extended version of DTS-
J. Hlavácová (Ed.): ITAT 2017 Proceedings, pp. 120–128CEUR Workshop Proceedings Vol. 1885, ISSN 1613-0073, c© 2017 Z. Pitra, L. Bajer, J. Repický, M. Holena
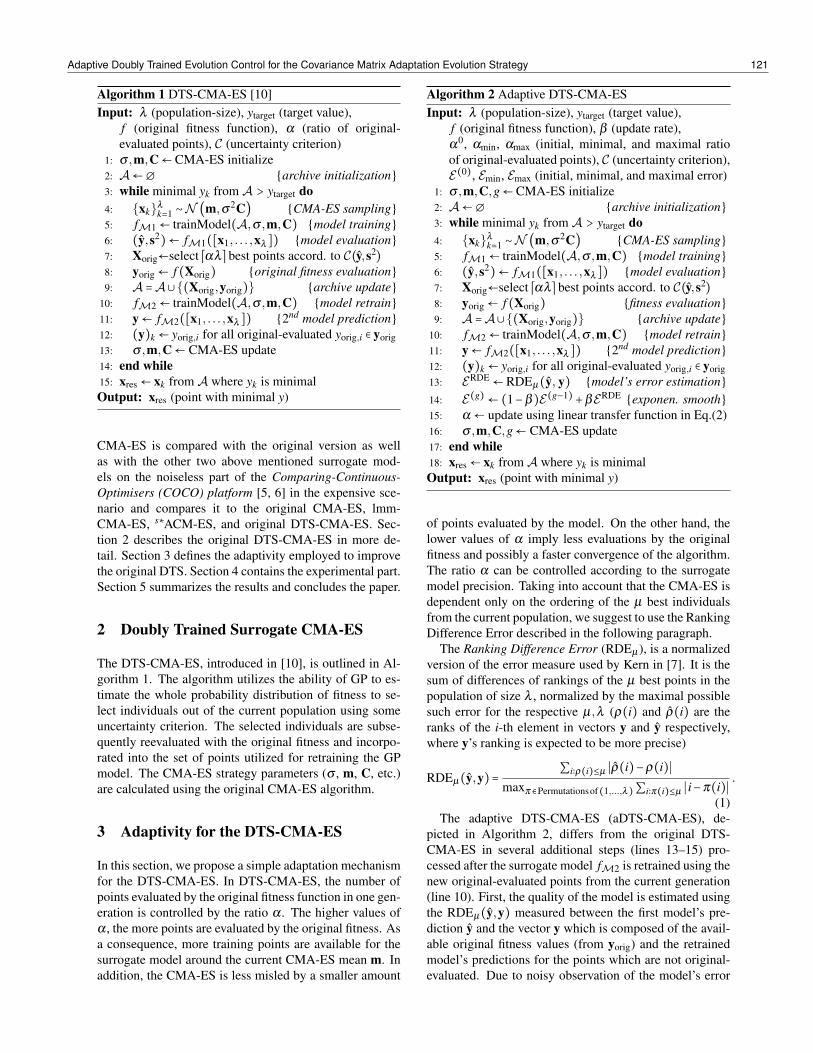
Algorithm 1 DTS-CMA-ES [10]Input: λ (population-size), ytarget (target value),
f (original fitness function), α (ratio of original-evaluated points), C (uncertainty criterion)
1: σ ,m,C←CMA-ES initialize2: A←∅ {archive initialization}3: while minimal yk from A > ytarget do4: {xk}λ
k=1 ∼N (m,σ2C) {CMA-ES sampling}5: fM1← trainModel(A,σ ,m,C) {model training}6: (y,s2)← fM1([x1, . . . ,xλ ]) {model evaluation}7: Xorig←select ⌈αλ⌉ best points accord. to C(y,s2)8: yorig← f (Xorig) {original fitness evaluation}9: A =A∪{(Xorig,yorig)} {archive update}
10: fM2← trainModel(A,σ ,m,C) {model retrain}11: y← fM2([x1, . . . ,xλ ]) {2nd model prediction}12: (y)k ← yorig,i for all original-evaluated yorig,i ∈ yorig13: σ ,m,C← CMA-ES update14: end while15: xres← xk from A where yk is minimalOutput: xres (point with minimal y)
CMA-ES is compared with the original version as wellas with the other two above mentioned surrogate mod-els on the noiseless part of the Comparing-Continuous-Optimisers (COCO) platform [5, 6] in the expensive sce-nario and compares it to the original CMA-ES, lmm-CMA-ES, s∗ACM-ES, and original DTS-CMA-ES. Sec-tion 2 describes the original DTS-CMA-ES in more de-tail. Section 3 defines the adaptivity employed to improvethe original DTS. Section 4 contains the experimental part.Section 5 summarizes the results and concludes the paper.
2 Doubly Trained Surrogate CMA-ES
The DTS-CMA-ES, introduced in [10], is outlined in Al-gorithm 1. The algorithm utilizes the ability of GP to es-timate the whole probability distribution of fitness to se-lect individuals out of the current population using someuncertainty criterion. The selected individuals are subse-quently reevaluated with the original fitness and incorpo-rated into the set of points utilized for retraining the GPmodel. The CMA-ES strategy parameters (σ , m, C, etc.)are calculated using the original CMA-ES algorithm.
3 Adaptivity for the DTS-CMA-ES
In this section, we propose a simple adaptation mechanismfor the DTS-CMA-ES. In DTS-CMA-ES, the number ofpoints evaluated by the original fitness function in one gen-eration is controlled by the ratio α . The higher values ofα , the more points are evaluated by the original fitness. Asa consequence, more training points are available for thesurrogate model around the current CMA-ES mean m. Inaddition, the CMA-ES is less misled by a smaller amount
Algorithm 2 Adaptive DTS-CMA-ESInput: λ (population-size), ytarget (target value),
f (original fitness function), β (update rate),α0, αmin, αmax (initial, minimal, and maximal ratioof original-evaluated points), C (uncertainty criterion),E(0), Emin, Emax (initial, minimal, and maximal error)
1: σ ,m,C,g←CMA-ES initialize2: A←∅ {archive initialization}3: while minimal yk from A > ytarget do4: {xk}λ
k=1 ∼N (m,σ2C) {CMA-ES sampling}5: fM1← trainModel(A,σ ,m,C) {model training}6: (y,s2)← fM1([x1, . . . ,xλ ]) {model evaluation}7: Xorig←select ⌈αλ⌉ best points accord. to C(y,s2)8: yorig← f (Xorig) {fitness evaluation}9: A =A∪{(Xorig,yorig)} {archive update}
10: fM2← trainModel(A,σ ,m,C) {model retrain}11: y← fM2([x1, . . . ,xλ ]) {2nd model prediction}12: (y)k ← yorig,i for all original-evaluated yorig,i ∈ yorig13: ERDE←RDEµ(y, y) {model’s error estimation}14: E(g)← (1−β)E(g−1)+βERDE {exponen. smooth}15: α ← update using linear transfer function in Eq.(2)16: σ ,m,C,g← CMA-ES update17: end while18: xres← xk from A where yk is minimalOutput: xres (point with minimal y)
of points evaluated by the model. On the other hand, thelower values of α imply less evaluations by the originalfitness and possibly a faster convergence of the algorithm.The ratio α can be controlled according to the surrogatemodel precision. Taking into account that the CMA-ES isdependent only on the ordering of the µ best individualsfrom the current population, we suggest to use the RankingDifference Error described in the following paragraph.
The Ranking Difference Error (RDEµ ), is a normalizedversion of the error measure used by Kern in [7]. It is thesum of differences of rankings of the µ best points in thepopulation of size λ , normalized by the maximal possiblesuch error for the respective µ,λ (ρ(i) and ρ(i) are theranks of the i-th element in vectors y and y respectively,where y’s ranking is expected to be more precise)
RDEµ(y,y)= ∑i∶ρ(i)≤µ ∣ρ(i)−ρ(i)∣maxπ ∈Permutationsof(1,...,λ)∑i∶π(i)≤µ ∣ i−π(i)∣ .
(1)The adaptive DTS-CMA-ES (aDTS-CMA-ES), de-
picted in Algorithm 2, differs from the original DTS-CMA-ES in several additional steps (lines 13–15) pro-cessed after the surrogate model fM2 is retrained using thenew original-evaluated points from the current generation(line 10). First, the quality of the model is estimated usingthe RDEµ(y,y) measured between the first model’s pre-diction y and the vector y which is composed of the avail-able original fitness values (from yorig) and the retrainedmodel’s predictions for the points which are not original-evaluated. Due to noisy observation of the model’s error
Adaptive Doubly Trained Evolution Control for the Covariance Matrix Adaptation Evolution Strategy 121
ERDE, we have employed exponential smoothing of themeasured error using the update rate β (line 14). As thenext step (line 15), α is calculated via linear transfer func-tion of E(g)
α =⎧⎪⎪⎪⎪⎨⎪⎪⎪⎪⎩
αmin E(g) ≤ Emin
αmin+ E(g)−EminEmax−Emin(αmax−αmin) E(g) ∈ (Emin,Emax)
αmax E(g) ≥ Emax
,
(2)where Emin and Emax are lower and upper bounds for satu-ration to the values of αmin and αmax respectively.
Having analyzed the RDEµ error measures on the CO-CO/BBOB testbed, we observed that the measured RDEerror E(g) depends on the ratio α and the dimension D:
Emin = f Emin(α,D), Emax = f Emax(α,D). (3)
Especially dependence on α is not surprising: from thedefinition of RDEµ follows that the more reevaluatedpoints, the higher number of summands in nominator of(1) and hence the higher RDEµ value. Due to mutual de-pendence of the parameters E and α , the calculation of αin each generation is performed in a cycle until conver-gence of α:
(1) calculate error thresholds Emin, Emax using the lastused ratio α – either from the previous iteration, orfrom the previous generation (see equation (3))
(2) calculate new ratio α using newly calculated Emin,Emax (see equation (2))
In our implementation, the functions f Emin and f Emin are re-sults of multiple linear regression – see section 4.1 for thedetails of these linear models. The remaining parts of thealgorithm are similar to the original DTS-CMA-ES.
4 Experimental Evaluation
In this section, we compared the performances of theaDTS-CMA-ES to the original DTS-CMA-ES [10], theCMA-ES [4], and two other surrogate-assisted versions ofthe CMA-ES, the lmm-CMA-ES [1, 7] and the s∗ACM-ES [9], on the noiseless part of the COCO/BBOB frame-work [5, 6].
4.1 Experimental Setup
The considered algorithms were evaluated using the24 noiseless COCO/BBOB single-objective bench-marks [5, 6] in dimensions D = 2,3,5 and 10 on 15different instances per function. The functions were di-vided into three groups according to the difficulty of theirmodeling with a GP model, where two groups were usedfor tuning aDTS-CMA-ES parameters and the remaininggroup was utilized to test the results of that tuning. Themethod of dividing the functions into those groups will be
described below in connection with the aDTS-CMA-ESsettings. The experiment stopping criteria were reachingeither the maximum budget of 250 function evaluationsper dimension (FE/D), or reaching the target distancefrom the function optimum ∆ fT = 10−8. The followingparagraphs summarize the parameters of the comparedalgorithms.
The original CMA-ES was tested in its IPOP-CMA-ESversion (Matlab code v. 3.61) with the following settings:the number of restarts = 4, IncPopSize = 2, σstart = 8
3 , λ =4+ ⌊3logD⌋. The remaining settings were left default.
The lmm-CMA-ES was employed in its improved ver-sion published in [1]. The results have been down-loaded from the COCO/BBOB results data archive 1 in itsGECCO 2013 settings.
We have used the bi-population version of the s∗ACM-ES, the BIPOP-s∗ACM-ES-k [9]. Similarly to the lmm-CMA-ES, the algorithm results have also been down-loaded from the COCO/BBOB results data archive2.
The original DTS-CMA-ES was tested using the overallbest settings from [10]: the prediction variance of Gaus-sian process model as the uncertainty criterion, the popu-lation size λ = 8+ ⌊6logD⌋, and the ratio of points eval-uated by the original fitness α = 0.05. The results of theDTS-CMA-ES are slightly different from previously pub-lished results [10, 11] due to a correction of a bug in theoriginal version which was affecting the selection of pointsto be evaluated by the original fitness using an uncertaintycriterion.
The aDTS-CMA-ES was tested with multiple settingsof parameters. First, the linear regression models of lowerand upper bounds for the error measure Emin, Emax wereidentified via measuring RDEµ on datasets from DTS-CMA-ES runs on the COCO/BBOB benchmarks.
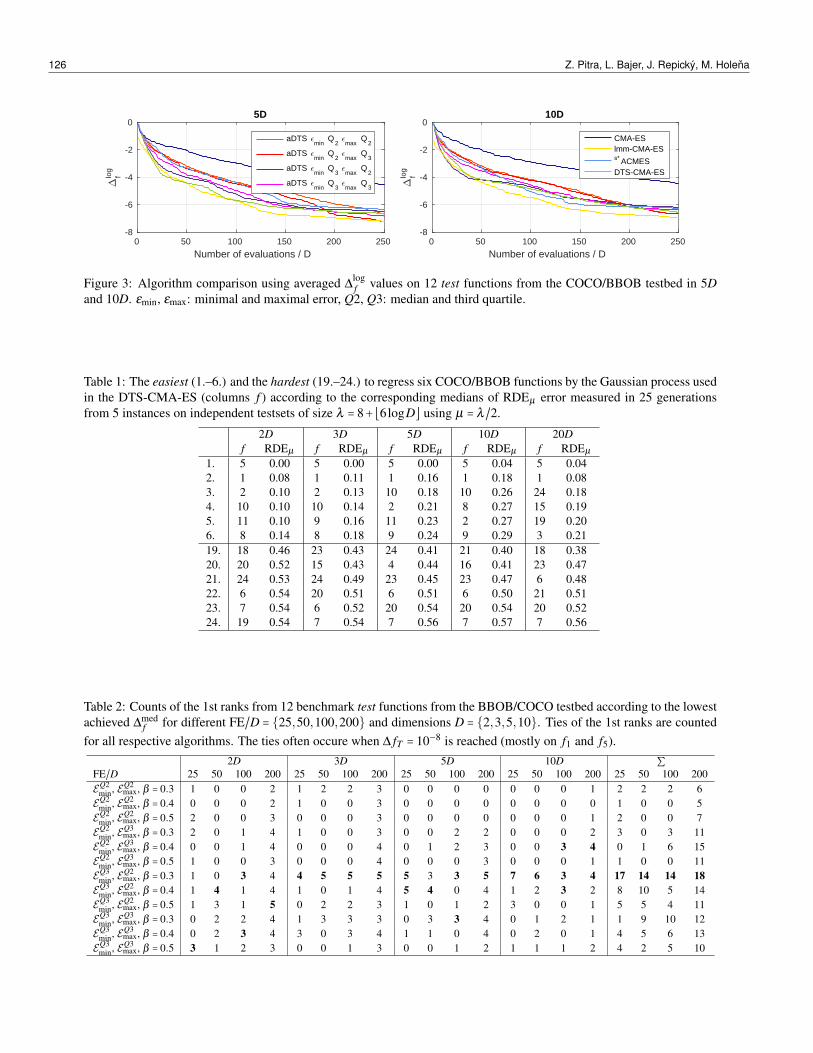
As a first step, we figured out six BBOB functionswhich are the easiest (E) and six which are the hardest(H) to regress by our Gaussian process model based on theRDEµ measured on 1250 independent testsets per func-tion in each dimension: 10 sets of λ points in each of25 equidistantly selected generations from the DTS-CMA-ES runs on the first 5 instances, see Table 1 for these sets offunctions and their respective errors. The functions whichwere not identified as E or H form the test function set.
Using the same 25 DTS-CMA-ES “snapshots” on eachof 5 instances, we calculated medians (Q2) and the thirdquartiles (Q3) of measured RDEµ on populations fromboth groups of functions (E) and (H), where we usedfive different proportions of original-evaluated points α ={0.04,0.25,0.5,0.75,1.00} which were available for re-trained models and thus also for measuring models’ er-rors E(g). These quartiles were regressed by multiple lin-ear regression models using stepwise regression from afull quadratic model of the ratio α and dimension D orits logarithm log(D) (decision whether to use log(D) or D
1http://coco.gforge.inria.fr/data-archive/2013/lmm-CMA-ES_auger_noiseless.tgz
2http://coco.gforge.inria.fr/data-archive/2013/BIPOP-saACM-k_loshchilov_noiseless.tgz
122 Z. Pitra, L. Bajer, J. Repický, M. Holena

was according to the RMSE of the final stepwise models);the stepwise regression was removing terms with the high-est p-value > 0.05. The coefficients EQ2
min and EQ3min of the
lower thresholds were estimated on the data from (E) andthe coefficients EQ2
max and EQ3max of the higher thresholds on
the data from (H), which resulted in the following models:
EQ2min(α,D) = (1 log(D) α α log(D) α2) ⋅ b1EQ3min(α,D) = (1 D α αD α2) ⋅ b2EQ2max(α,D) = (1 D α αD α2) ⋅ b3EQ3max(α,D) = (1 log(D) α α log(D) α2) ⋅ b4
where
b1 =⎛⎜⎜⎜⎜⎜⎝
0.11−0.0092−0.130.0440.14
⎞⎟⎟⎟⎟⎟⎠b2 =⎛⎜⎜⎜⎜⎜⎝
0.17−0.00067−0.0950.0087
0.15
⎞⎟⎟⎟⎟⎟⎠b3 =⎛⎜⎜⎜⎜⎜⎝
0.18−0.00270.44
0.0032−0.14
⎞⎟⎟⎟⎟⎟⎠b4 =⎛⎜⎜⎜⎜⎜⎝
0.35−0.0470.440.044−0.19
⎞⎟⎟⎟⎟⎟⎠.
For the remaining investigations, three different valuesof exponential smoothing update rate were used for com-parison β = {0.3, 0.4, 0.5}. The minimal and maximalvalues of α were set to αmin = 0.04 and αmax = 1.0 be-cause lower α values than 0.04 would yield to less thanone original-evaluated point per generation, and the aDTS-CMA-ES has to be able to spend the whole populationsfor the original evaluations in order to work well on func-tions where GP model is poor (e. g., on f6 Attractive sec-tor). The initial error and original ratio values were set toE(0) = 0.05 and α0 = 0.05. The rest of aDTS-CMA-ES pa-rameters were left the same as in the original DTS-CMA-ES settings.
4.2 Results
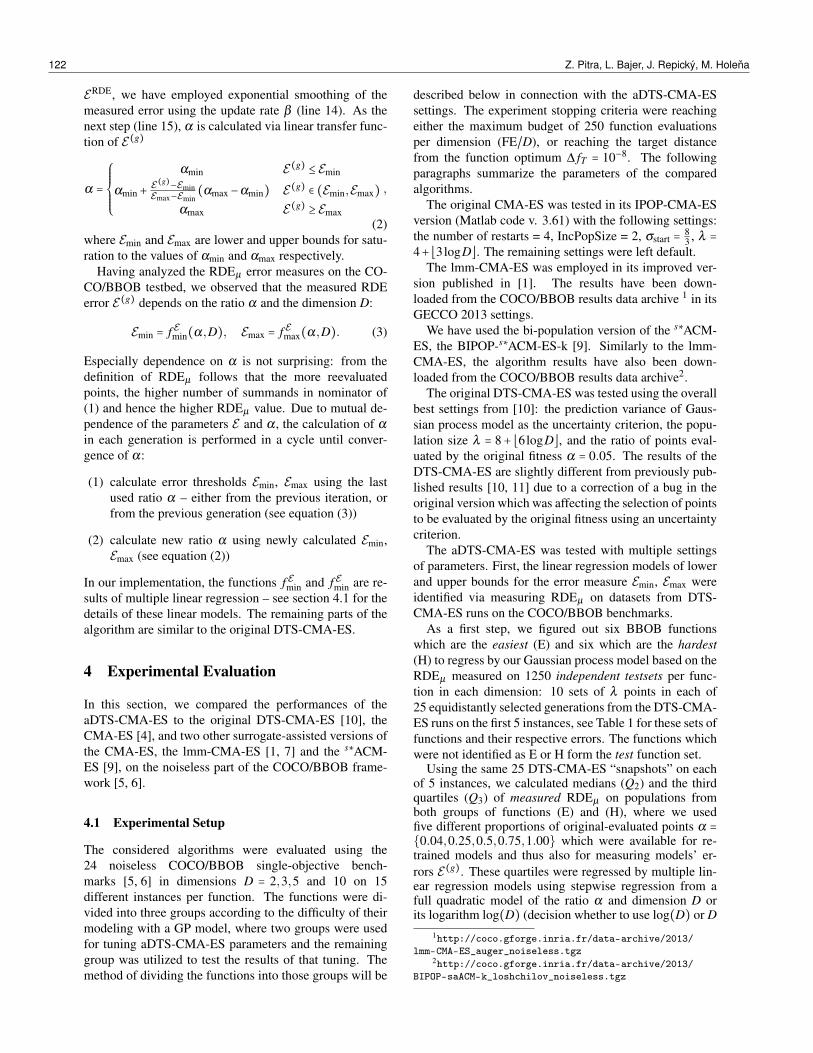
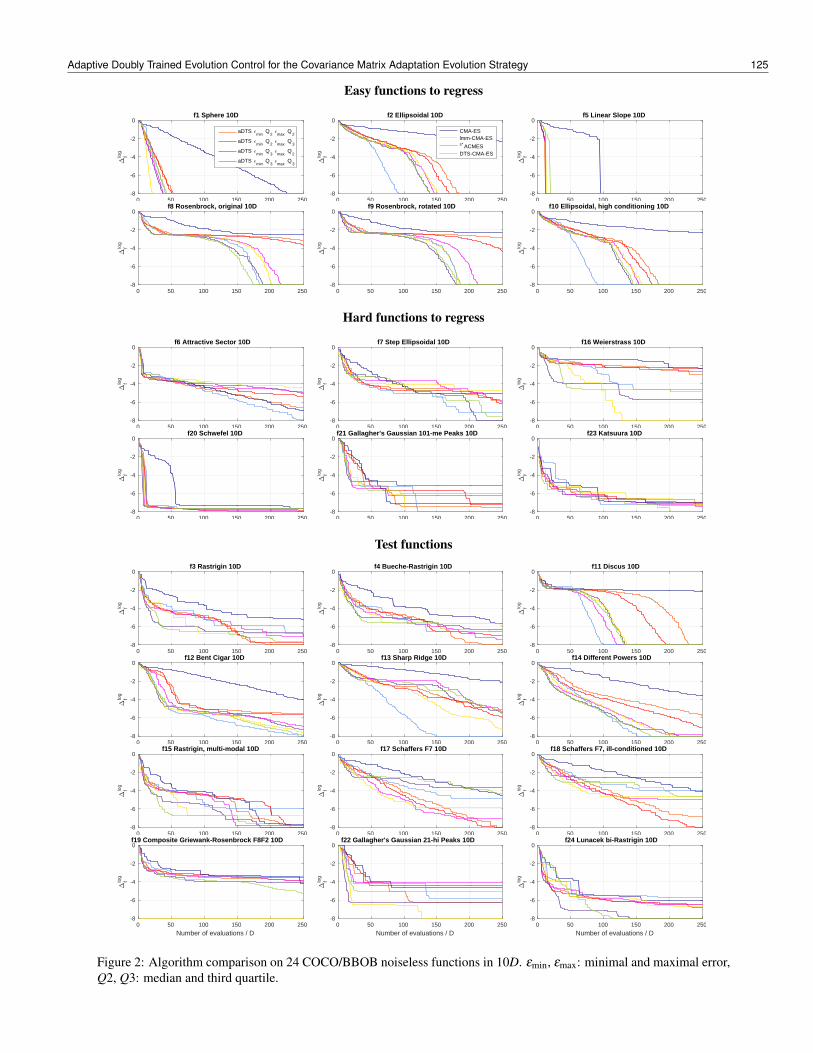
The results in Figures 1, 2, and 3 and in Table 3 showthe effect of adaptivity implemented in the DTS-CMA-ES. The graphs in Figures 1, 2 and 3 depict the scaledlogarithm ∆log
f of the median ∆medf of minimal distances
from the function optimum over runs on 15 independentinstances as a function of FE/D. The scaled logarithms of∆med
f are calculated as
∆logf = log∆med
f −∆MINf
∆MAXf −∆MIN
flog10 (1/10−8)+ log10 10−8
where ∆MINf (∆MAX
f ) is the minimum (maximum) log∆medf
found among all the compared algorithms for the particu-lar function f and dimension D between 0 and 250 FE/D.Such scaling enables the aggregation of ∆log
f graphs acrossarbitrary number of functions and dimensions (see Fig-ure 3). The values are scaled to the [−8,0] interval, where−8 corresponds to the minimal and 0 to the maximal dis-tance. This visualization has a better ability to distinguishthe differences in the convergence of tested algorithms
more than the default visualization used by the COCO/B-BOB platform and that is why it was used in this article.
We have tested the statistical significance of differencesin algorithms’ performance on 12 COCO/BBOB test func-tions in 10D for separately two evaluation budgets usingthe Iman and Davenport’s improvement of the Friedmantest [2]. Let #FET be the smallest number of functionevaluations on which at least one algorithm reached thetarget, i. e., satisfied ∆med
f ≤ ∆ fT , or #FET = 250D if no al-gorithm reached the target within 250D evaluations. Thealgorithms are ranked on each COCO/BBOB test functionwith respect to ∆med
f at a given budget of function eval-uations. The null hypothesis of equal performance of allalgorithms is rejected at a higher function evaluation bud-get #FEs = #FET (p < 10−3), as well as at a lower budget#FEs = #FET
3 (p < 10−3).We test pairwise differences in performance utiliz-
ing the post-hoc Friedman test [3] with the Bergmann-Hommel correction controlling the family-wise error incases when the null hypothesis of equal algorithms’ per-formance was rejected. To illustrate algorithms’ differ-ences, the numbers of test functions at which one algo-rithm achieved a higher rank than the other are reportedin Table 3. The table also contains the pairwise statisticalsignificances.
We have compared the performances of aDTS-CMA-ES using twelve settings differing in Emin, Emax, and β .Table 2 illustrates the counts of the 1st ranks of the com-pared settings according to the lowest achieved ∆med
f for25, 50, 100, and 200 FE/D respectively. The counts aresummed across the testing sets of benchmark functions ineach individual dimension.
Although the algorithm is rather robust to exact settingof smoothing update rate, we have found that the lowerthe β , the better the performance is usually observed (seeTable 2), and thus the following experiments use the rateβ = 0.3.
When comparing the convergence rate, the performanceof aDTS-CMA-ES with EQ2
min is noticeable lower especiallyon Rosenbrock’s functions ( f8, f9) and Different powersf14 where the RDEµ error often exceeds the lower er-ror threshold even if a lower number of original-evaluatedpoints would be sufficient for higher speedup of the CMA-ES. The adaptive control, on the other hand, helps es-pecially on the Attractive sector f6, which has the opti-mum in a point without continues derivatives and is there-fore hard-to-regress by GPs, or on Shaffers’ functions f17,f18 where the aDTS-CMA-ES is probably able to adaptto multimodal neighbourhood around function’s optimumand performs best of all the compared algorithms. Withinthe budget of 250 FE/D, the aDTS-CMA-ES (especiallywith EQ2
min) is also able to find one of the best fitness valueon regularly multimodal Rastrigin functions f3, f4 or f15where the GP model apparently does not prevent the orig-inal CMA-ES from exploiting the global structure of afunction.
Adaptive Doubly Trained Evolution Control for the Covariance Matrix Adaptation Evolution Strategy 123
Easy functions to regress
0 50 100 150 200 250
Number of evaluations / D
-8
-6
-4
-2
0
"flo
g
f1 Sphere 5D
aDTS 0min
Q2 0
max Q
2
aDTS 0min
Q2 0
max Q
3
aDTS 0min
Q3 0
max Q
2
aDTS 0min
Q3 0
max Q
3
0 50 100 150 200 250
Number of evaluations / D
-8
-6
-4
-2
0
"flo
g
f2 Ellipsoidal 5D
CMA-ESlmm-CMA-ESs* ACMESDTS-CMA-ES
0 50 100 150 200 250
Number of evaluations / D
-8
-6
-4
-2
0
"flo
g
f5 Linear Slope 5D
0 50 100 150 200 250
Number of evaluations / D
-8
-6
-4
-2
0
"flo
g
f9 Rosenbrock, rotated 5D
0 50 100 150 200 250
Number of evaluations / D
-8
-6
-4
-2
0
"flo
g
f10 Ellipsoidal, high conditioning 5D
0 50 100 150 200 250
Number of evaluations / D
-8
-6
-4
-2
0
"flo
g
f11 Discus 5D
Hard functions to regress
0 50 100 150 200 250
Number of evaluations / D
-8
-6
-4
-2
0
"flo
g
f4 Bueche-Rastrigin 5D
0 50 100 150 200 250
Number of evaluations / D
-8
-6
-4
-2
0
"flo
g
f6 Attractive Sector 5D
0 50 100 150 200 250
Number of evaluations / D
-8
-6
-4
-2
0
"flo
g
f7 Step Ellipsoidal 5D
0 50 100 150 200 250
Number of evaluations / D
-8
-6
-4
-2
0
"flo
g
f20 Schwefel 5D
0 50 100 150 200 250
Number of evaluations / D
-8
-6
-4
-2
0
"flo
g
f23 Katsuura 5D
0 50 100 150 200 250
Number of evaluations / D
-8
-6
-4
-2
0
"flo
g
f24 Lunacek bi-Rastrigin 5D
Test functions
0 50 100 150 200 250
Number of evaluations / D
-8
-6
-4
-2
0
"flo
g
f3 Rastrigin 5D
0 50 100 150 200 250
Number of evaluations / D
-8
-6
-4
-2
0
"flo
g
f8 Rosenbrock, original 5D
0 50 100 150 200 250
Number of evaluations / D
-8
-6
-4
-2
0
"flo
g
f12 Bent Cigar 5D
0 50 100 150 200 250
Number of evaluations / D
-8
-6
-4
-2
0
"flo
g
f13 Sharp Ridge 5D
0 50 100 150 200 250
Number of evaluations / D
-8
-6
-4
-2
0
"flo
g
f14 Different Powers 5D
0 50 100 150 200 250
Number of evaluations / D
-8
-6
-4
-2
0
"flo
g
f15 Rastrigin, multi-modal 5D
0 50 100 150 200 250
Number of evaluations / D
-8
-6
-4
-2
0
"flo
g
f16 Weierstrass 5D
0 50 100 150 200 250
Number of evaluations / D
-8
-6
-4
-2
0
"flo
g
f17 Schaffers F7 5D
0 50 100 150 200 250
Number of evaluations / D
-8
-6
-4
-2
0
"flo
g
f18 Schaffers F7, ill-conditioned 5D
0 50 100 150 200 250
Number of evaluations / D
-8
-6
-4
-2
0
"flo
g
f19 Composite Griewank-Rosenbrock F8F2 5D
0 50 100 150 200 250
Number of evaluations / D
-8
-6
-4
-2
0
"flo
g
f21 Gallagher's Gaussian 101-me Peaks 5D
0 50 100 150 200 250
Number of evaluations / D
-8
-6
-4
-2
0
"flo
g
f22 Gallagher's Gaussian 21-hi Peaks 5D
Figure 1: Algorithm comparison on 24 COCO/BBOB noiseless functions in 5D. εmin, εmax: minimal and maximal error,Q2, Q3: median and third quartile.
124 Z. Pitra, L. Bajer, J. Repický, M. Holena
Easy functions to regress
0 50 100 150 200 250
Number of evaluations / D
-8
-6
-4
-2
0"
flog
f1 Sphere 10D
aDTS 0min
Q2 0
max Q
2
aDTS 0min
Q2 0
max Q
3
aDTS 0min
Q3 0
max Q
2
aDTS 0min
Q3 0
max Q
3
0 50 100 150 200 250
Number of evaluations / D
-8
-6
-4
-2
0
"flo
g
f2 Ellipsoidal 10D
CMA-ESlmm-CMA-ESs* ACMESDTS-CMA-ES
0 50 100 150 200 250
Number of evaluations / D
-8
-6
-4
-2
0
"flo
g
f5 Linear Slope 10D
0 50 100 150 200 250
Number of evaluations / D
-8
-6
-4
-2
0
"flo
g
f8 Rosenbrock, original 10D
0 50 100 150 200 250
Number of evaluations / D
-8
-6
-4
-2
0
"flo
g
f9 Rosenbrock, rotated 10D
0 50 100 150 200 250
Number of evaluations / D
-8
-6
-4
-2
0
"flo
g
f10 Ellipsoidal, high conditioning 10D
Hard functions to regress
0 50 100 150 200 250
Number of evaluations / D
-8
-6
-4
-2
0
"flo
g
f6 Attractive Sector 10D
0 50 100 150 200 250
Number of evaluations / D
-8
-6
-4
-2
0
"flo
g
f7 Step Ellipsoidal 10D
0 50 100 150 200 250
Number of evaluations / D
-8
-6
-4
-2
0
"flo
g
f16 Weierstrass 10D
0 50 100 150 200 250
Number of evaluations / D
-8
-6
-4
-2
0
"flo
g
f20 Schwefel 10D
0 50 100 150 200 250
Number of evaluations / D
-8
-6
-4
-2
0
"flo
g
f21 Gallagher's Gaussian 101-me Peaks 10D
0 50 100 150 200 250
Number of evaluations / D
-8
-6
-4
-2
0
"flo
g
f23 Katsuura 10D
Test functions
0 50 100 150 200 250
Number of evaluations / D
-8
-6
-4
-2
0
"flo
g
f3 Rastrigin 10D
0 50 100 150 200 250
Number of evaluations / D
-8
-6
-4
-2
0
"flo
g
f4 Bueche-Rastrigin 10D
0 50 100 150 200 250
Number of evaluations / D
-8
-6
-4
-2
0
"flo
g
f11 Discus 10D
0 50 100 150 200 250
Number of evaluations / D
-8
-6
-4
-2
0
"flo
g
f12 Bent Cigar 10D
0 50 100 150 200 250
Number of evaluations / D
-8
-6
-4
-2
0
"flo
g
f13 Sharp Ridge 10D
0 50 100 150 200 250
Number of evaluations / D
-8
-6
-4
-2
0
"flo
g
f14 Different Powers 10D
0 50 100 150 200 250
Number of evaluations / D
-8
-6
-4
-2
0
"flo
g
f15 Rastrigin, multi-modal 10D
0 50 100 150 200 250
Number of evaluations / D
-8
-6
-4
-2
0
"flo
g
f17 Schaffers F7 10D
0 50 100 150 200 250
Number of evaluations / D
-8
-6
-4
-2
0
"flo
g
f18 Schaffers F7, ill-conditioned 10D
0 50 100 150 200 250
Number of evaluations / D
-8
-6
-4
-2
0
"flo
g
f19 Composite Griewank-Rosenbrock F8F2 10D
0 50 100 150 200 250
Number of evaluations / D
-8
-6
-4
-2
0
"flo
g
f22 Gallagher's Gaussian 21-hi Peaks 10D
0 50 100 150 200 250
Number of evaluations / D
-8
-6
-4
-2
0
"flo
g
f24 Lunacek bi-Rastrigin 10D
Figure 2: Algorithm comparison on 24 COCO/BBOB noiseless functions in 10D. εmin, εmax: minimal and maximal error,Q2, Q3: median and third quartile.
Adaptive Doubly Trained Evolution Control for the Covariance Matrix Adaptation Evolution Strategy 125
0 50 100 150 200 250
Number of evaluations / D
-8
-6
-4
-2
0"
flog
5D
aDTS 0min
Q2 0
max Q
2
aDTS 0min
Q2 0
max Q
3
aDTS 0min
Q3 0
max Q
2
aDTS 0min
Q3 0
max Q
3
0 50 100 150 200 250
Number of evaluations / D
-8
-6
-4
-2
0
"flo
g
10D
CMA-ESlmm-CMA-ESs* ACMESDTS-CMA-ES
Figure 3: Algorithm comparison using averaged ∆logf values on 12 test functions from the COCO/BBOB testbed in 5D
and 10D. εmin, εmax: minimal and maximal error, Q2, Q3: median and third quartile.
Table 1: The easiest (1.–6.) and the hardest (19.–24.) to regress six COCO/BBOB functions by the Gaussian process usedin the DTS-CMA-ES (columns f ) according to the corresponding medians of RDEµ error measured in 25 generationsfrom 5 instances on independent testsets of size λ = 8+ ⌊6logD⌋ using µ = λ/2.
2D 3D 5D 10D 20Df RDEµ f RDEµ f RDEµ f RDEµ f RDEµ
1. 5 0.00 5 0.00 5 0.00 5 0.04 5 0.042. 1 0.08 1 0.11 1 0.16 1 0.18 1 0.083. 2 0.10 2 0.13 10 0.18 10 0.26 24 0.184. 10 0.10 10 0.14 2 0.21 8 0.27 15 0.195. 11 0.10 9 0.16 11 0.23 2 0.27 19 0.206. 8 0.14 8 0.18 9 0.24 9 0.29 3 0.2119. 18 0.46 23 0.43 24 0.41 21 0.40 18 0.3820. 20 0.52 15 0.43 4 0.44 16 0.41 23 0.4721. 24 0.53 24 0.49 23 0.45 23 0.47 6 0.4822. 6 0.54 20 0.51 6 0.51 6 0.50 21 0.5123. 7 0.54 6 0.52 20 0.54 20 0.54 20 0.5224. 19 0.54 7 0.54 7 0.56 7 0.57 7 0.56
Table 2: Counts of the 1st ranks from 12 benchmark test functions from the BBOB/COCO testbed according to the lowestachieved ∆med
f for different FE/D = {25,50,100,200} and dimensions D = {2,3,5,10}. Ties of the 1st ranks are countedfor all respective algorithms. The ties often occure when ∆ fT = 10−8 is reached (mostly on f1 and f5).
2D 3D 5D 10D ∑FE/D 25 50 100 200 25 50 100 200 25 50 100 200 25 50 100 200 25 50 100 200EQ2
min, EQ2max, β = 0.3 1 0 0 2 1 2 2 3 0 0 0 0 0 0 0 1 2 2 2 6EQ2
min, EQ2max, β = 0.4 0 0 0 2 1 0 0 3 0 0 0 0 0 0 0 0 1 0 0 5EQ2
min, EQ2max, β = 0.5 2 0 0 3 0 0 0 3 0 0 0 0 0 0 0 1 2 0 0 7EQ2
min, EQ3max, β = 0.3 2 0 1 4 1 0 0 3 0 0 2 2 0 0 0 2 3 0 3 11EQ2
min, EQ3max, β = 0.4 0 0 1 4 0 0 0 4 0 1 2 3 0 0 3 4 0 1 6 15EQ2
min, EQ3max, β = 0.5 1 0 0 3 0 0 0 4 0 0 0 3 0 0 0 1 1 0 0 11EQ3
min, EQ2max, β = 0.3 1 0 3 4 4 5 5 5 5 3 3 5 7 6 3 4 17 14 14 18EQ3
min, EQ2max, β = 0.4 1 4 1 4 1 0 1 4 5 4 0 4 1 2 3 2 8 10 5 14EQ3
min, EQ2max, β = 0.5 1 3 1 5 0 2 2 3 1 0 1 2 3 0 0 1 5 5 4 11EQ3
min, EQ3max, β = 0.3 0 2 2 4 1 3 3 3 0 3 3 4 0 1 2 1 1 9 10 12EQ3
min, EQ3max, β = 0.4 0 2 3 4 3 0 3 4 1 1 0 4 0 2 0 1 4 5 6 13EQ3
min, EQ3max, β = 0.5 3 1 2 3 0 0 1 3 0 0 1 2 1 1 1 2 4 2 5 10
126 Z. Pitra, L. Bajer, J. Repický, M. Holena
Table 3: A pairwise comparison of the algorithms on 12 test functions in 10D over the COCO/BBOB for differentevaluation budgets. The number of wins of i-th algorithm against j-th algorithm over all benchmark functions is givenin i-th row and j-th column. The asterisk marks the row algorithm being significantly better than the column algorithmaccording to the Friedman post-hoc test with the Bergmann-Hommel correction at family-wise significance level α = 0.05.
111000DDDEQ2
min,EQ2max
EQ2min,EQ3max
EQ3min,EQ2max
EQ3min,EQ3max
CMA-ES
lmm-CMA-
ES
s∗ACM-ES
DTS-CMA-
ES
#FEs⁄#FET1⁄3 1 1⁄3 1 1⁄3 1 1⁄3 1 1⁄3 1 1⁄3 1 1⁄3 1 1⁄3 1
EQ2min, EQ2
max— — 6 5 4 6 4 8 12 11 2 5 6 8 3 7
EQ2min, EQ3
max 6 7 — — 3 5 5 6 11 10 2 6 7 7 2 5
EQ3min, EQ2
max 8 6 9 7 — — 7 7 12∗ 9 4 5 8 5 3 2
EQ3min, EQ3
max 8 4 7 6 5 5 — — 11∗ 10 4 6 9 7 4 4
CMA-ES 0 1 1 2 0 3 1 2 — — 1 1 2 4 0 1
lmm-CMA-ES 10 7 10 6 8 7 8 6 11∗ 11 — — 10 6 7 5
s∗ACM-ES 6 4 5 5 4 7 3 5 10 8 2 6 — — 3 7
DTS-CMA-ES 9 5 10 7 9 10 8 8 12∗ 11∗ 5 7 9 5 — —
5 Conclusions & Future work
In this paper, we have presented a work-in-progress onadaptive version of the surrogate-assisted optimization al-gorithm DTS-CMA-ES. The online adjustment of the ratiobetween the original- and model-evaluated points accord-ing to the error of the surrogate model is investigated. Thenew adaptive version of the algorithm employs RDEµ be-tween the fitness of current population predicted using thefirst-trained model and the retrained model.
Results of parameter tunning show that lower valuesof the exponential smoothing rate β provide better re-sults. On the other hand, different combinations of slowerand more rapid update behaviours bring better CMA-ESspeedup for different kinds of functions, and choice ofthis parameter could depend on the experimenter’s domainknowledge. We found that the adaptive approach speedsup the CMA-ES more than three other surrogate CMA-ESalgorithms, namely DTS-CMA-ES, s∗ACM-ES, and lmm-CMA-ES, on several functions after roughly 150 FE/D.
The adaptivity of the DTS-CMA-ES is still, to a certainextent, work in progress. A future perspective of improv-ing aDTS-CMA-ES is to additionally investigate differenttypes and properties of adaptive control of the number ofpoints evaluated by the original fitness in each generation.Another conceivable direction of future research can befound in online switching between different types of sur-rogate models suitable for the aDTS-CMA-ES.
Acknowledgements
The reported research was supported by the Czech ScienceFoundation grant No. 17-01251, by the Grant Agency ofthe Czech Technical University in Prague with its grantNo. SGS17/193/OHK4/3T/14, and by the project Nr.LO1611 with a financial support from the MEYS underthe NPU I program. Further, access to computing and stor-age facilities owned by parties and projects contributing tothe National Grid Infrastructure MetaCentrum, providedunder the programme “Projects of Large Infrastructure forResearch, Development, and Innovations” (LM2010005),is greatly appreciated.
References
[1] A. Auger, D. Brockhoff, and N. Hansen. Benchmarking thelocal metamodel CMA-ES on the noiseless BBOB’2013test bed. In Proceedings of the GECCO ’13 Companion,2013.
[2] J. Demšar. Statistical comparisons of classifiers over multi-ple data sets. Journal of Machine Learning Research, 7:1–30, 2006.
[3] S. García and F. Herrera. An extension on "statistical com-parisons of classifiers over multiple data sets" for all pair-wise comparisons. Journal of Machine Learning Research,9:2677–2694, 2008.
Adaptive Doubly Trained Evolution Control for the Covariance Matrix Adaptation Evolution Strategy 127
[4] N. Hansen. The CMA Evolution Strategy: A Compar-ing Review. In Towards a New Evolutionary Computation,number 192, pages 75–102. Springer, 2006.
[5] N. Hansen, A. Auger, S. Finck, and R. Ros. Real-parameterblack-box optimization benchmarking 2012: Experimentalsetup. Technical report, INRIA, 2012.
[6] N. Hansen, S. Finck, R. Ros, and A. Auger. Real-parameterblack-box optimization benchmarking 2009: Noiselessfunctions definitions. Technical Report RR-6829, INRIA,2009. Updated February 2010.
[7] S. Kern, N. Hansen, and P. Koumoutsakos. Local Meta-models for Optimization Using Evolution Strategies. InPPSN IX Proceedings, volume 4193 of Lecture Notes inComputer Science, pages 939–948. Springer, 2006.
[8] I. Loshchilov, M. Schoenauer, and M. Sebag. Self-adaptivesurrogate-assisted covariance matrix adaptation evolutionstrategy. In Proceedings of the GECCO ’12, pages 321–328. ACM, 2012.
[9] I. Loshchilov, M. Schoenauer, and M. Sebag. BI-population CMA-ES Algorithms with Surrogate Modelsand Line Searches. In Proceedings of the GECCO ’13Companion, pages 1177–1184. ACM Press, 2013.
[10] Z. Pitra, L. Bajer, and M. Holena. Doubly trained evolutioncontrol for the Surrogate CMA-ES. In PPSN XIV Proceed-ings, pages 59–68. Springer, 2016.
[11] Z. Pitra, L. Bajer, J. Repický, and M. Holena. Overviewof surrogate-model versions of covariance matrix adapta-tion evolution strategy. In Proceedings of the GECCO ’17Companion. ACM, 2017.
128 Z. Pitra, L. Bajer, J. Repický, M. Holena


![Nonlocal quasivariational evolution problems · treatment of nonlinear and nonlocal abstract evolution problems. Indeed, in [38] a doubly non-linear nonlocal evolution equation in](https://static.fdocuments.net/doc/165x107/5f0d61817e708231d43a11c9/nonlocal-quasivariational-evolution-problems-treatment-of-nonlinear-and-nonlocal.jpg)


