Myanmar Rice Market Theingi Myint YAU _ Monday Seminar November 23, 2015.
Final draft
Adaptation and Adoption of
the System of Rice Intensification (SRI) in Myanmar using the Farmer Field School (FFS) approach
A PhD thesis
By Humayun Kabir
1

Table of contents
Chapter 1 Introduction ________________________________________________ 3
1.1. Introduction _______________________________________________________________ 8
1.2. The issues affecting rice production and the lives of the rural communities in Myanmar 9
Chapter 2 Significance and objectives of the study __________________________ 14
2.1. The significance of this study ________________________________________________ 14
2.2. The objectives of the study __________________________________________________ 16
2.3. Organization of the thesis ___________________________________________________ 16
Chapter 3 Historical background and evolution of FFS ______________________ 18
3.1. Concept of agriculture and rural development__________________________________ 18 3.1.1. The old paradigm __________________________________________________________________18 3.1.2. The new paradigm__________________________________________________________________19
3.2. The approaches used to facilitate agriculture and rural development and their bottleneck
20 3.2.1. The approaches heavily relied on external inputs and input-based technologies __________________21 3.2.2. General inequalities in agricultural ecosystems ___________________________________________22 3.2.3. The socio-economic diversity of farming communities _____________________________________23 3.2.4. Lack of capacities and inadequate technical expertise ______________________________________24 3.2.5. The cost-effectiveness and the issue of sustainability _______________________________________25
3.3. The evolution of IPM_______________________________________________________ 26
3.4. Integrated Pest Management (IPM) – What it actually means_____________________ 28
3.5. Transformation of IPM into FFS _____________________________________________ 28
Chapter 4 The concepts and methodologies of FFS and SRI ___________________ 30
4.1. Farmer Field School _______________________________________________________ 30 4.1.1. The concept _______________________________________________________________________30 4.1.2. The principles of FFS _______________________________________________________________30 4.1.3. The methodologies used in FFS _______________________________________________________32
4.2. The System of Rice Intensification (SRI)_______________________________________ 36 4.2.1. The concepts ______________________________________________________________________36
2
4.2.2. The principles _____________________________________________________________________39 4.2.3. The practices ______________________________________________________________________41 4.2.4. Factors affecting the yields and adoption/adaptation of SRI__________________________________43
Chapter 5 Country, locations, and timeframe, and the project evaluated in the study 47
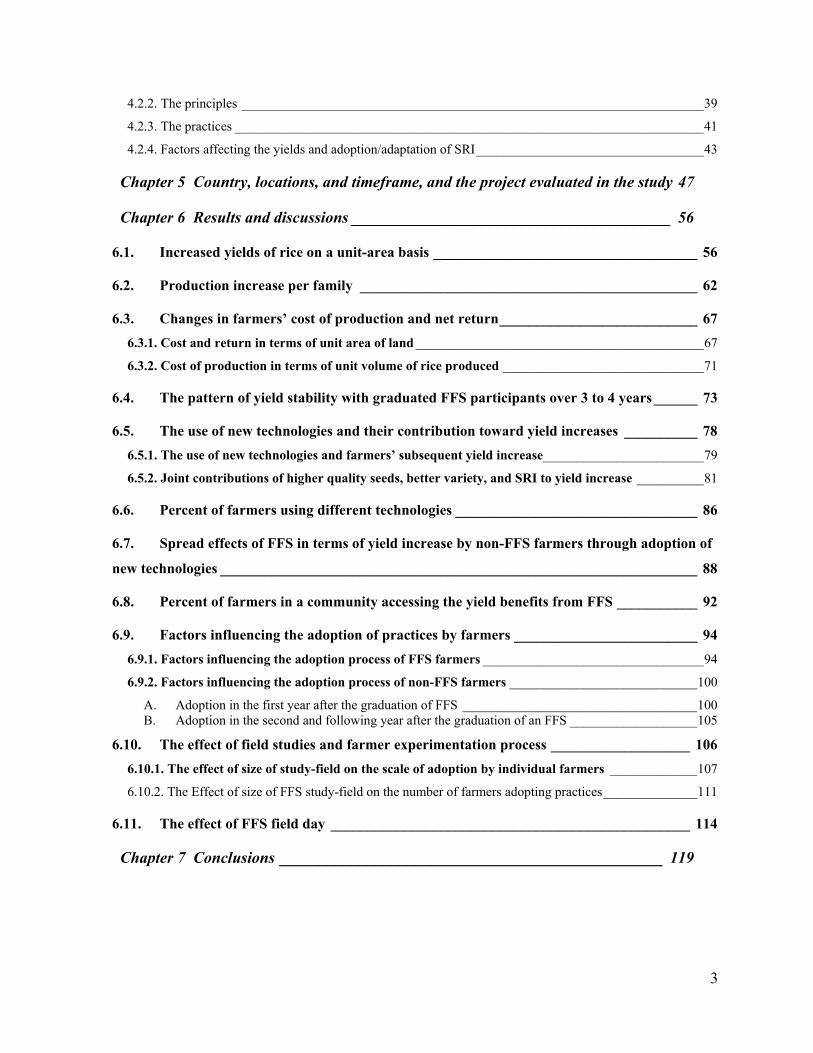
Chapter 6 Results and discussions ________________________________________ 56
6.1. Increased yields of rice on a unit-area basis ____________________________________ 56
6.2. Production increase per family ______________________________________________ 62
6.3. Changes in farmers’ cost of production and net return___________________________ 67 6.3.1. Cost and return in terms of unit area of land ___________________________________________67 6.3.2. Cost of production in terms of unit volume of rice produced ______________________________71
6.4. The pattern of yield stability with graduated FFS participants over 3 to 4 years______ 73
6.5. The use of new technologies and their contribution toward yield increases __________ 78 6.5.1. The use of new technologies and farmers’ subsequent yield increase________________________79 6.5.2. Joint contributions of higher quality seeds, better variety, and SRI to yield increase __________81
6.6. Percent of farmers using different technologies _________________________________ 86
6.7. Spread effects of FFS in terms of yield increase by non-FFS farmers through adoption of
new technologies _________________________________________________________________ 88
6.8. Percent of farmers in a community accessing the yield benefits from FFS ___________ 92
6.9. Factors influencing the adoption of practices by farmers _________________________ 94 6.9.1. Factors influencing the adoption process of FFS farmers _________________________________94 6.9.2. Factors influencing the adoption process of non-FFS farmers ____________________________100
A. Adoption in the first year after the graduation of FFS ___________________________________100 B. Adoption in the second and following year after the graduation of an FFS ___________________105
6.10. The effect of field studies and farmer experimentation process ___________________ 106 6.10.1. The effect of size of study-field on the scale of adoption by individual farmers _____________107 6.10.2. The Effect of size of FFS study-field on the number of farmers adopting practices______________111
6.11. The effect of FFS field day _________________________________________________ 114
Chapter 7 Conclusions ________________________________________________ 119
3

List of Tables
Table 1: List of selected FFSs under category I graduated in 2001.............................................. 54
Table 2: List of selected FFSs under category II graduated in 2002 ............................................ 54
Table 3: List of selected FFSs under category III graduated in 2003........................................... 54
Table 4: Rice yields within FFS in 2001 ...................................................................................... 57
Table 5: Rice yields within FFS in 2002 ...................................................................................... 57
Table 6: Rice yields within FFS in 2003 ...................................................................................... 58
Table 7: FFS mean yields from 2001-2003 .................................................................................. 59
Table 8: The highest and the lowest percentage of yield increase................................................ 61
Table 9: Average increase in amount of rice produced by individual .......................................... 63
FFS families in 2002 after their graduation in 2001 ..................................................................... 63
Table 10: Average increase in amount of rice produced by individual FFS families in 2003 after
their graduation in 2002................................................................................................................ 63
Table 11: Average increase in amount of rice produced by individual FFS families in 2004 after
their graduation in 2003................................................................................................................ 64
Table 12: Mean production increase per FFS family over three years, 2002-2004...................... 65
Table 13: Unit cost of production and net return of farmers in 2002 ........................................... 67
Table 14: Unit cost of production and net return of farmers in 2003 ........................................... 68
Table 15: Unit cost of production and net return of farmers in 2004 ........................................... 69
Table 16: Mean unit cost of production and net return of farmers from 2002 -2004 ................... 69
Table 17: Cost of production for production of one ton of rice before and after FFS.................. 71
Table 18: Farmers’ mean SRI yields of rice on own fields, by FFS, after graduation in 2001 .... 73
Table 19: Farmers’ mean SRI yields of rice on own fields, by FFS, after graduation in 2002 .... 74
Table 20: Farmers’ mean SRI yields of rice on own fields, by FFS, after graduation in 2003 .... 75
Table 21: Number of farmers using the new practices and their percentage of yield increases
from 2002 to 2004......................................................................................................................... 79
Table 22: Level of significance..................................................................................................... 81
Table 23: Contribution of good quality seeds............................................................................... 82
Table 24: Contribution of better rice varieties.............................................................................. 82
Table 25: Contribution of SRI ...................................................................................................... 83
4
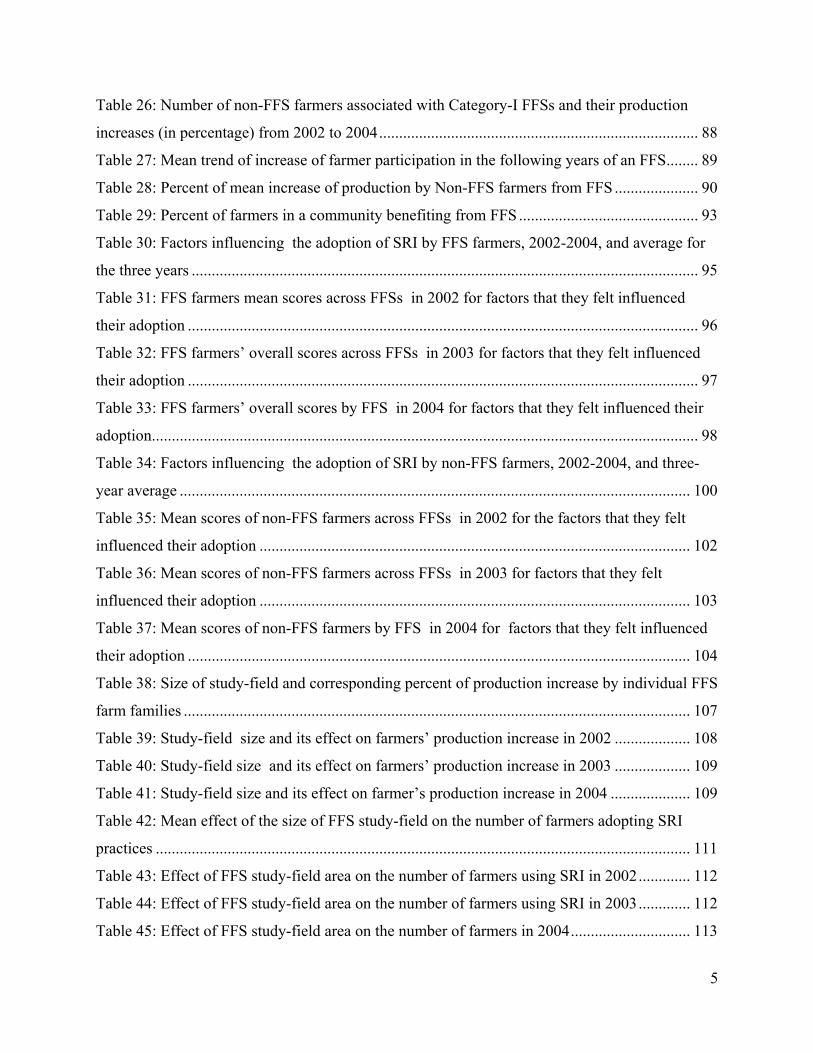
Table 26: Number of non-FFS farmers associated with Category-I FFSs and their production
increases (in percentage) from 2002 to 2004................................................................................ 88
Table 27: Mean trend of increase of farmer participation in the following years of an FFS........ 89
Table 28: Percent of mean increase of production by Non-FFS farmers from FFS ..................... 90
Table 29: Percent of farmers in a community benefiting from FFS ............................................. 93
Table 30: Factors influencing the adoption of SRI by FFS farmers, 2002-2004, and average for
the three years ............................................................................................................................... 95
Table 31: FFS farmers mean scores across FFSs in 2002 for factors that they felt influenced
their adoption ................................................................................................................................ 96
Table 32: FFS farmers’ overall scores across FFSs in 2003 for factors that they felt influenced
their adoption ................................................................................................................................ 97
Table 33: FFS farmers’ overall scores by FFS in 2004 for factors that they felt influenced their
adoption......................................................................................................................................... 98
Table 34: Factors influencing the adoption of SRI by non-FFS farmers, 2002-2004, and three-
year average ................................................................................................................................ 100
Table 35: Mean scores of non-FFS farmers across FFSs in 2002 for the factors that they felt
influenced their adoption ............................................................................................................ 102
Table 36: Mean scores of non-FFS farmers across FFSs in 2003 for factors that they felt
influenced their adoption ............................................................................................................ 103
Table 37: Mean scores of non-FFS farmers by FFS in 2004 for factors that they felt influenced
their adoption .............................................................................................................................. 104
Table 38: Size of study-field and corresponding percent of production increase by individual FFS
farm families ............................................................................................................................... 107
Table 39: Study-field size and its effect on farmers’ production increase in 2002 ................... 108
Table 40: Study-field size and its effect on farmers’ production increase in 2003 ................... 109
Table 41: Study-field size and its effect on farmer’s production increase in 2004 .................... 109
Table 42: Mean effect of the size of FFS study-field on the number of farmers adopting SRI
practices ...................................................................................................................................... 111
Table 43: Effect of FFS study-field area on the number of farmers using SRI in 2002............. 112
Table 44: Effect of FFS study-field area on the number of farmers using SRI in 2003............. 112
Table 45: Effect of FFS study-field area on the number of farmers in 2004.............................. 113
5

Table 46: Effect of FFS field day on the use of SRI practices in 2002 ...................................... 114
Table 47: Effect of FFS field day on the use of SRI practices in 2003 ...................................... 115
Table 48: Effect of FFS field day on the use of SRI practices in 2004 ...................................... 115
Table 49: Mean effect of FFS field day on the number of farmers adopting SRI practices....... 116
Table 50: Correlations................................................................................................................. 117
6

List of figures
Figure 1: The pattern of yield increase in terms of percentage, 2001-2003............................. 59
Figure 2: Rice yields in FFS study-fields ................................................................................. 60
Figure 3: Farmers production of rice before and after FFS...................................................... 65
Figure 4: Farmer’s production costs and net incomes before and after FFS............................ 70
Figure 5: The trends of stability of enhanced rice yields in farmer fields................................ 75
Figure 6: The synergistic effect in SRI..................................................................................... 84
Figure 7: Percent of farmers using different technologies ....................................................... 86
Figure 8: The trend of participation and benefits of non-FFS farmers from FFS .................... 90
Figure 9: The trend of participation of the community in terms of accessing benefits from FFS
92
Figure 10: Factors influencing FFS farmers adoption............................................................ 95
Figure 11: Ranking of the factors that influenced Non-FFS farmer’s adoption................... 101
Figure 12: Corresponding yield increase.............................................................................. 108
Figure 13: Effect of the size of FFS study-field on number of farmers adopting SRI ......... 111
7
Chapter 1 Introduction
1.1. Introduction
Rice is the staple food for more than half of the world’s population. In Asia, more than 80% of
the people live on rice, and their primary food security is entirely dependent on the volume of
rice produced in this part of the world. However, rice production increases are now lagging
behind population growth. Overall, the total global rice is declining gradually even with the
extensive use of the modern varieties such as high yielding and hybrid varieties. Moreover, the
problems associated with the green revolution technological packages, compounded by the
problems of soils, water, and pest and diseases have further complicated the efforts to maintain
farmer’s existing yields.
Rice is not only the staple food in Myanmar; it is a crucial commodity for both the
country and the farmers for incomes and general livelihoods. Without appropriate technological
breakthrough, the growth of rice production has declined from 4.5 percent in 1985 to 0.9 percent
in 1993 (World Rice Statistics, 1995). Consequently, farmers are losing interest in rice
production as it does not contribute much to their income. The need for improving rice
production and the productivity of rice fields in the country is immense, and especially in areas
such as in the upper north there is an urgent need to assist the communities to improve their rice
production where opportunities for other income generating activities are very limited, and
where the lives of the communities have been shattered by long-term civil war.
In the past decades to address many of these similar problems in a number of countries in
Asia, Farmer Field Schools (FFSs) have been introduced. FFSs are a social methodology for
introducing innovations to farmers, and use of the methodology, most notably in Indonesia,
Philippines, Bangladesh, Vietnam, Thailand, and Cambodia, has been highly successful not only
in raising the production level of rice, but in reorienting approaches to the development of
agriculture as a whole. The results of FFS have demonstrated significant improvement in
farmers’ skill and knowledge to tackle the common problems of rural farming. FFS farmers, in
many countries in Asia, have been able to reduce pesticide use to zero or near zero while
increasing rice yields from 10 – 30%. As a result, farmers’ profit margins increased from 15-
25% (FAO Community IPM, 1997).
8
Very recently System of Rice Intensification (SRI) has emerged as a new and promising
innovation to growing rice. Evaluation results of SRI, most notably from Madagascar and a
number of countries in Asia, have indicated significant potentials for raising the productivity of
rice fields many-fold using the practices of SRI.
Encouraged by these successes, both SRI and the FFS methodology have been brought
together in Myanmar, especially in Kachin State and northern part of Shan State, through efforts
of Metta Development Foundation in cooperation with NGO partners and local government
bodies. This thesis presents and analyzes four years of evidence on how both of these
innovations work, separately and (more importantly) together.
1.2. The issues affecting rice production and the lives of the rural communities in Myanmar
Low agricultural production: Myanmar, a country which was once a major rice exporter in the
global rice market, has now multi-faced problems in its agriculture, particularly, low agricultural
productivity which has diminished the overall economy of the country. It is hard to believe that a
country, with larger per capita landholdings than many other South and Southeast Asian nations,
has the lowest agricultural productivity. Low-level of research investment, less priority in
extension, meager expenditure on irrigation and unskilled staff, all these have negatively
contributed to the low production level.
Increasing farm incomes and production requires intellectual innovations, such as rural
participation, action-oriented research for knowledge generation, mutual sharing, and integration
and diversification of the farming systems where necessary. In addition, there is a need for
deeper understanding about the diversities that exist within various agro-ecosystems to develop
location-specific technologies to solve the particular problems of an agro-ecosystem.
Unfortunately, none of these have any favorable existence in the country, at the moment.
Currently, large potentials exist to bring many abandoned as well as virgin lands into
cultivation for crops that can fetch better cash and produce more nutrients, plus there are
substantial large homestead areas available within each household that have the ability to
produce the daily-needed vegetables of a family. Unfortunately, not many efforts have been seen
on this, either by the government or by private or even NGO actors. A predominantly
agricultural society when it underperforms badly affects the rural people. The deficiencies of the
9

agriculture sector, however, also affect other sectors, i.e., health, education, environment, etc., as
it is the main source of income.
Degradation of soils: Due to soil-related problems, around 14 million tons of rice is annually
forgone on a global basis. Similarly, it is assumed that proportionate amounts are also gone for
other crops, i.e., other cereals and vegetable crops, although concrete data are unavailable. For
each season the rice straw from a hectare of rice land, if not recycled to the soil, can remove 160
kg potassium, 66 kg nitrogen, and 6 kg phosphorus, plus a significant amount of other micro-
nutrients. In addition, each ton of rice grain removes 10-15 kg nitrogen, 1-5 kg phosphorus, and
1.5-7.5 kg potassium. Unless adequate amounts of nutrients are added or recycled to the soil, its
productivity continues to decline. Along with other parts of the world, many rice soils in
Myanmar, therefore, suffer from phosphorus, potassium, sulfur, zinc, and other micronutrient
deficiencies. To increase yields of rice as well as other crops requires improving soil conditions,
which needs an intensive study of the soils.
Malnutrition and health problems: Irrespective of age, malnutrition is a common problem in
the rural areas. Generally, young children suffer most; the next are the pregnant women. The
issue of pregnant mothers is serious, as they become less able to produce healthy babies.
Malnourished children and adults are highly exposed to other diseases of which diarrhea,
dysentery, malaria, goiter, and night blindness are pretty common. All these are the direct results
of low agricultural productivity, particularly of inadequate or unbalanced food intake.
Treating these diseases requires substantial amounts of money, whereas farmers'
economic affordability has already begun to fall with the decline of their production in
agriculture. Viable solutions to these problems would require simultaneous improvement in
household's food security and enhancing the regular diet of the family, with protein,
carbohydrate, vitamins and minerals for which rice, fish, meat, vegetables and pulses are the
major sources. This requires an improvement in the overall farming or agricultural production
systems in the country. Increased incomes at household level can also prevent some other serious
health-related problems. Such is the case of HIV, which has already become a grave concern as
due to economic problems, many young women in the rural areas are forced into prostitution.
10

Resettlement issues: For many years, Myanmar has been badly affected by rebellion and
insurgency. All long-term observers agree that the twin problems of insurgency and narcotics are
inseparable. The recent cease-fire agreement between the government and different insurgent
groups has led the insurgent soldiers, refugees, and internally-displaced peoples to return to their
homes. However, lack of capital, appropriate knowledge and skill for income-generation have
caused great difficulties to them in sustaining decent livelihoods. Very little provision is made to
assist in the rehabilitation and resettlement of these peoples who are leading very miserable lives,
being destitute in their own homes. Providing them practical training on small-scale agricultural
development, given that plenty of unused land is available, would be the best option to address
the plight of this group.
Environmental hazards: The destruction of uplands has posed a great danger to the
environment of the country. Illegal and uncontrolled logging has already caused substantial
damage to the local and reserved forest. As a result, the problems of soil erosion are worsening
day by day. This has been further aggravated by farmers’ traditional practice of slash-and-burn
cultivation. Lack of specific technologies appropriate to uplands is leading to more soil erosion.
Low income from farming is another reason why people get involved in illegal logging. To
address these problems requires developing contour-based farming systems, accommodating to
the sloping nature of the country’s hills and mountains. Unlike in lowlands, vegetables and fruits
are the major crops in uplands. Lack of seeds, appropriate varieties, and effective technologies
are other problems impeding the productivity in uplands. All these require intensive training to
farmers to improve their capacity.
Pesticides and health hazard: Pesticides use has been promoted by a misunderstanding that
cultivating high-yielding varieties requires pesticides. Actually, in comparison with other Asian
countries, the amount of pesticides used in northern Myanmar is not very high. One reason of
this is the dominance of local varieties as many farmers still cultivate local varieties in huge
areas. High-yielding varieties are used more in the irrigated areas. However, the type of pesticide
that farmers apply to control usual pest problems, being the cheapest and most widely available,
has created a serious concern. Endrin, a category-I insecticide, which was banned many years
ago all over the world due to its high toxicity and serious long-term residual effect, is being
11

frequently used by many farmers without adequate knowledge about it. If the use of such highly
toxic insecticides is not prevented, this could lead to serious damage to the entire rice ecosystem
with long-lasting ill-effects on the entire environment.
Lack of support service: Extension services in the rural areas, which are mostly provided by the
government, are generally very limited for a number of reasons; among them, inadequate
numbers of extension staff and lack of needed financial support are the most important ones. At
the start of rice transplanting, government workers only provide farmers the premium price of
rice as credit, which is very low. For many years, due to unavailability of quality seeds, farmers
have been using their own seeds; for long-term uses, the quality and the varietal purity of those
seeds have already deteriorated to a very low level, resulting in significant yield loss. Rural
credit is also a problem as there is no well-established credit facility in the rural areas. As a
result, farmers cannot afford to buy quality inputs.
The existing initiatives of local and church-based organizations, to improve the socio-
economic status of the rural poor, have been largely constrained by their poor understanding in
extension approaches and the limited capacity in delivery mechanisms. Most of their staff are
working as volunteers with little or no training and limited knowledge and skill. Impacts are thus
minimal. Providing them with appropriate training could enhance their capacity and improve the
overall performance of those local organizations.
Low human resource development capacity: Myanmar has a per capita GDP of around US
$1419 at current foreign exchange rates (1300 Ks for 1 USD, year 2005, World Factbook), the
lowest in Southeast Asia. Out of 175 countries, Myanmar ranks 131st according to the Human
Development Index (HDI). About 30% of young girls and 35% of young boys leave school after
Grade IV, the final year of primary school, and many adults do not have formal education.
Moreover, there is grave concern about the poor quality not only of primary education but of
technical and higher education as well. Life expectancy is only 58.4 years, and there are high
rates of maternal mortality and child malnutrition as well as poor rates of child survival.
Declining quality of health care, poorly trained staff, inadequate equipment and facilities and
absence of essential drugs are the general constraints to the basic health care service.
12

The situation described above indicates that the lives of people living in Myanmar
communities, especially those in the rural areas, have been badly affected by a number external
and internal challenges. Most of these are complex in nature, while some are the direct cause of
long-term civil-war and conflicts. Although recently the geopolitical situation has been
improved, facilitating development activities across the region where most of the minority
communities such as the Kachin and the Shan are living, a general lack in capacity of local
organizations has slowed down current efforts to improving the living standards of communities.
Given that rice is the main crop in Myanmar agriculture, there is great need to improve
the general conditions of rice cultivation. The current average yields of rice, which is 2 tons/ha in
the country are the lowest among the major rice producers in the world An improvement in rice
yields and production in the country, particularly in areas where farmers have little to do other
than rice cultivation, can make significant improvements in their lives.
13

Chapter 2 Significance and objectives of the study
2.1. The significance of this study
The problems that are stated above are actually inherent problems, carried over for a longer
period of time. Solutions to each of these problems would, therefore, require deeper
understanding of the nature of the problems, for example, the problems in agriculture are not the
problems just for agriculture itself. Agriculture, as the base of the rural economy, should first
generate income from within it, and the new incomes, once generated, would contribute to
addressing many of the other problems related with health, education, and insurgency and
resettlement issues.
Addressing the problems in agriculture, thus, deserves priority for the community and the
country. As most of the problems in agriculture have resulted from lack of understanding and, in
many cases, from a misunderstanding about the total agricultural system, there needs to be a
substantial effort to remove this misunderstanding first, and then to improve the overall
understanding of the entire agriculture system. This means farmers, being the primary
stakeholders, are to be provided with appropriate education to improve their knowledge base on
this overall aspect of agriculture and farming.
Though the primary task of agriculture extension is to provide farmers with such
opportunities to study the production systems of different crops they grow, it is hard to find any
government extension system in Asia involved in this. One important reason is that the
government extension services are far away from their usual task of educating farmers. They are,
instead, involved in technology transfer -- a top-down, one-way approach to information flow to
farmers, which has made them only receivers, instead of learners.
The Farmer Field School (FFS) is a new approach that has emerged in Asia in an attempt
to address many of these similar problems. FFSs were found to be very effective in a number of
Southeast and South Asian nations, notably in Indonesia, Philippines, Vietnam, and Bangladesh.
Farmers who participated in FFS were seen to make significant improvements in their
knowledge base and understanding about farming and in their overall decision-making. They
have been able to reduce pesticide use to zero or near zero. Reduced pesticide use and better
14
fertilizer management enhanced rice yields significantly, as a result farmers’ profit margin
increased as well.
It is believed that the same approach would also be applicable to enhance the skills and
capacity of farmers in Myanmar. Considering the country’s low standing on the human
development index (HDI) and the particular problems that Myanmar agriculture is now facing,
possibly the approach could provide relatively more rapid success here than in other countries in
Asia, and there are high possibilities that the success could be translated to other sectors fairly
easily.
Meanwhile, the System of Rice Intensification (SRI) – a new approach to growing rice --
has drawn much attention since its emergence in Madagascar showing tremendous ability to
increase rice yield in many parts of the rice world. Evaluations of SRI have shown in 23 rice-
growing countries around the world, including as of 2005 Bangladesh, Cambodia, China, India,
Sri Lanka, Nepal, Indonesia, the Philippines, Sierra Leone, The Gambia and Cuba, that with
adjustments and modifications in the practices that govern cultivation methods, rice yields could
be increased by SRI by two or three times, and sometimes even more, with more skillful
management. With such potential for large-scale increase in the production of rice, the adoption
of SRI so far, except in Madagascar, has remained slow to spread (Uphoff, 2002). The reason,
perhaps, is that the approach is very knowledge-intensive and requires careful study and
continuous experimentation to find out the most effective combinations of practices matching the
rice plant with its growing environment, such as changing the spacing between plants, seedling
age, planting depth of the seedlings, timing and methods of irrigation and drainage, as well as
methods of weeding, etc.
With FFS being so successful in providing farmers with education for improving their
knowledge base to tackle the growing environment of rice and other non-rice crops, it is assumed
that the introduction of SRI through FFS would provide farmers most needed skills to determine
the best adjustments within each practice used in SRI to exploit its full potential for maximizing
the yield benefits.
SRI is an innovation in the biophysical realm based on synergies among practices when
they are combined. However, this combination is not always fixed; rather it is relative to the
conditions and environments where rice is grown. It needs to be explored based on actual
growing conditions. On the other hand, FFS is an innovation in the social realm that establishes
15

processes for farmers to explore and find answers on particular points of inquiry used with SRI.
The inquiry could focus on how to find the best match among practices that govern the
cultivation methods of SRI. Therefore, they seem supplementary to each other, and there is
reason to believe that when SRI and FFS are combined, they will benefit each other – with FFS
achieving maximum benefits for farmer-participants while SRI will have greater
adoption/adaptation.
Now what needs to be seen is: 1) how far this happens, 2) how they interact with each
other, and 3) what the ultimate results are. This invites an examination of the complex
relationship between SRI and FFS when they are used together, in an open-ended exploratory
manner, and how this relationship influences the adoption/adaptation process of SRI and
subsequently the lives of people in the communities who are using it.
2.2. The objectives of the study
1. To investigate and assess the adoptability/adaptability of SRI by farmers using the
FFS approach.
2. To study the interactions and relationships between SRI and FFS and the particular
factors contributing to the adoption/adaptation process of SRI.
3. To assess the overall contributions and combined effects of both SRI and FFS in
improving the socio-economic conditions as well as the livelihoods of resource-poor
farmers in Myanmar
2.3. Organization of the thesis
The first chapter has introduced issues and challenges that generally affect global rice
production, and then issues that are particularly relevant to the conditions in Myanmar,
especially how they are affecting rice production and the lives of the rural communities in parts
of the country where this study was conducted. Although most of the issues are very familiar and
similar to many other places where farming is the main occupation for farmers, they are still the
key concerns in agriculture and rural development which have set the ground for this study.
This Chapter 2 has described the rationale and significance of the overall study with a
definition of specific objectives, and describes here how the thesis is organized. Chapter 3 will
16
provide historical background of the concepts and the approaches that have been used to provide
services to the farmers, pointing to the general limitations and particular bottlenecks of those
approaches which have led to the evolution of FFS, based on secondary data and the author’s
own experience. The chapter has tried to produce a new definition of IPM, highlighting its
conceptual differences from the terms of academies and the research institutes based on an
emerging understanding from its actual practitioners, and then it undertakes to establish the
pathway for how IPM has been transformed to FFS as an effective approach to agriculture
extension and rural development.
Chapter 4 explains the general concepts, principles and the methodologies of FFS and
SRI, especially how they are generally understood and used by different levels of practitioners,
with a view to drawing lines where these two are supplementary as well as complementary to
each other to address the general problems of farmers. Chapter 5 introduces the geographical
locations, timeframe, particular study sites, and key determinants of the study.
Chapter 6 and Chapter 7 present the original contributions of this study to advance the
frontiers of knowledge regarding FFS and SRI based on the systematic presentation of empirical
results. These chapters present which core practices of SRI and FFS produce how much
contribution to farmers’ yield improvements and production increases of rice, and how and to
what extent the new practices were adopted/adapted by the farmers, and in the
adoption/adaptation process, which elements of FFS have had how much influence on farmers in
their adoption/adaptation of SRI on their fields. Chapter 6 presents how effective was the
combined use of SRI and FFS to enable communities to improve their skills and capacities for
improving their livelihoods, especially raising the production of rice on a unit-area and per-
household basis. It further documents how the impact of FFS/SRI has spread from a small group
of FFS farmers, who started the FFS, to entire communities within a period of three to four years.
Chapter 7 draws conclusions that both FFS and SRI are highly supportive to each other, and that
their combined use has shown how effectively, even in difficult agronomic and socio-economic
conditions, SRI can spread within and among communities to the benefit of rural households and
their living environment.
17
Chapter 3 Historical background and evolution of FFS
3.1. Concept of agriculture and rural development
3.1.1. The old paradigm
Rural development can be broadly defined as the targeted or desired progress of the communities
living in the rural areas. In the past, this has been largely viewed as a modernization program.
Modernization equates development with four basic processes: capital investment, which leads to
productivity increases; the application of science to production and services; the emergence of
nation-states and large-scale political and economic organization; and urbanization. These
processes are linked to changes in values and social structure. Modernization has commonly
been conflated with models of development, mostly proposed by Western writers.
This model of development has focused almost single-mindedly on growth in production
and the expansion of the market economy, where the state played a leading and crucial role. The
assumption has been that growth and markets are best promoted by the state and by a range of
external interveners, donors and non-government organizations (NGOs) who know best about
the kind of production and market required. This whole process of rural modernization was
rather bureaucratic, mostly dominated by large organizations with mostly male professionals and
administrators in command of the process where economic criteria dominated decision-making.
The social, environmental and political factors were relatively unimportant, and the participation
of beneficiaries was mostly included as an afterthought. The so-called ‘Green Revolution’ which
was largely followed in Asia was an important result of such model.
The model has proved to be rather mechanical and inflexible and has evidently failed on
a number of counts. In many countries, it has not helped remove material poverty nor to conserve
valuable social and environmental resources as could be seen in many poor countries as well as
some resource-rich ones, where poverty still prevails even with worse condition than before,
despite five or six decades of independent government and development policies and programs.
This so-called modernization strategy is not capable of promoting sustainable development since
its outputs have too often been both environmentally and institutionally unsustainable.
18
Sustainable development refers to improvement in livelihoods without undermining the
livelihoods of future generations. Livelihoods do not mean income and wealth alone; the quality
of life and of society as well as security and dignity must be as important as the others. The
modernization concept has not succeeded in being inclusive; the very poor, and the
occupationally, ethnically, racially, religiously or geographically disadvantaged have remained
marginal, or lost out; women have been excluded, or subsumed into the household, which was
assumed to operate on altruistic principles, unlike the rest of the economy. Many of the
intangibles of development – autonomy, freedom, dignity, and peace – were omitted.
3.1.2. The new paradigm
The new paradigm represents a move from an industrial concept of technology development to
an organic or holistic concept of development, with sustainable development replacing profit as
the implicit objective; from a technocratic and exclusive approach to a participatory and
inclusive concept of development management; and from resource control by big organizations
to local resource management, often with a strong common-property orientation.
The big shift has taken place in thinking about agriculture throughout the whole world
and particularly in the developing countries since agriculture is the backbone of the rural society.
The move towards sustainable agriculture is pivotal for future development. The new paradigm
drawing strongly on sociology and anthropology and values indigenous knowledge and farmers’
science and respects farmers’ perceptions and objectives; it recognizes that many farmers are
women, with possibly different objectives and perceptions; it also looks to avoid reliance on
external inputs where possible, looks for energy-efficient farming systems, tries to integrate
conservation into production, and above all, treats farms as whole units in interaction with their
environment both physical and institutional.
In development practice there has been a rise of farming-systems and research activities
that strongly endorse the incorporation of social sciences alongside natural sciences in the
exploration of technology development and dissemination. The concern over environment and
health has led to a rapid development of alternatives in agriculture. There have been efforts to
reduce the reliance on or even to eliminate chemicals from farming systems, at least from the
food which people buy. This has led the emergence of organic or ecological farming as well as
movements supporting this in every corner of the world.
19

In the new paradigm, there has been also a greater shift of emphasizing development and
strengthening the local institutions and their capacity, whereas in the past, the existence of such
organizations was even not recognized. The development of farmers’ group and organizations
has added new value to rural development through a process called community development
where the issue of empowerment and capacity-building of the community has been duly
emphasized. The participation of women in this whole process has been clearly recognized and
added. There has been a bigger move in the professionals from economists, planners,
agriculturalists and engineers to a greater involvement of other social scientists and management
specialists to facilitate and institutionalize such process of community development.
3.2. The approaches used to facilitate agriculture and rural
development and their bottleneck
Over the past fifty years or possibly even more, under different names and perceptions with
different sets of objectives, a number of approaches have been used to facilitate rural
development with particular attention to bring improvements in the field of agriculture and
farming. The approaches, which have been mostly governed by purposeful objectives with
broader set of conceptual understanding on how to bring change towards material aspects of
productions and living of the communities and farmers, have had unique achievements as well as
challenges that have often led to the replacement of an old approach or evolution of a new
approach. The performances of the approaches have been determinant to a number of key
factors: the target groups, their social and economic conditions, the conditions of their farming,
the ecological conditions of the region, and the technologies used by farmers and promoted
under different approaches. The most commonly used among such approaches are: 1) general
ministry-based approaches; 2) training and visit (T&V) extension approach; 3) integrated
approaches; 4) commodity-based approaches; 5) university-based extension approaches; 6)
research-based approaches; 7) private sector approaches; and 8) participatory approaches.
20

3.2.1. The approaches heavily relied on external inputs and input-based
technologies
The approaches, whether used by government or non-government or private organizations, in
general, all have had a primary function to disseminate new technologies and, in many cases,
necessary inputs needed to apply those technologies to improve the production and productivity
of various crops and commodities. The development and dissemination of new technologies
actually received particular impetus after the Second World War. It could be highly successful
due to adequate infrastructure facilities and more importantly due to new technological
interventions which increased the production potentials of different industries many fold. This
unique success during this period created hopes that similar progress might also be possible in
the field of agriculture if adequate technological breakthroughs could be made to increase the
agriculture production similar to industries.
Consequently, greater efforts were made in the field of research to develop new varieties,
breaking the traditional yield barriers of many local varieties with an engineering approach to
redesign the genetic make up of plants. The approach has been highly successful particularly in
rice, corn and wheat, and ultimately in each of these crops a number of new varieties were
developed. However, to exploit their maximum yield potentials, external inputs were needed to
be supplied to the soils at different stages of plant growth which had made necessary the
production of synthetic fertilizers and the development of many chemical-based industries to
produce such fertilizers. Later, chemical pesticides were added to the production system to
control the unwanted pest and disease infestations, which became a serious problem to many of
these new varieties as they were made more vulnerable to such attack by the chemical-based
cultural practices.
With all these advancements, the agriculture and rural development actually came to be
understood in terms of the dissemination of technological package with new seeds and chemical
fertilizers and pesticides. Although the primary function of agriculture extension was supposed
to provide farmers with adequate knowledge on various aspects of production, this had hardly
taken place. The top-down extension approaches largely became a mechanism for ‘technology
transfer’ to farmers. Without adequate adaptation in the use of those new technologies, the
majority of the farmers could not make enough economic progress as it was expected earlier.
21

3.2.2. General inequalities in agricultural ecosystems
Agricultural ecosystems are generally classified into two broad categories such as upland and
lowland, according to topography. In Asia, upland areas include more than 50% of the total
farmland while in terms of population they contain more than 60% of the total rural population
In other regions such as in South America, the percent of people living in uplands is even more.
The rest of the people live in lowland ecosystems. Lowland ecosystems are classified in turn,
according to the source of water, either into rainfed lowland or irrigated lowland. Among them,
the percentage of land under rainfed ecosystems is usually much higher than under irrigated
ecosystems.
Among the above four ecosystems, the use of new technological package provided huge
improvement only in the irrigated lowland ecosystems, which were the focus of what later came
to know as the “Green Revolution.” This was because the successful use of new varieties
required large amounts of external nutrients, and the supply of those nutrients to the soils needed
adequate water to dissolve and transport the nutrients to different parts of the plants. Irrigation
water along with the use of new varieties and chemical inputs, all across the irrigated ecosystem,
raised the productivity of rice, wheat and corn by two to threefold. To accelerate such growth,
however, many governments made huge investment in irrigation infrastructure. Still the
percentage of global irrigated land is comparatively low. The maintenance of such infrastructure
in many places has become complicated. Overall, the total irrigated area instead of increasing has
started declining, and the ultimate benefit of new technologies has already become stagnant or
limited.
The benefits of these new technologies in other ecosystems are mostly insignificant. The
very fragile environment of upland ecosystems is seldom able to utilize the Green Revolution
technologies since most of the varieties were developed for lowland conditions. In addition, the
use of chemical fertilizers or pesticides in the upland was very uneconomic as there was not
significant response in terms of yield increases. Their application was also difficult because of
the sloping nature of the fields, and the scarcity of water. On the other hand, although the new
technologies provided some benefits to the rainfed lowland, particularly in the case of rice in
rainy season the actual benefit is not as regular as in the irrigated lowlands.
22
As a result, the total benefit of new technologies could only be seen in some particular
environments with some particular groups of people living in those ecosystems. This, on one
hand, has created greater inequality between the general mass of farmers living in uplands and
lowlands, and on the other hand, it has created tremendous pressure for the overuse of natural
resources in lowlands, where cropping intensity has increased from 100 to 200-300 percent. This
highlights the needs for new generations of technologies, which can promote effective and
efficient use of natural resource management in a way that is highly sustainable and suitable for
farmers in all conditions.
3.2.3. The socio-economic diversity of farming communities
Inequalities among farmers in resource endowment, particularly in land, capital and labor, have
great influence over the use of new technologies. The benefits derived from the new technologies
are highly relative to the general land holding and financial capital of the farmers. For the new
technologies, the use of new seeds, chemical fertilizers and pesticides, irrigation, drainage and
new equipment requires significant amounts of capital to invest. For small farmers, such
investment was a great limitation. The new technologies, therefore, found more suitability with
the rich farmers and spread more effectively as long as such investment was put forward.
To promote the use of new technologies, many extension services provided credit in
terms of cash as well as direct inputs to the farmers. In such case again, the rich farmers were
given priority since they are in a better position and have big influence in the societies. Poor
farmers oftentimes find difficulty to access the benefits of such services as they are mostly
unable to provide collateral for obtaining credit, which is an important criterion to access credit
from government facilities.
In addition, from the perspective of national food security, it is more important for the
governments to enhance the overall food production in the country than attaining food security at
individual farmer level. Compared to poor and medium farmers, rich farmers always have
greater value since they hold more land and could contribute more as an individual farmer to the
national production. Therefore, they enjoy most of the benefits of the government services.
Besides, they have more political clout. Consequently, the inequalities between the rich and the
poor farmers continue to grow further. The problem was often not that the small farmers could
not adopt the new technologies – they did in millions (Shepherd, 1998). But they did so later
23

than the big farmers, once access to the technologies became easier. By this time, however, much
of the financial benefits of the use of new technologies had already been exhausted by the earlier
adopters. Mass adoption often contributed eventually to declining real crop prices. Bigger
farmers again were in a better position to cope with this problem through cutting their costs of
production or diversifying their farming systems.
All this underscores the needs for changing the paradigms of traditional service systems
to promote alternative ideas and approaches that pay more attention to resource-poor farmers
who constitute the vast majority in the rural communities of most of the developing nations, in
addition to promoting alternative technologies as mentioned in earlier section.
3.2.4. Lack of capacities and inadequate technical expertise
Many extension services realizing the above inequalities undertook programs which usually
target the resource-poor farmers who did not receive much attention in the usual services of the
government. These programs have been primarily implemented in the fragile or unfavorable
environments such as in uplands, and mostly by the NGOs. Although, many of these programs
were very systematic and effective in their approach to enhance general awareness and
participation of farmers and rural communities, their actual contribution to improving general
well-being is still not very encouraging.
The major constraint, as viewed by many, is their lack of technical expertise in planning,
designing and implementation of effective programs that provide farmers with adequate
opportunities to gain needed knowledge on appropriate technology development and
dissemination. Their overemphasis on social awareness aspects in many cases has actually
undermined the technical dimensions of different projects they have carried out to improve the
socio-economic status or livelihoods of rural people. In general, NGOs do not have enough
qualified technical people who can provide effective service to the communities.
Inadequate numbers of well-trained extension workers are also a limitation to successful
extension systems globally. Without enough well-trained staff members, extension is seriously
limited in its ability to plan and execute sound programs. According to a FAO study carried out
in 1989 indicated, about 40% of the extension personnel in developing countries had only a
secondary school diploma, and some actually had less than a secondary education. Another 33%
had an intermediate certificate diploma or its equivalent. About 23% had a university degree, and
24

about 4% had some type of postgraduate qualification. This suggests that in all the developing
countries, 40% of the extension personnel have inadequate technical and extension training.
Furthermore, in countries where field personnel have these low education levels, the proportion
and quality of subject matter specialists is also low.
3.2.5. The cost-effectiveness and the issue of sustainability
Cost-cutting, cost-effectiveness and the issue of sustainability are generally a great concern for
all the approaches, either government or non-government systems of agricultural extension and
rural development. In the case of government programs, if agricultural extension is to be
successful in implementing useful initiatives, there must be tangible evidence of government
commitment to agricultural extension. The best way to measure this commitment is to assess the
financial resources allocated to extension over time. According to a FAO study (Swanson et al.,
1990), on an average, only 0.5% of agricultural gross domestic product (AGDP) is invested in
agricultural extension worldwide.
Since most of the government extension systems operate under civil service rules and
regulations, once extension’s budget declines because of budget cuts or is reduced in real terms
because of inflation, then the general pattern is to maintain or raise the salary payments to the
extension staff and to make up these line item deficits by reallocating funds from program
budget. The net result is that while extension personnel may keep their jobs, they will have little
support in the form of transportation, travel allowances, teaching aids, and demonstration kits to
use in operating an effective educational and technology dissemination program, which
ultimately affects the quality of the program.
Another important thing is that most of the government agricultural extension services in
developing countries heavily rely on foreign funds. They mostly operate through various
projects, most of which are funded by foreign aid. The government in most cases provides only
the staff salaries. Project strategies, therefore, are highly influenced by foreign donors. The most
dramatic example of such a case is the T&V extension methodology, which was mostly funded
by the World Bank. Government had very little option but to implement the recommendations of
the World Bank experts and advisors irrespective of the country or the region. Once project
support was withdrawn, the overall sustainability of the approach became a great concern.
25
Similar problems also prevail in the case of NGOs which are believed to be most
progressive agencies to bring forward the issues of farmer participations and to opening doors to
the service of resource-poor communities. In most cases, NGOs, and particularly southern
NGOs, have no other options except to receive funds from foreign donors and northern NGOs. If
they lose their support, they are likely to have to close down. This means that they have to
implement the agendas and the strategies of the donors or northern NGOs. This risks
undermining the comparative advantages of NGOs, which were the rationale for channeling
funds to and through them rather than to public sector organizations in the first place; their
closeness to the beneficiaries and grassroots organizations and movements, their flexibility and
capacity to learn, their special levels of inspiration and motivation, and so on (Fowler, 1988).
3.3. The evolution of IPM
IPM was evolved in response to address some of the critical problems encountered by the Green
Revolution technologies or by technology-transfer approaches to agricultural extensions in
general. The most important problem which actually led to the evolution of IPM was the
infestation of brown planthopper (BPH) in Indonesia. It was in 1986 that serious infestation of
BPH damaged almost the entire rice crop in central Java of Indonesia. Since the majority of the
farmers lost their harvest, the government of Indonesia took serious interest to find out the actual
reasons for such outbreak of an insect which was never before a major pest in rice. The
government, accordingly, formed a committee comprised of a pool of experts from different
disciplines including entomologists, and social scientists from FAO. The committee after long
investigation and intensive study submitted a report to the government which, surprisingly,
identified the heavy use of chemical insecticides as the main reason of the outbreak.
The findings astonished many, particularly those at the policy level, since they had been
advised to advocate the use of chemical insecticides to control the infestation of insects. To their
surprise, the investigation team explained that in rice fields there are both harmful insects, such
as BPH, and beneficial insects; and most of the beneficial insects live on the upper parts of the
plants while the harmful ones are on the lower parts. When insecticides are sprayed on the rice
field, it is the beneficial insects which are killed first. The use of chemical insecticides in that
particular year was so high that they destroyed most of the beneficial insects, which primarily
26

control or keep the infestation of harmful insects low. The situation provided the harmful insects
with an enemy-free environment, and as a result, they multiplied very quickly, and the pest
population became huge, uncontrollable even with chemical insecticides. Another important
reason of such a huge outbreak was the development of resistant strains of BPH. Due to
prolonged use of chemicals, the majority of the BPH in that particular year had developed
resistance. Therefore, none of the insecticides were actually effective to control the insects. That
is how the population of BPH grew into a serious and damaging outbreak.
It has been quite apparent that the resurgence of pest problems, declining soil
productivity, and degrading rice soils are part of the Green Revolution problems. Moreover, the
traditional top-down extension approach, which has provided blanket recommendations to the
farmers for many years based on specific research and messages, contributed to a huge deskilling
of rural communities. Centrally-designed technology packages needed to be adjusted to specific
field conditions. But the conventional extension services could not provide farmers with the
knowledge they needed to make this adjustment. Ultimately, farmers became passive receivers of
technology and were blamed as non-progressive when they did not utilize this or utilized it
incorrectly.
As these lessons were becoming more distinct and clear, with more and more social,
environmental, ecological, and economic problems identified in rural communities, IPM
emerged with a realization that the problem is not with the farmers, so much as with the methods
used to provide services to farming communities. The results of IPM demonstrated that by
providing appropriate training methods, farmers could not only master the technical knowledge
needed to improve their fields; they could actually become experts capable of using these
knowledge to develop new initiatives to tackle local problems and take advantage of new
opportunities as they arise.
All over Asia, farmers enthusiastically responded to IPM. Some farmers are primarily
motivated by the reduced costs and reduced production risks obtained through application of
ecological principles to crop management. Some are intellectually stimulated by the subject
matter, and excited by the experience of designing and carrying out their own experiments. For
others, the main attraction is the group interaction, discussions and debates, which are an
important part of IPM teachings.
27
3.4. Integrated Pest Management (IPM) – What it actually means
IPM by itself is generally understood as an integrated approach to pest management. It
recommends a combination of multiple practices used together to provide more effectiveness as
control measures. This is the official definition widely taught in the academies – in universities
and colleges, and in research institutes. The control measures that are involved in this
management are generally classified as: 1) physical control, 2) cultural control, and 3) biological
control, with 4) chemical control as a last resort. Recently, genetic control – meaning the use of
genetically-resistant varieties -- has been highly promoted.
This classification of means is reasonable and it makes great sense to understand what it
represents. But there is a large difference, perhaps a wide gap, between this definition and the
way that IPM is understood and has been implemented after its evolution after the BPH outbreak
in Indonesia. As could be noted from the previous section, IPM has evolved not just as an
approach to pest control but also as an approach to agriculture extension; failing to realize this
has oftentimes led to great differences in the understanding of IPM, especially in the field. The
academic definition of IPM has been in existence for some years, from years before the
emergence of BPH outbreak in Indonesia. Although the extension workers in almost all the
counties in Asia were promoting such IPM in the field during the outbreak period, they were not
able to stop the outbreak. What the outbreak had done was create a new understanding about the
methods that have been used to provide service to the farmers. This particular understanding has
led IPM to evolve as a new extension approach in agriculture, not just as an approach to pest
control, although it started by dealing with pest problems. One could see this clearly from the
account presented in the later chapters.
3.5. Transformation of IPM into FFS
The diversity of understanding about IPM often has led to great controversies – and in the way it
has been implemented with farmers. Many practitioners of IPM have started calling it ICM
(Integrated Crop Management) since it deals with not only pests but with all production
practices. If IPM is considered as a technology, then perhaps they are right to call this ICM. But
as many now argue, IPM is not dealing only with crops; through IPM, farmers are provided with
training also on a variety of non-crop subjects, especially to developing their human capacity.
28

Then may it is better to call this Integrated People’s Management (IPM), as some people are now
actually doing.
All this happens because at the initial stage, a great number of persons, whether in the
academies or in the field of extension, have failed to draw a distinction between the technical
domain and the conceptual domain of IPM. As long as IPM is viewed simply as a technology,
this difference would continue to evolve based on the subject matter that IPM is going to deal
with, according to the needs of the farmers and the community. To get out of this pattern of
thinking, one has to understand the evolution process of IPM as well as what it actually does to
the farmers and the communities.
As mentioned earlier, the great failure of all the previously-used extension approaches to
educate farmers has led to the appearance of many problems that are now associated with
concerns about the sustainability of the entire agricultural system. IPM considers that these
problems, those already created, and many that can be anticipated – or even remain unforeseen --
are part of the process. They are very complex in nature too and cannot be separated from the
other. Therefore, it requires a great deal of effort and analysis to understand the complexity of
the problems, which could only be possible through providing appropriate education to the
farmers. Drawing upon such understanding, IPM began by providing farmers with appropriate
education on a variety of subjects using a non-formal approach to education so that they
understand the complexity of the problems, through studying the entire production system, and
they can then make appropriate decisions accordingly. This is what is actually done through an
institution called the Farmer Field School. Linking IPM to FFS makes great sense as a way to
conceptualize the overall strategy of IPM, so that the process of learning and acting is integral to
the learning and action itself as a holistic approach to extension.
29
Chapter 4 The concepts and the methodologies of FFS and SRI
4.1. Farmer Field School
4.1.1. The concept
Over the entire last decade, after transforming the paradigm from IPM to FFS, the concept of
FFS has remained largely open to be evolved based on the needs of the people that it is intended
to serve and of the practitioners who are using it. The understanding that has broadly expanded
the area and scope of FFS, even from agriculture to non-agriculture sectors, is very new and has
taken place only recently within a few years. According to this understanding, farming is
considered as a matter of decision-making, such as which crop to grow, which variety to use,
which management practices to apply, how much capital to invest, how much area to cultivate,
and so on. The success of farming, therefore, depends on the quality of decision-making
regarding all these practices which is basically determined by the degree of understanding for
each of these subject matters. Farmers, by tradition, have a wealth of experience, but they also
have many misconceptions and fears, as many of them were unable to avail themselves of the
formal opportunity to study basic science. Farmer Field Schools provide farmers with the basics
they need so that with their inherent diverse experience and with the newly acquired scientific
knowledge they can make better decisions and ultimately become expert decision-makers to
improve production and incomes significantly in a sustainable manner.
The particular subjects on which FFS provides farmers with basic education are
agroecology, agronomy, soil science, plant protection, water management, economics, social
science, etc., and the approach that is used to provide such education is basically a non-formal
approach, which is used for teaching adults. As the school is established in the field, and the
students are farmers, it is called Farmer Field School (FFS).
4.1.2. The principles of FFS
The following principles are largely adopted in FFS. For the facilitators, they serve as guidelines
on how to guide the farmers to grow crops and improve other activities.
30

Grow a healthy crop: A healthy crop that is free from disease and other infestations and that
has a higher degree of defense, can recover from injuries and damages associated with insect
attack and disease infestation much quickly than can a weaker crop. Quality seeds and seedlings,
good and resistant varieties, balanced nutrients, and appropriate management practices usually
provide the foundation for a healthy crop. Mistakes in any of these areas usually result in poor
establishment of crop, which then becomes highly vulnerable to insects and diseases. To recover
the situation, farmers usually opt for pesticides, which do not deal with the main problem.
Effective pest management does not rely on one single activity. It is rather a process to
understand how to grow a healthy crop. Farmers in FFS are guided in this process.
Conserve natural enemies: Insects are, oftentimes, misunderstood as (all) harmful. No insects
are effectively harmful unless their population reaches damaging numbers. Moreover, many
insects such as parasites, predators and pathogens have long been recognized as beneficials by
nature because they eliminate or keep in check the pests and disease vectors that lead to crop
damage. Recent research shows that microbial antagonists and competitors of plant diseases are
also important. Vertebrate natural enemies are also essential for control systems. Conservation
usually implies avoiding inappropriate pesticide applications, which kill natural agents, and
improving soil organic matter necessary for beneficial soil microorganisms. Natural enemy
habitat protection and development are more active methods of conserving natural enemies (e.g.,
owl houses, mulching for spiders, floral nectaries for parasites). Inoculation or inundation of
reared natural enemies may be possible under special circumstances, but usually only after
conservation efforts have already been implemented.
Observe the crop regularly: Managing a crop effectively requires close and regular
observations of the field, particularly of the conditions of plants, soil, water, weeds, and climate
such as temperature, sunlight, humidity, etc., as crop development is primarily determined by the
combined effect of all of these. Decisions taken without such observations are blind and, in most
cases, inappropriate, which usually leads to the use of unneeded chemicals in the fields. Regular
field observations provide farmers with the opportunity to study and understand the field
situation through an analytical process known as Agroecosystem Analysis (AESA). This
provides the basis to make decisions regarding any activity which are most appropriate at that
31
particular stage of a crop. As a result, the crop performs better, unwanted costs are minimized,
and yield level is improved. Through regular observations, farmers learn how the crop
physiology and morphology changes with a change in the climate and other factors that govern
the crop production.
Regard farmers as experts: This principle reinforces the fact that farmers need to eliminate
their dependency on others to solve their problems. This could only be possible when they
become, and consider themselves, experts in their own fields. Therefore, developing farmers as
experts has been adopted/adapted as a key principle of FFS. Many, however, consider this as the
ultimate goal of FFS. An expert is an expert not because he knows everything, but because he
knows how to know the unknown things. Similarly, learning of something specific ends when
that particular thing has been learned. But learning never ends when someone learns how to
continue learning. FFS provides farmers with a process to continue learning for their whole life.
They are guided with learning principles so that they know how to carry on learning and become
experts on things currently unknown to them.
4.1.3. The methodologies used in FFS
The methodologies used in FFS vary from one program to other and from one country to another
based on the overall perception and the design of the program, and also based on the target
groups of FFS. Although there is a core set of methodologies that have been consistently used in
every program, there have been later additions of some new methodologies that were not
originally part of FFS, to tackle the growing needs of the communities, sparked by scholarly
arguments of farmers and different levels of practitioners. Adding these to the core set of
methodologies has enriched the performance of FFS in many instances. Similarly the FFS
program in Myanmar had used a variety of methodologies; some were tailored to some particular
locations, while many were common to all areas covered by the program. Among them, the
following have been seen to make desirable impacts in influencing the adoption/adaptation of
technologies, specifically the use of SRI under most FFS.
32

Discovery-based learning, or farmers’ experimentation People are known to say,
When we hear, we remember some,
When we see, we remember more.
When we do, we remember the most,
But when we discover, we never forget.
Discovery-based methods are the key to FFS. While these methods provide the primary basis in
FFS, there are other methods too which are generally used to set and facilitate the discovery
process. FFS in all aspects is a natural process of learning. The methodologies used in FFS are
primarily intended to create more natural opportunities for farmers so that they learn from actual
situations on a continuous basis. In doing so, the most common methodologies used are:
Season-long field study: FFS is
actually a place for season-long study.
If the FFS is on rice, it is a season-long
study on rice; if it is on vegetables, it is
a season-long study on vegetables. To
facilitate such study farmers require a
study-field. In the study-field, they grow
crops and establish studies and
experiments to learn various issues in
crop production such as soil
management, water management, pest management, etc. The studies are generally classified into
two categories: one is the general study which is very common in most of the FFS, and the other
is concept-specific study, which is determined based on the need and the interests of the farmers.
Action research: Problems are countless, and they are very common to farmers’ regular lives.
Solving a problem may help the farmers for the time being, but it does not help in the longer run
unless they learn how to solve the next problem, as new problems continue to emerge with new
issues. Therefore, the next important methodology used in FFS is to guide farmers through the
33

problem-solving process. The methodology used in problem-solving is as common as the
methodology used by researchers when try to solve a particular problem. Farmers are usually
provided with guidelines on how to set up experiments or conduct action research. The action
research they conduct is based on their problems and the issues they identify during field
observation and agroecosystem analysis, which is a regular weekly activity of FFS.
Participatory planning: FFS usually begins with a
planning process. During the planning, it is
explained to the community about the general
purpose and the working methodologies of FFS.
They are then asked about their specific
expectations. Based on cause-and-effect analysis,
the expectations are prioritized into specific
objectives of the FFS. The objectives are then
qualified and quantified with specific measurable
indicators so that after a certain period, the community can assess the progress of FFS. Based on
these indicators, specific activities of FFS are determined. Later, an action plan is prepared by
identifying the needed materials and determining a tentative schedule to perform the activities.
The activities of FFS begin immediately after the action plan is prepared. The action plan
actually acts as a guideline for the farmers to work together and maintain their regular
responsibilities. The action plan is usually prepared for one season or one full year based on the
nature of the FFS. If the FFS works on crops, the action plan is prepared for one season.
Working in groups: A general proverb says,
“Two brains are usually better than one, and
similarly three brains are better than two.”
While working alone, one can learn something
but when working in a group one can learn
more as it provides more opportunities for
learning. Besides, as individuals, trying
something new is often difficult, but with group
34

support it becomes easier.
Working in a group, therefore, is an important methodology of FFS. FFSs are usually
organized for a group of about 25 farmers of a community with common interests. This number
is roughly the number that can comfortably work together. These 25 are then divided into smaller
groups of five persons each so that all members can better participate in field observations,
analysis, discussion, and presentations. In small groups, they grow crops, establish studies and
experiments, and monitor and analyze them. After having small-group discussions to gain an in-
depth understanding of the phenomena observed, and to reach agreement on what has occurred,
the findings then are presented and shared in the large group. This provides each group with an
equal opportunity to learn from each other. Working in groups also provides the opportunity to
build unity and solidarity among the farmers. It builds leadership within each of the farmers
because every one of them, while working in FFS, has a chance to be the leader of the small and
the large group.
Participatory monitoring and evaluation
(PME): The introduction of PME to FFS
provided a unique opportunity to farmers
to understand the results of their work.
PME is usually organized at the end of the
crop season. During PME, which is
comprised of a number of tools, farmers in
groups systematically evaluate which
activities of FFS worked well and which
did not. This leads them to identify the particular successes and challenges of FFS. The analysis
of the particular successes and challenges provides them with opportunity to revise the old plan
and prepare a new one.
The simultaneous process of planning, which is done at the beginning, and monitoring
and evaluation, which is done at the end of the season, helps the communities to gain skills in
planning, monitoring and evaluation. They gradually become efficient in 1) problem
identification, 2) goal setting, 3) action plan development, and 4) monitoring and evaluation. The
35
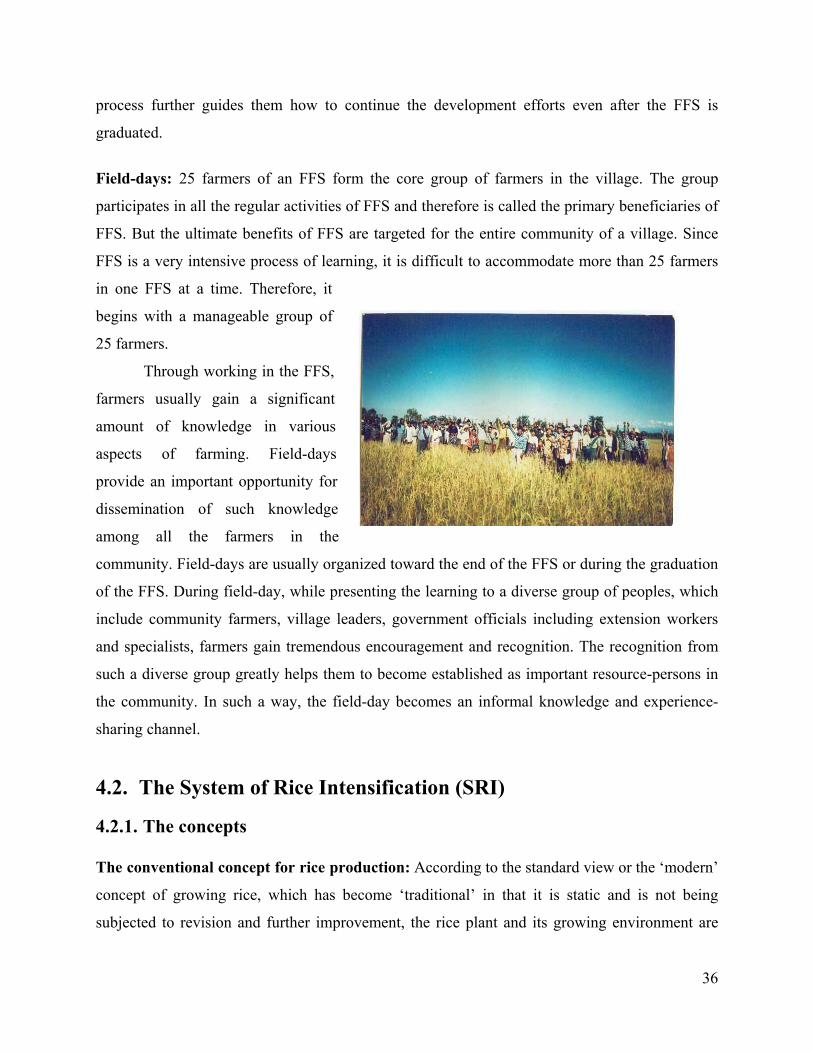
process further guides them how to continue the development efforts even after the FFS is
graduated.
Field-days: 25 farmers of an FFS form the core group of farmers in the village. The group
participates in all the regular activities of FFS and therefore is called the primary beneficiaries of
FFS. But the ultimate benefits of FFS are targeted for the entire community of a village. Since
FFS is a very intensive process of learning, it is difficult to accommodate more than 25 farmers
in one FFS at a time. Therefore, it
begins with a manageable group of
25 farmers.
Through working in the FFS,
farmers usually gain a significant
amount of knowledge in various
aspects of farming. Field-days
provide an important opportunity for
dissemination of such knowledge
among all the farmers in the
community. Field-days are usually organized toward the end of the FFS or during the graduation
of the FFS. During field-day, while presenting the learning to a diverse group of peoples, which
include community farmers, village leaders, government officials including extension workers
and specialists, farmers gain tremendous encouragement and recognition. The recognition from
such a diverse group greatly helps them to become established as important resource-persons in
the community. In such a way, the field-day becomes an informal knowledge and experience-
sharing channel.
4.2. The System of Rice Intensification (SRI)
4.2.1. The concepts
The conventional concept for rice production: According to the standard view or the ‘modern’
concept of growing rice, which has become ‘traditional’ in that it is static and is not being
subjected to revision and further improvement, the rice plant and its growing environment are
36

generally considered as a closed system, where output is associated directly with the inputs
supplied to the system (Uphoff, 2002). In this view, soil is considered as a store-house of
nutrients essential for the growth and development of rice plant, and over time after growing rice
for many years, the capacity of this store gradually declines as rice plants, on a continual basis
for growing year after year, take up needed nutrients from it. Therefore, the store needs to be
filled up with those appropriate types and amounts of nutrients that have been taken up to make
sure that new rice crops have enough nutrients for its production. This is a zero-sum view, where
the system is not regarded as itself contributing to its own operation, able to replenish its
capacities. It is a view dependent on outside (exogenous) interventions.
Additionally, in this view, rice varieties, either local or improved, are considered to
possess an given yield ceiling or a barrier, which is the virtual limit for expressing their genetic
potential; even with more inputs and/or better environmental conditions, no variety has a
capacity to cross such barrier. Generally, such limits are higher in the modern varieties, being
artificially raised through conventional plant breeding of genetic modification, than in the local
varieties. The creation of modern varieties such as high-yielding varieties (HYVs) or hybrid
varieties with their higher yield target requires that more nutrients be supplied to the soil from
external sources since the amount available in the soil is not considered enough to meet their
demand. To meet such huge demands, farmers usually opt for synthetic fertilizers as they are
less costly (especially when subsidized) and easily available and more convenient to use,
especially on large-scale operations.
Therefore, the cultivation of these modern varieties is always dependent on fossil-fuel-
based synthetic fertilizers and later, after the emergence of pest insects and diseases, on synthetic
pesticides – mostly insecticides and herbicides. The overall consequences of this concept of
growing rice, especially how it is making impacts - both positive and negatives - to the lives of
the farming communities and the environments and ecosystems, were already described in earlier
chapters.
The SRI concepts: Contrary to what has been expressed above, deriving from the experience of
SRI, rice plants are regarded more as organisms with their own innate capacity, like other living
beings, to respond constructively to the way they are treated. Rather than being driven by a
single input like fertilizer, the ultimate response of the plant depends on the combined effects of
37
a large number of forces and factors that govern the growing environment of rice. Therefore, the
main determinant of the growth and development of the plant, and its subsequent yields, derives
from how this growing environment, which includes seeds, seedlings, soil, water, nutrients, air,
and the prevailing weather and climatic conditions, is managed.
Rice plants being living organisms have more ability, like other living being, to adapt to
new conditions and to absorb the trauma at a younger stage than at any other stages. Therefore,
rice seedlings, when transplanted at very young stage, can easily absorb the transplanting shock
and can still maintain their ability to grow with full potential.
Like plants, soil is also considered as living -- full of lives, with microbes thriving on and
in it. The activities of these huge numbers of microorganisms make the soil a living body. Rather
than being a store house, it is virtually a living-machine that produces nutrients for plants
depending on the way it is managed, and depending on the energy that is supplied to it.
Generally, composts and manures are considered the primary source of such energy, and the
amount, the time allowed, and the type of the organic materials that are supplied to the soil have
a large influence on the overall activities and the populations of these huge numbers of
microorganisms.
Contrary to what people general understand, these organic materials are provided to the
soil not as a supply of nutrients to the plants but rather as a source of nutrients and carbon to the
microorganisms. It is generally believed that microorganisms cannot uptake carbon, which is
essential for their survival, from air, and no synthetic fertilizers contain carbon at all. The supply
of organic nitrogen through green manures also influences (positively) the populations of
microorganisms that cannot fix atmospheric nitrogen.
As mentioned earlier, the growth and the populations of microorganisms are also
influenced by the management practices of soil such as irrigation, drainage, cultivation, etc., as
they provide different conditions necessary for different types of microorganisms. For example,
submerged (reduced) condition is favorable only for anaerobic microorganisms. Therefore, in
such condition these multiply very quickly and largely, while that environment is detrimental for
aerobic microorganisms, and as a result, they die back. Similarly, vice versa happens under
oxidized condition, when soil is kept moist at the level of field condition but not saturated;
aerobic microorganisms multiply and anaerobic microorganisms die. If the soil is managed with
alternate irrigation and drainage, this simultaneous wetting and drying, and the subsequent
38
decompositions of microorganisms can create a continuous supply of nutrients within the soil
which is more favorable to plants than that supplied from external sources. Nurturing the growth
and populations of microorganisms, thus, is considered the key to the dynamics of nutrient
availability in the soil and concurrent supply to the plants.
Another view, based on previously thoughts about the yield ceiling, is that the genetic
potentials of most of the existing rice varieties have been rather fully exploited and therefore, to
raise the yield level further, there needs to be the development of new varieties
with higher level of yield ceiling. One reason of this is the focus of the development of a super-
rice variety, which is still uncertain as such variety is yet to come. Contradicting the idea of a
yield ceiling, SRI experiences in a large number of rice-growing countries, including China,
India, and Myanmar (where this study was carried out) have consistently shown that the existing
varieties have more genetic potential than has been previously thought and that this can be
tapped by altering the management practices (Uphoff, 2002). The driving force of the new
concept of growing rice with SRI is the innovative management of the entire rice environment,
which of course is not new, as scientists and plant breeders have long recognized that
environmental influences at each point in time can change the genetic expression of any
organism with any particular genetic makeup.
4.2.2. The principles
The principles of SRI vary from practice in that the former are the guiding force while the latter
is an outcome of such guidance, and therefore, the principles are more important than the
practices. The principles that have determined SRI practices are:
Rice is not an aquatic plant: With rice having been grown over centuries under submerged
conditions, there is a general belief that rice plants grow better under saturated conditions. This
belief is strengthened when it is seen that rice plants develop aerenchyma (air pockets) in their
roots when grown under submerged condition. But SRI experience tells a different story, that the
development of aerenchyma is an indication that the plant is enable to survive flooded condition
through the development of these aerenchyma, but that this need not be an ideal adaptation. The
latter conclusion is confirmed by the fact that rice plants, when grown under well-oxygenated
soil conditions, produces vigorous root system. A plant grown with SRI practices requires 5 to
39

10 times as much force as is required to uproot a similar plant grown under submerged
conditions. Profuse growth allows the roots to spread to larger areas to be able to absorb more
nutrients than can a plant grown under flooded condition. SRI plants can grow better with very
little nutrients or no nutrients supplied from outside at all.
Rice plants loose some of their growth potential when transplanted at an older age: SRI
capitalizes upon an in-built pattern of physiological development in rice which was first
identified by a Japanese scientist named T. Katayama before World War II, when he found while
studying the growth and development of cereal plants, that these plants produce their tillers in a
sequential order (Katayama, 1951; Uphoff, 2002). Later Father Henri de Laulanié, during his
work in Madagascar in 1960s-1980s, observed that a plant’s ability to produce tillers was
reduced gradually with the age of the seedlings when transplanted, with younger seedlings
producing a larger number of tillers. He found that rice seedlings transplanted before the fourth
phyllochron – a physiological development unit of plant growth, the time interval during which
one or more phytomers (units of tiller, leaf and root) develop -- produced the highest number of
tillers. Therefore, to exploit the maximum potential for tillering, rice seedlings need to be
transplanted before the beginning of the fourth phyllochron, usually when they are around 10-15
days old. This difference is based on the management of the seedlings. Under better management
conditions, 10-day-old seedlings could reach such stage.
Enough spacing to grow fully: Rice seedlings when planted earlier need to be provided enough
space to express their full potentials in terms of growth of leaves, tillers and roots. Enough space,
along with other favorable conditions, allows the plant roots to grow profusely both vertically in
deeper parts of the soil and horizontally to cover a larger area, and when roots are spread to a
larger volume of soil, they tap more nutrients, which results in the development of larger plants
with larger numbers of tillers and grains.
Careful transplanting: Transplanting shock associated with uprooting, transportation, and
transplanting is an important stress to rice seedlings; therefore, they need to be handled very
carefully. Seedlings when they get affected lose their potential to grow fuller, and perhaps this is
40

one reason why, when they are transplanted in usual ways, they are not seen to produce as many
tillers as SRI.
Specific soil amendment practices to facilitate the growth and development of
microorganisms: The supply and the availability of nutrients in the soil are mainly determined
by how it is managed. Specific soil management practices include providing alternate oxidized
and reduced conditions to the soils so that both aerobic and anaerobic microorganisms can grow
and die in alternating conditions and their continuous decomposition supplies nutrients to the
soil, as mentioned earlier. This would be maintained by alternate flooding and drying.
Specific soil management also can supply adequate amounts of organic material so that
this improves the nutrient supply for microbes. Studies conducted with sugarcane in Brazil
indicate that non-leguminous plants, of which rice is one, when grown without chemical
nitrogen, can fix 150-200kg of nitrogen per hectare (Uphoff, 2002). In another study conducted
in England and Wales indicated that alternate flooding and drying of soil can enhance the
availability of water-soluble phosphorus in the soil by 185 to 1900 per cent (Turner and
Haygarth, 2001).
All these dynamics can make the application of chemical fertilizers unnecessary if there
are unavailable reserves of nutrients in the soil that can be mobilized or mineralized as a result of
the work of microorganisms. Another important finding, which is again contrary to the general
belief, is that plants can grow satisfactorily with much lower concentrations of nutrients than
have previously been thought necessary provided that the limited supply is constantly available
over time rather than at few points in time (Primavesi, 1994, from Uphoff, 2002). This again
diminishes the need of external fertilizers, especially the chemical forms.
4.2.3. The practices
The practices that have been translated based on the principles mentioned above vary from
location to location, and also from season to season, considering the differences of the soils in
different geographical locations as well as the climatic conditions in different seasons. They also
vary according to farmers’ general understanding, their knowledge base to manipulate the
practices to suit into their particular conditions, and their overall affordability in terms of costs
associated with hiring labor. The SRI practices that are being introduced to farmers in Myanmar
are:
41

1. Planting younger seedlings, usually 10-12 days old, but not older than 15 days. Usually in
wet season due to comparatively higher temperatures, 10-day-old seedlings are widely used,
but in winter, especially in areas with cold temperatures where very young seedlings
sometimes have problems in establishment, farmers prefers to use 12 to 15-day-old seedlings.
A little older seedlings are preferred in certain areas, particularly in the wet season, where
standing water is a problem.
2. Planting seedlings one by one: Though the majority of SRI farmers use one seedling per
hill, in some cases they use up to two seedlings. This is mainly to avoid any loss of seedlings
due to pest or other damage, which can happen within a few days of transplanting if they are
not planted carefully.
3. Planting with wider spacing: There has been no fixed spacing found being commonly used
by SRI farmers in generals, but 25x25cm, 30x30, and 35x35cm have been seen most often.
Spacing also depends on the inherent quality of the soils. The better the soils, the wider the
spacing is appropriate for getting higher yield.
4. Planting seedlings as immediately as possible: Seedlings once uprooted from the seedbed
are generally transplanted within half an hour with SRI practices, and many farmers have
even been seen to do this immediately after uprooting, as their seedbeds are already inside
the main field.
5. Using compost: Although most farmers use compost/manure, the amount varies in terms of
its availability and also because there has been no fixed or recommended rate to follow.
Composts are used mostly before transplanting during land preparation, but it is preferred to
use this with the preceding crop.
6. Alternate irrigation is practiced up to the initiation of panicles, and then the field is just
kept moist. The number of irrigations needed during the entire crop period, and the gap
between two irrigations, depends on the type of soil; sandy soils need more irrigation than
other types of soil.
7. Cultivating the soil: Soil is generally cultivated using a rotary weeder, which is primarily
done to control the growth of weeds. Soil cultivation is also needed to aerate the soil but the
number of times for weeding varies from 2 to 5 during the entire tillering period, based on
farmers’ choices and affordability.
42

4.2.4. Factors affecting the yields and adoption/adaptation of SRI
Growing period Although in the tropics and subtropics, rice can be grown year-round based on the characteristics
of the varieties such as photosensitivity and photo-insensitivity (the latter can be grown year
round), the growing periods, especially the day-length, temperature, rainfall, etc., have great
influence over the yields of rice. Rice yield usually is lower in the wet season than in the dry
season, because high rainfall and clouds limit the number of sunny days in the wet season. The
wet season also affects the rice yields with SRI as heavy rains keep rice soils most of the time
either saturated or completely flooded (with no or little opportunity for drying). In addition, in
areas where there are not enough drainage facilities, deep flooding further limits the scope of
SRI. Therefore, the dry season is more favorable for SRI as there is also better control over the
management and supply of irrigation water. However, this does not mean that SRI cannot be
used in the wet season. It can be used as efficiently as in the dry season where there are good
drainage facilities. But under other conditions, all the principles and the practices that have been
evolved based on those principles could not be effectively used because of high rainfall and
standing water.
Labor requirements Due to the need for careful transplanting, generally it takes more than the usual number of days
of labor for transplanting rice with SRI methods, although when farmers get used to the new
practices, the transplanting time is just about equal to what is needed with conventional practices.
Whether this is an important factor affecting the adoption/adaptation of SRI is a general question
that should be considered. Yet, it does not require any specific study to determine whether or not
it affects the adoption/adaptation process, as there are plenty of similar experiences to be
considered to explain the matter. In the 1960s, with the introduction of the new high-yielding
varieties, a similar situation arose when farmers were advised to transplant rice in a line. This
was very new to them, and many farmers at the time were not confident about this. Nonetheless,
this is now no longer a problem, as almost every part of the world where transplanting is done,
farmers invariably practice line-transplanting. SRI experiences tell the similar story that farmers
once they have mastered the practices need even less time than they needed for the earlier
43
practices. With wider spacing they now require a lesser number of seedlings to be transplanted
which is an offsetting factor, reducing labor requirements. Nevertheless in some cases, as can
still be seen, some farmers are not transplanting their rice in lines (or squares) when using just
some practices of SRI. This is not necessarily related with the general use and practices of SRI
itself but is certainly an important issue for investigation and learning.
Experimentation Given that SRI practices are intensive in nature, and since success in achieving the best yields
depends on effective combination of the practices that are used together, there is a need for
continuous experimentation to find which combinations are best based on the particular growing
environments where farmers are living. This experimentation, of course, has a major role in the
overall adoption/adaptation of SRI by farmers. While farmers generally have had no risk of crop
failure in experiments with SRI, if this happens it can happen for some other reasons not
particularly linked to using SRI. Still, if they see the yields that they obtained from experiments
with SRI are lower than those with their conventional practices, there is a tendency to be
discouraged from trying SRI next year. This actually has happened in few instances (roughly in
10% cases), where farmers at the beginning were too enthusiastic, and have tried SRI on a large
part of their lands.
Therefore, there is a need for guiding farmers on how to conduct such experiments,
especially at the beginning, regarding how much area of SRI should be tried at first, and what
kinds of experiments should be conducted, and how to deal with such experiments. The
experiment results, like the process itself, have also great influence over the adoption/adaptation
process of SRI. In most cases, to avoid the risk of yield reduction, farmers are generally
encouraged to conduct experiments in a smaller part of their field, but the better yields from such
small plots are oftentimes not very exciting for the other farmers in the community, and thus this
can be an important reason to slow the adoption/adaptation process of SRI. Besides, the desire
for experimentation is unevenly distributed within the farming community, and only a minority
of them are predisposed to experiment, to innovate, to be the first adopters, while the majority
prefer to take a wait-and-see attitude. Therefore, there are greater possibilities that the
adoption/adaptation of SRI could be positively influenced by the experimentation process of
44

FFS, especially to influence the adoption/adaptation of the majority of farmers who prefer to take
a wait-and-see attitude.
Sharing process The adoption of anything usually takes place through a process of sharing, and generally, two
types of sharing are noticeable associated with the adoption/adaptation of SRI. The first one is
very much formal and thus could be called formal sharing. It takes place between farmers and
service providers – the organizations or groups that usually bring the idea to the farmers. The
methods and the approach that are used in this sharing process have a great influence, as the
extent of this sharing is largely determined by those methods and approaches. The second level
of sharing is very informal and takes place spontaneously among farmers. It is often called as the
‘roll-on’ or spread effect of the first level of sharing, and the extent of this sharing is largely
determined by the effectiveness of the technologies that are used. The overall impact of the first
level of sharing, especially on the knowledge base of the farmers, and how this knowledge is
translated into visible gains such as yields and incomes, has also a larger influence on the second
level of sharing.
FFS being an effective approach to agriculture extension has its own mechanisms of
sharing, and how these mechanisms are functioning with SRI and influencing its overall
adoption/adaptation when, within FFS, SRI is used as the major strategy for growing rice, is an
interesting area to examine. Within the FFS, if there is a high adoption/adaptation rate of SRI,
then which particular elements of the sharing process play more contributing roles to this
adoption/adaptation, and whether these elements could independently be used without FFS to
facilitate the adoption/adaptation of SRI, becomes another interesting matter to be investigated.
Adoption and adaptation of SRI Adoption and adaptation are very common terms used in the agriculture extension, especially in
technology transfer. Adoption generally refers to application of particular technologies by
farmers without modification, while adaptation also means application of technologies by
farmers with some modification according to the particular conditions of the fields and the needs
and constraints of farmers. Adoption of technologies without modifications will create problems
45
if the technologies do not fit into the prevailing environment and the particular physical
conditions of the fields. Further, the process is not really very innovative if it offers farmers little
opportunity for learning so that they can and will make further improvements in their production
systems. The dissemination of SRI generally involves both the process of adoption and
adaptation. Adaptation is seen at the initial stage when FFS farmers are involved in
experimentation to find out adjustments within the practices of SRI to fit into their field
conditions. Adoption generally takes place later, based on their experiments once farmers can see
the practices already adjusted to their field conditions. Both the process, however, can take place
simultaneously. The uptake and spread of SRI by its nature involves both processes of adaptation
and adoption. However, using both terms whenever we refer to the spread of SRI is rather
awkward. In the chapters that follow, we will use just the word ‘adoption’ with the explicit
understanding that this involves the concurrent activities of adaptation and learning.
46
Chapter 5 Country, locations, time frame, and the project evaluated in the study
Country: Myanmar is the largest Asian mainland country after India and China. It lies on the
western side of Indochina between latitudes 10O 00' and 28O 30' N, and longitudes 92O 10' and
101O 10' E, the northernmost areas lying outside the tropics. Elevations range from sea level to
5,881 meters on the snow-capped mountain of Kha Ka Borhazi in the extreme north. Most of the
country comprises low-lying plains along three parallel river systems, flanked by mountain
ranges along the eastern and western frontiers. The estimated human population in 2004 was 54
million. Agriculture dominates the economy, constituting 49% of the GDP in 1995-96 and 35%
of export earnings. Rice alone accounts for 25% of the GDP in Myanmar. The country has
substantial economic potential and significant natural resources in the form of underutilized
cultivable land area, natural gas, marine resources, and mineral wealth.
Kachin State – the location of the study: Kachin State is the northernmost state of Myanmar. It
is bordered by China to the north and east; Shan State to the south; and Sagaing Division and
India to the west. It lies between north latitude 23° 27' and 28° 25', and longitude 96° 0' and 98°
44'. The area of Kachin State is 34,379 sq. miles, and the capital is Myitkyina. The majority of
the state's 1.4 million inhabitants are ethnic Kachin, also known as Jinghpaw, and the state is
officially home to another 13 ethnic groups, including Bamar, Rawang, Lisu, Zaiwa, Maru,
Yaywin, Lawngwaw, Lachyit), and Shan. No census has been taken in almost a century.
Although a large percentage of the population in the cities is Buddhist, the majority of the
population in the state is Christian. The Kachin language is the lingua franca in the state, and has
a written version based on the Roman alphabet. The economy of Kachin State is predominantly
agricultural. The main products include rice and sugarcane. Mineral products include gold and
jade.
Although the traditional Kachin society is based on shifting cultivation, lowland rice
plays a major role in the lives of the communities. In rural societies, cultivation of rice, the
primary source of food security as well as incomes, is the major agricultural activity. Rice yields
are poor, only two to three tons per hectare, especially in the upper-north of the country, which
47
contributes to general food security among many farm households. Moreover, poor farmers have
to surrender a large part of their harvest to pay off their debts borrowed for cultivation and
household consumption between harvests. Quota sales of paddy to the government, at a lower-
than-market price, were a great burden until abolished in 2004. Baseline information obtained
from local farmers during PRA sessions conducted in January 2000 across the State indicated a
trend of growing poverty, compounded by many social and economic problems, in most of the
rural areas in Myanmar.
The project (evaluated in this thesis) Farmer Field School for Sustainable Agriculture
Development in Myanmar was created in an attempt to address the basic food security needs of
farmers particularly of Kachin State and some parts of Shan State in northeast Myanmar. Since
2001, when the FFS methodology was introduced, the project has tried to develop the skills and
capacities of farmers so that with the new skills they could improve their rice production and
consequently enhance their incomes. The project has implemented FFSs in partnership with three
local and church-based organizations and a national NGO, Metta Development Foundation,
discussed below. This collaboration has been a model on how to work in partnership with local
and church-based organizations. According to the nature of the partnership, the project has
developed a core group of trainers, facilitators and coordinators within each of the partner
organizations. The facilitators have been primarily responsible for establishing FFSs across the
communities, while the coordinators have provided follow-up and backstopping support to the
facilitators. The national NGO, Metta, has been responsible in overall coordination among the
partner organizations and management of the entire project. The specific objectives of the project
were:
1. To enhance and empower the decision-making ability of 180 rural household
communities in Myanmar, particularly in Kachin State and Shan State; this was planned
to be achieved through improving their overall management capacity in rice-based
farming systems.
2. To facilitate and strengthen community efforts and participation in planning,
implementing, monitoring and evaluating rural community-based initiatives for
promoting sustainable rural development.
48
3. To create self-reliant capability within the local and national organizations; the local
organizations would implement Farmer Field Schools at community levels, and the
national organization (Metta Foundation) would coordinate the implementation of FFS at
local levels.
4. To enhance broader awareness and influence other local, national and international
organizations to create interest for supporting, sponsoring and implementing Farmer
Field Schools in other parts of Myanmar.
SRI was introduced to the FFSs in 2001 based on initial results of some experiments conducted
on FFS training plots during the first season-long training-of-trainers [TOT] course under the
project as mentioned in Chapter 1. It needs to be mentioned here that TOT was the main activity
to develop the capacity of the FFS facilitators. During the first TOT, although the transplanting
of rice was done a month late and the subsequent yield was disappointing (1.97 to 2.73 tons/ha),
the profuse tillering and the vigorous growth of plants impressed the participants. Accordingly,
they decided to introduce SRI to their FFSs.
The organizations involved in the project
Metta Development Foundation, being the main project stakeholder has been in the forefront
of the project. Metta identified the local partners and developed the project with the assistance of
the author as mentioned below. Accordingly, it has maintained regular coordination with all
three partner organizations as well as with the external funding agencies such as MISEREOR
and SwissAid which funded the entire activities of the project.
Established in 1998 as national NGO, Metta started its development activities with the
specific aim of assisting communities whose lives have been shattered by long-term internal
conflicts, and who have been largely displaced from their homelands. Although Metta’s work
began with the process of reconciliation, helping communities in resettlement and reconstruction
activities mostly in Kachin State, over the years it has expanded its operations to other states of
Myanmar with more and more engagement in the areas of rural development. Metta's main
objectives are to:
49
create a framework for self-help initiatives;
support sustainable community-based projects;
facilitate skills training; and
establish partnerships with like-minded organizations or individuals.
Metta today is engaged in development activities across five states and three divisions within the
Union of Myanmar. In the inaugural year of 1998, Participatory Action Research (PAR) paved
the way for Metta to work with communities. However, since 2000, Farmer Field School
activities have become the mainstay of Metta programs. Metta also partners with the World Food
Programme in its "Food for Work" initiative.
The major programmatic features of Metta Foundation now are: 1) Community
development using FFS and PAR, 2) Community health and education, 3) Capacity building, and
4) Rural reconstruction. Under the areas of community development, Farmer Field Schools are
one of the largest programs. Metta programs are grass-roots initiated. As such they operate with
the participation of local communities in various aspects of planning, implementation and
evaluation. Local resources are mobilized wherever possible, and women are afforded the same
level of representation as men. The establishment of a community organization network which
serves as a forum for sharing experiences and expertise forms part of the strategy for reaching
out to communities from a diverse range of ethnicity and faith backgrounds.
Kachin Independence Organization (KIO) has been an important partner of the project.
Kachin troops formerly formed a significant part of the Burmese army. With the unilateral
abrogation of the Union of Burma constitution by the military government in 1962, Kachin
forces withdrew and formed the Kachin Independence Organization (KIO). Aside from the major
towns and railway corridor, Kachin State has been virtually independent from the mid-1960s
through 1994. After the 1994 civil war between the government forces and KIO, a peace treaty
was signed, permitting continued KIO effective control of most of the Kachin State under aegis
of the Myanmar military. Although the ceasefire immediately resulted in the creation of
numerous splinter factions from the KIO and Kachin Independence Army (KIA) – the army wing
of KIO, KIO still remains as the largest group. The peace treaty has also led KIO to undertake
development programs to improve the socio-economic situation in the region, especially in areas
50

controlled by them. Agriculture was identified as the key area for improvement. However,
limited technical staff and lack of experience was found to be their major constraint in this. The
project included KIO as a major partner and offered technical and training support to develop
needed FFS facilitators/coordinators within it to establish FFS in its controlled areas.
Kachin Baptist Convention (KBC), the denominational organization of Christian Baptists in
Kachin State, is another important partner of this project. Aside from religious activities, the
organization is actively engaged in development activities, enabling direct support to the Baptist
communities living across the state under the auspices of its development department. Limited
capacity, especially lack of enough technical staff has been found to be a major challenge to
provide effective service to these communities. The project offered training and technical
support to the selected facilitators and coordinators of the KBC who established FFS in their
working areas.
Catholic Diocese, particularly the Diocese of Myitkyina, has been the other partner of the
project. A large percentage of the Christian communities in Kachin State are Catholic. The
Diocese of Myitkyina, headed by an appointed bishop from the Vatican, is the official
representative of Catholic communities in Kachin State. Like the KBC, the Diocese also has
social programs to support communities to alleviate their plight of poverty. Currently, under the
Diocese of Myitkyina, there are 27 parishes across the state. Through the parishes, they selected
interested farmers and volunteers from the Catholic communities, and the project provided
particular training support to those selected peoples to become facilitators and coordinators of
FFSs. The facilitators established FFSs within their communities.
The role of the author in the project: The author, the formerly a rice production specialist with
the International Institute of Rural Reconstruction (IIRR), based in the Philippines, has been
intimately involved with the project, working closely with Metta Development Foundation as an
independent consultant in designing and developing the project based on his diverse experiences
with FFSs in South and Southeast Asia. During project implementation, he has played a key
advisory role in overall coordination, management and implementation of the project.
51
Time period:
The first phase of the project started in 2001 for three-year period. During this period (2001-
2003), the project established 258 FFSs in around 200 communities and trained 5,202 farmers of
which 4,080 were male and 1,116 female. Compared with the third year, the scale of operation
and the number of FFSs established in the first and second year of the project was limited.
Initially, it took little longer time for the partner organizations and the project team, the
facilitators and the coordinators to understand the concept and overall methodology of the
project. Nevertheless, in the third and final year of the first phase, the project made huge
improvements in terms of the number and quality of FFSs. The overall impact of the project, the
increased yields of rice, the skills and capacities of farmers, facilitators, and coordinators had
created great enthusiasm among the communities and partner organizations. As a result, since
2004, a new phase of the project has begun for another three-year period. Under the new phase,
in 2004 the project established more than 100 FFSs. The overall period of data gathered and
analyzed for this study was from 2001 to 2004.
Particular locations of the study: Across the entire project area, three distinct locations were
selected for the study. The locations are Myitkyina, Waimaw, and Lai Za of Kachin State. In
each of the locations, FFS methods had been implemented for at least a three-year period.
Individual FFSs were facilitated each for around a one-year period, and after this period, the set
of farmers who had constituted that FFS became known as a ‘graduated’ FFS (FFS alumni).
FFS selected for the study: From the above locations, three categories of FFS were selected for
the study. The first category (category I) includes those FFS participants who graduated in 2001;
and the second category (category II), those who graduated in 2002; while the third category
(category III) is those who graduated in 2003. Post-graduation experience for category I could
thus be studied for three additional years; category II graduates for two more years; and Category
III for one further year.
For the study, a total of 30 FFS were selected, with 10 from each category as shown in
Tables 1-3. While most of the FFS were selected randomly, preferences were given to those FFS
that had better access for data collection and close interactions with farmers so that information
would be more available and more reliable. FFSs belonging to category I are in the first batch of
52

FFSs assisted by the project, and similarly, category II and category III are the second and third
batches of FFSs graduated in 2002 and 2003, respectively.
Shan State
Kachin State
Map of Myanmar
53

Table 1: List of selected FFSs under category I graduated in 2001
FFS No
FFS site Location Township and State
1. Nawng Hkying Myitkyina Myitkyina township, Kachin State 2. 10 Miles Myitkyina Myitkyina township, Kachin State 3. Gat Sha Yang Myitkyina Myitkyina township, Kachin State 4. N-gan Myitkyina Myitkyina township, Kachin State 5. Nawng Hkyi Waimaw Waimaw township, Kachin State 6. Gara Yang Waimaw Waimaw township, Kachin State 7. Ja Pu Waimaw Waimaw township, Kachin State 8. Awng Mye Tit Waimaw Waimaw township, Kachin State 9. Mai Sak Pa Lai Za Bhamo township, Kachin State 10. Lawa Yang Lai Za Bhamo township, Kachin State
Table 2: List of selected FFSs under category II graduated in 2002
FFS No
FFS site Location Township and State
1. Hka Wang Myitkyina Myitkyina township, Kachin State 2. Pung Dung Myitkyina Myitkyina township, Kachin State 3. Chyara Pati Myitkyina Myitkyina township, Kachin State 4. Mali Hka Myitkyina Myitkyina township, Kachin State 5. Mading Waimaw Waimaw township, Kachin State 6. Katsu Waimaw Waimaw township, Kachin State 7. Thing Nan Kawn Waimaw Waimaw township, Kachin State 8. N-Myen Waimaw Waimaw township, Kachin State 9. Ding Hkung Lai Za Bhamo township, Kachin State 10. Nalung (lower) Lai Za Bhamo township, Kachin State
Table 3: List of selected FFSs under category III graduated in 2003
FFS No
FFS site Location Township and State
1. Lahta Maw Hpang Myitkyina Myitkyina township, Kachin State 2. Khan La Myitkyina Myitkyina township, Kachin State 3. Nam Koi Myitkyina Myitkyina township, Kachin State 4. Nan Nawn Pa Myitkyina Myitkyina township, Kachin State 5. Jam Ga Waimaw Waimaw township, Kachin State 6. Nam San Waimaw Waimaw township, Kachin State 7. Sam Pai Waimaw Waimaw township, Kachin State 8. Gang Dau Waimaw Waimaw township, Kachin State
54
9. Dinga Yang Lai Za Bhamo township, Kachin State 10. Daw Hpum Lai Za Bhamo township, Kachin State
Data collection and analysis process: Primary data regarding all the determinants of the study
were collected through a structured questionnaire using open and closed-end questions. During
observation and data-collection, different levels of farmers, both direct and indirect participants
of FFS, community leaders, and project staff such as FFS facilitators, project coordinators, etc.,
were interviewed in groups and individually. To validate the data, in addition, focus-group
discussions were concurrently organized with all levels of peoples in the communities.
The primary data were complemented and in some cases supplemented with secondary
data compiled by the project staff at various times and stages of the project. Samples of data
collection formats are available in the attachment. The data were systematically recorded and are
presented in graphs, tables, figures, and plates, being analyzed using standard statistical
procedures.
With all these the chapter has tried to present the project which made the basis for this
study, as well as where this project was implemented, who were involved in this implementation.
The chapter has also introduced the particular locations and period of the study as well as
explained the data collection and analysis process. Based on such data, particular impacts of the
project and the overall results of the study are presented in the next chapter.
55

Chapter 6 Results and discussions
6.1. Increased yields of rice on a unit-area basis
As an important part of the learning process, farmers who participated in the FFSs grew rice on
their FFS study fields using different combinations of SRI practices. The yields obtained within
those study-fields were compared with yields from traditional methods obtained from their own
lands, where rice was grown using the conventional practices that same year. A comparison of
yields with SRI practices within FFS study-fields with those from conventional practices on
farmers’ own fields was made in three consecutive years, from 2001 to 2003 as presented below.
Percent of yield increase within the FFS of category I in 2001 In the first year of the study, the comparisons of yield data obtained from 10 selected sites of
category I FFSs in 2001 are presented in Table 4. These data indicate that the yields achieved
within the FFS study-fields were significantly higher than farmers’ traditional yields. The
percentages of such increases within the FFS study-fields were found to range between 100 and
280 percent with the mean increase of 158 percent.
In these sites, farmers’ traditional rice yields, considered as the baseline, ranged from 1.5
t/ha to 3 t/ha with a mean of 2.1 t/ha. Compared to these, the average SRI yields obtained within
the FFS fields of all the 10 FFS ranged from 3 t/ha to 7.8 t/ha where the mean average was 5.4
t/ha.
Variations among the traditional yields of farmers within the selected sites were mainly
due to local conditions, such as soil quality and water management practices which differed from
one site to other. While the same reasons could be attributable to the yield differences within the
SRI study-fields of FFS, there were other reasons such as the number and type of practices used
within the individual study-fields that also contributed to those differences.
56

Table 4: Rice yields within FFS in 2001
FFS site Rice yields (tons per hectare) Baseline FFS yield % Increased Nawng Hkying 2 5.0 150 10 Miles 2 5.4 170 Gat Sha Yang 1.8 6.8 280 N-gan 1.7 4.8 182 Nawng Hkyi 2 4.3 113 Gara Yang 3 7.5 150 Ja Pu 3 7.8 160 Awng Mye Tit 1.5 3.0 100 Mai Sak Pa 2 4.9 145 Lawa Yang 1.9 5.0 163 Mean 2.1 5.4 158
Percent of yield increase within the FFS of category-II in 2002 The pattern of yield increase observed in the second year of the study, within the 2002 FFSs, was
found to be very similar to the one in 2001. According to the yield data presented in Table 5,
farmers’ average baseline yields in the selected sites ranged from 1.2-3 t/ha with a mean average
of 1.9 t/ha, while the average SRI yields obtained within the FFS study-fields ranged from 2.9 –
12.4 t/ha, with the mean of 6.7 t/ha. This was a mean increase of 257 percent over farmers’
baseline yield. The increases among individual FFSs ranged from 100–520 percent. This large
variation could be for a number of reasons which are discussed later.
Table 5: Rice yields within FFS in 2002
FFS site Rice yields (tons per hectare) Baseline FFS yield % Increased Hka Wang 2.0 12.4 520 Pung Dung 2.0 8.5 325 Chyara Pati 1.8 8.2 356 Mali Hka 1.7 6.5 282 Mading 1.7 3.7 118 Katsu 2.0 5.4 170 Thing Nan Kawn 3.0 11.9 297 N-Myen 2.0 5.2 160 Ding Hkung 1.2 2.9 142 Nalung (lower) 1.5 3.0 100 Mean 1.9 6.7 257
57
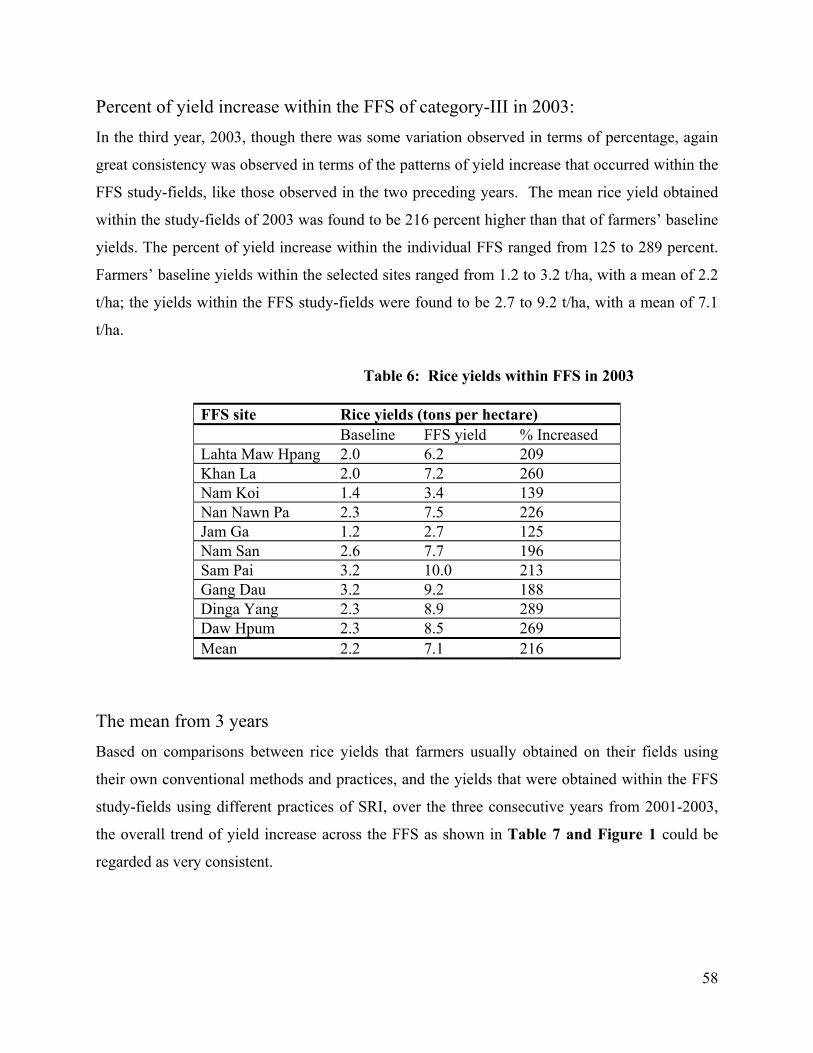
Percent of yield increase within the FFS of category-III in 2003: In the third year, 2003, though there was some variation observed in terms of percentage, again
great consistency was observed in terms of the patterns of yield increase that occurred within the
FFS study-fields, like those observed in the two preceding years. The mean rice yield obtained
within the study-fields of 2003 was found to be 216 percent higher than that of farmers’ baseline
yields. The percent of yield increase within the individual FFS ranged from 125 to 289 percent.
Farmers’ baseline yields within the selected sites ranged from 1.2 to 3.2 t/ha, with a mean of 2.2
t/ha; the yields within the FFS study-fields were found to be 2.7 to 9.2 t/ha, with a mean of 7.1
t/ha.
Table 6: Rice yields within FFS in 2003
FFS site Rice yields (tons per hectare) Baseline FFS yield % Increased Lahta Maw Hpang 2.0 6.2 209 Khan La 2.0 7.2 260 Nam Koi 1.4 3.4 139 Nan Nawn Pa 2.3 7.5 226 Jam Ga 1.2 2.7 125 Nam San 2.6 7.7 196 Sam Pai 3.2 10.0 213 Gang Dau 3.2 9.2 188 Dinga Yang 2.3 8.9 289 Daw Hpum 2.3 8.5 269 Mean 2.2 7.1 216
The mean from 3 years Based on comparisons between rice yields that farmers usually obtained on their fields using
their own conventional methods and practices, and the yields that were obtained within the FFS
study-fields using different practices of SRI, over the three consecutive years from 2001-2003,
the overall trend of yield increase across the FFS as shown in Table 7 and Figure 1 could be
regarded as very consistent.
58
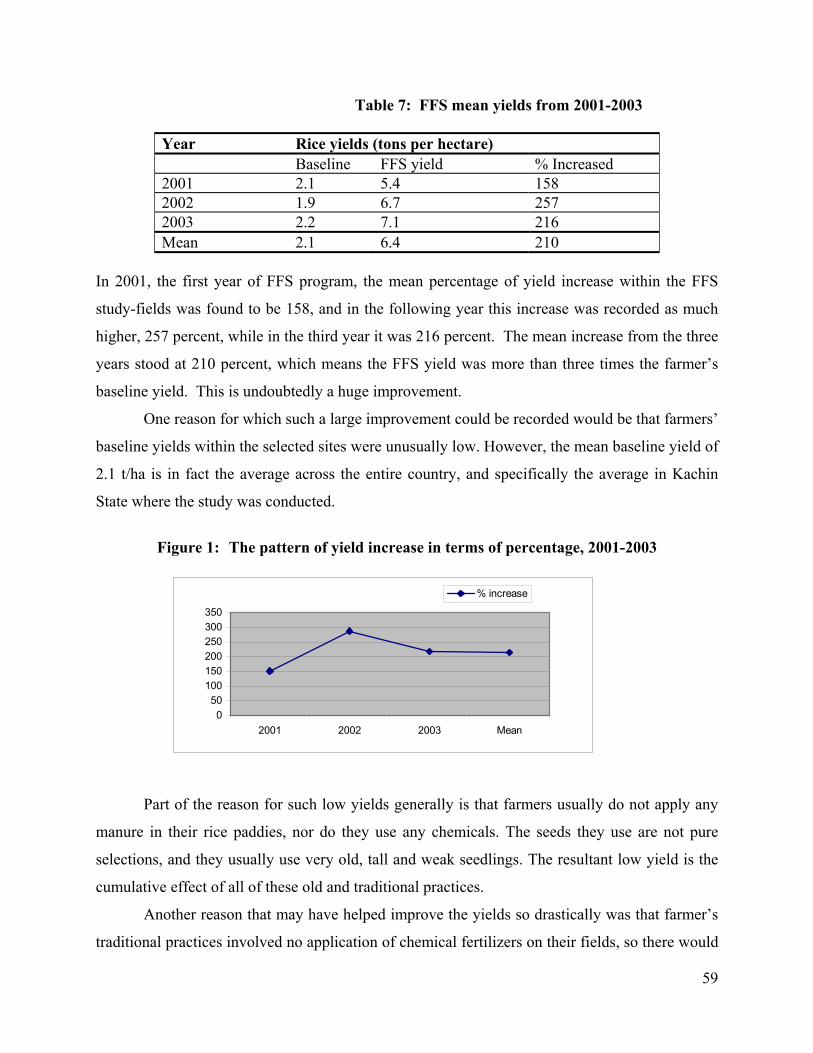
Table 7: FFS mean yields from 2001-2003
Year Rice yields (tons per hectare) Baseline FFS yield % Increased 2001 2.1 5.4 158 2002 1.9 6.7 257 2003 2.2 7.1 216 Mean 2.1 6.4 210
In 2001, the first year of FFS program, the mean percentage of yield increase within the FFS
study-fields was found to be 158, and in the following year this increase was recorded as much
higher, 257 percent, while in the third year it was 216 percent. The mean increase from the three
years stood at 210 percent, which means the FFS yield was more than three times the farmer’s
baseline yield. This is undoubtedly a huge improvement.
One reason for which such a large improvement could be recorded would be that farmers’
baseline yields within the selected sites were unusually low. However, the mean baseline yield of
2.1 t/ha is in fact the average across the entire country, and specifically the average in Kachin
State where the study was conducted.
Figure 1: The pattern of yield increase in terms of percentage, 2001-2003
050
100150200250300350
2001 2002 2003 Mean
% increase
Part of the reason for such low yields generally is that farmers usually do not apply any
manure in their rice paddies, nor do they use any chemicals. The seeds they use are not pure
selections, and they usually use very old, tall and weak seedlings. The resultant low yield is the
cumulative effect of all of these old and traditional practices.
Another reason that may have helped improve the yields so drastically was that farmer’s
traditional practices involved no application of chemical fertilizers on their fields, so there would
59
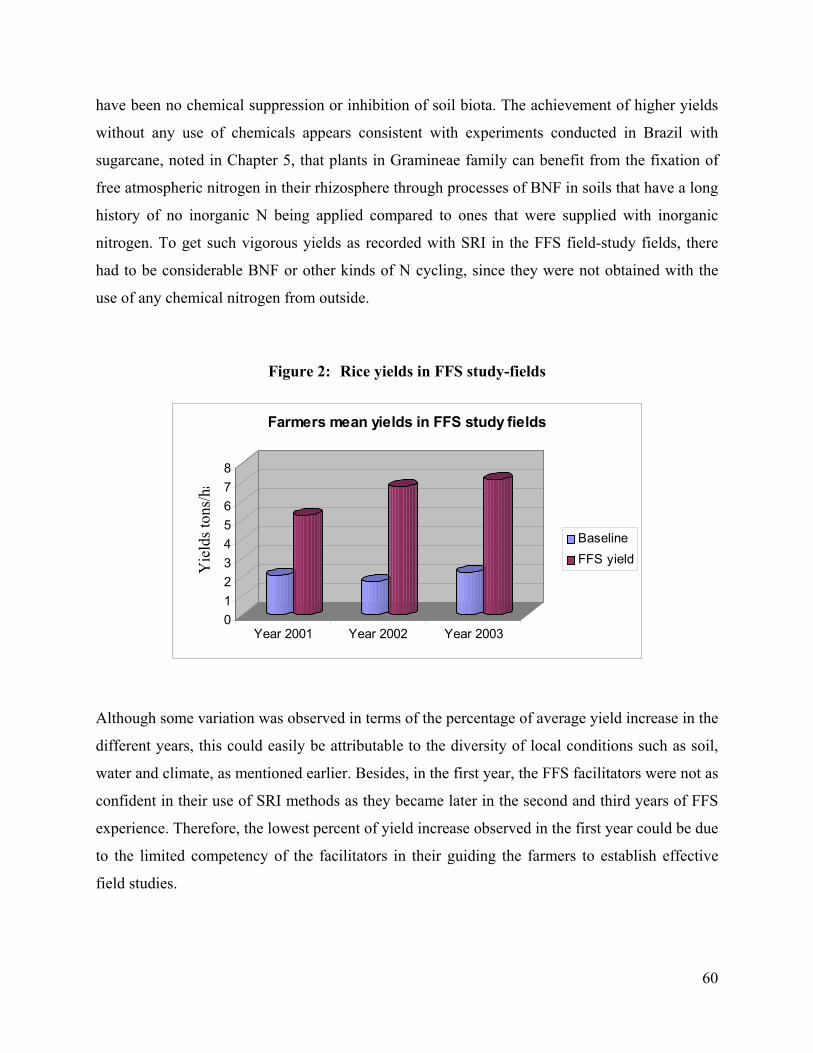
have been no chemical suppression or inhibition of soil biota. The achievement of higher yields
without any use of chemicals appears consistent with experiments conducted in Brazil with
sugarcane, noted in Chapter 5, that plants in Gramineae family can benefit from the fixation of
free atmospheric nitrogen in their rhizosphere through processes of BNF in soils that have a long
history of no inorganic N being applied compared to ones that were supplied with inorganic
nitrogen. To get such vigorous yields as recorded with SRI in the FFS field-study fields, there
had to be considerable BNF or other kinds of N cycling, since they were not obtained with the
use of any chemical nitrogen from outside.
Figure 2: Rice yields in FFS study-fields
012345678
Yie
lds t
ons/
ha
Year 2001 Year 2002 Year 2003
Farmers mean yields in FFS study fields
BaselineFFS yield
Although some variation was observed in terms of the percentage of average yield increase in the
different years, this could easily be attributable to the diversity of local conditions such as soil,
water and climate, as mentioned earlier. Besides, in the first year, the FFS facilitators were not as
confident in their use of SRI methods as they became later in the second and third years of FFS
experience. Therefore, the lowest percent of yield increase observed in the first year could be due
to the limited competency of the facilitators in their guiding the farmers to establish effective
field studies.
60

Table 8: The highest and the lowest percentage of yield increase
Year Percent of yield increase lowest highest average 2001 100 182 158 2002 100 520 257 2003 125 289 216
There were sharp variations observed in the percent of yield increases that occurred
between the FFS on their study-fields in each of the three years at all the selected study sites.
Though a number of factors could be responsible for this difference, the main factors that
contributed were the numbers and types of practices that farmers used within each of the FFS
fields. Generally, as described in Chapter 5, SRI is comprised of a number of practices which are
basically governed by some underlying principles, and the use of such practices was not uniform
in all the FFSs. During the regular learning session of FFSs, farmers were informed about those
underlying principles, and accordingly they decided, based on their level of understanding and
knowledge base, what practices and how many practices they thought would be suitable in their
conditions. As a result, the number and type of practices that farmers used within the FFS study-
fields varied from one FFS to another, as analyzed and evaluated below.
In addition to SRI, the use of rice variety and quality seeds also made some contribution
to the yield increases, and their use was also not uniform within all the FFSs. Based on such
differences, therefore, the percent of yield increase from one FFS to another varied noticeably.
How much yield difference is possible for using such diverse practices, and how much
contribution a single practice could make when it is used alone or together with other practices in
different combinations is addressed in the following sections.
61
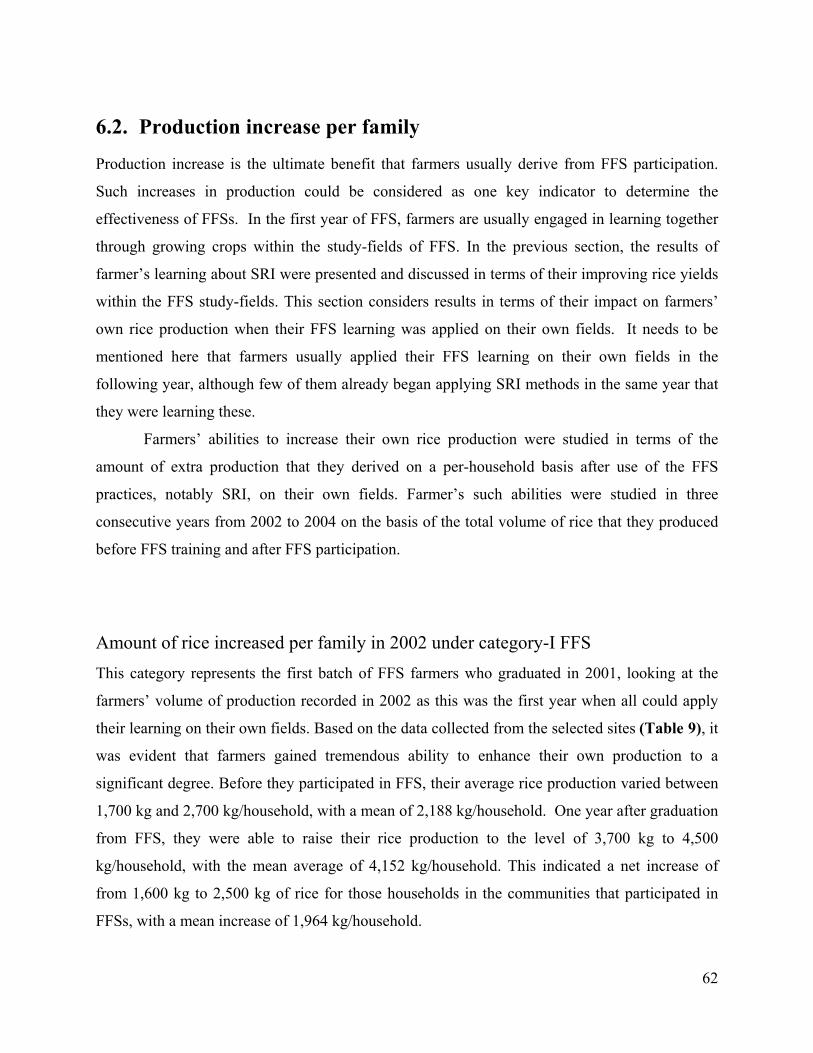
6.2. Production increase per family
Production increase is the ultimate benefit that farmers usually derive from FFS participation.
Such increases in production could be considered as one key indicator to determine the
effectiveness of FFSs. In the first year of FFS, farmers are usually engaged in learning together
through growing crops within the study-fields of FFS. In the previous section, the results of
farmer’s learning about SRI were presented and discussed in terms of their improving rice yields
within the FFS study-fields. This section considers results in terms of their impact on farmers’
own rice production when their FFS learning was applied on their own fields. It needs to be
mentioned here that farmers usually applied their FFS learning on their own fields in the
following year, although few of them already began applying SRI methods in the same year that
they were learning these.
Farmers’ abilities to increase their own rice production were studied in terms of the
amount of extra production that they derived on a per-household basis after use of the FFS
practices, notably SRI, on their own fields. Farmer’s such abilities were studied in three
consecutive years from 2002 to 2004 on the basis of the total volume of rice that they produced
before FFS training and after FFS participation.
Amount of rice increased per family in 2002 under category-I FFS This category represents the first batch of FFS farmers who graduated in 2001, looking at the
farmers’ volume of production recorded in 2002 as this was the first year when all could apply
their learning on their own fields. Based on the data collected from the selected sites (Table 9), it
was evident that farmers gained tremendous ability to enhance their own production to a
significant degree. Before they participated in FFS, their average rice production varied between
1,700 kg and 2,700 kg/household, with a mean of 2,188 kg/household. One year after graduation
from FFS, they were able to raise their rice production to the level of 3,700 kg to 4,500
kg/household, with the mean average of 4,152 kg/household. This indicated a net increase of
from 1,600 kg to 2,500 kg of rice for those households in the communities that participated in
FFSs, with a mean increase of 1,964 kg/household.
62
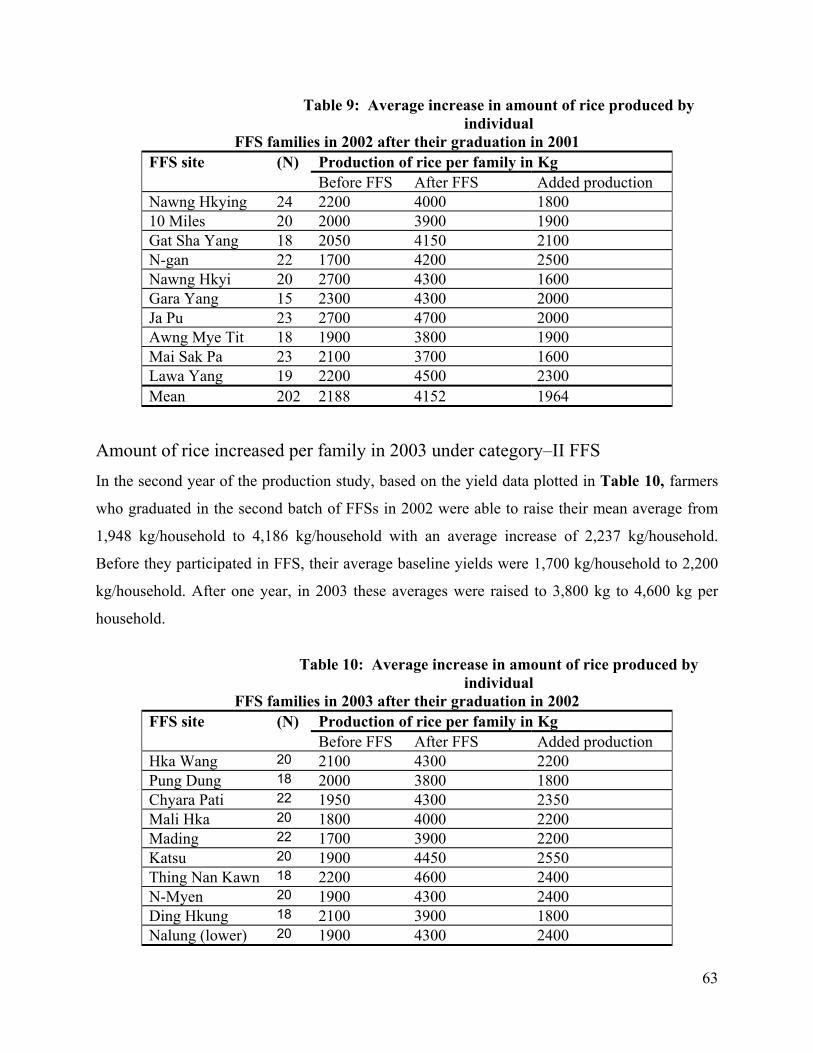
Table 9: Average increase in amount of rice produced by individual
FFS families in 2002 after their graduation in 2001 Production of rice per family in Kg FFS site (N) Before FFS After FFS Added production
Nawng Hkying 24 2200 4000 1800 10 Miles 20 2000 3900 1900 Gat Sha Yang 18 2050 4150 2100 N-gan 22 1700 4200 2500 Nawng Hkyi 20 2700 4300 1600 Gara Yang 15 2300 4300 2000 Ja Pu 23 2700 4700 2000 Awng Mye Tit 18 1900 3800 1900 Mai Sak Pa 23 2100 3700 1600 Lawa Yang 19 2200 4500 2300 Mean 202 2188 4152 1964
Amount of rice increased per family in 2003 under category–II FFS In the second year of the production study, based on the yield data plotted in Table 10, farmers
who graduated in the second batch of FFSs in 2002 were able to raise their mean average from
1,948 kg/household to 4,186 kg/household with an average increase of 2,237 kg/household.
Before they participated in FFS, their average baseline yields were 1,700 kg/household to 2,200
kg/household. After one year, in 2003 these averages were raised to 3,800 kg to 4,600 kg per
household.
Table 10: Average increase in amount of rice produced by
individual FFS families in 2003 after their graduation in 2002
Production of rice per family in Kg FFS site (N) Before FFS After FFS Added production
Hka Wang 20 2100 4300 2200 Pung Dung 18 2000 3800 1800 Chyara Pati 22 1950 4300 2350 Mali Hka 20 1800 4000 2200 Mading 22 1700 3900 2200 Katsu 20 1900 4450 2550 Thing Nan Kawn 18 2200 4600 2400 N-Myen 20 1900 4300 2400 Ding Hkung 18 2100 3900 1800 Nalung (lower) 20 1900 4300 2400
63

Mean 198 1948 4186 2237
Amount of rice increased per family in 2004 under category–III FFS The pattern of production increase in the third year within the third batch of FFS graduates in
2004 was found to be very similar to that the first and second batches of FFSs made in the first
and second year of the study, respectively. In this third batch, the FFS farmers who graduated in
2003 gained a net mean increase of 2,185 kg/household of extra rice compared to their previous
production mean which was 1,995 kg/household. The average production that farmers achieved
on their fields after their graduation ranged from 3,800 kg to 4,800 kg per household, providing a
net increase of 1,600 kg to 2,700 kg/household.
Table 11: Average increase in amount of rice produced by individual
FFS families in 2004 after their graduation in 2003
Production of rice per family in Kg FFS site (N) Before FFS After FFS Added production
Lahta Maw Hpang
20 2000 4000 2000
Khan La 22 2000 3800 1800 Nam Koi 20 2200 4400 2200 Nan Nawn Pa 20 1800 4200 2400 Jam Ga 24 2000 4300 2300 Nam San 19 2100 4800 2700 Sam Pai 20 2000 4500 2500 Gang Dau 25 1900 4000 2100 Dinga Yang 20 2200 4200 1600 Daw Hpum 22 1800 4100 2300 Mean 212 1995 4218 2185
The mean from 3 years: From the production data presented in Tables 9-11, great consistency has been observed in the
overall trends of production increase. In a three-year consecutive study, >600 farmers within 30
different sites (10 sites from each year) were seen to maintain a very similar pattern of
production increase, with no fluctuation in any of the years. This indicates the great skills that
farmers achieved from FFS sessions as the result of their participation.
64

It appears from the three years of consolidated data presented in Table 12 that farmers’
mean production per household, which seemed to be pretty similar in almost all the sampled sites
before they participated in FFS, was just little over than 2 tons. After their FFS participation, this
production mean was more than doubled, to more than 4 tons per household.
Table 12: Mean production increase per FFS family over three years, 2002-2004
Production of rice per family Year (N) Before FFS After FFS Added yield
2002 202 2188 4152 1964 2003 198 1948 4186 2237 2004 212 1995 4218 2185 2002-04 612 2043 4186 2129
An important characteristic of this large production increase is that it happened not just
for a few individuals or a handful of farmers within the FFS; rather all the farmers who
participated in FFSs, irrespective of their categories, size of landholdings, and their resource
endowments, were able to make significant production gains, though there were some variations
among families in terms of the amount of production gains accessed by an individual family.
This is to be expected since the resource endowment and the financial and technical capacity of
all farm households within the community are not the same.
Figure 3: Farmers production of rice before and after FFS
0
1000
2000
3000
4000
5000
Prod
uctio
n/fa
mily
Year 2002 Year 2003 Year 2004
Farmer’s mean production before and after FFS
BeforeAfter
65
A number of other factors could account for the variations of individual farmers’
production gains. Within the FFS cohorts, on average a farm family was found to grow rice on
around 1.5 hectares of land. Although a majority of the farmers gained the production increase
from this same area, in some sites some farmers were found to expand their production to new
lands, while in other sites some were seen to reduce their production area with more intensive
practices applying SRI on some limited land, which they learned was more effective while
participating in the FFS. This was also an important reason for variations in production increases.
Another reason could be soil quality. In some sites the soils were very fertile where with similar
management practices, production increases were found to be higher than in other sites. The
number and the types of practices adapted by individual farmers, as mentioned before, could also
be some good reasons for the variation.
Whatever the case may be, this large production increase achieved by all the FFS farmers
points out two important facts; one, the effectiveness of the technologies that made such increase
possible, and two, the effectiveness of the learning process provided through FFSs that made it
possible for all the farmers to adopt the new methodologies on their own fields. The combined
effect of both could be explained as the result of the simplicity and productivity of the
technologies communicated through the regular interaction of farmers facilitated by the process
of experimentation in FFS. How this interaction and experimentation influenced the farmers’
knowledge base and decision-making, and to what extent they were able to utilize the learning
and the corresponding technologies, will be discussed in the coming sections based on the
specific results of farmers’ experimentation.
66
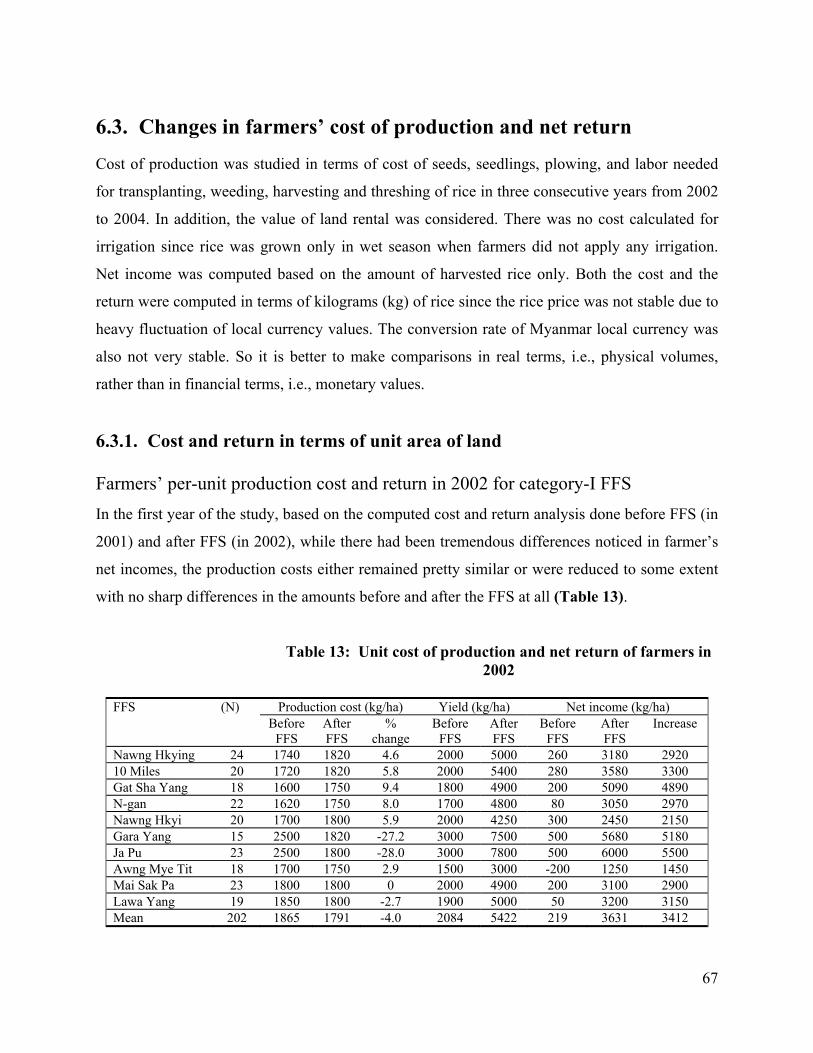
6.3. Changes in farmers’ cost of production and net return
Cost of production was studied in terms of cost of seeds, seedlings, plowing, and labor needed
for transplanting, weeding, harvesting and threshing of rice in three consecutive years from 2002
to 2004. In addition, the value of land rental was considered. There was no cost calculated for
irrigation since rice was grown only in wet season when farmers did not apply any irrigation.
Net income was computed based on the amount of harvested rice only. Both the cost and the
return were computed in terms of kilograms (kg) of rice since the rice price was not stable due to
heavy fluctuation of local currency values. The conversion rate of Myanmar local currency was
also not very stable. So it is better to make comparisons in real terms, i.e., physical volumes,
rather than in financial terms, i.e., monetary values.
6.3.1. Cost and return in terms of unit area of land
Farmers’ per-unit production cost and return in 2002 for category-I FFS In the first year of the study, based on the computed cost and return analysis done before FFS (in
2001) and after FFS (in 2002), while there had been tremendous differences noticed in farmer’s
net incomes, the production costs either remained pretty similar or were reduced to some extent
with no sharp differences in the amounts before and after the FFS at all (Table 13).
Table 13: Unit cost of production and net return of farmers in 2002
Production cost (kg/ha) Yield (kg/ha) Net income (kg/ha) FFS (N)
Before FFS
After FFS
% change
Before FFS
After FFS
Before FFS
After FFS
Increase
Nawng Hkying 24 1740 1820 4.6 2000 5000 260 3180 2920 10 Miles 20 1720 1820 5.8 2000 5400 280 3580 3300 Gat Sha Yang 18 1600 1750 9.4 1800 4900 200 5090 4890 N-gan 22 1620 1750 8.0 1700 4800 80 3050 2970 Nawng Hkyi 20 1700 1800 5.9 2000 4250 300 2450 2150 Gara Yang 15 2500 1820 -27.2 3000 7500 500 5680 5180 Ja Pu 23 2500 1800 -28.0 3000 7800 500 6000 5500 Awng Mye Tit 18 1700 1750 2.9 1500 3000 -200 1250 1450 Mai Sak Pa 23 1800 1800 0 2000 4900 200 3100 2900 Lawa Yang 19 1850 1800 -2.7 1900 5000 50 3200 3150 Mean 202 1865 1791 -4.0 2084 5422 219 3631 3412
67
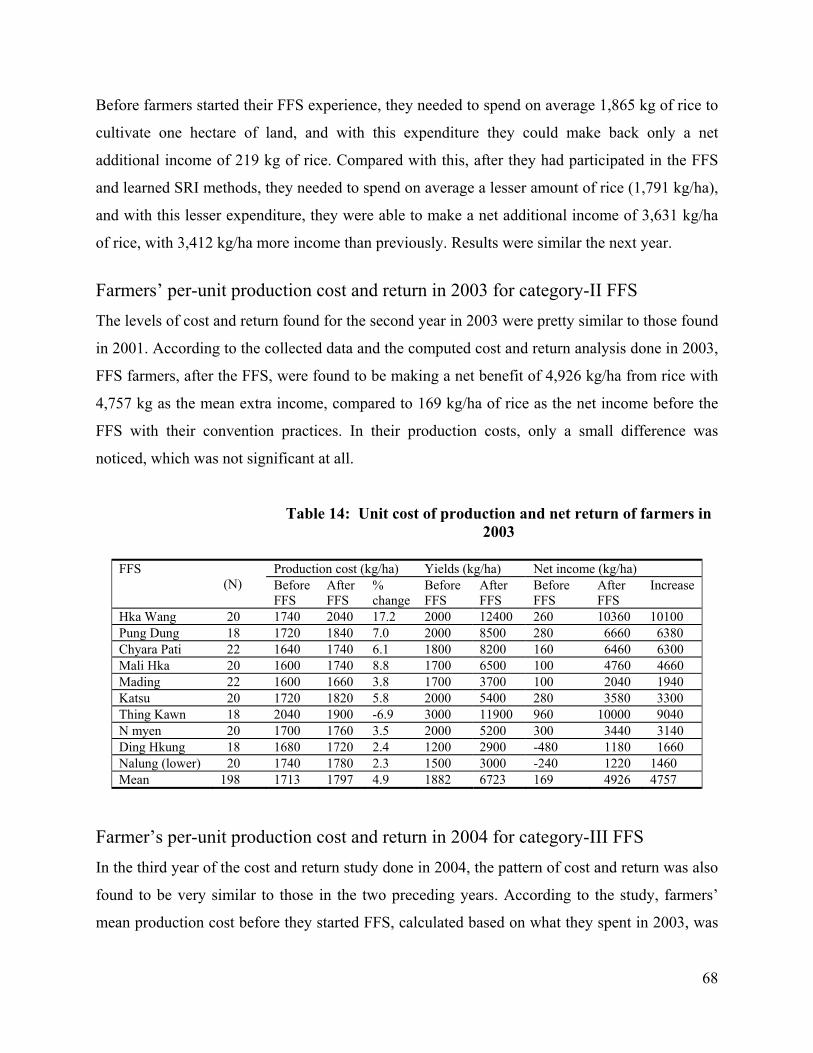
Before farmers started their FFS experience, they needed to spend on average 1,865 kg of rice to
cultivate one hectare of land, and with this expenditure they could make back only a net
additional income of 219 kg of rice. Compared with this, after they had participated in the FFS
and learned SRI methods, they needed to spend on average a lesser amount of rice (1,791 kg/ha),
and with this lesser expenditure, they were able to make a net additional income of 3,631 kg/ha
of rice, with 3,412 kg/ha more income than previously. Results were similar the next year.
Farmers’ per-unit production cost and return in 2003 for category-II FFS The levels of cost and return found for the second year in 2003 were pretty similar to those found
in 2001. According to the collected data and the computed cost and return analysis done in 2003,
FFS farmers, after the FFS, were found to be making a net benefit of 4,926 kg/ha from rice with
4,757 kg as the mean extra income, compared to 169 kg/ha of rice as the net income before the
FFS with their convention practices. In their production costs, only a small difference was
noticed, which was not significant at all.
Table 14: Unit cost of production and net return of farmers in 2003
Production cost (kg/ha) Yields (kg/ha) Net income (kg/ha) FFS
(N) Before FFS
After FFS
% change
Before FFS
After FFS
Before FFS
After FFS
Increase
Hka Wang 20 1740 2040 17.2 2000 12400 260 10360 10100 Pung Dung 18 1720 1840 7.0 2000 8500 280 6660 6380 Chyara Pati 22 1640 1740 6.1 1800 8200 160 6460 6300 Mali Hka 20 1600 1740 8.8 1700 6500 100 4760 4660 Mading 22 1600 1660 3.8 1700 3700 100 2040 1940 Katsu 20 1720 1820 5.8 2000 5400 280 3580 3300 Thing Kawn 18 2040 1900 -6.9 3000 11900 960 10000 9040 N myen 20 1700 1760 3.5 2000 5200 300 3440 3140 Ding Hkung 18 1680 1720 2.4 1200 2900 -480 1180 1660 Nalung (lower) 20 1740 1780 2.3 1500 3000 -240 1220 1460 Mean 198 1713 1797 4.9 1882 6723 169 4926 4757
Farmer’s per-unit production cost and return in 2004 for category-III FFS In the third year of the cost and return study done in 2004, the pattern of cost and return was also
found to be very similar to those in the two preceding years. According to the study, farmers’
mean production cost before they started FFS, calculated based on what they spent in 2003, was
68

found as 1,794 kg/ha, as against 1,798 kg/ha after the FFS, calculated based on what was spent in
2004. This means there was no difference between the costs of rice production before and after
the FFS. On the other hand, a very great difference was noticed in net income, which was 5,306
kg/ha after the FFS as against 455 kg/ha before the FFS, enabling each family to gain on average
of 4,852 kg more income from each hectare of land.
Table 15: Unit cost of production and net return of farmers in 2004
Production cost (kg/ha) Yields (kg/ha) Net income (kg/ha) FFS
(N) Before FFS
After FFS
% change
Before FFS
After FFS
Before FFS
After FFS
Increase
Lahta Maw Hpang
20 1640 1720 4.9 2000 6170 360 4450 4090
Khan La 22 1750 1720 -1.7 2000 7200 250 5480 5230 Nam Koi 20 1620 1720 6.2 1400 3350 -220 1630 1850 Nan Nawn Pa 20 1720 1740 1.2 2300 7500 580 5760 5180 Jam Ga 24 1600 1740 8.8 1200 2700 -400 960 1360 Nam San 19 2040 1920 -5.9 2600 7700 560 5780 5220 Sam Pai 20 2240 1980 -11.6 3200 10000 960 8020 7060 Gang Dau 25 1820 1840 1.1 3200 9230 1380 7390 6010 Dinga Yang 20 1740 1820 4.6 2300 8940 560 7120 6560 Daw Hpum 22 1820 1800 -1.1 2300 8490 480 6690 6210 Mean 212 1794 1798 0.22 2249 7104 455 5306 4852
Mean from three years Data derived from three consecutive years, from thirty different locations (Tables 13-15), clearly
shows the superiority of the FFS/SRI practices over farmers’ traditional practices in terms of
enhancing their net incomes to a very significant level (Table 16). Over the three-year period
within the FFS program, great consistency has been observed in the enhanced net incomes of
farmers, with no decreasing trend. Also, there has been no record of any significant increase in
production cost compared to their previous conditions, while in many sites the cost of production
has instead declined.
Table 16: Mean unit cost of production and net return of farmers from 2002 -2004
Production cost (kg/ha) Rice yields (kg/ha) Net income (kg/ha) Year (N) Before FFS
After FFS
% Change
Before FFS
After FFS
Before FFS
After FFS
Increase
2002 202 1865 1791 -4.0 2084 5422 219 3631 3412 2003 198 1713 1797 4.9 1882 6723 169 4926 4757
69

2004 212 1794 1798 0.2 2249 7104 455 5306 4852 Mean 612 1791 1795 0.2 2076 6425 285 4630 4346
With no additional expenditure, farmers’ mean net incomes were enhanced tremendously. This
enabled them to gain on average an additional income of 4,346 kg/ha of rice compared to their
previous conditions before participating in the FFS process. The mean net income from the
three-year average was found to be 4,630 kg/ha calculated in term of the volume of rice they
produced after the FFS, as compared with 285 kg/ha before the FFS.
This overall result of cost and return analysis indicates that the SRI methods used within
FFS to enhance the production of rice were absolutely low-cost; indeed, farmers did not incur
any additional cost. This is contrary to what has been common with the conventional approach to
agricultural improvement, where to enhance or maximize yields, each unit of production/yield
increase required a corresponding incremental cost. Most of the technologies used within the
FFS are unlike those used with conventional methods; they have no environmental or ecological
cost, nor are there any health risks associated with their use, which is very common when using
chemicals with the conventional methods.
Figure 4: Farmer’s production costs and net incomes before and after FFS
0
2 0 0 0
4 0 0 0
6 0 0 0
Before FFS 219 169 455 285
After FFS 3631 4926 5306 4630
Yr02 Yr03 Yr04 Avr
1600
1700
1800
1900
Before FFS 1865 1713 1794 1791
After FFS 1791 1797 1798 1795
Yr02 Yr03 Yr04 Avg
Production Costs Net incomes
The results of the use of the technologies have revealed another crucial finding which is contrary
to people’s general belief that low-cost technologies are not very effective when large-scale yield
increases are needed. The steady and very consistent experience of yield increase on a unit area
basis, production increase per family, and finally, net income increase per unit area basis, were
all very significant over three consecutive years in a large number of experimental sites (>600).
70

This should undermine that general belief. The technologies and the practices that farmers used
within the FFS are being presented and discussed in the coming chapters.
Another emerging finding is that since SRI requires careful transplanting, many believed
that this will require more labor, and that there must be an increase in production cost. This
sounds logical to people who have no practical experience with SRI; actual experience with SRI
in this study tells a different story. Although there is tendency for some labor requirement to
increase somewhat at the beginning, to do careful transplanting, this small amount of extra labor
does not really add significantly to the overall cost of SRI production because there are other
offsetting savings and gains. This has been consistently seen in three consecutive years during
the study.
6.3.2. Cost of production in terms of unit volume of rice produced
The cost of production when calculated on per unit volume of rice gave a very different picture
from the common method of cost calculation which is on an area basis, using acre or hectare as
the denominator for calculation. In fact, the calculation of costs and returns in terms of the unit
volume of rice produced as a result of their expenditure gives farmers a better idea about real
costs, as the volume of production is the ultimate desire of farmers who are cultivating rice, not
just how many acres of rice they cultivate. With unproductive traditional methods, farmers must
expend almost as much rice as they get from their fields in return.
Table 17: Cost of production for production of one ton of rice
before and after FFS
Sites 2002 2003 2004 2002-2004 (N) B A (N) B A (N) B A (N) B A Site-1 24 870 364 20 870 165 20 820 279 64 853 269 Site-2 20 860 337 18 860 216 22 875 239 60 865 264 Site-3 18 889 357 22 911 212 20 1157 513 60 986 361 Site-4 22 953 365 20 941 268 20 748 232 62 881 288 Site-5 20 850 424 22 941 449 24 1333 644 66 1041 506 Site-6 15 833 243 20 860 337 19 785 249 54 826 276 Site-7 23 833 231 18 680 160 20 700 198 61 738 196 Site-8 18 1133 583 20 850 338 25 569 199 63 851 373 Site-9 23 900 367 18 1400 593 20 757 204 61 1019 388 Site-10 19 974 360 20 1160 593 22 791 212 61 975 388
71

Av 202 895 330 198 910 267 212 798 253 612 868 283 B = Before FFS, A = After FFS, (N) number of farmers According to the data presented in Table 17, where the production cost of rice was
presented on the basis of production cost per ton of rice grown before FFS with farmer’s
traditional methods, and after FFS with SRI methods, farmers’ average production cost of rice
after FFS was found to be simply one-third of what they used before. This means the production
cost of rice grown with SRI method is generally three times lower than that of farmers’
conventional methods over the three years of the study from 2001 to 2003.
This finding about the costs and returns associated with the different methods of
production, particularly the advantage from SRI, surprised FFS participants who initially thought
that SRI was costlier than their usual methods. Farmers, on average, in the study area grow rice
on around 1.5 hectares area, and before FFS training using their traditional methods used to
spend 2,687 kg to produce about three tons of rice (based on the data presented in Table 16).
Now after the FFS, using SRI methods they are able to produce a similar amount of rice from
that area by spending only about 849 kg of rice; with that amount of expenditure on production,
they can get 6-7 tons of rice.
72
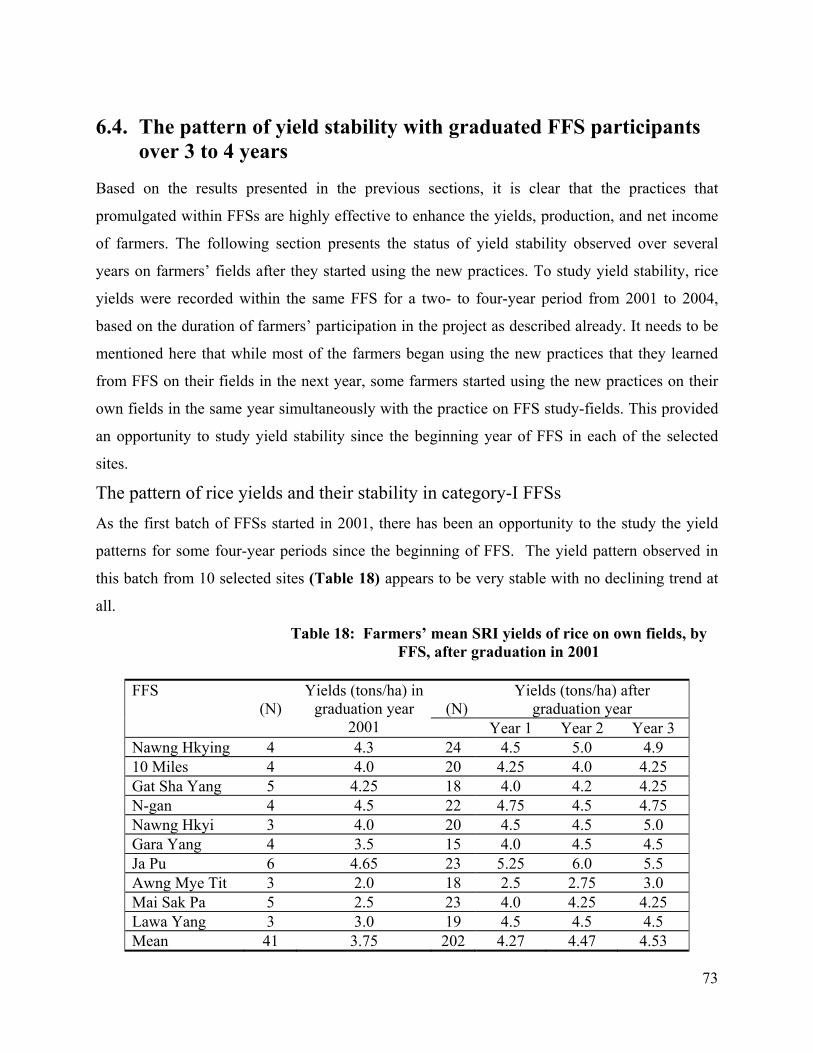
6.4. The pattern of yield stability with graduated FFS participants
over 3 to 4 years
Based on the results presented in the previous sections, it is clear that the practices that
promulgated within FFSs are highly effective to enhance the yields, production, and net income
of farmers. The following section presents the status of yield stability observed over several
years on farmers’ fields after they started using the new practices. To study yield stability, rice
yields were recorded within the same FFS for a two- to four-year period from 2001 to 2004,
based on the duration of farmers’ participation in the project as described already. It needs to be
mentioned here that while most of the farmers began using the new practices that they learned
from FFS on their fields in the next year, some farmers started using the new practices on their
own fields in the same year simultaneously with the practice on FFS study-fields. This provided
an opportunity to study yield stability since the beginning year of FFS in each of the selected
sites.
The pattern of rice yields and their stability in category-I FFSs As the first batch of FFSs started in 2001, there has been an opportunity to the study the yield
patterns for some four-year periods since the beginning of FFS. The yield pattern observed in
this batch from 10 selected sites (Table 18) appears to be very stable with no declining trend at
all.
Table 18: Farmers’ mean SRI yields of rice on own fields, by FFS, after graduation in 2001
(N)Yields (tons/ha) after
graduation year FFS
(N) Yields (tons/ha) in
graduation year 2001 Year 1 Year 2 Year 3
Nawng Hkying 4 4.3 24 4.5 5.0 4.9 10 Miles 4 4.0 20 4.25 4.0 4.25 Gat Sha Yang 5 4.25 18 4.0 4.2 4.25 N-gan 4 4.5 22 4.75 4.5 4.75 Nawng Hkyi 3 4.0 20 4.5 4.5 5.0 Gara Yang 4 3.5 15 4.0 4.5 4.5 Ja Pu 6 4.65 23 5.25 6.0 5.5 Awng Mye Tit 3 2.0 18 2.5 2.75 3.0 Mai Sak Pa 5 2.5 23 4.0 4.25 4.25 Lawa Yang 3 3.0 19 4.5 4.5 4.5 Mean 41 3.75 202 4.27 4.47 4.53
73

The mean yield obtained by farmers who applied the practices on their own fields at the same
time with the FFS study-fields in 2001 was found to be 3.75 t/ha; in the following years up to
2004, their mean averages were found to be 4.27 t/ha, 4.47 t/ha and 4.53 t/ha, respectively.
The pattern of rice yields and their stability in category-II FFSs In the second batch of FFSs, yield stability could be evaluated over a three-year period. In 2002,
the first year of FFS, farmers’ mean yield was observed to be 3.56 tons/ha (Table 19) followed
by average yields of 4.08 t/ha and 4.64 t/ha in 2003 and 2004, respectively, which shows a very
similar pattern to that seen in the previous batch of FFSs.
Table 19: Farmers’ mean SRI yields of rice on own fields, by FFS, after graduation in 2002
(N) Yields (tons/ha) after
graduation year FFS
(N) Yields (tons/ha)
in graduation year 2002 Year 1 Year 2
Hka Wang 2 2.5 20 3.0 3.0 Pung Dung 4 3.0 18 3.5 3.75 Chyara Pati 3 2.0 22 2.25 2.5 Mali Hka 6 3.0 20 3.5 4.5 Mading 2 5.0 22 6.0 6.5 Katsu 4 5.5 20 5.5 6.0 Thing Nan Kawn 3 3.75 18 5.5 6.0 N-myen 5 4.0 20 4.1 4.7 Ding Hkung 3 3.0 18 4.0 4.5 Nalung (lower) 3 3.75 20 3.5 5.0 Mean 35 3.56 198 4.08 4.64
The pattern of rice yields and their stability in category-III FFSs The pattern of yield increase in the third batch of FFSs, which started in 2003, was also found to
be similar to that of the first and the second batches of FFSs. Based on the recorded data over a
two-year period - the graduation year and the next year after the graduation - rice yield was
found to be stable with an increasing trend in the second year. Farmer’s mean yield in the
74
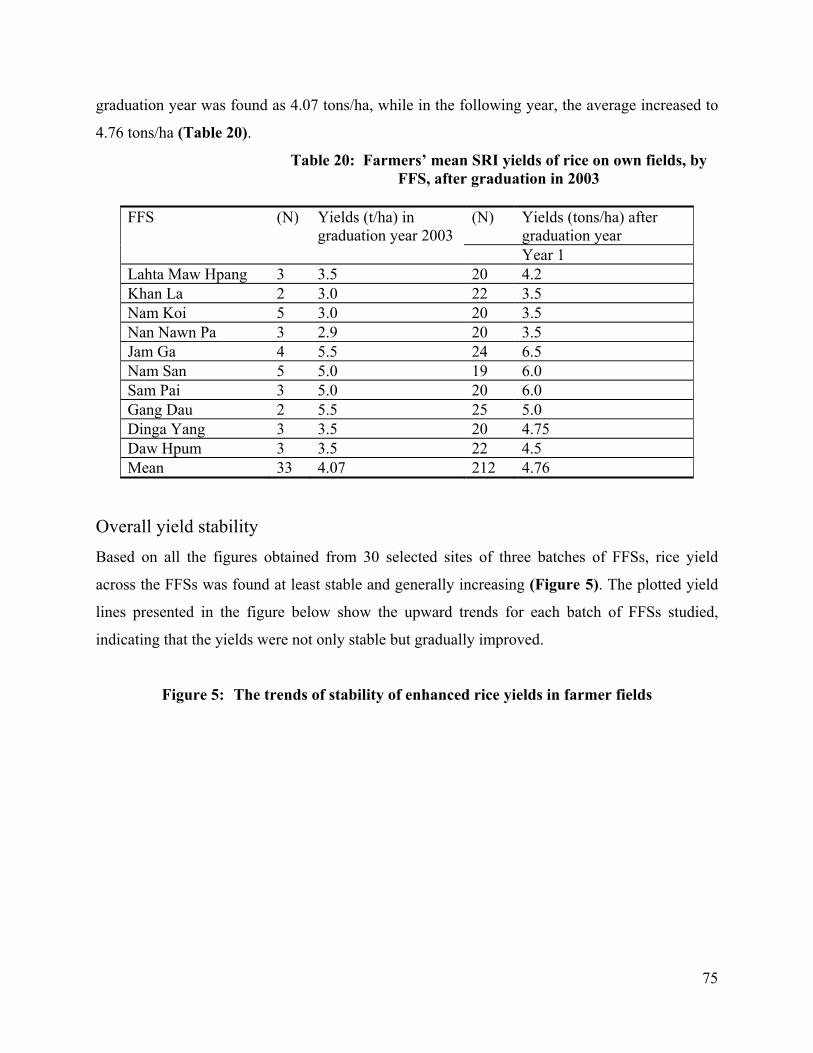
graduation year was found as 4.07 tons/ha, while in the following year, the average increased to
4.76 tons/ha (Table 20).
Table 20: Farmers’ mean SRI yields of rice on own fields, by FFS, after graduation in 2003
(N) Yields (tons/ha) after
graduation year FFS (N) Yields (t/ha) in
graduation year 2003 Year 1
Lahta Maw Hpang 3 3.5 20 4.2 Khan La 2 3.0 22 3.5 Nam Koi 5 3.0 20 3.5 Nan Nawn Pa 3 2.9 20 3.5 Jam Ga 4 5.5 24 6.5 Nam San 5 5.0 19 6.0 Sam Pai 3 5.0 20 6.0 Gang Dau 2 5.5 25 5.0 Dinga Yang 3 3.5 20 4.75 Daw Hpum 3 3.5 22 4.5 Mean 33 4.07 212 4.76
Overall yield stability Based on all the figures obtained from 30 selected sites of three batches of FFSs, rice yield
across the FFSs was found at least stable and generally increasing (Figure 5). The plotted yield
lines presented in the figure below show the upward trends for each batch of FFSs studied,
indicating that the yields were not only stable but gradually improved.
Figure 5: The trends of stability of enhanced rice yields in farmer fields
75

The trends of yield stability
0
1
2
3
4
5
2001 2002 2003 2004Years in FFS
Yie
lds
tons
/ha
1st batch 2nd batch 3rd batch
This overall result of yield stability (and improvement) indicates that FFS farmers, even after the
withdrawal of FFS support, are confident and able to maintain the rice yields that they acquired
on their own fields in the graduation year of FFS. Farmers’ confidence is a reflection of the
quality of skills and the kind of knowledge that they acquired from their regular participation in
FFSs. From this, one can see the longer-term effect of the FFS approach, especially how it is
contributing, one can infer, to the development of human quality.
The resulting yield stability within the FFS reveals another important fact about the
technologies, especially the practices of SRI, as to how effective they are in maintaining the
yield standard without any decline. This is very rarely seen with many traditional and
conventional methods/practices.
As the world is moving forward and as science and technologies are advancing faster, the
issues regarding environmental decline, deterioration of natural ecosystems or agroecosystems,
degradation of soil systems, contamination of water, with their ultimate effects on human health
as described in Chapter 1, are becoming more determining factors, affecting whether or not a
technology should be considered as sustainable, in addition to its capacity to increase yield. For
a particular technology, the overall issue of sustainability is now more important to farmers than
just simply ability to increase production. It is not just a matter of whether they can afford the
direct costs, but are there other incremental costs to the growing environment, affecting soil,
water, pests and diseases which they could no longer afford to carry on.
76
In all these respects, the SRI practices that farmers have learned within the FFSs can be
regarded as highly sustainable in that there was no yield decline noticed in any of the four years
of the study at any of the 30 selected sites, with a total of 612 farmers. The practices proved to be
low-cost as already seen in the previous sections. They do not include any use of chemicals that
can damage the growing environment. The particular characteristics of each of the practices,
however, are discussed in the coming sections.
77
6.5. The use of new technologies and their contribution toward yield
increases
During the course of each FFS, farmers were taught a wide range of technologies such as the use
of good quality seeds, how to grow better quality seedlings, selection of good rice varieties, the
various practices associated with SRI, compost use, preparation and use of indigenous
microorganisms (IMOs), preparing fruit juice and plant juice, using green manures, and many
practices to control insect and disease infestations. The use of these technologies/practices was
left up to the choice and decisions of the farmers based on their perceived needs and capabilities.
This meant that there was some variation from one FFS to another in terms of which practices
were chosen for use by farmers. All chose to use SRI practices on their farms once they had seen
the results at the FFS plot, but which SRI practices they would use was a matter for them to
decide. Although farmers generally believed that all the technologies were useful to improve rice
production, as the use of all of the technologies could be found in among the graduates of any
single FFS, though in a variable rank-order, farmers generally gave priority to the use of certain
technologies/practices. The three most popular innovations were SRI, the selection of better
quality seeds, and choosing a good rice variety.
A large percentage of farmers in each FFS were found to use all three of these
technologies, which they believed to be the most effective ones to improve rice yields. This
study, therefore, focuses on these three specific technologies and tried to find out their adoptions
and respective contributions to improving rice yields. To study the scale of adoption and the
percent of contribution of the selected technologies within the FFSs in three consecutive years
from 2002 to 2004, in each year two FFS were selected for intensive study. This was done
because studying all 612 farmers in the overall sample in such detail was not feasible; this 20%
sub sample covered 124 farmers, which is quite a substantial number to track. The data
presented below are the averages from those 6 FFS, 2 from each year.
78

6.5.1. The use of new technologies and farmers’ subsequent yield increase
In the first batch of FFS of category-I FFSs According to the data available from the 2 FFSs in 2002, 22 farmers on average were found to be
practicing 1 to 3 technologies at a time in each FFS (Table 21). Among them, 9 were found to be
using better quality seeds and SRI, 4 used higher quality seeds and a better variety, and 1 using
better variety and SRI, with 2 using all 3 practices. The rest of the farmers were found using a
single practice, either higher quality seeds, better variety, or SRI.
Table 21: Number of farmers using the new practices and their percentage of yield increases from 2002 to 2004
Practice (N) 02 AF (N) 03 AF (N) 04 AF (N) 02-04 AFBetter quality seed only
6 30 3 6 25 3 6 28 3 18 28±1e
3
Better variety only
2 20 1 2 15 1 2 20 1 6 18±1f
1
SRI only
4 150 2 6 150 3 6 130 3 16 143±3c
3
Higher quality seed + better variety
8 70 4 4 65 2 6 70 3 18
69±1d
3
Higher quality seed + SRI
18 200 9 14 190 7 12 170 6 44 189±2b
8
Better variety + SRI
2 200 1 4 180 2 4 180 2 10 184±3b
2
Higher quality seed + better variety + SRI
4 250 2 4 270 2 4 240 2 12
253±4a
2
Total 44 22 40 20 40 21 124 21 AF = Average number of farmers per FFS, (N) = total number of farmers from 2 FFS, 02 = % of yield increase in year 2002, 03 = % of yield increase in 2003, and 04 = % of yield increase in 2004. a, b, c, d, e, f = level of significance according to Duncan’s multiple range test.
All the technologies, used either singly or in combination with others, were found to provide
significant contribution to yield increase, ranging from 20 to 250% based on their types and
numbers used together. Among the farmers, 12 were found with more than 200% yield increase,
while only one had just a 20% increase. The contribution of yield increases was found to be
higher when all three technologies were applied together. Among the technologies, SRI was
79

found to provide the greatest yield benefits, and such benefits went up further when SRI was
applied with other technologies.
In the second batch of FFS or category II FFSs In 2003, the use and contribution of new technologies was found to be very similar to that in
2002. In the selected FFSs from 2003, 20 farmers on average were found using the technologies,
and they experienced 15 to 270% yield increases (Table 21). Among them, 2 farmers used three
technologies and experienced 270% yield increase. Out of 22, 14 farmers were able to make
more than 150% yield improvement, and similar to 2002 most of this yield increase came from
the use of SRI. 7 farmers were found using a single practice. Among them, only the
improvement of 4 farmers was found to be low compared with the other farmers in the FFS.
In the third batch of FFS or category-I FFSs In 2004, 21 farmers on average were found to be using the new technologies on their own fields,
concurrently with their FFS exercises, making 20 to 240% yield increases on their farms. Among
them, 10 were able to make more than a 170% yield increase, and from the rest, 3 were found to
be making 130% increase (Table 21). The yield increases for other 8 were between 20% and
70%. 13 farmers were found to be using more than 2 technologies. As with other farmers, most
yield improvement came through the use of SRI, and the next best contributing practice was
better quality seed.
The mean from three years The picture drawn from the 6 FFSs in 3 consecutive years indicates great consistency both in
terms of adoption of the technologies by the farmers as well as their particular contributions to
yield increase. The small percentage of variation observed in each year can be attributed to the
local conditions such as the quality of soils, rice varieties, and some persistence with the usual
management practices of rice. Farmers across these 6 FFS were found to use more than 10
different rice varieties.
More than half of the farmers were found to be using more than two technologies at a
time of our survey. The use of three technologies provided the highest percent yield increase,
while SRI as a single innovation made the highest contribution. This was consistently found over
the three years. The yield increases of around two-thirds of the farmers in each FFS were
80
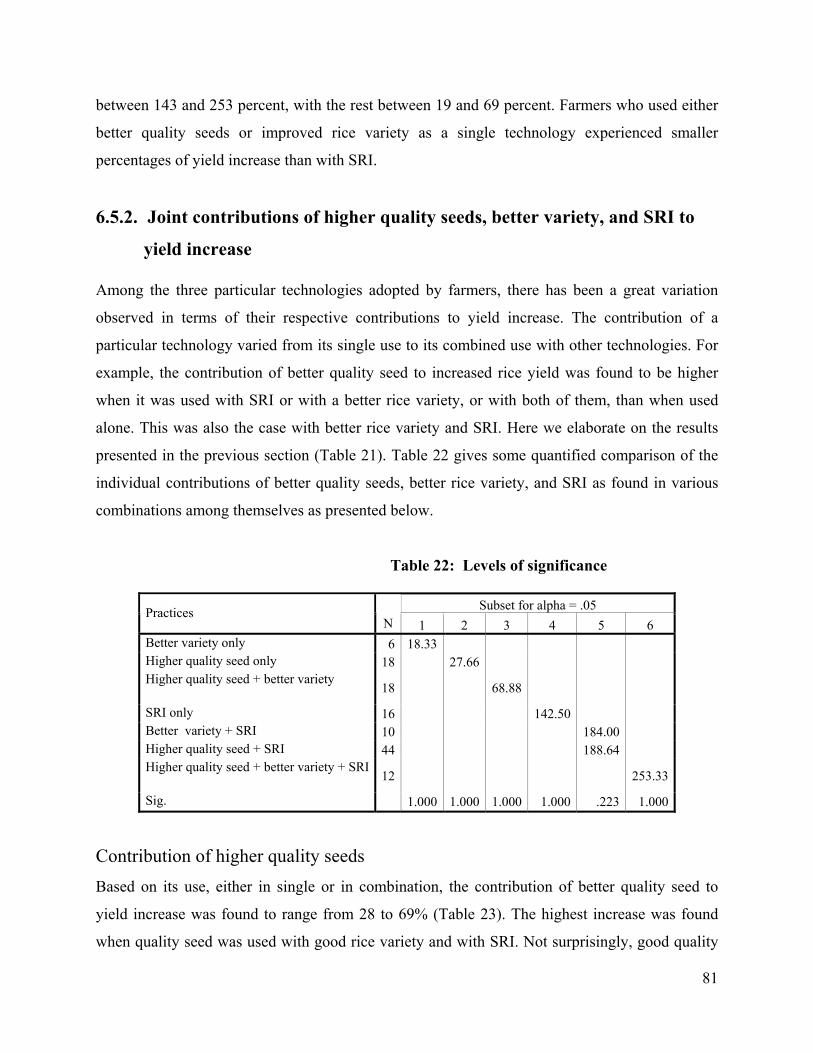
between 143 and 253 percent, with the rest between 19 and 69 percent. Farmers who used either
better quality seeds or improved rice variety as a single technology experienced smaller
percentages of yield increase than with SRI.
6.5.2. Joint contributions of higher quality seeds, better variety, and SRI to
yield increase
Among the three particular technologies adopted by farmers, there has been a great variation
observed in terms of their respective contributions to yield increase. The contribution of a
particular technology varied from its single use to its combined use with other technologies. For
example, the contribution of better quality seed to increased rice yield was found to be higher
when it was used with SRI or with a better rice variety, or with both of them, than when used
alone. This was also the case with better rice variety and SRI. Here we elaborate on the results
presented in the previous section (Table 21). Table 22 gives some quantified comparison of the
individual contributions of better quality seeds, better rice variety, and SRI as found in various
combinations among themselves as presented below.
Table 22: Levels of significance
Subset for alpha = .05 Practices N 1 2 3 4 5 6
Better variety only 6 18.33 Higher quality seed only 18 27.66 Higher quality seed + better variety
18 68.88
SRI only 16 142.50 Better variety + SRI 10 184.00 Higher quality seed + SRI 44 188.64 Higher quality seed + better variety + SRI
12 253.33
Sig. 1.000 1.000 1.000 1.000 .223 1.000
Contribution of higher quality seeds Based on its use, either in single or in combination, the contribution of better quality seed to
yield increase was found to range from 28 to 69% (Table 23). The highest increase was found
when quality seed was used with good rice variety and with SRI. Not surprisingly, good quality
81

seeds contributed more to yield increase when rice was grown with an appropriate variety and
using SRI practices. The second highest increase with good quality seed was found when it was
used with a good rice variety. The contribution of good quality seed was definitely higher when
used with good rice variety and also higher when used with SRI than in use by itself.
Table 23: Contribution of good quality seeds
Contributions of good quality seeds in percent from
Quality seeds alone Seeds and variety Seeds and SRI Seeds, variety and SRI
28% 50% 46% 69%
The contribution of quality seed alone was found to be 28%, which is less than half of
what was obtained in the best combination. This indicates that good quality seed has great
synergistic effect when combined with other important yield-contributing practices. One thing
needs to be mentioned here; although the contribution of quality seed, when used alone,
apparently seems lower, compared with other countries where the baseline yield is already more
than 5 tons/ha, a 28 percent yield increase is a very high percentage of contribution to yield
increase.
Contribution of better rice varieties Better rice varieties were found to contribute from 19 to 64 percent to improved rice yields. Like
good quality seed, better rice variety was also found to have a synergistic effect when applied
with other technologies. The highest percentage of contribution from better variety came when it
was grown with good quality seed using SRI management practices as seen in Table 24.
Table 24: Contribution of better rice varieties
Contributions of better variety in percent from
Variety alone Variety and seeds Variety and SRI Seeds, variety and SRI
19% 41% 41% 64%
82
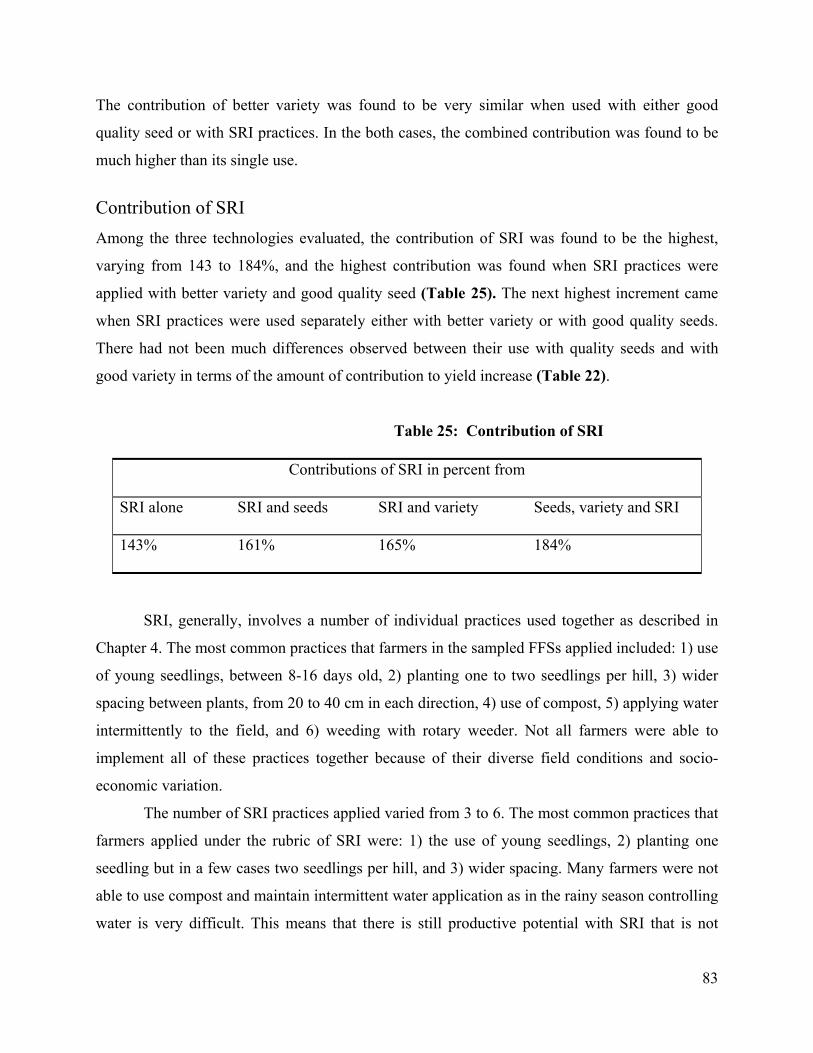
The contribution of better variety was found to be very similar when used with either good
quality seed or with SRI practices. In the both cases, the combined contribution was found to be
much higher than its single use.
Contribution of SRI Among the three technologies evaluated, the contribution of SRI was found to be the highest,
varying from 143 to 184%, and the highest contribution was found when SRI practices were
applied with better variety and good quality seed (Table 25). The next highest increment came
when SRI practices were used separately either with better variety or with good quality seeds.
There had not been much differences observed between their use with quality seeds and with
good variety in terms of the amount of contribution to yield increase (Table 22).
Table 25: Contribution of SRI
Contributions of SRI in percent from
SRI alone SRI and seeds SRI and variety Seeds, variety and SRI
143% 161% 165% 184%
SRI, generally, involves a number of individual practices used together as described in
Chapter 4. The most common practices that farmers in the sampled FFSs applied included: 1) use
of young seedlings, between 8-16 days old, 2) planting one to two seedlings per hill, 3) wider
spacing between plants, from 20 to 40 cm in each direction, 4) use of compost, 5) applying water
intermittently to the field, and 6) weeding with rotary weeder. Not all farmers were able to
implement all of these practices together because of their diverse field conditions and socio-
economic variation.
The number of SRI practices applied varied from 3 to 6. The most common practices that
farmers applied under the rubric of SRI were: 1) the use of young seedlings, 2) planting one
seedling but in a few cases two seedlings per hill, and 3) wider spacing. Many farmers were not
able to use compost and maintain intermittent water application as in the rainy season controlling
water is very difficult. This means that there is still productive potential with SRI that is not
83

being fully exploited in the results reported here. If farmers find that there is still additional yield
that can be reaped with the full set of practices, assuming that presently unused ones are cost-
effective at the margin, we could expect to see even greater agronomic and economic benefits.
Observed synergy When the combined contributions of certain individual practices are found to be more than the
sum of their respective individual contributions, or in other words, when the practices together
make a bigger contribution to output when all used together than the sum of their individual
separate contributions, we say that these practices have a synergistic effect. The significance of
this is seen in the bar graph in Figure 6. The right-hand bar which shows yield when the three
most common improved practices are used jointly, compared with the left-hand bar which
represents the total of their respective effects when compared with conventional practice.
Figure 6: The synergistic effect in SRI
0
50
100
150
200
250
300
Perc
ent y
ield
incr
ease
1 2
Use of technologies
The synergistic effect
Synergistic effect
SRI
Variety
Quality seeds
This effect had been consistently observed over the last three years of the study among all the
three important technologies that farmers used within the FFS – good quality seed, better variety,
and SRI.
84

When each of these practices was used separately as a single technology, their total
cumulative contribution was found to be much less than when they were used together. The
contributions of good quality seed, better rice variety and SRI when used separately were found
to be 28%, 18% and 143%, respectively, with a total sum of individual contributions coming to
189% (Table 21). But when these improved practices were applied together, the yield increase
reached 253%, which is considerably higher than the sum of their individual additions. This extra
benefit is the result of synergistic effects, which means that the technologies are supportive to
each other, an important sign of sustainability toward their use to improve the yields of rice.
85
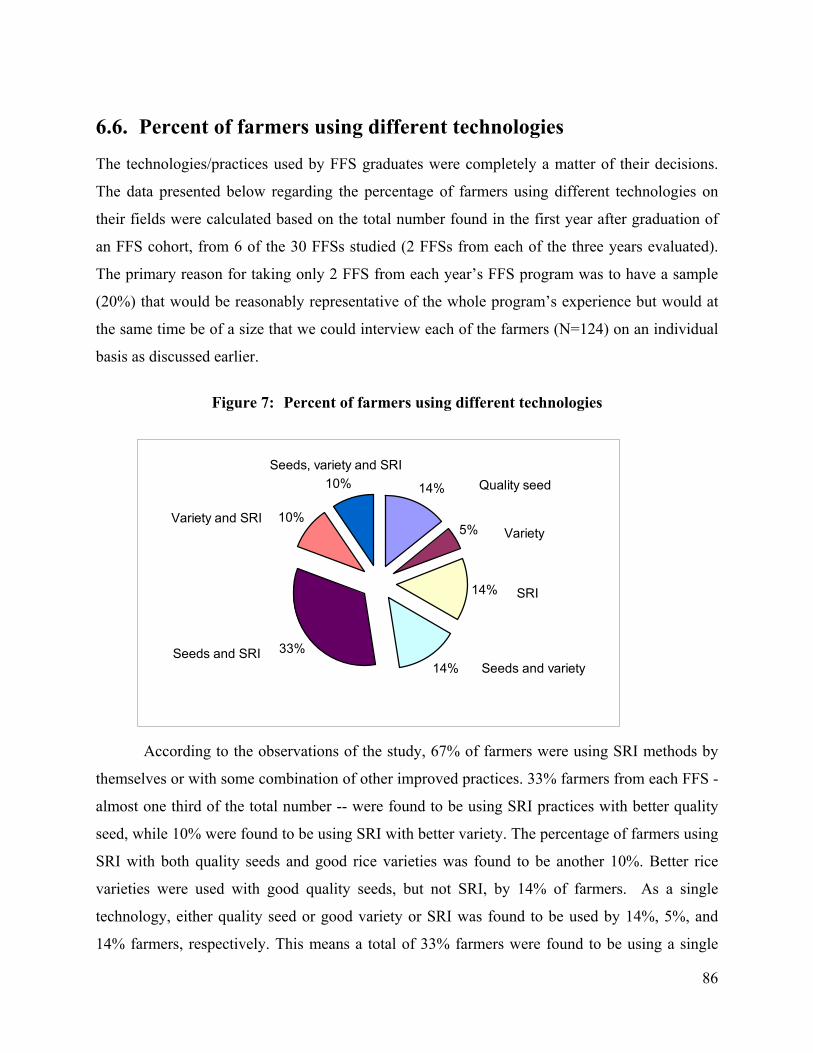
6.6. Percent of farmers using different technologies
The technologies/practices used by FFS graduates were completely a matter of their decisions.
The data presented below regarding the percentage of farmers using different technologies on
their fields were calculated based on the total number found in the first year after graduation of
an FFS cohort, from 6 of the 30 FFSs studied (2 FFSs from each of the three years evaluated).
The primary reason for taking only 2 FFS from each year’s FFS program was to have a sample
(20%) that would be reasonably representative of the whole program’s experience but would at
the same time be of a size that we could interview each of the farmers (N=124) on an individual
basis as discussed earlier.
Figure 7: Percent of farmers using different technologies
14%
5%
14%
14%33%
10%
10% Quality seed
Variety
Seeds and varietySeeds and SRI
SRI
Variety and SRI
Seeds, variety and SRI
According to the observations of the study, 67% of farmers were using SRI methods by
themselves or with some combination of other improved practices. 33% farmers from each FFS -
almost one third of the total number -- were found to be using SRI practices with better quality
seed, while 10% were found to be using SRI with better variety. The percentage of farmers using
SRI with both quality seeds and good rice varieties was found to be another 10%. Better rice
varieties were used with good quality seeds, but not SRI, by 14% of farmers. As a single
technology, either quality seed or good variety or SRI was found to be used by 14%, 5%, and
14% farmers, respectively. This means a total of 33% farmers were found to be using a single
86
technology. Two technologies together were being used by 57% of farmers, and only 10% of
farmers were using all 3 technologies together. Grouping the respective categories, 71% farmers
were found to be using better quality seed, 39% used a better rice variety, and as noted above,
67% were using SRI by itself or in various combinations.
The above picture, according to the data collected, represents how farmers are using the
practices in their first year after graduation from a FFS. This number in the following years, due
to the spread effects of FFSs, gradually increased. A detailed presentation is made in the
following section on how the spread effect influenced other farmers in the communities, and how
many of them were influenced by this effect to adopt the practices on their fields in the following
years. There are reasons worth considering for why in the first year not all FFS farmers were able
to adopt SRI on their fields. The two-thirds of farmers who adopted SRI practices on their fields
and experienced a tremendous yield increase in the first year were generally the more advanced
farmers in the community. The others who did not decide to apply SRI practices, while interested
in them, were more impressed by the simplicity of moving to use good quality seeds and/or
better rice varieties, and thus were happy to start just with these innovations in their first year
after FFS training. Nevertheless, in the following years, the activities and success of other
farmers influenced them to apply SRI practices on their own fields.
87

6.7. Spread effects of FFS in terms of yield increase by non-FFS
farmers through adoption of new technologies
The trends of spread effect over 3 years in terms of farmers’ participation The spread effect was studied in terms of the benefits accessed by farmers who had not
participated in FFSs. This benefit was measured by the number of farmers using the methods and
their associated yield gains. In the next year after graduation from a FFS in 2002 at the 10
selected sites, it was seen that along with FFS farmers, who had directly participated in the
regular activities of a FFS, there were an equal or higher number of non-FFS farmers who also
benefited indirectly from the FFS. The mean number of farmers participating in each FFS was
found to be 20 (Table 26), while along with them, within the same community, there were
around 24 other farmers who had not participated in the FFS but who were also benefiting from
the new practices.
Table 26: Number of non-FFS farmers associated with Category-I FFSs
and their production increases (in percentage) from 2002 to 2004
FFS farmers Non-FFS Farmers (N) 2002 (N) 2002 (N) 2003 (N) 2004Nawng Hkying 24 82% 20 50% 32 45% 46 43%10 Miles 20 95% 25 39% 35 42% 42 40%Gat Sha Yang 18 102% 15 40% 22 45% 30 42%N-gan 22 147% 23 60% 28 49% 32 50%Nawng Hkyi 20 59% 30 45% 38 % 48 52%Gara Yang 15 87% 26 45% 39 45% 51 43%Ja Pu 23 74% 32 34% 38 37% 49 38%Awng Mye Tit 18 100% 26 61% 35 56% 47 51%Mai Sak Pa 23 76% 23 45% 32 48% 43 50%Lawa Yang 19 105% 18 68% 29 65% 38 63%Mean 20 90% 24 49% 33 48% 43 47%Total 218 252 361 419
The spread effect in the second and third years after graduation of a FFS cohort (2003 and 2004)
was found to be even higher than in the first year after the graduation (2002). The mean numbers
of non-FFS farmers who were using different technologies were found to be around 33 in the
88

second year and 43 in the third year, compared with 24 in the first year after graduation, and 20
in the graduation year, which was also the beginning year of FFS. This brought the total number
of farmers using improved practices in a FFS community to 63, three times the number trained. It
should be mentioned here that 63 is the average number of persons who are engaged in farming
in these communities where FFSs were undertaken. This means within a four-year period the
benefits of SRI/FFS reached all farmers in the communities through a spread effect. The overall
trends of farmer’s participation within the FFS framework were seen to increase at the rate of
118%, 162% and 211% in the 1st, 2nd and 3rd years after the graduation of a FFS cohort,
respectively, compared with the initial number of participants in the first year of FFS (Table 27).
This indicates that the overall trend of spread effect is very stable, and this is also a good sign
that the impact of FFS is large and extensive, and that the external intervention is having
sustainable impact.
Table 27: Mean trend of increase of farmer participation in the following years of an FFS
Year in FFS Total no. of
participants Associated non-FFS participants
% increase in non-FFS participants
Graduated year 2001 20 1st year after graduation 2002 44 24 118 2nd year after graduation 2003 53 33 162 3rd year after graduation 2004 63 43 211
The trends of spread effect over 3 years in terms of farmers’ production increase The spread effect in terms of production increases among non-FFS farmers was found to be very
significant and stable, with no decreasing trend in any of the three years of the study. In the first
year after graduation of a FFS cohort, on average, 24 non-FFS farmers were able to achieve a
49% production increase (Table 26). While in the following years, the number of such farmers
increased, they maintained a similar percentage of production increase (Figure 8). The
production increase in the second and third years by non-FFS farmers was recorded as 48% and
47%, respectively (Table 26), while the number of such farmers increased at the rate of 162%
and 211% (Table 27). This indicates a two-way rolling effect - both vertically by providing an
89

increase in production, and horizontally by bringing the technologies/practices to a larger
number of farmers in the community on a continuous basis.
Table 28: Percent of mean increase of production by non-FFS farmers from FFS
Year after graduation of FFS
Average number of non-FFS farmers benefited from a FFS
% increase in production
1st year 24 49 2nd year 33 48 3rd year 43 47
Figure 8: The trend of participation and benefits of non-FFS farmers from FFS
The trend of benefits of non-FFS farmers from FFS
0
20
40
60
80
100
1st year 2nd year 3rd year
No of farmers %Production increase
A number of factors could have contributed to this highly successful ‘roll-on’ effect. Among
them, of course, the informal sharing of information and experience from FFS farmers played a
crucial role, but there was also a sharing mechanism, more specifically a learning and sharing
environment created, within the FFS group that made a large contribution. FFS study-fields
served as large demonstrations for the other farmers in the community, and the FFS field-days,
where all community farmers were invited together, provided an effective opportunity to share
the learning of FFS farmers with non-FFS farmer neighbors. How much contribution the FFS
90

study-fields and the field-days made is a matter for another analysis, the results of which are
presented in following sections.
In addition to field-days and study-fields, the nature of the technologies that were used
within the FFS played a role. The contribution and effectiveness of each of the technologies to
large-scale yield increase could be considered as another reason why the practices were
disseminated so quickly and so extensively. The best attribution could be made to the combined
effect of both the learning and sharing process of FFS and the effectiveness of the technologies
that were used within the FFS. It is reasonable to argue that both the technologies and the
processes that were used within the FFS were supportive of each other in an effort to enhance
farmers’ skills and their ability to increase rice production. With such a combination, a large-
scale ‘roll-on’ effect took place spontaneously.
91

6.8. Percent of farmers in a community accessing the yield benefits
from FFS
Based on the results presented in the previous section, it was evident that within a period of four
years, the benefits of FFS can reach almost all farmers in a community. According to the mean
figure, an FFS usually started with 32% of the farmers in a community participating in this mode
of experimental and experiential training. With the rolling effect, starting from the next year,
within a four-year period, the benefits of FFS training reached practically all farmers, as seen in
Figure 9.
Figure 9: The trend of participation of the community in terms of accessing benefits from FFS Percent of farmers accessing benefits from FFS
y = 21.476x + 16.953R2 = 0.9386
0
20
40
60
80
100
120
1st year 2nd year 3rd year 4th year
The mean benefits of FFS were found to be disseminated within the community at the rate of
32%, 69%, 83% and 99% in the first, second, third and fourth years of FFS programming,
respectively (Table 29). In such dissemination, among all the selected FFSs, great consistency
was observed. Reaching the benefits to all farmers in the community in such a short period is
undoubtedly a remarkable achievement.
It is likely that the nature of the technologies/ practices and of the processes that were
used within the FFSs contributed to the outcomes observed. The nature of these practices is that
they do not entail added costs for farmers to apply on their fields as seen in the cost and return
analysis section (Chapter 2). Because rice is a self-pollinated crop, farmers can produce their
92
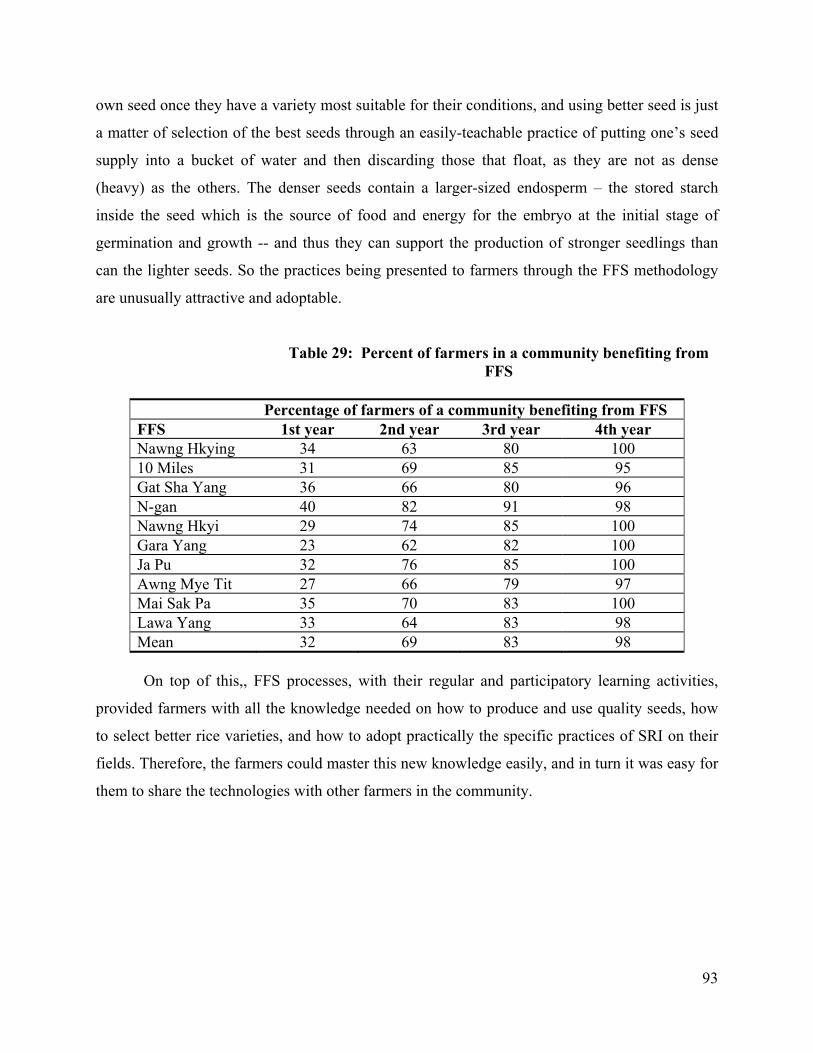
own seed once they have a variety most suitable for their conditions, and using better seed is just
a matter of selection of the best seeds through an easily-teachable practice of putting one’s seed
supply into a bucket of water and then discarding those that float, as they are not as dense
(heavy) as the others. The denser seeds contain a larger-sized endosperm – the stored starch
inside the seed which is the source of food and energy for the embryo at the initial stage of
germination and growth -- and thus they can support the production of stronger seedlings than
can the lighter seeds. So the practices being presented to farmers through the FFS methodology
are unusually attractive and adoptable.
Table 29: Percent of farmers in a community benefiting from FFS
Percentage of farmers of a community benefiting from FFS FFS 1st year 2nd year 3rd year 4th year Nawng Hkying 34 63 80 100 10 Miles 31 69 85 95 Gat Sha Yang 36 66 80 96 N-gan 40 82 91 98 Nawng Hkyi 29 74 85 100 Gara Yang 23 62 82 100 Ja Pu 32 76 85 100 Awng Mye Tit 27 66 79 97 Mai Sak Pa 35 70 83 100 Lawa Yang 33 64 83 98 Mean 32 69 83 98
On top of this,, FFS processes, with their regular and participatory learning activities,
provided farmers with all the knowledge needed on how to produce and use quality seeds, how
to select better rice varieties, and how to adopt practically the specific practices of SRI on their
fields. Therefore, the farmers could master this new knowledge easily, and in turn it was easy for
them to share the technologies with other farmers in the community.
93

6.9. Factors influencing the adoption of practices by farmers
The results presented in the earlier sections have shown how many farmers on average from each
community participated in FFS; how many of them using the practices that were taught and used
within the study-fields of FFS; how many were using which practices, how much benefit they
received by using those practices in terms of increase in rice yields and production; and which
practices provided how much contribution to the overall yield and production increases of
farmers. Then in later sections, it was shown how many other farmers from the same community
who did not participate in the FFS were using those practices; and how much yield and
production benefits they had received by the use of those practices.
With all this, the sections above have presented the trends of overall adoption of SRI
practices along with other practices facilitated under FFS by farmers on their own fields. The
following sections present how this adoption has actually taken place, especially, which factors
provided how much influence to this adoption process. During the study, there are two sets of
factors found to be influencing the overall adoption of SRI, one set particularly related to the
adoption process of FFS farmers, with another related to the adoption of non-FFS farmers.
6.9.1. Factors influencing the adoption process of FFS farmers
To study the adoption process of FFS farmers, specifically which factors influenced them to
apply certain SRI practices on their own fields, a set of open-ended questionnaires was prepared
and used to facilitate open discussions among the farmers in each FFS. The discussions were
organized in three consecutive years from 2002 to 2004, with each year all the 10 sampled FFSs
trained in that particular year being surveyed. During the discussions through the selected
questionnaire, farmers in large groups were asked why and how they became interested to apply
the practices on their fields.
According to their answers and the responses given, five types of factors were found to
be mainly responsible for their adoption of SRI. These were: a) the rice yields of the FFS study-
field, b) activities related to the FFS study-field, c) the regular learning sessions of the FFS, d)
the field-day activities, and e) some other supplementary activities, which were not very regular
in FFS. No one of these factors stood out the single most influential factor for the overall
94

adoption of SRI by any farmers, and there was impressive consistency in farmers’ answers
across the three years. It appears that the combined effect of all the factors influenced farmers to
adopt practices according to their needs. However, there were sharp differences observed among
the factors in terms of their degree of influence on farmers (Table 30).
Table 30: Factors influencing the adoption of SRI by FFS farmers,
2002-2004, and average for the three years
Factors (N)
2002 Response
(N)
2003 Response
(N)
2004 Response
(N)
2002-2004 Ave.
Yields of FFS study-field
202 27% 198 29% 212 30% 612 28%
Activities of study-field
202 38% 198 39% 212 38% 612 38%
FFS learning sessions
202 25% 198 27% 212 26% 612 26%
Field-day activities
202 1% 198 0% 212 0% 612 0%
Others 202 8% 198 5% 212 6% 612 6%
Figure 10: Factors influencing FFS farmers adoption
39%
0%
29%6%
26%
Yields of FFS study field
Activities of study field
FFS learning sessions
Others
To understand the importance of each factor in terms of its influence on the adoption
process, each FFS farmer was asked to score each factor, on a scale of 1 to 100 points, based on
its degree of influence to his/her adoption of SRI. According to the overall scores provided by all
95

the FFS farmers from 30 different FFSs for the three-year period, 2002 to 2004, the factors
compare as follows in terms of their influence
a. Activities in study-fields – factor number 1 Based on the mean scores of 612 FFS farmers from 30 sampled FFS over the three-year period
from 2002 to 2004 (Table 30), the activities undertaken in study-fields appeared to be the most
impressive factor or reason why farmers felt encouraged to adopt the practices on their own
fields. This was consistently reported by the FFS farmers in each of the three cohorts.
Among the first graduated batch in 2002, FFS farmers provided the highest score (38) to
the activities in their FFS study-fields (Table 30). In the other years, a similar response was
received from the second and third graduated batches of FFS, as farmers’ respective scores for
study-field activities were 39 and 38 (same table). Farmers who participated in the FFS gained
direct experience in growing rice with the new methods on the study-field of the FFS. In
addition, they conducted various experiments and established comparative trials on the study-
field, based on their particular interests and problems encountered during the study.
Table 31: FFS farmers mean scores across FFSs in 2002 for factors that they felt influenced their adoption
FFS (N) Yields of
FFS study-field
Activities in study-
field
FFS learning sessions
Field-day activities
Others
Nawng Hkying 24 25 43 20 0 12 10 Miles 20 35 35 25 0 5 Gat Sha Yang 18 20 39 30 3 8 N-gan 22 30 25 30 5 10 Nawng Hkyi 20 19 40 26 0 15 Gara Yang 15 35 42 17 0 6 Ja Pu 23 31 35 23 3 8 Awng Mye Tit 18 28 40 17 0 15 Mai Sak Pa 23 25 43 32 0 0 Lawa Yang 19 28 36 32 0? 4 Mean 202 28 38 25 1 8
Interestingly, both of these activities provided a real and very systematic opportunity to
learn how to grow rice using SRI practices. By growing rice themselves and by conducting
various comparative studies within the study-field area of FFSs, they could see there was no risk
96

when using the SRI practices, and furthermore, given the performance of the trials and studies,
they could see which combinations of practices (i.e., spacing, number of seedlings, etc.) worked
better. As a result, they became more confident about the possible outcome of SRI, and did not
feel it involved significant risk, unlike other farmers in general situations who had to make
decisions to use the practices on their fields without such experience.
Table 32: FFS farmers’ overall scores across FFSs in 2003
for factors that they felt influenced their adoption
FFS (N) Yields of FFS study-
field
Activities in study-field
FFS learning sessions
Field-day activities
Others
Hka Wang 20 35 34 20 0 11 Pung Dung 18 30 35 30 0 5 Chyara Pati 22 34 40 20 0 6 Mali Hka 20 28 40 22 0 10 Mading 22 32 38 25 0 5 Katsu 20 17 45 30 0 8 Thing Nan Kawn 18 29 40 28 3 0 N myen 20 24 38 34 0 4 Ding Hkung 18 30 38 30 2 0 Nalung (lower) 20 30 39 28 0 3 Mean 198 29 39 27 0 5
b. Yields of FFS study-field – factor number 2 The second most influential factor for the adoption of SRI by FFS farmers was the higher yields
obtained from the FFS study-fields. According to the average scores provided by farmers from
three years of the study, higher yields of rice within the FFS study-field received 28 points as
against 38 assigned to the activities of FFS study-field (Table 30 and Figure 10). The reasons of
considering this as the second most influential factor is that while many farmers made their
decision to use the practices on their own field simultaneously with their involvement with the
FFS study-field, they were already impressed with the initial growth of the SRI seedlings and
young plants on the study-field. Still there were a large number of farmers who were not fully
convinced about the practices and therefore decided to wait until they could see the actual
harvest. For those farmers, the massive yields of the FFS study-field served as a reinforcing
97

factor to make the decision to adopt the practices on their own fields. The scores provided by
farmers for this factor in each of the three years of the study were found to be very similar and
consistent (Tables 30, 31, 32 and 33).
Table 33: FFS farmers’ overall scores by FFS in 2004
for factors that they felt influenced their adoption
FFS (N) Yields of FFS study-
field
Activities of study-field
FFS learning sessions
Field-day activities
Others
L Maw Hpang 20 35 40 20 0 5 Khan La 22 37 32 31 0 0 Nam Koi 20 25 41 30 0 4 Nan Nawn Pa 20 31 38 26 0 5 Jam Ga 24 25 39 30 0 6 Nam San 19 31 38 21 0 10 Sam Pai 20 29 41 25 0 5 Gang Dau 25 31 37 20 0 12 Dinga Yang 20 28 39 28 0 5 Daw Hpum 22 29 35 31 0 5 Mean 212 30 38 26 0 6
c. FFS learning sessions – factor number 3 The third most important factor influencing the adoption of new practices by FFS farmers was
found to be the FFS learning sessions, regularly facilitated during the FFS period. During the
learning sessions, the general principles of SRI were explained to farmers, especially why and
how rice grown with SRI methods performs better, and how, based on those principles, the
practices should be developed and modified to tackle the particular conditions of individual
farmers. In addition, there were many practical sessions, followed by interactive and lively
discussions among the farmers facilitated by the FFS facilitator on various aspects of rice
production. These practical sessions provided them with further opportunities for learning the
details of SRI, specifically how to produce and transfer young seedlings to the main field, how to
produce and apply compost as needed for SRI, and how to cultivate the soil or use the weeder as
recommended for weeding and aerating the soil
98

The combined effect of all those sessions supported by some additional subject-specific
sessions, which were very regular to FFS, enriched the general knowledge and overall
understanding of FFS farmers about rice cultivation. As a result, they came up with a better
understanding than the average farmers about crop improvement. Then it became easy for them
to use the practices effectively on their fields.
d. Other activities – factor number 4 The fourth factor considered includes a number of activities that were not very regular in FFS
such as providing quality seeds to FFS farmers, supplying new rice varieties to the FFS,
organizing cross-visits among farmers’ fields within the FFS and outside the FFS, supplying
some farmers with new rice weeders or other materials, distribution of printed materials about
FFS and SRI, etc. As compared to the other factors, the influence of these non-regular activities
of FFS was very low in the overall adoption of SRI. Nevertheless, they could be considered as
supportive activities because they boost the morale and interest of some farmers. The distribution
of quality seeds made some farmers instantly interested to try SRI practices on some part of their
land, while some farmers said the distribution of the printed material guided them on how to
adopt the practices to their field conditions. The three-year mean score for all these
supplementary activities of FFS was found to be 6 as compared with 26, 28, and 38 as the mean
scores of FFS learning sessions, the yield obtained from the FFS study-field, and the activities on
FFS study-fields, respectively (Table 30).
e. Field-day activities While field-day activities raised the confidence of FFS farmers in terms of their ability to
organize the communities and share with them their learning from FFS activities, field-day
activities in general had virtually no effect on the overall adoption of SRI by FFS farmers.
Nevertheless, the activities were important to the adoption of SRI by non-FFS farmers, as
discussed below.
99

6.9.2. Factors influencing the adoption process of non-FFS farmers
A. Adoption in the first year after the graduation of FFS
To study the adoption process of SRI by non-FFS farmers, similar methodologies were used as
were used in prior data gathering with FFS farmers. Meetings and group discussions were
organized with non-FFS farmers who started using the practices in the first year after the
graduation of the FFS. To understand the importance of each factor in terms of its influence on
their adoption process, each non-FFS farmer was asked to score various factors on a scale from 1
to 100 points, based on its degree of influence on his/her adoption of SRI. The corresponding
score given against each factor was considered as the degree of influence of that factor on
farmers’ decision-making for adoption of SRI on their own fields.
According to the assessments of farmers who did not participate in FFS programs, across
three years, the mean scores of influential factors are shown in Table 34 which were thought to
be mainly responsible in influencing their adoption of SRI. While these are similar to those
influencing FFS farmers, no single factor could be singled out as the main influencing factor;
none of the factors was found to be responsible primarily for influencing the adoption of SRI by
any single non-FFS farmer. However, field-day activities, which were not important for FFS
farmers’ adoption turned out to be the most important factor identified. Overall, adoption was
seen to be influenced by the combined effect of factors.
Table 34: Factors influencing the adoption of SRI by
non-FFS farmers, 2002-2004, and three-year average Factors
(N) 2002
Responses
(N) 2003
Responses
(N) 2004
Responses
(N) 2002-2004
Ave. Yields of FFS study-field 238 19 232 14 221 17 691 17
Yields of FFS farmers’ fields
238 23 232 22 221 19 691 21
Sharing of experience by FFS farmers
238 25 232 27 221 26 691 26
Field-day activities 238 32 232 36 221 37 691 35
Others 238 2 232 1 221 1 691 1
100
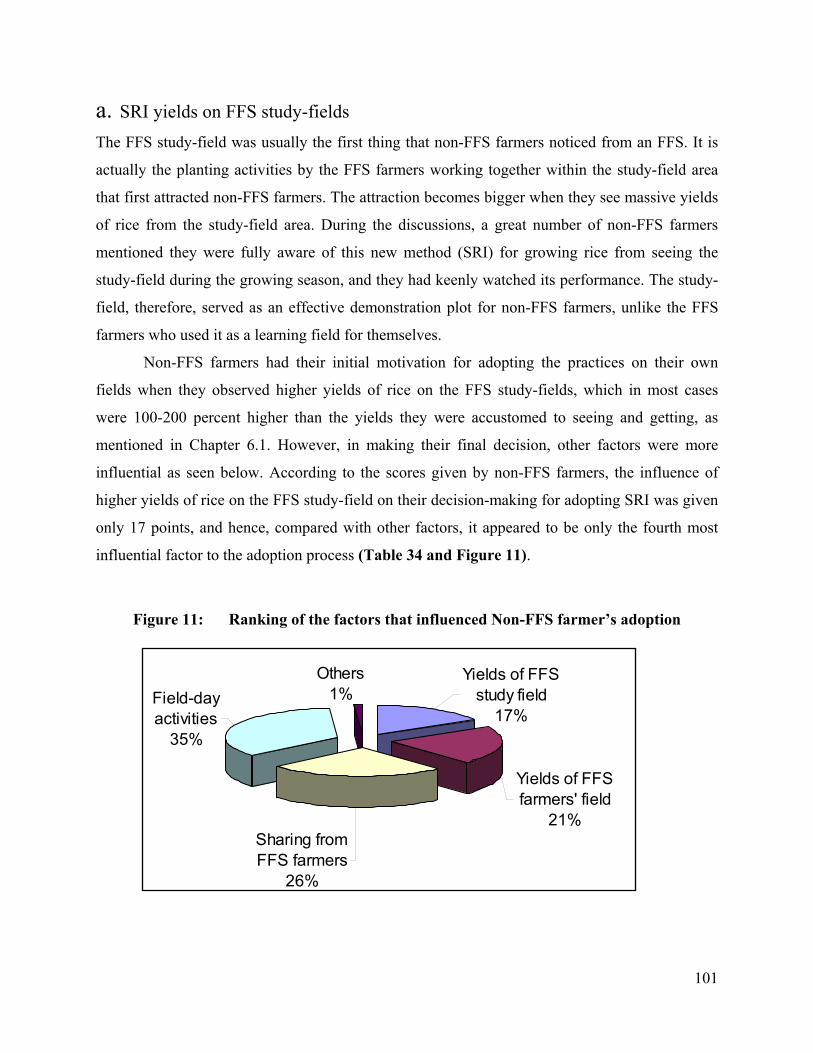
a. SRI yields on FFS study-fields The FFS study-field was usually the first thing that non-FFS farmers noticed from an FFS. It is
actually the planting activities by the FFS farmers working together within the study-field area
that first attracted non-FFS farmers. The attraction becomes bigger when they see massive yields
of rice from the study-field area. During the discussions, a great number of non-FFS farmers
mentioned they were fully aware of this new method (SRI) for growing rice from seeing the
study-field during the growing season, and they had keenly watched its performance. The study-
field, therefore, served as an effective demonstration plot for non-FFS farmers, unlike the FFS
farmers who used it as a learning field for themselves.
Non-FFS farmers had their initial motivation for adopting the practices on their own
fields when they observed higher yields of rice on the FFS study-fields, which in most cases
were 100-200 percent higher than the yields they were accustomed to seeing and getting, as
mentioned in Chapter 6.1. However, in making their final decision, other factors were more
influential as seen below. According to the scores given by non-FFS farmers, the influence of
higher yields of rice on the FFS study-field on their decision-making for adopting SRI was given
only 17 points, and hence, compared with other factors, it appeared to be only the fourth most
influential factor to the adoption process (Table 34 and Figure 11).
Figure 11: Ranking of the factors that influenced Non-FFS farmer’s adoption
Sharing from FFS farmers
26%
Others1%
Yields of FFS study field
17%Field-day activities
35%
Yields of FFS farmers' field
21%
101

b. SRI yields on FFS farmers’ fields Based on the three-year mean score, the higher yields of SRI rice on FFS farmers’ fields were the
third most influential factor affecting adoption of SRI by non-FFS farmers. According to the data
presented in Table 18 (Section 6.4), 15-20 percent of farmers from each FFS, on average, were
found to apply SRI practices on their own fields at the same time as they were experimenting on
the FFS study-field. The higher yields of these FFS farmers provided confirmation to non-FFS
farmers for what they were seeing on the FFS study-field. As a result, their level of confidence
about the effectiveness of the new practices rose higher than before. They saw that there was a
consistency in higher yields both on the FFS study-fields and on FFS farmers’ own fields.
Therefore, they become more confident that such yields would also be possible on their own
fields. The degree of influence of FFS farmers’ higher yields on the overall decision-making of
non-FFS farmers to adopt SRI practices on their fields was found to be 21% (Table 34).
Table 35: Mean scores of non-FFS farmers across FFSs in 2002 for the factors that they felt influenced their adoption
FFS (N) Yields on
FFS study-field
Yields on FFS
farmers' field
Sharing from FFS farmers
Field-day activities
Others
Nawng Hkying 20 15 15 36 34 0 10 Miles 25 19 32 19 25 5 Gat Sha Yang 15 21 23 21 32 3 N-gan 23 21 22 24 28 5 Nawng Hkyi 30 19 21 26 32 2 Gara Yang 26 23 22 16 39 0 Ja Pu 32 21 17 27 35 0 Awng Mye Tit 26 16 29 30 25 0 Mai Sak Pa 23 12 26 19 38 5 Lawa Yang 18 18 21 28 31 2 Mean 238 19 23 25 32 2
c. Sharing of experience by FFS farmers The influence of sharing by FFS farmers in the overall decision-making of non-FFS farmers for
adoption of SRI was found to be much higher than other factors. According to the scores given,
the sharing from FFS farmers made a 26% contribution to the decision-making of non-FFS
102

farmers (Table 34). This sharing covered mostly informal discussions and chats between FFS
farmers and non-FFS farmers and their families. According to the selection criteria, FFS farmers
were those in the community who were interested and had enough time to participate in the
regular activities of FFS. ‘Non-FFS’ farmers were usually friends or relatives of FFS farmer
families. While FFS participants performed any activity such as production and transplanting of
seedlings, preparation of compost, etc., this usually produced curiosity in the minds of non-FFS
farmers. As a result, they used to have frequent or at least occasional discussions regarding those
new activities or practices. In many cases, due to the closer proximity of their lands, one could
see what the other was doing.
Table 36: Mean scores of non-FFS farmers across FFSs in 2003 for factors that they felt influenced their adoption
FFS (N) Yields on
FFS study-field
Yields on FFS
farmers' fields
Sharing of experience
by FFS farmers
Field-day activities
Others
Hka Wang 23 16 25 23 34 2 Pung Dung 21 10 18 38 34 0 Chyara Pati 28 19 15 36 30 0 Mali Hka 25 17 26 25 27 5 Mading 21 20 16 34 28 2 Katsu 16 12 22 21 43 2 Thing N Kawn 23 12 31 23 34 0 N Myen 25 10 22 24 43 1 Ding Hkung 22 16 18 23 43 0 Nalung (lower) 28 12 25 20 41 2 Mean 232 14 22 27 36 1
Sharing was also stimulated by the observation of superior growth of SRI rice plants and
their better yield both on FFS study-fields and on the fields of FFS farmers. Many non-FFS
farmers, after being impressed by the superior growth and yields of SRI, made spontaneous visits
to FFS farmers who explained to them (the non-FFS farmers) the details of the practices which
were attracting their attention.
103

Table 37: Mean scores of non-FFS farmers by FFS in 2004 for factors that they felt influenced their adoption
FFS (N) Yields on
FFS study-field
Yields on FFS farmers' fields
Sharing of experience
by FFS farmers
Field-day activities
Others
Lahta M Hpang 18 18 22 28 32 0 Khan La 13 12 22 23 41 2 Nam Koi 26 21 21 22 34 2 Nan Nawn Pa 26 15 19 24 38 4 Jam Ga 29 22 16 28 33 1 Nam San 19 12 14 37 37 0 Sam Pai 19 21 16 25 38 0 Gang Dau 21 17 13 29 40 1 Dinga Yang 23 21 25 18 35 1 Daw Hpum 27 13 18 27 41 1 Mean 221 17 19 26 37 1
d. Field-day activities Based on the percent of influence as shown in Figure 11, field-day activities were found to be
the most important factor influencing the overall decision-making process of non-FFS farmers to
use SRI practices on their fields. The scores provided for the field-day activities by non-FFS
farmers in different years of the study were found to be much higher than those for other
decision-making factors and also consistent across FFS groups (Tables 35 to 37). The three-year
mean score for field-day activities was found to be 35 as compared to 26, 21 and 17 as the
respective mean scores for the other activities like sharing of experience by FFS farmers, yields
on FFS farmers’ fields, and the yields of the FFS study-field.
As the field-day was a more formal system of sharing between FFS farmers and non-FFS
farmers, unlike the other activities of the FFS, it provided non-FFS farmers a more organized
opportunity for interaction with FFS farmers and their FFS facilitators. Field-days, which were
usually organized at the end of the rice season or during the harvesting period, also served as a
display of various kinds of information about SRI and FFS, followed by systematic presentations
of the entire activities of the FFS, with particular focus on the practices that were used in
growing rice. Furthermore, it provided non-FFS farmers with an opportunity to see the actual
yields of rice, as usually during a field-day, rice yields were measured and calculated, either
104

through crop-cuts or through total harvest. All these activities provided non-FFS farmers with
more convincing reasons to believe that the SRI methods had more potential than their usual
methods. As a result, non-FFS farmers gave the highest score to field-day activities as the most
influential factor for their decision-making to use the new practices on their fields.
e. Other activities The influence of other activities was found to be minimal, with around 1% influence on the
overall decision-making of non-FFS farmers as compared with the other factors described
earlier. ’Other activities’ generally included what some non-FFS farmers heard about SRI from
relatives from other villages, or what some of their church leaders advised them to apply the
practices on their fields. As mentioned in Chapter 5, there were two church-based organizations
actively involved in the implementation of FFS and SRI. Some of their leaders with an interest in
agriculture, while visiting the communities, encouraged their communities to use the practices.
B. Adoption in the second and following year after the graduation of an FFS
Although in this study there had been no formal discussions or meetings organized with farmers
who started adopting the practices the second year after the graduation of an FFS, or later, to
know how their adoption took place, it could be that in those years, or since the graduation of
the FFS, there had been no FFS activities, and the only way that other farmers could know about
or be influenced by the use of SRI practices was either by considering the yields of those farmers
who were using the practices at the time, or by what could be directly learned from them.
Therefore, the overall adoption of SRI by these categories of farmers could largely be attributed
to the yields and experiences of FFS farmers, with non-FFS farmers starting to use the practices
since the first year after the graduation of an FFS. According to the data provided in Table 29,
by the end of the second year after an FFS (after the FFS year and the first year after the
graduation of an FFS), 69% of the farmers in each community were found to already adopting
the practices. By the next two years (the second and third year after the graduation of an FFS),
the yields and experiences of these farmers encouraged the rest of the farmers in the community
to adopt the practices on their fields.
105

6.10. The effect of field studies and farmer experimentation process
This section reports the results of the effect of farmers’ own experimentation process on the
overall adoption of SRI practices by farmers and their corresponding production gains. As
mentioned in Chapter 4, farmers’ experimentation is the usual process of learning in an FFS.
During this experimentation process, farmers in growing rice established many experiments or
season-long field studies: 1) to compare the performance of various methods that are used in rice
production; 2) to study the particular aspects of crop growth and production; and 3) to explore
options for finding solutions to the unanticipated problems that they encountered while growing
rice.
The size of the study-field is an important matter in the process of learning and adopting
SRI practices. It serves as a demonstration plot in terms of demonstrating to FFS farmers and to
other farmers in the community how much rice they can produce with the new practices. A
smaller study-field is easier to manage, but sometimes it does not provide much persuasion
because some people think it is easy to produce a higher yield on small plot. Small study-fields
often give a wrong perception as there are many possibilities of errors about yields, costs and
returns when calculated from a smaller area but expressed in larger units like tons per hectare.
Therefore, even after seeing very attractive yields, farmers may not feel confident to use the
practices on their own fields, because they feel the practices are applicable only in smaller areas.
Since the new practices are intensive in nature, farmers feeling this way are likely to believe that
SRI is only suitable to use in smaller areas.
A larger study-field, on the other hand, is more likely to provide a realistic picture of the
applicability of new technologies or new practices, as it demonstrates more reality in terms of the
yields, costs, returns, and other factors, and there are fewer or no chances of error. It is, however,
difficult to manage a larger size field, especially when just starting out with new practices. Since
two types of study-fields, smaller and larger, were used in the program, it was interesting to see
whether the size of the study-field had any impact on the overall adoption of SRI practices by the
farmers. The following section presents the results as to whether there was any relationship
between the size of the study-field and the adoption of SRI practices by farmers. The overall
results are presented in terms of the effect of study-field size on: 1) the scale of adoption of the
106
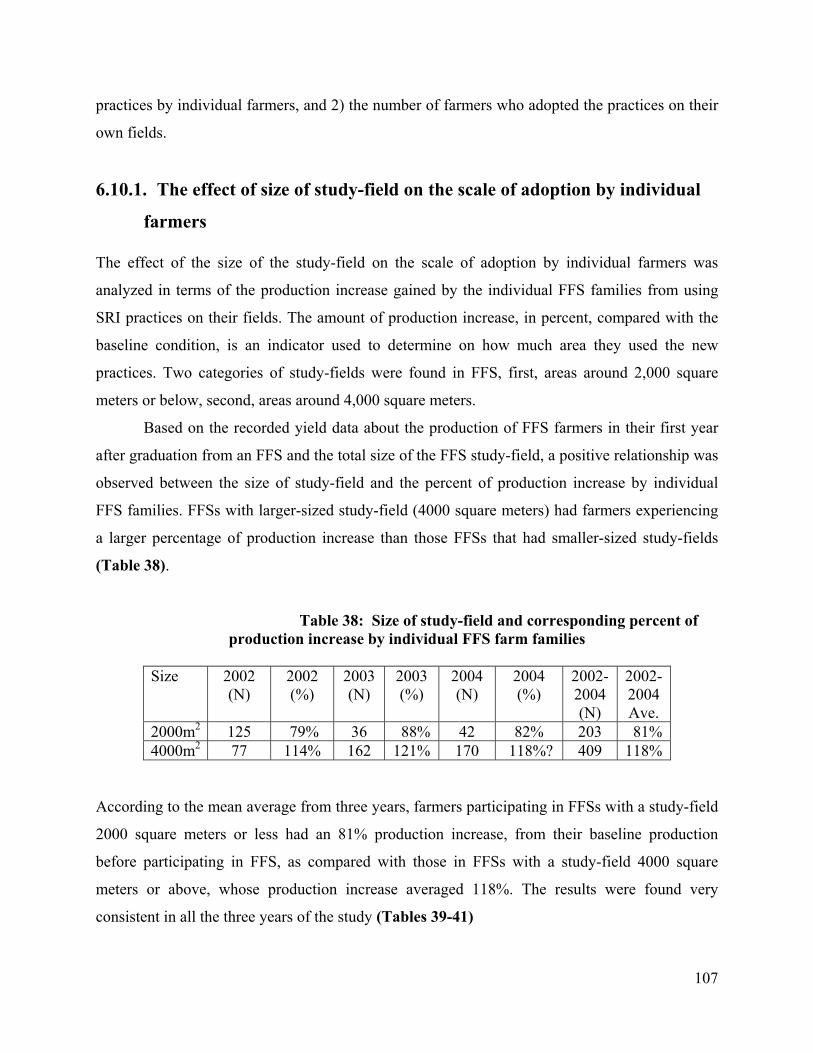
practices by individual farmers, and 2) the number of farmers who adopted the practices on their
own fields.
6.10.1. The effect of size of study-field on the scale of adoption by individual
farmers
The effect of the size of the study-field on the scale of adoption by individual farmers was
analyzed in terms of the production increase gained by the individual FFS families from using
SRI practices on their fields. The amount of production increase, in percent, compared with the
baseline condition, is an indicator used to determine on how much area they used the new
practices. Two categories of study-fields were found in FFS, first, areas around 2,000 square
meters or below, second, areas around 4,000 square meters.
Based on the recorded yield data about the production of FFS farmers in their first year
after graduation from an FFS and the total size of the FFS study-field, a positive relationship was
observed between the size of study-field and the percent of production increase by individual
FFS families. FFSs with larger-sized study-field (4000 square meters) had farmers experiencing
a larger percentage of production increase than those FFSs that had smaller-sized study-fields
(Table 38).
Table 38: Size of study-field and corresponding percent of production increase by individual FFS farm families
Size 2002
(N) 2002 (%)
2003 (N)
2003 (%)
2004 (N)
2004 (%)
2002-2004 (N)
2002-2004 Ave.
2000m2 125 79% 36 88% 42 82% 203 81%4000m2 77 114% 162 121% 170 118%? 409 118%
According to the mean average from three years, farmers participating in FFSs with a study-field
2000 square meters or less had an 81% production increase, from their baseline production
before participating in FFS, as compared with those in FFSs with a study-field 4000 square
meters or above, whose production increase averaged 118%. The results were found very
consistent in all the three years of the study (Tables 39-41)
107
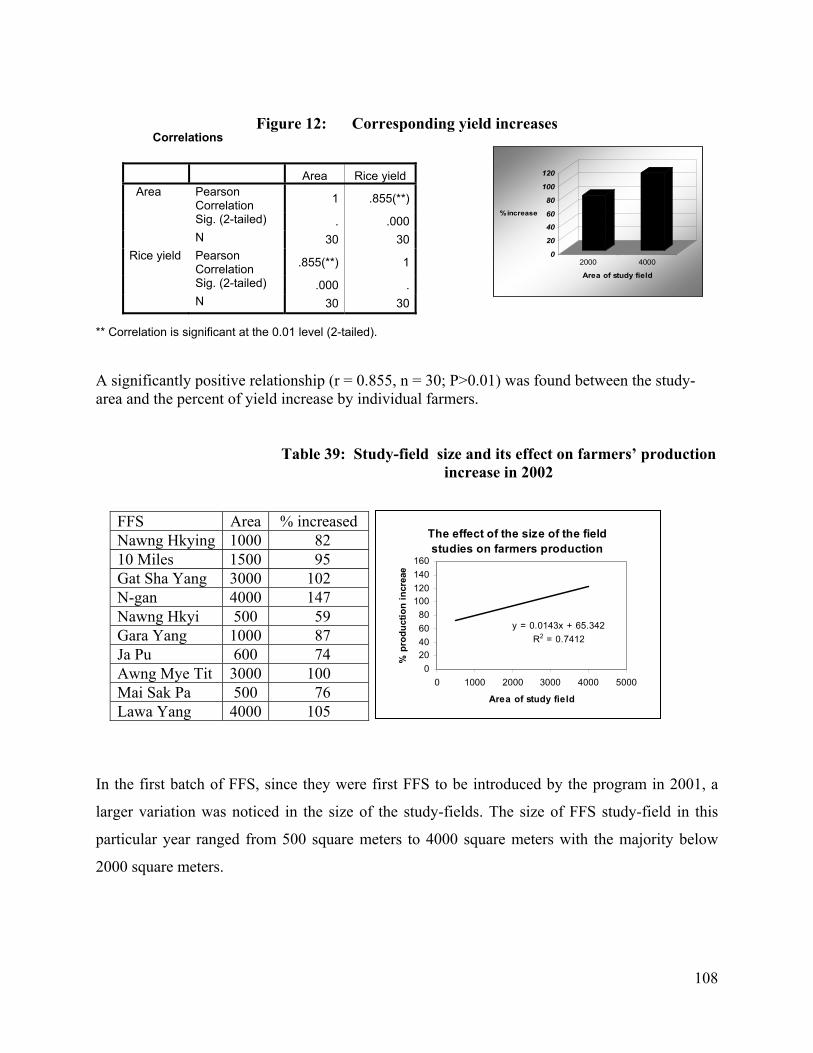
Correlations
Area Rice yield Area Pearson
Correlation 1 .855(**)
Sig. (2-tailed) . .000 N 30 30Rice yield Pearson
Correlation .855(**) 1
Sig. (2-tailed) .000 . N 30 30
Figure 12: Corresponding yield increases
0
20
40
60
80
100
120
% increase
2000 4000
Area of study field
** Correlation is significant at the 0.01 level (2-tailed).
A significantly positive relationship (r = 0.855, n = 30; P>0.01) was found between the study-area and the percent of yield increase by individual farmers.
Table 39: Study-field size and its effect on farmers’ production increase in 2002
The effect of the size of the field studies on farmers production
y = 0.0143x + 65.342R2 = 0.7412
020406080
100120140160
0 1000 2000 3000 4000 5000
Area of study field
% p
rodu
ctio
n in
crea
e
FFS Area % increased Nawng Hkying 1000 82 10 Miles 1500 95 Gat Sha Yang 3000 102 N-gan 4000 147 Nawng Hkyi 500 59 Gara Yang 1000 87 Ja Pu 600 74 Awng Mye Tit 3000 100 Mai Sak Pa 500 76 Lawa Yang 4000 105
In the first batch of FFS, since they were first FFS to be introduced by the program in 2001, a
larger variation was noticed in the size of the study-fields. The size of FFS study-field in this
particular year ranged from 500 square meters to 4000 square meters with the majority below
2000 square meters.
108

Table 40: Study-field size and its effect on farmers’ production increase in 2003
The effect of the size of the field study on
farmer's produciton
y = 0.0168x + 54.5R2 = 0.7224
020406080
100120140160
0 1000 2000 3000 4000 5000
Area of study field
%pr
oduc
tion
incr
ease
FFS Area % increasedHka Wang 4000 105 Pung Dung 2000 90 Chyara Pati 4000 121 Mali Hka 4000 122 Mading 4000 129 Katsu 4000 134 Thing Nan Kawn 4000 109 N myen 4000 126 Ding Hkung 2000 86 Nalung (lower) 4000 126
It was interesting to notice that a higher percent increase in production by farmers came
from FFSs that had a larger-sized study field, and there had been for the first time a positive
relationship observed between the size of the study fields and the percentage of production
increase by the associated FFS farmers (figure under Table 39).
Based on such learning, the project in the following years emphasized larger-sized study-
fields, except in a few locations (two out of the ten selected sampled FFS in both 2002 and 2003)
where due to some social constraints or the facilitator’s limited understanding, it was not
possible to establish larger-sized study-fields.
Table 41: Study-field size and its effect on farmer’s production
increase in 2004
The effect of the size of study field on farmer's production
y = 0.0181x + 45.375R2 = 0.6083
020406080
100120140
0 1000 2000 3000 4000 5000
Area of study field
% p
rodu
ctio
n in
crea
se
FFS Area % increasedLahta Maw Hpang 4000 100 Khan La 2000 90 Nam Koi 4000 100 Nan Nawn Pa 4000 133 Jam Ga 4000 115 Nam San 4000 129 Sam Pai 4000 125 Gang Dau 4000 111 Dinga Yang 2000 73 Daw Hpum 4000 128
109
The results in these years were found to be very similar to those in the first year, and again the
higher percentage of production increase by farmers came for FFSs that had larger-sized study-
fields (Tables 40 and 41).
How the larger-sized study-fields influenced the attainment of higher production
increases was that it gave farmers a clearer picture about the adoptability/adaptability of the
practices in large areas. Though farmers are generally impressed by the superior yields of SRI,
due to the intensity of the practices, many farmers under FFS with smaller size study-field were
not confident enough to put more of their own area under SRI. On the other hand, farmers who
participated in FFSs with a larger-sized study-field saw for themselves the practicability of using
SRI on a larger scale. The use of SRI on around 4000 square meters area – the size of an acre of
land, with better yield performance -- was a good demonstration of the methods’ capabilities. As
a result, these farmers were very confident and put more area under cultivation with SRI
methods. They were able to produce more than the other farmers from FFSs with smaller sized
study-fields.
110

6.10.2. The Effect of size of FFS study-field on the number of farmers
adopting practices
Based on the data plotted in Figure 13 regarding the number of farmers, both FFS and non-FFS,
who were found using SRI practices on their fields in the first year after their graduation from an
FFS, and the size of the study-fields of their FFSs, no concrete relationship was found between
the size of the study-field, whether small or large, and the number of farmers using SRI
practices.
Figure 13: Effect of the size of FFS study-field on number of farmers adopting SRI
0
10
20
30
40
50
60
0 1000 2000 3000 4000 5000Area of study fields
No
of fa
rmer
s
According to the data derived from 30 sampled FFS in a three-year period, under both categories
of FFS, with larger as well as smaller-sized study-fields, there were higher as well as lesser
numbers of farmers found using SRI practices (Table 42).
Table 42: Mean effect of the size of FFS study-field on the number of farmers adopting SRI practices
Size 2002
(N) 2002 2003
(N) 2003 2004
(N) 2004 2002-
2004 (N)
2002-2004
2000m 6 45 2 43 2 42 10 44 4000m 4 40 8 43 8 43 20 42
(N) = number of FFS
111

Among the first batch of FFSs in 2002 -- the first year after the graduation of FFS -- 55 farmers
were found as the highest number of farmers using the SRI practices, and they were from a FFS
that had a study-field less than 2000 square meters (600 square meters); while against this, 33
farmers was the lowest number of farmers using the SRI practices in a FFS that had a study-field
more than 2000 square meters (3000 square meters) (Table 43).
Table 43: Effect of FFS study-field area on the number of farmers using SRI in 2002
0
10
20
30
40
50
60
1000 1500 3000 4000 500 1000 600 3000 500 4000
Relationship FFS Area FarmersNawng Hkying 1000 44 10 Miles 1500 45 Gat Sha Yang 3000 33 N-gan 4000 45 Nawng Hkyi 500 50 Gara Yang 1000 41 Ja Pu 600 55 Awng Mye Tit 3000 44 Mai Sak Pa 500 46 Lawa Yang 4000 37
Similar results were observed in 2003 and 2004 among the second and third batch of
FFS. The size of the study-field was found to have no impact on the number of farmers using the
practices on their fields.
Table 44: Effect of FFS study-field area on the number of farmers using SRI in 2003
0
10
20
30
40
50
60
4000 2000 4000 4000 4000 4000 4000 4000 2000 4000
FFS Area FarmersHka Wang 4000 43 Pung Dung 2000 40 Chyara Pati 4000 42 Mali Hka 4000 40 Mading 4000 45 Katsu 4000 50 Thing Nan Kawn 4000 38 N myen 4000 42 Ding Hkung 2000 45 Nalung (lower) 4000 45
Relationship
112

Why there should have been no relationship found between the two variables could be because
the primary purpose of the study-field was to provide farmers an opportunity for learning and
practicing the methods of SRI and other aspects of rice production. Regardless of the size of
study-field, whether small or large, the field was able to provide this opportunity to farmers
successfully. Therefore, although the study-field was an important factor in farmers’ learning and
decision-making about the use of the practices on their fields, its size was not an important factor
affecting their success in using the methods since both smaller and larger sizes of study-field
were equally successful for that purpose.
Table 45: Effect of FFS study-field area on the number of farmers in 2004
0
10
20
30
40
50
60
4000 2000 4000 4000 4000 4000 4000 4000 2000 4000
FFS Area FarmersLahta Hpang 4000 36 Khan La 2000 43 Nam Koi 4000 39 Nan Nawn Pa 4000 44 Jam Ga 4000 52 Nam San 4000 43 Sam Pai 4000 38 Gang Dau 4000 47 Dinga Yang 2000 40 Daw Hpum 4000 42
Relationship
The most important influence that the size of study-field had on the adoption of SRI was that it
influenced the scale of adoption by individual farmers, as clearly shown in the previous sections,
but not on the total number of farmers. The factors that led to field size having an influence on
the number of farmers using the practices are different. Based on the results presented in Section
.9.6, it was the entire process and the overall approach to FFS that were mainly responsible for
influencing the overall number of farmers adopting the SRI practices.
113

6.11. The effect of FFS field day
The field day is an important activity in FFS strategy, seeking to share the results and outcomes
of FFS experience with the other farmers in the community. Based on the result presented in
Section 6.9.2, among the many activities in an FFS, farmer field days were found to be the most
important factor in influencing the adoption of SRI by non-FFS farmers. This result presented in
the earlier section was based on opinions and discussions with farmers organized in groups. This
section provides further validation to the results that a significantly positive relationship exists
between the field day and the adoption of SRI by community farmers.
The effect of the field day was studied from 2002 to 2004, based on the number of non-
FFS farmers from each community who attended a field day, and the percentage using these
practices on their own fields in the following year. According to recorded data, the number of
farmers who were found using the SRI practices on their fields, after being influenced by the
field day activities, constitutes a significant percentage of the total number of farmers who were
using SRI practices in each FFS. From the recorded data among the first batch of FFS graduates,
we see that on average, 30 non-FFS farmers from each community were found to attend the
field-day, and from among them, 24 were subsequently found to be using the practices on their
own fields in the next year (Table 46).
Table 46: Effect of FFS field day on the use of SRI practices in 2002
Farmers who
attended field day Farmers using the
practices FFS
No. %
% of total farmers using the practices
Nawng Hkying 30 20 67 45 10 Miles 35 25 71 56 Gat Sha Yang 25 15 60 45 N-gan 25 23 92 51 Nawng Hkyi 35 30 86 60 Gara Yang 32 26 81 63 Ja Pu 38 32 84 58 Awng Mye Tit 30 26 87 59 Mai Sak Pa 25 23 92 50 Lawa Yang 25 18 72 49 Mean 30 24 80 54
114

In the 10 selected sites, a total of 300 farmers attended field days, and from among them,
238 were found to be using the practices on their fields. This constitutes 80% of the total farmers
who attended the field day, and 54% of the total farmers those using the SRI practices on their
fields in the immediate next year after the field day (Table 49). In the second batch of FFSs in
2003, the number of non-FFS farmers who attended the field day of their community’s FFS was
found to range from 20 to 36, with a mean of 27 per FFS. From among them, 23 were found
subsequently using the practices on their fields. This result indicates a little higher percentage of
farmers than in the previous year using the practices on their fields (Table 46).
Table 47: Effect of FFS field day on the use of SRI practices in 2003
Farmers using SRI
practices FFS Farmers who
attended field day No. %
%of total farmers using SRI practices
Hka Wang 25 23 92 53 Pung Dung 28 22 79 55 Chyara Pati 23 20 87 48 Mali Hka 20 20 100 50 Mading 26 23 88 51 Katsu 36 30 83 60 Thing Nan Kawn 30 20 67 53 N myen 26 22 85 52 Ding Hkung 29 27 93 60 Nalung (lower) 30 25 83 56 Mean 27 23 85 54
Table 48: Effect of FFS field day on the use of SRI practices in 2004
Farmers who
attended field day Farmers using
technology FFS
No. %
Percent of total farmers using
technology Lahta Maw Hpang 25 16 64 44 Khan La 26 21 80 49 Nam Koi 22 19 86 49 Nan Nawn Pa 28 24 86 55 Jam Ga 30 28 93 54 Nam San 28 24 86 56 Sam Pai 22 18 82 47 Gang Dau 25 22 88 47
115

Dinga Yang 24 20 83 50 Daw Hpum 26 20 77 48 Mean 26 21 83 50
he pattern of results found in the third batch of FFS was very similar to the previous two
years where on average, 26 farmers were found to have attended the field-day and from among
them, 21 were using the practices on their fields (Table 48). This indicates that 83% of the
farmers who attended the field-day were using the practices on their fields.
The mean effect of field day exposure In the three-year period, great consistency was observed in terms of the percentage of farmers
who adopted the practices on their fields after attending the FFS field-day (Table 49). According
to the average from three years, more than 80% of the farmers who attended a FFS field day
were found using the practices on their fields in the next year after the field day. This is a
significant number and confirms that the field day is a very effective activity in FFS to
disseminate SRI practices among community farmers when there are results as evident and
dramatic as those demonstrated by SRI methods
Table 49: Mean effect of FFS field day on the number of farmers adopting SRI practices
Farmers those influenced by the field day Year No. of non-
FFS farmers who attended
field day
No.
% of those who attended the
field day
% of total farmers using the practices
2002 300 238 79 54 2003 273 232 85 54 2004 256 212 82 50 Mean 829 682 82 53
Outcomes cannot be attributed to the field day alone. Farmers were unlikely to be
influenced just by the field day to use the demonstrated practices on their fields, as there were
some other factors involved in the decision-making of farmers as seen in Section 6.9.2. But it is
clear that the field day had a very definite impact given the percentage of farmers in each
community who attended and were subsequently using the practices on their fields. According to
the Pearson correlation test, the correlation between field-day attendance and adoption of the
practices was found significant at 1% level.
116

The data presented in the first section of this chapter indicated that rice yields within the
FFS study-fields, where FFS farmers grow rice together and study various issues of rice
production, are much higher than those of their usual yields with standard methods, averaging
158 to 257% higher than the yields they got before participating in FFS, representing a kind of
baseline. These higher yields achieved by the farmers are a clear indicator of the effectiveness of
their new skills that they obtained from FFSs.
Table 50: Correlations
** Correlation is significant at the 0.01 level (2-tailed).
Attended field-day
Using the practices
Attended field-day
Pearson Correlation 1 .719(**)
Significance (2-tailed) . .000
N 30 30Using the practices
Pearson Correlation .719(**) 1
Significance (2-tailed) .000 .
N 30 30
Trends over three years
y = 0.0826x + 29.842R2 = 0.6298
49505152535455
250 260 270 280 290 300 310Farmers attended field-day
% o
f com
mun
ity u
sing
the
prac
tices
Production data presented in the second section indicated how farmers’ production per
household increased on their own fields when they applied the new practices of growing rice that
they learned from FFS. According to the data, application of the new practices on their own
fields provided almost all of the farmers who participated in FFS, on average, more than a two-
fold increase in their annual production of rice compared to their previous levels before
participating in FFS.
In the third section, the comparisons of cost and return analysis using various methods
demonstrated that the costs of producing rice using the practices/methods facilitated by FFS are
essentially the same as, or possibly somewhat lower than, their conventional methods of growing
rice when calculated on a unit-area basis. The returns, however, are found two times higher, or
more, than their previous levels. The cost when calculated in terms of unit-volume of rice is just
one-third of their traditional cost. Farmers using the practices of SRI can thus now grow three
times more rice than before with the same cost.
117

The results presented in section four showing the trends of yield stability indicate that
farmers are capable of maintaining yields in subsequent years as high as or higher than what they
achieved on their farms in the first year after FFS training. These trends of yield stability indicate
that the new practices used in rice production are highly sustainable.
Then section five presented what types of technologies/practices farmers adopted or
adapted for use on their fields, and which practices contributed how much to yield increase.
According to the data presented in section six, the majority of FFS farmers are using SRI as their
main approach for growing rice, and the use of SRI has provided them maximum yield benefits.
Sections seven and eight demonstrated how SRI practices are spreading to other farmers
in the communities, and how these other farmers are benefiting from such spread. The data
indicated that SRI practices when facilitated through FFS methods can reach all of the rice
farmers within a community within a four-year period if just one-third are trained at the
beginning of the period. From such spread, each and every farmer using these practices can make
significant production and yield gains.
Section nine presented factors made how much contribution to the overall spread and
adoption of SRI by farmers. In this adoption of SRI by FFS farmers, the activities in and the
higher yields from FFS study-fields, plus the learning activities of FFS had a significant
influence, while the field-day activities, the sharing from FFS farmers, and the higher yields on
both FFS-study-fields and FFS farmers’ own fields made a large contribution to the adoption of
SRI by non-FFS farmers. Sections ten and eleven further confirmed these results with more in-
depth study and analysis. These concluding paragraphs can be considered a summary of
empirical results reviewed in this chapter above. A more comprehensive conclusion for the
overall study is made in the next chapter.
118
Chapter 7 Conclusions
The primary purpose of this study was to: 1) investigate and assess the adoptability/adaptability
of SRI by farmers through and FFS experience, 2) study the interactions and relationships
between SRI and FFS, and the particular factors that contribute to the adoption and adaptation
process with SRI, and 3) assess the overall contributions and the combined effects of both SRI
and FFS to improving the socio-economic conditions, as well as the livelihoods, of resource-poor
farmers in Myanmar.
The effect and the contributions
In terms of the contributions to improving the livelihoods and socio-economic conditions of the
resource-poor farmers, rice yields and productions are considered as relevant and meaningful
indicators. Rice is the main source of income and livelihood for the vast majority of farmers in
the region, as stated in the introductory chapter. Based on the results presented in the Sections
6.1 and 6.2, both SRI and FFS are found to be not only effective in increasing rice yields as well
as production; their combined use has actually set an example for how effectively they can
enhance the livelihoods and socio-economic conditions of resource-poor farmers in Myanmar.
The combined effects of FFS and SRI were found very impressive first in terms of
enhancing rice yields on a per unit area basis. As compared with the conditions before, farmers’
rice yields after FFS experience were found to be consistently higher, averaging more than 200
percent increase from their baseline conditions. This large yield increase came from the use of
the various different practices promoted by the FFS, the major share of this deriving from the
core practices of SRI.
A second distinct effect was seen in the area of per household production increase, during
and/or after the FFS experience. As seen in Section 6.2, farmers’ average production, after
starting to use SRI practices, was found to be enormously enhanced, by more than two times the
average of their previous production before FFS. With such a huge increase on average, each
family was able to produce more than 2 tons of extra rice per hectare. For a family to achieve this
with their traditional practices, they would have to put into cultivation, a similar amount of land
to that which they cultivate now.
119
The third effect was that although yields and production had increased so dramatically,
there had been no increase in production cost. This overall finding on cost and returns is very
astonishing. Contrary to the views of any who think that SRI must involve more cost than the
conventional methods due to the intensity of its practices, SRI was found to be far more cost-
effective than any other methods of growing rice. With traditional methods, the returns that
farmers usually derive from rice cultivation were found to be very low; some farmers were even
found losing money from the process, while for the majority it was more or less a break-even
operation. In such conditions, the use of SRI has made rice cultivation a profitable venture to the
farmers.
As the cost of production is usually calculated on a unit-area basis, this system of cost
analysis does not provide the real pictures of cost, since the output is always determined in terms
of the volume of rice produced. When cost is calculated on a unit-area basis, such as per hectare,
the cost of production of rice using SRI methods was found to be either equal to or little less than
with the traditional methods. But if the cost is calculated per unit volume of production, the cost
of producing rice with SRI practices was found to be just as one-third of what is needed with the
traditional practices.
On the basis of yield per unit area (per hectare), production per household, and
production cost both by acreage and by unit volume of product, rice production using SRI
practices is definitely highly effective and more profitable than with traditional or conventional
methods. SRI practices could also be considered sustainable over a relatively longer period of
time (at least three to four years) as there was no sign either of yield or production declining on
farmer’s fields; neither has there been any increase in production costs. The yields, the
production and production costs were all found to be very stable compared with farmers’
traditional or conventional methods and were, if anything enhanced over time.
Among the practices used by farmers, the contributions of SRI to yield increase were
found to be enormously high, providing a 143% yield increase when used alone, and up to a
253% increase when combined with quality seeds and a good rice variety. Although the use of
quality seeds and good rice varieties were not part of the practices considered essential to SRI,
they were found very beneficial in enhancing rice yields. SRI provided the maximum yield
increase when combined with quality seeds and good rice variety. This means that SRI offers
significant synergy when combined with quality seeds and good rice varieties. The contributions
120

of quality seeds and good rice varieties were also found to be higher when they were used
together with SRI or with each other than when they were used alone.
The adoption process
Based on the results presented in Sections 6.6 to 6.8, the rate of adoption of SRI along with
quality seeds and a better rice variety was found to be significantly high. In the first year of FFS,
which was when farmers began to learn about the practices by experimenting and growing rice
on the FFS study-field, it was only the FFS farmers who were found simultaneously using the
practices on their fields along with the study-fields of FFS. But in this year, 15-20% of them
were able and willing to apply the complete practices of SRI on their fields. Others were able to
use the practices only partially as they had already missed the time for using many other
practices. In the next year, the first year after the graduation from an FFS and the year for
applying the practices, all the farmers who participated in the FFS were found to be using the
practices on their fields.
In the same year, along with these FFS farmers, in each community a similar number of
non-FFS farmers who had not participated in an FFS were also found using the practices on their
fields. The number of such non-FFS farmers in the following years continued to increase, and
within a three-year period after the graduation of an FFS cohort, practically all of the farmers of
each community were found to be using the practices on their fields.
According to the recorded data, 20 farmers on average participated in each FFS. In the
first year after the graduation of FFS, along with these 20 farmers, there were 24 additional
farmers whom we are calling ‘non-FFS farmers’ who were using SRI practices to different
degrees on their fields. In the second year after the graduation, the number of such non-FFS
farmers was found to be 33, and in the third year, this number had risen to 43, making a total of
63 FFS and non-FFS farmers in each community who were using the new practices. In fact, this
is the average number of farm families living in a community in this region.
In terms of the percentage of farmers in a community using SRI following the the
organization and training of a cohort of local farmers (about 25) in a FFS, in the first year of an
FFS, 31% of the farmers were already practicing the new methods on their own fields, parallel to
their FFS experiments; in the second year, it was 69% of farmers, while in the third and fourth
121

years, 83% and 99% of the farmers in each community were, respectively, using the practices on
their fields.
At the end of four years after FFS initiation (or the third year after graduation), all of the
farmers in each community were found to be using the practices facilitated by FFS. They all
were experiencing tremendous yield increases from using the practices on their fields as well as
being able to maintain such yields and even further improve them. There were, however,
variations observed in terms of the percentage of production increase between FFS farmers and
non-FFS farmers. FFS farmers, being direct participants, had better understanding and
knowledge compared with their non-FFS neighbor farmers who learned the practices from the
FFS farmers and were not quite as successful.
This difference in ability between FFS farmers and non-FFS farmers is a natural
phenomenon because of differences in the level of study and experience of FFS farmers. Also,
FFS participants were a self-selected group, so they may be more energetic and innovative to
begin with. This is obviously going to happen in any similar case. There was, however, great
consistency observed in the overall ability of non-FFS farmers to successfully maintain the
production increase experienced in their first year after using the practices over the considerable
period of time.
Production increase was directly related with the number of practices and the amount of
areas where these practices were applied. According to the recorded data, the average percentage
of production increase by FFS farmers was found to be 90%, as against 49%, 48%, and 47% by
non-FFS farmers in the first year, second year and third year after the graduation of the FFS.
Although the production increase by the non-FFS families was lower compared with FSS
families, nearly a 50% increase in total production on a per-household basis is, of course, a huge
increase when compared with what farmers in other communities whose rice production is still
traditional are still producing.
The higher percentage of production increase achieved by FFS farmers means that they
used the practices in larger areas compared with the non-FFS farmers. It might also be possible
that they used a larger number of the SRI practices than were used by non-FFS farmers.
Depending on the category, 67% of farmers were found using the core practices of SRI, either
with or without quality seeds in various combinations, while the rest were found using only
either quality seeds, or good varieties, or both together. This result was found based on the
122

practices applied by farmers in their first years after graduation from a FFS. In the following
years as they become more competent and confident, they have applied more practices.
The factors that were found influencing such a higher degree of adoption of SRI and
other practices facilitated under FFS have had unique roles in influencing the decision-making of
both FFS farmers and non-FFS farmers. Specifically, the FFS study-field and the regular
learning sessions of FFSs had significant influence on the adoption of SRI by FFS farmers.
Within the study-field, farmers’ experimentation and growing rice together on the study-field
areas had a significant influence on their decision-making to adopt the SRI on their fields.
For non-FFS farmers, the factors having the most influence on adoption were the field-
day activities of FFSs, the sharing of experience of FFS farmers, and the higher yields of rice
observed within the FFS-study fields and within the fields of FFS farmers. The latter in particular
had a significant influence on decision-making to adopt the practices on their fields.
The interactions and relationships
As seen above, the achievement of significant yield and production increases by farmers,
reduction of production costs, and the large-scale adoption of SRI across the communities are the
combined effect of FFS and SRI. It is difficult to separate how much of this contribution came
from the FFS organization and methodology and how much is attributable to the inherent
productivity of SRI concepts and methods. Based on the responses of farmers, and by analyzing
the factors that influenced the overall adoption of SRI, both by FFS farmers and non-FFS
farmers, a number of conclusions could be drawn about which FFS activities supported the large-
scale adoption of SRI, and which activities of SRI strengthened the performance of FFS by
providing more opportunities for dissemination of the practices and the knowledge that it
facilitated for farmers.
The primary purpose of FFS programs was to provide farmers with adequate knowledge
and skills to improve their decision-making so that with this new knowledge and these new
skills, they could make better decisions on how to improve the productions and productivity of
their rice fields. In doing so, FFS activities provided more emphasis on experimentation to find
out methods and practices that are more effective and sustainable in enhancing rice production.
SRI, being the most effective and sustainable method of growing rice and enhancing yields, its
introduction to the FFS program has made FFSs more effective vehicles for finding the most
123
124
appropriate methods of growing rice. On the other hand, to be most effective, SRI requires
continuous experimentation on how to adapt the methods to local conditions. Hence the regular
experimentation process of FFS strengthens the performance of SRI by providing most effective
opportunities for experimentation. This is how they supported each other. For the purpose of
enhancing production, both have similar goals on how to improve the production and
productivity of rice.
In this adoption process, the size of the study-field was an important factor in terms of the
scale of adoption of SRI practices; on how much area the practices were applied by the farmers
had a bearing on their willingness and skill to use the new methods. The larger the size of the
study-field, the higher was the scale of adoption by the individual farmers.
The other factors or activities, that were found instrumental in yield enhancement as well
as in the adoption process, were the practices of SRI themselves, which made such high yield
possible. The higher yield of rice was found as to be an important factor influencing the adoption
process. Therefore, the yield-enhancing activities of the practices, and the resultant higher yield,
should be recognized as a crucial contribution of SRI to shape the adoption process.
Other activities that could be given credit as common to both FFS and SRI in the
adoption process were: 1) the informal sharing that took place between and among farmers, and
2) the rice fields of the those farmers who used the SRI practices becoming demonstration plots
for other farmers in the community. This was discussed in Section 6.9.2 as important factors
influencing the adoption of SRI by non-FFS farmers.
Based on all the findings and the conclusions presented above, it could be concluded with
confidence that the combined activities and effects of FFS and SRI have resulted within each
community in the development of: 1) the skills and confidence of a core group of farmers (FFS
farmers), and 2) a learning-cum-sharing process which can drive broader processes of
agricultural development and modernization forward. The learning is not limited to FFS
participants but is spreading to all the farmers in the communities where FFSs are conducted,
with the result that the whole farming sector becomes better able to learn and share how to adopt
the practices for desirable yield gains. That was how the adoption of innovations has been taking
place in the Kachin State and Shan Sate of Myanmar since 2000. Since this area is considered to
be a socio-economically disadvantaged and difficult one, the success of FFS and SRI methods
there should give encouragement that similar gains can be achieved elsewhere.