AD-AI28 INVESTIGATION OF LITHIUM-THIONYL CHLORIDE …Investigation of Lithium-Thionyl Chloride...
221
AD-AI28 382 INVESTIGATION OF LITHIUM-THIONYL CHLORIDE BATTERY SAFETY HAZARDS(U) GOULD RESEARCH CENTER ROLLING MEADOWS IL MATERIALS LAB A I ATTIA ET AL. JAN 83 838-012 UNCLASSIFIED N60921 8 -C-363 F/G 10/3 NL mhIIIIIIIIIIIl llIIIIIIIIIIIu IIIIIIIIIIEIE IIIIIIIIIhhml EIIIIIIIIIIIII EIIIIIIIIIIl
Transcript of AD-AI28 INVESTIGATION OF LITHIUM-THIONYL CHLORIDE …Investigation of Lithium-Thionyl Chloride...

AD-AI28 382 INVESTIGATION OF LITHIUM-THIONYL CHLORIDE BATTERYSAFETY HAZARDS(U) GOULD RESEARCH CENTER ROLLING MEADOWSIL MATERIALS LAB A I ATTIA ET AL. JAN 83 838-012
UNCLASSIFIED N60921 8 -C-363 F/G 10/3 NL
mhIIIIIIIIIIIlllIIIIIIIIIIIuIIIIIIIIIIEIEIIIIIIIIIhhmlEIIIIIIIIIIIIIEIIIIIIIIIIl

11 1.0 I- l8
L.6WIIllm
1f11I L 12115
MICROCOPY RESOLUTION TEST CHARTNATIONAL BUREAU OF STANDARDS 1963-A
no-
.. .. . .-- - . A .,.... . -'.

Report Number: 838-012
7 ontract No. 60921-81-C-0363 6//
Investigation of Lithium-Thionyl ChlorideBattery Safety Hazards
AD A 1 T 2 ,Alan I. AttiaGould Research Center, Materials Laboratory
S ----3W Gould CenterRolling Meadows, Illinois 60008 7"Kenneth A. Gabriel and Richard P. Burns
Department of ChemistryUniversity of Illinois at ChicagoChicago, Illinois 60680
January 1983
Final Report for the Period 28 September 1981 to 31 December 1982
Approved for Public Release: J)istribution Unlimited
Prepared for:
NAVAL SURFACE WEAPONS CENTER
Approved by: __. V " ___ " _•
B. W. Burrows, Director
Materials LaboratoryGould Research Center
CD,
.-J
C.2~i2U 0

UNCLASSIFIED
SECURITY CLASSIFICATION OF THIS PAGE (When Dot Entered)REPORT DOCUMENTATION PAGE READ INSTRUCTIONS
BEFORE COMPLETING FORM1. REPORT NUMBER 2. GOVT ACCESSION NO. 3. RECIPIENT'S CATALOG NUMBER838-012
4. TITLE (and Subtitle) S. TYPE OF REPORT & PERIOD COVERED
Investigation of Lithium-Thionyl Chloride Final ReportBattery Safety Hazards 9/28/81 - 12/31/82
6. PERFORMING ORG. REPORT NUMIER
7. AUTHOR(&) S. CONTRACT OR GRANT NUMBER(a)
Alan I. Attia, Kenneth A. Gabriel and 60921-81-C-0363Richard P. Burns
9. PERFORMING ORGANIZATION NAME AND ADDRESS W0. PROGRAM ELEMENT, PROJECT, TASKGould Research Center, Materials Laboratory40 Gould CenterRolling Meadows, Illinois 60008
It. CONTROLLING OFFICE NAME AND ADDRESS 12. REPORT DATE
January 1983Naval Surface Weapons Center 13. NUMBER OF PAGES
White Oak, Silver Spring, MD 20910 19114. MONITORING AGENCY NAME & ADDRESS(It different irom Controlling Office) 15. SECURITY CLASS. (of this rpofrt)
4I
15s. DEC. ASSIFICATION/ DOWNGRADINGSC EDULE
IS. DISTRIBUTION STATEMENT (of this Report)
Approved for Public Release. Distribution Unlimited.
17. DISTRIBUTION STATEMENT (of the abstract entered in Block 20, if different from Report)
I
IS. SUPPLEMENTARY NOTES
I. KEY WORDS (Continue on reveree oldo f noceesar, and Identify by block number)Thionyl-Chloride, lithium, Drimary cells, lithium batteries, Infrared
Soectroscopy, Mass Spectrometry, safety.
2O.T f TRACT (Continue aft e'ere. oe fI if necessary end Identify by block number)Tis report details the investigations carried out in the last two quarters ofthe program relating to Contract No. 60921-81-C-0363.
The overall aim of the program was to identify the hazards of Li/SOCI2batteries during low rate discharge and anode limited reversal. The specificobjectives were:
DDJ 73 1473 EDITIoN of INov 6s oBSoLcE UNCLASSIFIEDSECURITY CLAISIFICATION OF TNIS PAGE (Utim, Dae E ranjo
F .- . .,.; -, . .

UNCLASSIFIED
SCURITY CLASSIFICATION Of THIS PAOEofn Dag& E oed)
o To identify the reaction products soluble in the electrolyte.
o To perform quantitative infrared absorption measurements of the productsformed during normal discharge, reversal and storage following reversal.
o To measure the heat generation rate of a cell during normal discharge andreversal.
o To determine the presence or absence of free radicals during normaldischarge and reversal.
0 To analyze by mass spectrometry the gas phase above the electrolyte of aLi/SOCI2 cell during normal discharge and reversal.
During the course of the contract we have
o Optimized the cell design with respect to sampling procedure.
o Developed in-situ FTIR, EPR and mass spectrometric methods of analysis andapplied them to operating Li/SOCI2 cells.
0 Measured the heat generated by anode limited cells during discharge andreversal.
We have obtained the following results:
o The sources of all the absorption bands in the IR absorption spectrum ofthe electrolyte were identified.
o In-situ quantitative measurements were obtained for SO2 , S02C12 andSOCI+AlCl4
- during normal discharge and reversal.
o Processes giving rise to free radical formation were detected during anodelimited reversal by in-situ EPR spectroscopy.
o The technique of direct-inlet in-situ mass spectrometry was applied forthe first time to the Li/SOCl2 system, to identify without any ambiguity,the presence of HCI, S02, CS2, S20, SC12 and S02Cl+ as well as C1+ andCF2+ fragments in the gas phase above an operating cell.
o S20 was not detected in the liquid phase.
o The appearance potentials for SC12, SOCd2, S02C12 and $2C1 2 were measured.
o Evidence for the formation of C120 was refuted.
o Significant effects directly attributable to temperature and currentdensity were identified and quantified.
0 No clearly hazardous reactions were identified other than those inherentin the system.
As a result of this work a much clearer understanding of the chemistry of theLi/SOCI2 system has been achieved. Several analytical techniques have beendeveloped and applied for the first time to the Li/SOCl system, which couldpotentially lead to a more complete explanation of the chemistry of the
UNCLASSIFIEDSECURITY CLASSIFICATION or THIS PA8EIbJn Doalea n*r.e
S• I-,

A CKNOWLE DGEMENT
The research described in this publication was carried out by
the Materials Laboratory, Gould Research Center, under contract
with the Naval Surface Weapons Center - Electrochemical Technology
Block Program (Technical Monitor: Dr. William P. Kilroy).
vI"-F,
o s t -,',
+, OT

TABLE OF CONTENTS
Page
1. Introduction ........................................................ 1
2. Summary .......................................................... 6
3. PTIR Spectroscopic Studies ......................................... 103.1 Qualitative FTIR Study of Typical Discharge ................... 113.2 Identification of Products of Discharge in Solution...........173.3 Synthesis of S$2 0 ............................................. 273.4 Gas Phase Studies ........................................... 293.5 Calibration Curves ........................................... 333.6 In Situ OTIR Studies .......................................... 37
Cell SC-69 ......................................................... 43Cell SC-71 ....................................................... 47Cell SC-73 ........................................................ 63Cell SC-74 ... ................................................ ....71Cell SC-75 ......................................................... 78Cell SC-77 ......................................................... 84Cell SC-79 ........................................................ 91Cell SC-81 ........................................................ 98
3.7 Conclusions .................................................. 111
4. A Mass Spectrometric Study of Gases Evolved DuringDischarge and Reversal of Anode-Limited Li/SOCl2 Cell ........ 113
4.1 Abstract ..................................................... 1134.2 Experimental ................................................. 1144.3 Results ...................................................... 1164.4 Discussion ................................................ ..121
4.4.1 Cl+ , HCI ............................................. 12141.4.2 SO2 so .................................... ......... 1284.4. 2 P4. 4.3 CS, $0 ...................................... o ...... 1354.4.4 SOK12 , SOCI ......................................... 139
24.4.5 SC1 2 , SCI ........................................... 1454.4.6 Mass 134 Species (Mainly S02C12) ..................... 1534.4o7 CF . ... .. . .. ... .. .. . . .. . .. . .. . .. .. .. .... .. .. . ... .. .. . 1634.4.8 Higher Molecular Weight Species .................... 1644.4.9 Mass Spectra and Appearance Potentials for .......... 164
the Pure Compounds4.5 Conclusions ................................................ 1764.6 Recommendation for Future Investigations .................... 177
5. EPR Spectroscopy of Lithium Thionyl Chloride Cell ................. 179
5.1 In Situ EPR Study ............................................ 180
6. Thermal Study of a Lithium-Thionyl Chloride Cell .................. 185
References ....................................................... 188
APPENDIX ........................................................ 190
i
•~ j 01", . .

LIST OF FIGURES
Figure No. Title Page
1 Electrochemical Cell Designed for Electrolyte ........... 13
Withdrawal
2 SC-68 IR Absorption Spectra ............................. 14
3 SC-68 IR Absorption Spectra ............................. 15
4 SC-68 in Storage After Reversal ......................... 16
5 Effect of Water on SOC12 Spectrum ....................... 19
6 Effect of Water and AM 3 on SOCI 2 Spectrum ............. 20
7 Effect of S02C12 on SOl 2 Spectrum ...................... 21
8 Effect of All 3 on SOCI 2 Spectrum ....................... 22
9 Effect of Water on LiAlCI4/SOCl2 Electrolyte ............ 23
10 Effect of CO2 on LiAlCl4/SOCI2 Electrolyte .............. 24
11 Effect of SC 2 on LiAlCl 4/SOCl2 Electrolyte ............. 25
12 IR Absorption Spectrum Reconstructed from ............... 26
H20/LiAlCl4/SOCl2 , AICI3/SOC12, S02/SOCI2
S02C12/SOCI2 and SC12 /LiAlCl4/SOCl213 Schematic Diagram of Vacuum Line Used to ................ 28
Synthesize S20
14 SO2 Gas Phase Spectrum .................................. 30
15 CO2 Gas Phase Spectrum ................................. 30
16 SOC12 Gas Phase Spectrum ................................ 31
17 S02C 2 Gas Phase Spectrum ............................... 31
18 $2CI2 Gas Phase Spectrum ................................ 32
19 SCl2 Gas Phase Spectrum ................................ 32
20 Gas Phase Spectrum of Cell in Storage After Anode ....... 32Limited Reversal
21 SO2 Calibration Curves - 0.1 mm Path Length ........... 34
22 S02C12 Calibration Curve - 0.1 mm Path Length . ...... 35
23 SOCl+ Calibration Curve - 0.1 mm Path Length ............ 36
24 Electrochemical Cell for Flowing Electrolyte System ..... 38
25 Schematic of a Closed Loop Sampling System .............. 39
26 Photograph of Flowing Electrolyte System ................ 40with Syringe Pump
li
*- 4" ' i.*

27 Photograph of Flowing Electrolyte System With ........... 41
Peristaltic Pump
28 SC-69 IR Absorption Spectra ............................. 44
29 SC-69 Difference Spectra ............................... 45
30 Cell SC-69 S02 as a Function of Discharge ............... 46
31 SC-71 IR Absorption Spectra ............................ 49
32 SC-71 IR Absorption Spectra ............................ 50
33 SC-71 IR Absorption Spectra ............................ 51
34 SC-71 In Storage After Reversal ......................... 52
35 Cell SC-71 S02 as a Function of Discharge ............... 53
36 SC-71 Difference Spectra for SO2 . .. . .. .. .. .. . .. .. .. . .. . 54
37 SC-71 Difference Spectra for SO2Cl2.. . . .. . .. . . . .. . .. . 55
38 SC-71 Difference Spectra during Normal Discharge ........ 56
and Reversal
39 SC-71 in Storage after Reversal ........................ 57
40 Cell SC-Ti 02 C12 Formation during Reversalo............ 58
41 Cell SC-71 SOCi 2 Formation during Reversal ............. 59
42 Cell SC-71 Intensity of Infrared Absorption ............. 60
at 1070 cm-1
43 Cell SC-71 Intensity of Infrared Absorption ............. 61
at 665 cm-1
44 Discharge Curve - Cell SC-71 ............................ 62
45 SC-73lRAbsorptionSpectra............................64
46 SC-73 IR Absorption Spectra ............................. 65
47 Cell SC-73 S0 as a Function of Discharge............... 66
48 Cell SC-73 S02C1Z as a Function of Discharge ........... 67
49 SC-73 Difference Spectra during Normal Discharge ........ 68
and Reversal
50 Cell SC-73 Relative Intensities of Bands at ............ 69
694 cm-1 and 665 cm-I1
51 Discharge Curve -Cell SC-73 ........................... 70
52 SC-74 IR Absorption Spectra ................ o............72
53 SC-74 IR Absorption Spectra ............................ 73
54 SC-74 Difference Spectra for Normal Discharge ........... 74
and Reversal
~iii

55 Cell SC-74 Intensity of 694 cm-1 Band ................... 75
56 Cell SC-74 Intensity of Absorption at a) 803 ............ 76
b) 980, and c) 1070 cm-I
57 Discharge Curve - Cell SC-74 ............................ 77
58 SC-75 IR Absorption Spectra ............................ 79
59 Cell SC-75 S02 and S02C12 Formation Upon ............... 80
Electrolysis
60 SC-75 Difference Spectra for SO2 and S02C12 . .. .. .. . . . . . 81
61 SC-75 Difference Spectra for SOCI+ ..................... 82
62 Electrolysis Curve - Cell SC-75 ......................... 83
63 SC-77 IR Absorption Spectra ............................ 85
64 SC-77 IR Absorption Spectra ............................ 86
65 SC-77 Difference Spectra for S02 and S02CI2 . .. .. .. . . . . . 87
66 SC-77 Difference Spectra for SOCI ...................... 88
67 Cell SC-77 SO2 and SOCl+ Formation during Reversal ...... 89
68 Discharge Curve - Cell SC-77o..........................90
69 SC-79 IR Absorption Spectra ............................ 92
70 SC-79 IR Absorption Spectra ............................ 93
71 SC-79 in Storage after Reversal ........................ 94
72 SC-79 Difference Spectra for Reversal and Storage ....... 95
73 Cell SC-79 a) S02C12 , b) SOCI+ , c) 1070 cm-1 .. .. .. .. .. .. 96
Absorption, d) 665 cm-1 Absorption
74 Discharge Curve - Cell SC-79 ........................... 97
75 Discharge Curve - Cell SC-81... ....................... 100
76 Cell SC-81 SO2 Formation During Discharge -200C ........ 101
77 Cell SC-81 SOCI+ Formation During Reversal ............. 102
78 Cell SC-81 S02C12 Formation During Reversal ............ 103
and Warm-up
I 79 SC-81 Normal Discharge ................................ 104
80 SC-81 In Reversal ..................................... 105
81 SC-81 During Storage and Warm-up Period ................ 106
82 SC-81 Difference Spectra for SO2 during Normal ......... 107
Discharge
83 SC-81 Difference Spectra for Normal Discharge .......... 108
and Reversal
iv

84 SC-81 SO2Ci2 during Reversal, Storage and Warm-up ...... 109
Period
85A Mass Spectrometric Sampling System .....................115
85B Discharge Curve Cell SC-80 .............................118
86 Mass 35 (C135) vs. Time (Hrs) ..........................1241
87 Mass 36 (HC135) vs. Time MHrs) .........................125
88 Mass 37 (Cl37) vs. Time (Hrs) ..........................126
89 Mass 38 (Hc137) vs. Time (Mrs) .........................127
90 Mass 64 (SO2) vs. Time (Hrs) ...........................130
91 Mass 48 (SO') vs. Time (Hrs) ...........................131
92 Mass 48 and 64 (SO' and SO2) vs. Time (firs) ............ 132
93 Mass 64 (SO2) - Mass 48 (SO') vs. Time (Hrs) ........... 133
94 Mass 48 (S0+)/Mass 64 (SO,) vs. Time (firs) ............. 134
95 Mass 76 and 78 (CS2) vs. Time (frs) ............. o.......137
96 Mass 80 and 82 (S20) vs. Time (Hrs) .................... 138
97 Mass 118 (S0C12) vs. Time (Hrs). ........ o.............. 140
98 Mass 120 (S0C12) vs. Time (Hrs) ...... o..................141
99 Mass 122 (S0C12) vs. Time (Hrs) ........................142
100 Mass 85 (SOCl+) vs. Time (firs) .........................143
101 Mass 118, 120 and 122 (S0C12) vs. Time (firs) ........... 144
10 as12(~ 2) vs. Time (Hrs) .... o.......o...... ...... 147
103 Mass 104 SC12 vs. Time MHrs) ...........................148
104 Mass106 SC12 vs. Time Hrs .............................1419I105 Mass 102, 104 and 106 (SC12) vs. Time (Hrs) ............ 150
106 Mass 67 vs. Time (firs) ......... o....................... 151
107 Mass 69 vs. Time Mfrs) ............ o.................... 152
108 Mass 134 vs. Time (Hrs) ................................156
109 Mass 136 vs. Time (Hrs) ................................157
110 Mass 138 vs. Time (Hrs) ................................158
ill Mass 134, 136 and 138 vs. Time (Hrs) ................... 159
112 Mass 99 vs. Time (Hrs) .................................160
113 Mass 101 vs. Time (Hrs) ................................161
114 Mass 99 and 101 vs. Time (Hrs) .........................162
115 Relative Intensity of S02+ vs. Ionizing Electron ....... 165
Energy
v

116 Relative Intensity of SOC1 2 + vs. Ionizing Electron ..... 166
Energy
117 Relative Intensity of SC12+ vs. Ionizing ............... 167
Electron Energy
118 Relative Intensity of S02 C12* vs. Ionizing ............. 168
Electron Energy
119 Relative Intensity of S2C12+ vs. Ionizing .............. 169
Electron Energy
120 Relative Intensity of Ar+ vs. Ionizing Electron ........ 170
Energy
121 Mass Spectrum of SOCI2 a . 80 eV Electron Energy ........ 171
122 Mass Spectrum of SC12 at 80 eV Electron Energy ......... 172
123 Mass Spectrum of S02 CI2 at 80 eV Electron Energy ....... 173
124 Mass Spectrum of S2 C12 at 80 eV Ionizing Electron ...... 174
Energy
125 Relative Intensity of Mass 50 (CF2+) vs. Time (Hrs) .... 175
126 Spectro-Electrochemical Cell for EPR Measurements ...... 182
127 In Situ EPR Spectroscopy Li/SOCl2 Cell ................. 183
128 Decay of Free Radical Formed during Anode Limited ...... 184
Reversal
129 Schematic Cross Section of 25 mm Diameter Cell ......... 186
Used for Calorimetric Study
130 Heat Evolved from a Li/SOC12 Cell Driven into ......... 187
Reversal
vi
Wwu

List of Tables
Table No. Title Page
1 In Situ FTIR Studies .................................... 42
2 S02 Production During Normal Discharge ................. 1103 Mass Intensity vs. Time data for the In-Situ ........... 119
Experiment
4 Mass Spectral Intensities for Pure SC12 , SOC12 and ..... 120
S02C125 Calculated Isotopic Mass Ratios Compared to ............ 155
Experimental Mass Ratios
vii
'. . IF97j-.

Prepared for Naval Surface Weapons Center Materials LaboratorySilver Springs, Maryland Gould Research CenterContract N60921-81-C-0363 January 1983
// 1. Introduction
In the ten years since the feasibility of a lithium-thionyl chloride cell
was first recognized (1) remarkable progress has been made in hardware
development. Cells as large as 16,000 Ah (2) and batteries of 10.8 MWh (3)
have been demonstrated. In a low rate configuration, energy densities of 500
to 600 Wh/kg are easily achieved.
Even in the absence of reported explosions, safety would be a concern for
such a dense energetic package; the energy density of a lithium-thionyl
chloride cell is approaching that of dynamite (924 Wh/kg). In fact explosions
have occurred. In general the hazards associated with lithium-thionyl
chloride batteries may be divided into four categories:
'0 i Explosions as a result of an error in battery design. Very
large cells were in prototype development prior to a full
appreciation of the hazards of the system. It is possible that
some of the remaining safety issues are related to cell design.
• Explosions as a result of external physical abuse such as cell
incineration and puncture.
--Explosions due to short circuiting which could lead to thermal
runaway reactions. These problems appear to have been solved
by changes in the battery design (4). \Li,
Explosions due to abnormal elect, cal operation (i.e., charging
(5) and overdischarging (6)) and in partially or fully
discharged cells on storage (7 and 8).
This last category is particularly tr A6kng as the explosions are
unpredictable and their source only partially characterized. For example EIC
reports 3 explosions in evaluating the safety of 10 cells during anode limited

Prepared for Naval Surface Weapons Center Materials LaboratorySilver Springs, Maryland Gould Research CenterContract N60921-81-C-0363 January 1983
reversal (6). The absence of a definite set of conditions which consistently
result in an explosion makes a phenomenological approach to a safe design very
costly and time consuming if not impossible. In addition as the evidence for
safety will be statistical it can never be completely proven with obvious
limitations on cell development.
Complete resolution of the unpredictable safety hazards may only be
possible by analytical determination of their causes. In this regard
considerable work has been carried out at EIC, GTE, INTO, Union Carbide and
Gould on the chemistry of normal discharge and reversal.
The infrared absorption spectrum of lithium-thionyl chloride cell
electrolytes has been the subject of several investigations. Istone and Brodd
(9) have performed an analysis of the electrolyte, sampling the electrolyte in
situ from the electrode surface of a functioning Li/SOCI2 cell and obtaining
the infrared absorption spectrum with a Fourier Transform Infrared (FTIR)
Spectrometer. They found S02C12 , S02, S2CI2, SCI2 and HCI as impurities at
the beginning of the experiment. Only the intensities of peaks assigned to
SO2 (1335 cm- 1) and S20 (689 cm-1 ) were observed to change as a function of
discharge, and a slight amount of moisture pickup was detected. The S20
concentration was seen to increase to a maximum and then begin to decay while
the SO2 concentration increased then appeared to level off. Also elemental
sulfur was seen to deposit on the cell walls. These observations are
consistent with the decomposition reaction of S20
2 S 20 ,- 3 S + S02
first considered but rejected on the basis of stoichiometry by Schlaikjer,
Goebel and Marincic in 1979 (10). The question of the stability of S20 in a
condensed phase was not addressed, and a fairly large shift in the absorption
wavelength for S20 in SOC12 was left unexplained.
2

Prepared for Naval Surface Weapons Center Materials LaboratorySilver Springs, Maryland Gould Research CenterContract N60921-81-C-0363 January 1983
Schlaikjer and co-workers (10) postulated the formation of a sulfur
monoxide polymer according to the reaction:
2nLi + nSOCl 2 - 2nLiCl + (SO)n
and subsequent decomposition of this polymer to produce elemental sulfur and
SO2 -
Spectroelectrochemical studies carried out by Salmon et al at Gould (11)
have provided evidence that the principal reaction at the anode current
collector on reversal is
2 SOC 2 - 2 SOC1+ + 2e + Cl2 2
They then speculated that several electrochemical and chemical reactions
involving S02 were also occurring at the anode
s O 2 electrochemica; SO++ + 0 + 2e
s 2 + Cl2 --. SO+++ 2 Cl- + 0
C12 + 0 --) C12 0
Absorption bands at 1070 cm-1 and 690 cm-1 in the infrared spectrum of
electrolytes from anode limited cells after reversal at 45 mA/cm2 were
assigned respectively to SO+2 and C1 2 0.
Abraham and Mank at EIC (12) have also noted the absorption band at 1070
cm-1 in anode limited reversal which they assigned to an S-a stretching
vibration of a sulfur-oxy compound. Under the same conditions they observed
absorption bands at 1415 cm- , 1110 cm- , 1335 cm"I and 1150 cm- The lasttwo were obviously due to S02, and the absorption at 1110 cm-1 in the anolyte
was assigned to the SO stretching vibration of the complex SOCI+AIC 4 , since
3

Prepared for Naval Surface Weapons Center Materials Laboratory
Silver Springs, Maryland Gould Research Center
Contract N60921-81-C-0363 January 1983
a similar absorption was found in the infrared spectra of AlCl3 solutions in
SOC12 . The absorption at 1415 cm-1 was assigned to S02 C12. C12 and SC12 were
identified by cyclic voltammetry. Two other absorption bands observed at 660
cm- I and 790 cm- 1 in cathode limited reversal, were assigned to Al-S and Al-Cl
bond vibration respectively of LiAISCI2 .
Bailey and Blomgren (13) at Union Carbide using IR and 27 AI NMR
Spectroscopy have identified several oxychloroaluminates in Li2 CO3 -
AlCl 3/SOCI2 electrolyte absorbing at 3200-3400 cm-1 (AICI3OH-) and 800 cm- I
and 695 cm-1 (Li2 (AlCl3 )20 ), casting strong doubts on the observations of
Istone and Brodd and Salmon et al concerning S20 and C12 0.
* Although this qualitative work has been useful in elucidating cell
* chemistry during a potentially hazardous condition, it has not established a
causal relationship between these reactions and a potential hazard. Moreover
the qualitative evidence itself is still subject to controversy. For example,
C120 is an explosively unstable compound; however, the random nature of cell
explosions during reversal indicates that its presence is not a sufficient
condition for an explosion; moreover, the IR evidence for its presence is
tenuous, based on the observation of only one of three possible absorption
bands for C120 (14). Similarly the IR evidence for S20 is not any more
solid. S20 may very well be a reaction intermediate, but its stability in a
condensed phase is doubtful (15).
More recently R. McDonald at GTE while investigating the generation of
pressure in Li/SOCl2 batteries by mass spectrometry (16) has demonstrated the
presence of substantial amounts of hydrogen and nitrogen, pointing to the need
for corroboration of results by several techniques.
In view of these considerations the Navy decided that fundamental
quantitative studies of lithium-thionyl chloride reactions were required to
resolve safety issues. Our overall proposed approach was to conduct
quantitative and qualitative studies of reactions occurring during low rate
1 .4

Prepared for Naval Surface Weapons Center Materials LaboratorySilver Springs, Maryland Gould Research CenterContract N60921-81-C-0363 January 1983
discharge and during reversal. Specifically we have carried out
* Quantitative and qualitative FTIR spectroscopic studies of
Li/SOCl2 cells using both electrolyte samples withdrawn from
operating cells and in situ sampling.
* Electron spin resonance spectroscopy experiments at ambient
temperature.
* Microcalorimetric measurements of a Li/SOCI2 cell during
discharge and reversal.
* In situ low resolution mass spectroscopic studies of the gas
phase above the electrolyte of a functioning cell.
This report summarizes the results of these activities for cells
discharged at current densities between 1 and 5 mA/cm2 , at room temperature
and -200 C.
a,
5
Lk4
,--' . _ _ _ _ _ _

Prepared for Naval Surface Weapons Center Materials LaboratorySilver Springs, Maryland Gould Research CenterContract N60921-81-C-0363 January 1983
2. Summary
Conflicting and irreproducible results which plagued the beginning of
this investigation were resolved by resorting to in situ experiments. The
extreme sensitivity of the system to moisture made it mandatory to perturb
the system as little as possible while sampling for either infrared or mass
spectrometric analysis.
For our FTIR studies we have built several circulating electrolyte
systems which directly couple the spectroscopic cell to the electrolyte
reservoir of the electrochemical cell. Several pumping schemes were tried.
In our mass spectrometric investigation, we were able to attach an
electrochemical cell to the inlet system of a mass spectrometer thus sampling
the gas phase above the electrolyte during discharge. In situ FSR
measurements were also more informative than the ESR measurements on
electrolyte withdrawn from operating cells.
Although we have not identified every compound formed during discharge or
reversal we have developed and applied several analytical techniques to the
lithium-thionyl chloride system which have yielded without ambiguity
reproducible and quantitative results. We summarize below our most
significant findings.
SO2 is the only major product of discharge detected by infrared
spectroscopy at high and low temperatures; its concentration in
solution increases linearly during normal discharge, and at a
much slower rate during reversal. The amount of SO2 produced
during normal discharge was always found to be only a fraction
of that predicted by
4 Li + 2 SOCl2 --)S + SO2 + LiCl
SOCl+ is formed in substantial quantities during anode limited
6

Prepared for Naval Surface Weapons Center Materials LaboratorySilver Springs, Maryland Gould Research CenterContract N60921-81-C-0363 January 1983
reversal, but reaches a steady state concentration which is
temperature and current density dependent. At lower
temperatures and higher current densities relatively high
concentrations of SOCI+ can build up during reversal.
o Chlorine was also detected indirectly in substantial quantities
during anode limited reversal. Chlorine may arise either
through oxidation of AlCl4
AIC 4 - --- AlCI3 + 1/2 Cl 2 +e
or through direct oxidation of SOC12 as shown below
2 SOC1 2 + 2 AlCI 4 --- 2 SOCI+ AlCl4 - + Cl2 + 2e
Infrared evidence obtained during reversal does seem to show
that AIC13 is formed, but both processes could occur.
Chlorine, at room temperature, does not accumulate in the cell
but reacts to form S02C12 and sulfur chlorides.
o S02C12 is generated during anode limited reversal. Its
concentration increases slowly initially then builds up fairly
rapidly to a steady state value which appears to be dependent
on the current density. At low current densities very little,
if any, S02C12 accumulates. Also at low temperatures (-20C)
the amount of S02CI2 produced is not as significant as at
higher temperatures (25C).
Following current cutoff after reversal a sharp increase in
S02C12 concentration always occurs at ambient temperature, but
Nnot at -20C. However, upon warming up a cold cell a very large
r amount of S02C12 is produced as the cell reaches ambient
temperature. This effect could simply reflect an accelerated
rate of reaction between SO2 and C12. During storage the
S02CI2 concentration slowly decreases.
7
;k '-a .' .

Prepared for Naval Surface Weapons Center Materials LaboratorySilver Springs, Maryland Gould Research CenterContract N60921-81-C-0363 January 1983
" Substantial quantities of SCI2 in the gas phase were detected
by mass spectrometry upon anode limited reversal. S2C12 which
has the same mass as S02 C12 under low resolution but a
different fragmentation pattern, was also detected but not in
any substantial quantity. Formation of SCL2 during reversal
also gives rise to compounds absorbing in the infrared at 1070cm- and 665 c 1 . The exact nature of these compounds cannot
be determined by infrared spectroscopy alone, but the
absorptions are characteristics of S-0 stretching modes (1070
cm-1), and S-0 bending or S-S stretching modes (665 cm-1 ).
" S20 was detected in the gas phase above an operating cell by
high resolution mass spectrometry, but its presence in the
electrolyte is doubtful. Several attempts to synthesize S2 0
and trap it in thionyl chloride resulted in its decomposition
into SO2 and sulfur.
* No trace of C120 could be detected by mass spectrometry.
. Many of the features of the IR absorption spectrum are simply
due to the reaction between AICl 3 or AiCl4- and water. The
absorption bands generated by these products (aluminum
hydroxides and oxochloroaluminates) were identified, but the
exact composition of the products is not known at this stage.
Formation of a free radical was detected during anode limited
reversal using in situ EPR spectroscopy, and its half lifemeasured at seven minutes.
* Calorimetric studies of the lithium-thionyl chloride system did
not yield any surprises except to confirm the high rate of heat
evolution during anode limited reversal.
8
I
ni7 n

Prepared for Naval Surface Weapons Center Materials Laboratory
Silver Springs, Maryland Gould Research Center
Contract N60921-81-C-0363 January 1983
In conclusion, it appears that we have extracted useful quantitative
information with IR spectroscopy. For a more complete identification of the
products of discharge, by far the most promising technique is mass
spectrometric analysis, especially if it can be refined by coupling a high
resolution mass spectrometer with a gas chromatograph.
We have not in the course of this study identified a single clearly
hazardous reaction other than those inherent in the system. However, we have
noticed significant effects caused by temperature differences or current
density differences which may lead to thermal runaway reactions in an
improperly designed system.
9
I' _

Prepared for Naval Surface Weapons Center Materials LaboratorySilver Springs, Maryland Gould Research CenterContract N60921-81-C-0363 January 1983
3. FTIR Spectroscopic Studies
IR studies are presented in this section. The infrared absorption
spectrum of electrolyte removed from a lithium-thionyl chloride cell driven
into anode limited reversal is presented first to illustrate the main features
of the IR spectrum and its evolution as a function of discharge. This
experiment provides a basis for comparison with subsequent experiments using
in situ sampling of the electrolyte.
We present next the results of various calibration experiments for SO2 ,
S02CI2 and SOCI+ as well as IR spectra of known compunds in thionyl chloride
which might possibly be reaction products or intermediates in the course of
normal discharge or anode limited reversal.
Finally in situ IR spectra from several cells discharged at room
temperature or at -20C are presented and discussed.
It is important to note that all spectral frequencies we report here are
accurate within + 4 cm-1 ; moreover some shifting of a given absorption band
may occur if the base line is sloping, or the band is not fully resolved. All
absorbance values we quote are "peak heights" above the baseline.
For badly overlapping bands (i.e., 1070 cm-1 and 1115 cm-1 ) we have used
the tangent line technique to obtain reproducible results. We have tried to
be consistent in the selection of the prominent minima for drawing our
tangents and used difference spectra whenever possible to estimate the peak
heights.
All spectra are averages of 100 scans taken with a Nicolet 5-MX FTIR
spectrometer. They were all measured accurately to 3 units of absorbance.
Frequently we present several spectra together in one figure in which case the
absorbance axis is valid only for indicating the absorbance scale; the
spectra, drawn to the same scale, were successively shifted to a higher
position on the figure.
1 _ _ _10

Prepared for Naval Surface Weapons Center Materials LaboratorySilver Springs, Maryland Gould Research CenterContract N60921-81 -C-0363 January 1983
3.1 Qualitative FTIR Study of Typical Discharge
The cell used for this experiment, SC-68, consists of two concentric
electrodes. The thin carbon-Teflon cathode (20 mil thick) is pressed on a
nickel grid which is spot welded to the outer wall of the cell body (see
Figure 1). The lithium electrode (8 cm2 x 5 mil) is pressed on a nickel foil
substrate which is spot welded around a stainless steel central post. The
electrodes are about 0.5 cm apart and separated by a double layer of .005"
glass mat. Approximately 114 ml of 1.4 M LiAICI 4 in SOC1 2 are added to the
cell. Samples can be removed through a Teflon-faced septum.
IR absorption spectra obtained throughout the run are shown in Figures 2-
4. Cell SC-68 was taken into anode limited reversal at 5 mA/cm2 . A
relatively large amount of SO 2 (1335 and 1144 cm- 1 ) is present initially.
After 27.5 hours of discharge, or 20 hours into anode limited reversal (-1 .447
V) we notice the formation of a band at 1115 cm-1 and one at 1070 cm-1 ; there
is considerable overlap and the band at 1070 cm-1 appears as a shoulder on the
1115 cm-1 peak.
The current was then reduced to 1 mA/cm2 (8 mA). After 98.5 hours from
the start of discharge (see Figure 2) the only changes in the IR spectrum are
an increase in the 1070 cm-1 band and an increase at 660-694 cm- . It appears
that two bands absorb in that region, one at 694 cm - whose presence seems to
be related to water contamination, and one at 665 cIn whose presence is
definitely due to anode limited reversal. The band at 1115 cm- 1 appears to
have disappeared indicating an unstable species evident at 5 mA/cm2 but too
unstable to accumulate at 1 mA/cm2 . The current was then readjusted to 5
mA/cm2 and the cell sampled after 122 hours. The 122 hour spectrum (see
* Figure 3) shows clearly the presence of absorption bands at 1115 cm-1 as well
as 1070 cm-1.
* Absorptions at 694 cm- and 822 cm- are increasing but in this
particular case water contamination is evident from the strong absorption atk
Ii 11
l= .l .. . .. . . . . . . . . . .. .._ , , . . . ..__ _ o ' . - . t -
, . , . . ,: . , '' " ' . '

Prepared for Naval Surface Weapons Center Materials LaboratorySilver Springs, Maryland Gould Research CenterContract N60921-81-C-0363 January 1983
3200-3600 cm-1. The absorption at 665 cm -1 is masked by the stronger
absorption at 694 cm-1 . A slight increase at 1408 cm-1 (S02C12 ) is also
noticed. Subsequent spectra after 140 hours (Figure 3) confirm these
trends. S02C12 (1408 cm- 1) increases during reversal along with species
absorbing at 1070, 1115, and 665-694 cm-1 . Resolution of the 694 cm-1 and 665
cm-1 bands is difficult and depends on the relative size of the absorptions.
Weak absorptions are noticed at 928 cm-I and 822 cm- but these are also
affected by the presence of moisture. Figure 4 shows the IR absorption
spectrum for the cell in storage 67, 91, 119, 142 and 254 hours after the
current has been turned off. A substantial jump in S02C12 concentration is
clearly evident. The band at 1115 cm-1 has disappeared whereas the one at
1070 cm-1 becomes quite evident and remains constant during the storage
period. Due to a reduction in the level of contamination the 665 cm-1
absorption can clearly be seen while the band at 694 has become a shoulder on
the 665 cm-1 peak. Absorptions at 2790, 2450, and 1225 cm-1 are present
throughout the run and are due to HCI and SOC12. (17)
I
.4
12

SEALING CAP_______
FE EDTHROUGH
TEFLON GASKET--.
4.25"
ELECTROLYTEWITHDRAWAL
SEPTUM
HEX NUTLT
*Figure I Electrochemical Coll Designed for Electrolyte Withdrawal
13

FI(URE 2
SC-68 Anode Limited -RT
i= 40 mA(r~x2
Reversal at 5 hrsIR Absorotion Soectra
22 hrs
4C.0 3600~ .0 2400.0 160.0 1LM.0 60.00WFEV MM (01-I1
14
% 11-

FIGLUpE 3
SC-68 AMode LiMited -
i 40 MA,(rAa2
IR Absorption Spectra
192.5~a at hr
16.5hr
140.r
115

FIGRE 4
SC-68 in Storage after Reversali -0 mA
254 hrs strq.
.w .
67 hrs strq.
*C .4200.0 860.0 3000.0 2400.0 1600.0 1200. 600.00
WAVQENLIM (c16

Prepared for Naval Surface Weapons Center Materials LaboratorySilver Springs, Maryland Gould Research CenterContract N60921-81-C-0363 lanuary 1983
3.2 Identification of Products of Discharge in Solution
On the basis of some of the previous studies which we have summarized in
Section 1 we can make the following assignments:
3400 cm-1 (broad band) AlCl3 OH-
2790 cm-1 (broad band) : HCI
2450 cm-1 (broad band) SOC12
1408 cm-1 : S02 C12
1335 and 1144 cm- I : SO2
1225 cm-1 (broad band) : SOC12
1115 cm-1 (broad band) : SOC1+
To identify the absorption bands at 1070 cm-1 , 927, 822, 694 and 665 cm-1 we
spiked several solutions of electrolyte or pure SOC12 with known compounds.
The IR absorption spectra of H20, H20 with AlCl3, S02 C12 and AiC 3 in SOC12
are shown respectively in Figures 5-8. Spectra of H20, CO2 , and SC 2 in
electrolyte are shown in Figures 9-11. These spectra are then combined in
Figure 12 in an attempt to reconstruct an actual absorption spectrum obtained
on reversal.
Addition of water to SOC1 2 (Figure 5) results simply in the formation of
HC (2790 cm-1 ) and SO2 (1335 and 1144 cm- 1 ). However adding water to either
the neutral electrolyte or to a solution of AlC 3 in SOC 2 causes some
striking effects. In neutral electrolyte (Figure 9) strong absorptions at
3400 and 694 cm-1 appear, whereas in the presence of AlCl 3 (Figure 6) bands at
803, 822 as well as 3400 cm- 1 appear in addition to the SOCI + band at 1115
* cm "I. All these features were observed in Cell SC-68. These results are in
agreement with the work of Bailey and Blomgren on the hydroxy- and
oxychloroaluminates in Li2 CO3 -AlCl3 /SOC12 electrolytes (13).
so2C1 2 in SOC12 (Figure 7) simply gives rise to characteristic
absorptions at 1408 cm "1 and 1171 cm-1 . Other absorption bands below 600 cm-1
17
Prepared for Naval Surface Weapons Center Materials LaboratorySilver Springs, Maryland Gould Research CenterContract N60921-81-C-0363 January 1983
were not recorded as most of the species generated during discharge and
reversal give rise to poorly resolved absorption bands in that region.
The effect of AlCl 3 addition to SOCl2 (Figure 8) is quite dramatic giving
rise to a strong absorption at 1115 cm-1 due to the S-0 stretching vibration
of the complex SOCI+AICI4- . Both SOCI+ and S02C12 were formed during reversal
in SC-68.
CO2 addition (Figure 10) to neutral electrolyte results in some weak
absorption bands at 2357, 803, 679 and 656 cm- . Contamination of an
operating cell with CO2 is possible but occurs to a small extent.
Upon addition of SC1 2 to neutral electrolyte containing SO2 (Figure 11) a
slow increase in the absorption at 1070 cm- I and 665 cm-1 is observed,
together with increases of S02C12 and SO2 . Both the 1070 cm-1 and 665 cm-
bands were formed during reversal in SC-68. Although we cannot identify the
products giving rise to these absorptions, a reasonable assignment for theI band at 1070 cm"1 is the S-O stretching vibration. The 665 cm-1 band could bedue to either S-O bending modes or S-S stretching modes.
At this stage we are confident that the sources of all the peaks in the
IR absorption spectrum have been identified. This is demonstrated ir the
spectral reconstruction shown in Figure 12 where we present a weighted average
of the spectra for water in neutral electrolyte, AlCl 3 in SOC1 2, water in
AlCl 3/SOC12, SO2 in SOC12 , S02C12 in SOC12 , and SC12 in neutral electrolyte;
this artificially generated IR spectrum is compared to the absorption spectrum
of SC-68 during anode limited reversal.
18

4~42
SQ
i 400001~ .1 cIgo 0 9 m ~ o DO
19 I

C14
4-4 C14
I ama a o w - W-200

4**
I~ oo oo *
.1 I21.........

C14
0
-4)
4Jo t
'-4 O C0 orl- w -Is D O
U2

I
CNN
44-
4 cc;
olws
4 23

* V
I
S. SIo 0
*o aa
0).4~)'-40
-a
'--4
(NJ '--4
U
I-~8
C) (N
'.4p4
o 0(N
a.
N N4-4
a
a.
I~.o ~.:
24
- -a-----

-I-
-1i
0 Cr14 41a
00 -loe lt* m
5 i

41)C(I4
tci
.
Iw I- 26 -
4"Al

Prepared for Naval Surface Weapons Center, Materials LaboratorySilver Springs, Maryland Gould Research CenterContract N60921-81-C-0363 January 1983
3.3 Synthesis of 320
To verify the claim of Isotone and Brodd at IN(fl (9) that S2 0 gives rise
to an absorption at 688 cm- 1 , we have attempted to synthesize S 20 and trap it
in SOCl2 . For the synthesis we used the reaction between SOC12 and Ag2S at
160C (see Figure 13). S20 in the gas phase has three IR active bands at 1165
cm "1 , 679 cm- I and 388 cm-1 (15). We were only able to observe a weak band at
1168 cm- 1 in the gas phase. Attempts to condense S20 in SOCI2 at 770 K
resulted only in the formation of a red polysulfur oxide which decomposed into
SO2 and sulfur upon heating to room temperature. No evidence of S20 could be
observed in the SOC1 2 trapping solution.
The absorption band at 688 cm- I which Istone and Brodd assigned to S20
consists in effect of two absorption bands, one at 694 cm-1 due to the
interaction of AIC14- and water, the other at 665 cm- observed only during
anode limited reversal. Salmon's assignment of a 690 cm-1 absorption to C12 0
(11) also overlooks the strong interaction of water with the electrolyte.
(Later our mass spectrometric analysis will show the presence of S20 in the
gas phase, but no trace of C120 - see Section 4).
27I

TRP.~TRAP SOC
SECONDARY FUIgNACEPUMP I60 C
LIQUID N2
2g 2
DEWARS
PRIMARYPUMP
(2667)
Figure 13 Schematic Diagram of the Vacuum Line used to Synthesize S2
Ag92S + SOCi 2 1600 C 2AgCI + S20
28

Prepared for Naval Surface Weapons Center Materials Laboratory
Silver Springs, Maryland Gould Research Center
Contract N60921-81-C-0363 January 1983
3.4 Gas Phase Studies
The gas phase spectra of several compounds such as SO2 , C02 SOC12
S02 C12 , S2 C12 and SC12 which might be present during anode limited reversal
were measured. These spectra obtained with a 20 cm gas cell equipped with
NaCl windows are shown in Figures 14-19. These were compared to the gas phase
IR spectrum of a cell driven into anode limited reversal (see Figure 20) at 5
mA/cm2 . So2, SOC12 and S02C12 are easily identified. The resu)ts for SC12 or
S2C12 are inconclusive. S2C12's strong absorption band at 461-454 cm-1 is
-- iotly in the same region as one of the strong absorption bands of SOC12.
SCI2, if present, would appear as a shoulder on the 502-492 cm-1 band of SOC12
(SC12 absorbs at 528-520 cm- 1); however, observation of that shoulder would
depend on the relative concentrations of SOC1 2 and SC12. A strong smell
points to the presence of at least one of those two sulfur chlorides. Mass
spectrometric analysis indicates that substantial amounts of SC12 are formed
on reversal (see below - Section 4).
0
29
- V.0.,,.M

S.
S
o
C-)
'-4G) a
gCfC
C
0I
I:ci ci
'-4 (J~ 0*a)N II~
Co & C* 0
IC
0008*c 0CK20 -~ 0O00.~
00000 00001 00000
30
*~.

' aI I
I I
r- ul
3z~aa
31
,- (; ~ " . ,

7-4
mm
L 0
CC.
M
a4
C.)
-4 -1
32.

Prepared for Naval Surface Weapons Center Materials LaboratorySilver Springs, Maryland Gould Research CenterContract N60921-81-C-0363 January 1983
3.5 Calibration Curves
For quantitative analysis of the discharge process we prepared
calibration curves for S02 , S02C12 and SOC1+ . These are shown respectively in
Figures 21, 22 and 23. We have selected the peak height technique as opposed
to peak area to assess the concentration of the various species present in our
system. The peak area technique although theoretically more correct is more
prone to "baseline" errors than the peak height method (18). As most of our
absorption peaks are bunched around the very strong absorption bands of SOC12
we concluded that peak height measurements would be more accurate for our
application.
33
33
w ~. _ .L .. ... .. . . . .. ... ... ,. , _ . . .. . . . . . .. - - . . ., ,,. _,.

2.0
1335 cm'LUz
cc1.0
0.00 .10 .20
MOLAR ITY
1.0
U1144cm 1
cc 0.5
0.00 .1 .2 .3 .4 .5
- -MOLARITY
W")W
Figure 21 SO2Calibration Curves 0.1mm Path
Length
34

I.-
0.30
L)0.20 1408em 1
00.10
0.000 0.1 0.2 0.3 0.4
MOLAR ITY (69
Figure 22 S02C12 Calibration Curve 0.1mm Path Length
A
435

2.0
zS1.0
1115cm-1
0.00.0 0.1 0.2 0.3 0.4 0.5
MOLAR ITY(2670J
Figure 23 SOCI + Calibration Curve0.1mm Path Length
36

I m
Prepared for Naval Surface Weapons Center Materials Laboratory
Silver Springs, Maryland Gould Research Center
Contract N60921-81-C-0363 January 1983
3.6 In Situ FTIR Studies
During our early work under this contract, electrolyte from bobbin cells
employing carbon for the cathode and equipped with a reservoir above the
cathode was sampled at regular intervals and analyzed by FTIR spectroscopy.
This method was plagued with difficulties and tended to yield irreproducible
results. Going to a thin cathode design (Figure 1) improved the results but
it was obvious that better control over the sampling procedure was necessary
to prevent contamination with moisture. We settled on a circulating system
where we coupled directly a spectroscopic cell to an electrochemical cell
using either a manual or automatic pumping method for circulating the
electrolyte between the two cells. The electrochemical cell design is shown
in Figure 24. A schematic representation of the system incorporating a
syringe pump is shown in Figure 25. Photographs of the actual systems used
are also included (Figures 26 and 27); the first system utilizes a syringe
pump and the second system, a peristaltic pump. The spectroscopic cell
incorporates silver chloride windows with a 0.1 mm optical path length though
on occasion we have used a 0.05 mm path length. The very first run however,
was performed with zinc selenide windows which lasted only seven hours on
exposure to the electrolyte.
Eight experiments were performed; these are summarized in Table I.
4.
37

TO PUMP AND SPECTROSCOPICCELL
FILL TUBEFEEDTHROUGH I
TEFLONGASKET "
HEX NUT 42
CELL WALL 3.0
ELECTROLYTE
WITHDRAWAL
HEX NUT
(2317)
F igure 24 EtectrochemiCil Cell for Flowing Electrolyte Systemn
38

SELECTRO- VALVE TO TRANSFER ELECTROLYTECHEMICAL 2 BACK TO ELECTROCHEMICAL CELLCELL
SPECTRO- SEPTURN FOR SYRINGE PUMPINGSCOPICn CELL
IVALVE TO WITHDRAW ELECTROLYTE
(2316)
Figure 25 Schematic of a Closed Loop Sampling System
t 39
11L~~~-M 1i" . ......

Fiqure 26
Photograph of Flowing Electrolyte System With Syringe Pump
40
41t
20
b)4
0~ 01-44
(D-4 .,.4 *.co'4
0. C) 4) C: bL b0WL)bo b o
0o-c C 0 .4 4 -(
V as4 --4 I- - 4r4-I(
4 004
E- > Cc/210 a)
co 0
c C) 0 0 C~j-4W' -TL) 4
0W
4) C
06 9
01
0 0) '0.
C 0 00 0 0~ 0C 00 00 C) C 4 0
06 0>
,4 0 ) (L
(U ) . d
-*3~ 0 C.)a) -N P-N .4 ,4N -I -IN .- IN -4N(U
v ~i *-.. 1-42 a)2*4 * 2 *I '4 40- C)) 20 00 2 0 2 0 2
a 0 0VL, :L
4) ) .00 00 0 0 0 0 0 0 0 00 V(Uj L.N NN) -114\N N NN -4
0 U 0 V)
0 :30
2. 0 0
4 :3 -H 4)r.
1.4 a~ d -H aN N 00 )
V 00 t-p t-2 VH t-4 0 t-0 V 0 H V 0 Co - 0 1 0 1 0 1' 1- 0 .1 2 10
L) ~ ~ r. uo 0~ L)c Ucc u 01 Urdc a-c / 0 V) Lf' :c V4 C) o C
424
SO
.......

Prepared for Naval Surface Weapons Center Materials LaboratorySilver Springs, Maryland Gould Research CenterContract N60921-81-C-0363 January 1983
Cell SC-69
This cell allows periodic circulation of the electrolyte through a zinc
selenide spectroscopic cell without exposing the electrolyte to the
environment. The cell was constructed with a 20 mil thick cathode using 90%
Shawinigan Black/10%PTFE and a 5 mil thick anode. The cell was diacharged at
40 mA (5 mA /cm2 at the anode and 2 mA/cm2 at the cathode) until fully
discharged. After 6 hours the experiment had to be terminated due to fogging
of the zin selenide windows shortly after the onset of reversal. The total
electrolyte volume in the system was 16 ml (1.4 M LiAlCI 4 in SOCl2 ) with
approximately 15 ml in the electrochemical cell and 1 ml in the balance of the
system which includes the tubing leading to the 0.1mm path length
spectroscopic cell. The electrolyte was circulated with a manually operated
syringe pump every hour until fully discharged. A three way valve allowed
withdra,-ial of electrolyte from the electrochemical cell into the syringe then
reinjection of the electrolyte through the spectroscopic cell and back into
the electrochemical cell. Approximately 5 ml of electrolyte were pumped twice
before every measurement of the IR absorption spectrum.
The absorption spectra are shown in Figure 28. Initially, the SO2 and
SOCl2 absorption bands are the only noticeable features in the IR absorption
spectrum, and throughout the discharge SO2 increases linearly. Difference
spectra (Figure 29) show a fairly low level of activity in the region from 600
to 1100 cm-1 which could not be evaluated quantitatively. In Figure 30 we
have plotted the SO2 concentration as a function of time into discharge. We
also show on the same figure the discharge curve with a well defined knee
after 5 hours (200 mAh). The SO2 concentration increases linearly and
corresponds in this case to approximately 7 Faradays/mole SO2 produced by the
end of discharge.
43

FIGUR 2 8
SC-69 Anode Limited -Ti = 40 mA(mAc2
Reversal at 5.3 hrsIR Absorpition Spectra
6 r
010
o1 hr
1500. 135.0 10C3.0 10500 90.00 750,00 600WAVENUI UEIM (C"- 11
44

FIGURE 29
SC'-69 Anode LiMited -T
Difference SpectraReversal at 5.3 hrs;i= 40 rmA (5mA/cxn 2 )
6 -1 hr
N 1h
14W0.0 1410.0 1110.0 1M.0 128.0mov*e fl tt-I
!ES" -114

........
0.080 .4.OV
C0.060 POTENTIAL 03.OV
0 VUw, 0
S0.040 2.OV z
so 2-0.020 I .OV
0.000 .. 0.0
0 1 2 3 4 5 6 7
1267f)
Figure 30 Cell SC-69
SO2 as a Function of Discharge AnodeLimited Cell, i 4OmA(5mA/cm 2 i
46

Prepared for Naval Surface Weapons Center Materials LaboratorySilver Springs, Maryland Gould Research Center
Contract N60921-81-C-0363 January 1983
Cell SC-71
The system is similar to SC-69 except that 3ilver chloride windows were
substituted for the zinc selenide windows in the spectroscopic cell. We were
able to extract a large amount of information from this cell which discharged
in approximately 5 hours at 40 mA before being driven into anode limited
reversal for a period of 90 hours. The current was then switched off and the
IR absorption spectrum was followed for an additional 50 hours.
The absorption spectra are shown in Figures 31-34.
During discharge the S02 concentration increases linearly until the cell
is fully discharged then levels off during anode limited reversal (see Figure
35). The results correspond to 6 Faradays per mole of SO2 produced by the end
of discharge. A much slower increase in SO2 concentration occurs during
reversal; we were not able to measure this change after 30 hours due to a
steadily growing absorption band at 1115 cm-1 which intereferes with the
accurate measurement of the SO2 absorbance at 1144 cm-1 . Except for the
steady increase in SO2 concentration, no other change in the absorption
spectrum occurs during normal discharge (Figure 36). After the onset of anode
limited reversal several significant changes can be noticed, shown in Figures
37-39. The band at 1408 cm-1 (S02C12 ) increases steadily, appears to level
off after 90 hours in reversal, increases suddenly after the current is
switched off then levels off to a steady value 40 hours later (Figure 40).
The absorption band at 1115 cm-1 (SOCI+) exhibits an interesting
behavior. After the onset of reversal the intensity increases then reaches a
steady state value after 40 hours. When the current is turned of f the
* * intensity of the absorption decreases to zero in less than 12 hours (see
Figure 41).
* The 1070 cm-1 infrared absorption is poorly resolved even after spectral
subtraction, but its presence is quite evident after the current is turned
47
Y-44w4

Prepared for Naval Surface Weapons Center Materials LaboratorySilver Springs, Maryland Gould Research CenterContract N60921-81-C-0363 January 1983
off. No activity occurs before reversal. After the onset of reversal an
increase in the absorption at 1070 cm- 1 is apparent. This absorption levels
off after 25 hours and remains at a steady value after the current is turned
off, pointing to a relatively stable product (see Figure 42).
A definite increase in the absorption at 665 cm-1 is noticeable after the
onset of reversal. This increase continues even after the current has been
switched off but appears to approach a steady value (see Figure 43). Again
the specie responsible for this absorption is obviously stable in the cell
environment; its assignment as C120 or S20 is in doubt, however, in view of
the fact that previous workers overlooked the interaction of water with the
electrolyte giving rise to a strong absorption at 694 cm-1 .
The complete discharge curve is shown in Figure 44. An important point
to be considered is the fact that 5.6 Amp-hour of charge passed through the
cell corresponding to approximately 0.2 Faraday. However, the volume of
electrolyte did not change by more than 10% during the experiment, indicating
recombination of species to form SOCl2 which is then available for further
reduction and oxidation.
48
FIGURE 31
SC-71 Anode Limited - RI'
i =4 0 mA (5 iA/cm2)Reversal at 5.7 hrsIR Absorption Sp~ectra
4 hrs
3 hrs
V1 2 hrs
1 h
1 hr
15M0.0 1950.0 Ohrx .000 W
WA1060.0 900.00
49

FIGURE 32
SC-71 Anode Limited -R'r
i = 40 niA (5ni.//n 2)Reversal at 5.7 hrs
_ IR Absorption Spectra
25hr
V.
1500.0 1860.0 1Z00.O 105.0 900.0 760.00 60.00WAVDUOI CH-S 1 1
50

FI(IJRE 33
SC-71 Anode Limited - irTi= 40 mA (5nA/'m 2 )Reversal at 5.7 hrs
IR Absorption Spectra
500r
9.5 hrs
a 5. 9. W1 o. WW 7DW 6.MOINOMIM.
771r

FIrEW 34
SC-71 in Storaqe after Reversal
i = 0
NR
4650ssr
I2ir sr
150.0 35.0 20.0 1050.0 900.0 750.00 00.00
52

0.16 -4.OV
0.1 POTENTIAL 0 3O
0*0
0.08 0.0V0 2 4 6 1
SO 2 s a Fucto 1fDscag
Anode Limited Cell, i =4OmA (5mA/cm2 )
53

FIGUR 36
SC-71 Anode Limited - RI'i = 40 mnA (5mrA/an 2 )Difference Spectra for S02Reversal at 5.7 hrs
NICOLET 5-riX IeS/1Z3/134 I13M0O
"2
Q
5 -0 hr
* - 4 0 hr
14W.0~~ ~ ~ 14-. 09. hr.0 Iz
WAVE14Ur1 - 0M Ihr
54
IW

C .~. FI(IJRE 37
SC-71 Anode Lim~ited -RT
a Difference Spectra for S02C12Reversal at 5.7 hrs
46.5 - 0 hr
42 -0 hir
24 -0 hr
17 -O0hr in
4.5 -0 hr storaqe
96.5 -O0hr inQ reversal
i= 4OrnA
77 -0 hr
50 - 0 hr
29.5 -0 hr
25 - 0 hr
23 - 0 hr
6 -0 hr
1475.0 1450.0 I4z5.V 1400.0 1375.0WAENtUtpEjqS M c- 11
55

NrflIL~T S-icc IMAC/3 Mcas is sWco
FIGURE 38
SC-71 Anode Limited - Rr1 = 40 mA (5n-A/cr2)Difference Spectra during Normal Discharge and Reversal
Reversal at 5.7 hrs
us 96.5 - 0 hr
77 - 0hr
S50 - 0hr
iN 29.5 -0 hr
25 - 0 hr
23 - 0 hr
6 - n hr
5 - 0 hr
4 -O0hr
3 - 0 hr
2 - 0Ohr
1 -0 hr
160 1076.0 67W 5.W 775.W 67.W 6.WWAVEcUuac (C"-1 I
56

N1IOLCT S-lU 1t9/IE3/134 132 2 3cloo
FIGURE 39
SC-71 in Storaqe after Reversal
4.5 hrs strq -0 hr
17hssrq-0h
24Iisrq-0h42hssrI-0h465 r sr.0h
1050 950 SI750 .06.9..NIM C-
57
0.40
-0.30-
0 S0.20-
o 0.10-J =0 40mA1 i OmA
0.000 40 80 120 160
(2322) HOURS IN REVERSAL
AFigure 40 Cell SC-71
S02CI7 Formation during ReversalAnode Limited cell, i =4OmA (5mA/cm2 )
58

0.25 -_ _ _ _ _ _ _ _ _ _ _ _ _ _ _ _
i 4OmA' i=OmA
0.20
t 0.15cc
0.10
0 20 40 60 80 100 120I(2321) HOURS AFTER ONSET OF REVERSAL
Figure 41 Cell SC-71SOCI+ Formation during ReversalAnode Limited Cell, i 44.en' (6mA/cm2 )
59 ~ 1

0.80-
wu 0.60-
CC 0.40-0
< 0.20-
0.00-i4m rA
0 20 40 60 80 10' 120 140
(2320) HOURS AFTER ONSET OF REVERSAL
Figure 42 Cell SC-71Intensity of Infrared Absorption at 1070cm-1
Anode Limited Cell, i 4OmA (5mA/cm2 )
60

0.60-wj 0
09
(n0.20
0 20i=4OmA i-OmA
0 0 40 60 80 100 120 140
(2319) HOURS AFTER ONSET OF REVERSAL
Figure 43 Cell SC-71Intensity of Infrared Absorption at 665cm-1
Anode Limited Cell, i 4OmA (5mA/cm2 )
61

4.0-
2.0-
0- 0.0
w
0 - 2.0-
-4.0.
- 6.010 25 50 75 100
TIME, HOURS
12672)
Figure 44 Discharge Curve - Cell SC-7i= 4OmA (5niA/cm2 )
Anode Limited
62

Prepared for Naval Surface Weapons Center Materials LaboratorySilver Springs, Maryland Gould Research CenterContract N60921-81-C-0363 January 1983
Cell SC-73
Cell SC-73 is similar to SC-71 except for a greater thickness of lithium
at the anode: 20 mils instead of 5 mils. The cell discharged for 22 hours
before anode limited reversal. Its behavior parallels that of Cell SC-71
except that a higher rate of SO2 generation was observed; this may be an
artifact due to moisture pickup in the system. Otherwise the trends are the
same (Figures 45-46). The SO2 concentration increases linearly during normal
discharge then at a much reduced rate after anode limited reversal (see Figure47). Sulfuryl chloride increases only after the onset of reversal (see Figure
48). The absorptions at 1070 cm-1 and 1115 cm-1 show trends similar to SC-71
clearly noticeable in Figure 49. A significant difference, however, is
evident in the increased absorption at 694 cm-1 during discharge (water
pickup). At the end of discharge the 694 absorption band decreases in
intensity and another band at 665 cm-1 increases until a steady value is
obtained (see Figure 50). The test was discontinued after 94 hours of
discharge. A complete discharge curve is shown in Figure 51.
I
63
,: t .- -

FIGURE 45
SC-73 Anode Limited - Ri40 mA (5Wma2)
Reversal at 22 hrsIR Absorption Spectra
5 r
CU
0 hr
1500.0 1350.0 1200.0 1050.0 90.00 750.0 600.00WMUMNMLI~A (Ch~- I I
64
ILI..

FI(XtJR 4 6
SC-73 Anode Limited -Rr
1 = 4 0 !PA (5mW'n 2)Reversal at 22 hrsIR Absorption Spectra
93.5 hU
50hr
as

1.2
~0.8o
00O.4
0.00 1 0 20 30 40 50
HOURS f63
Figure 47 Cell SC-73
S02 As a Function of Discharge Anode Limited
Cell, i =4OmA(5mA/cm2 )
66
L~

0.07
0.06
0.05
0.04
-'0.03
0.02
0.01!
0.000 20 40 60 s0 100
HOURS FROM ONSET OF REVERSAL
(2674)
Figure 48 Cell SC-73
S02Cl2 as a Function of Discharge AnodeLimited Cell, i =4OmA (5mA/cm2 )
67

Fiw49
S-3Anode Limited - Ri = 0 M(5mA/cn 2)
Difference Spectra during Normal Discharge and ReversalReversal at 22 hrs
In
22.5 - 0hr
I5 50hr
40- 0 hr
22. - 0 hr
25-0 hr
1 - 0 hr
1175.0 i075.10 q~75.00 875.00 775.W 675.00 600.00
68

0.35,
0.25-0az 2
00.15ca 0.10
0.05-
0 10 20 30 40 50 60 70 80HOURS FROM START OF DISCHARGE
(26751
Figure 50 Cell SC-73Relative Intensities of Bands at 694cm-1 and 685cm- 1
Anode Limited Cell, i 4OmA (5mA/cm2)
69

4.0
4 2.0
-U,0 j>0_j >-j 0.0LU
-2.0
0 50 100TIME, HOURS
f(2676)
Figure 51 Discharge Curve - Cell SC-73
i = 4OmA (SmA/cm2 )
Anode Limited
70

Prepared for Naval Surface Weapons Center Materials LaboratorySilver Springs, Maryland Gould Research CenterContract N60921-81-C-0363 January 1Q83
Cell SC-74
In this cell we reversed the positions of the anode and cathode and
increased the lithium thickness to 40 mils to ensure a cathode limited
condition. The cell was discharged at 50 mA for about 6 hours before cathode
limited reversal occurred. The cell was then driven for an additional 66
hours at 50 mA. Spectra obtained during normal discharge are shown in Figure
52, those during reversal in Figure 53.
The main difference in the spectrum from that of anode limited cells is
the absence of a sulfuryl chloride peak at 1408 cm- I and of a peak at 1115
cm-1 (Figure 54). During normal discharge a slight increase in absorption at
694 cm-1 appears to occur, indicating moisture pick up; this increase levels
off during reversal (see Figure 55). During reversal slight increases are
observed at 803 cm-1 , 980 cm-1 and 1070 cm-1 (see Figures 56a, b and c).
Formation of a slight absorption at 1070 cm-1 indicates that SCI2 is formed in
small quantities during cathode limited reversal. The discharge curve is
a shown in Figure 57.
7
71
-- 22...~ - , , .--

FICURE 52
SC-74 Cathode Limited - R
5.66 hrsi =50 mA (5mJA/c 2)
IR Absorption Spectra
4.66hU
3.6.r
IC-1U72

FIGUPE 53
SC-74 Cathode Limited - Ri'i 50 mA (5mA/an2)Reversal at 5.6 hrsIR Absorption Soectra
C27 r
55. .r
4 .5 r
31 5hr
235 r
6.6 r
7W0 W.
IC-
73

r4IEOLLT S-tIX 112/mE/134 l1g 1Xu00
FIGURE 54
SC-74 Cathode Limited -Ti= 50 mA (5m7\/cm2 )
Difference Spectra for Normal Discharge and Reversal
In 71- 0 hr
55.5 - 0h
47.5-0h
31.5 - 0 hr
23.5 - 0 hr
6.66 - 0 hr
5.66 - 0 hr
4.66 - 0 hr
3.66 - 0 hr.
2.66 - 0 hr
1.66 - 0 hr
0.66 - 0 hr
1170.0 107.0 970.00 370.00 770.00m 4 .
74

0.30
0w2LU
Z 0.20
0
0.10
0 20 40 60 80TIME, HOURS
t2677)
Figure 55 Cell SC-74Cathode Limited Cell, 50mAIntensity of 694cm1l Band
75

0.20-
Uz40co 010 (a
0.00-
0.20-
U
z 0
S0.10 (b0e
0/ 980cm-1
0.00
0.20
zcc. (c)0U)
4 0 1070cm- 1
0.00- - I
0 20 40 60 80TIME, HOURS
(2678)
Figure 56 Cell SC-74Intense tV of Absorptions at (a) 803, (b) 980, and (c) 1070 cm 1
76
-w --- I. -. I--

0 S 2.0
>0~.>
-J 0.0
0.0 2.0 4.0 6.0 8.0 10.0TIME, HOURS
(2679)
Figure 57 Discharge Curve -Cell SC-74i OmA (5mA/cm2 )
Cathode Limited
77

Prepared for Naval Surface Weapons Center Materials LaboratorySilver Springs, Maryland Gould Research CenterContract N60921-81-C-0363 January 1983
Cell SC-75
IR absorption spectra for this run are shown in Figure 58. This
particular cell is similar to SC-71 except that no lithium was added to the
cell and the path length for the IR spectroscopic cell is only 0.05mm instead
of 0.1mm. The cell was driven at 50 mA. We wanted to verify with this
experiment the reduced rate of S0 2 formation observed in our previous cells
after the onset of reversal. This was confirmed (see Figures 59a and 60).
The average rate of formation of SO2 was about 3 to 4 times less than during
normal discharge. In addition we tracked the formation of S02CI2 (Figures 59b
and 60) and observed a very sharp increase at 1115 cm-1 (Figure 61). Very
slight increases in absorptions at 665 cm- I and 1070 cm-1 are also noticeable.
The electrolysis curve for this cell is shown in Figure 62.
I
t78
_____ _42_ _;a

FI(EJRE 58
SC-75 Electrolysis Cell - r= without Lithiumn
i 50 mA(5(a/cm2)
IR Absorption Spectra
3lhrs
0 hr
1500. 1350.0 1W.0 1050.0 9. W 600.0-AE (C"- I1
79

0 .12
S0.08
4 (a)
00.04
0.00
0.10
0.08
>. 0.06
4 (b)o 0.04
0.0
0.00
0 8 16 24TIME, HOURS
(2680)
# Figure 59 Cell SC-75
(a) SO2 Formation upon Electrolysis, 50mA
(b) S02CI2 Formation upon Electrolysis, S0mA
j _______ ~80 __ _ _ _ _ _

picaLLE? S-tM IC3/C1/194 U. slaGW
* FFIURE 60
SC-75 Electrolysis Cell without Lithiumn Ri'i =50mA (5MAj/m2)Difference Spectra for S02 and S02C12
22 - 0 hr
53 0 hr
3-0 hr
2-0 hr
1475.0 14S.0 1375.0 13w.O 1t75.O
819A1* &
FIGURE 61
SC-75 Electrolysis Cell without Lithium -RI'
3- = 50 mnA (5ml/cm2 )Difference Spectra for SOCl+
I2- h
tM-1
- ~82 --

0
-2
-3
-5
-6
j0 2 4 6 8 10 12 14 16 18 20 22 24TIME (HOURS)
(2681)
Figure 62 Electrolysis Curve - Cell SC-75 Total Current 5OmA(5mA/cm 2 )
83

Prepared for Naval Surface Weapons Center Materials LaboratorySilver Springs, Maryland Could Research CenterContract N60921-81-C-0363 January 1983
Cell SC-77
Evolution of the IR absorption spectrum during normal discharge and anode
limited reversal is shown in Figures 63 and 64. In this particular case we
used a peristaltic pump to circulate the electrolyte around and simplify the
sampling. We discharged the cell at 6.9 mA (1 mA/cm 2 at the anode) for 23
hours before reversal and cont. iued at the same rate for an additional 25
hours. The behavior of this cell is reflected in the difference spectra shown
in Figures 65 and 66.
The trends are the same as with the higher current cells except for the
reduced rate of SO2 and SOCl+ formation (see Figures 67a and 67b). It is
interesting to note that S0 2C12 barely begins to form at this current after 24
hours into reversal. The rate of SO2 production during discharge corresponds
to about 6.0 Faradays/mole of S02 . The discharge curve is shown in Figure 68.
84
, , > ::, i ,

FIGURE 63
SC-77 Anode Limited - Ri = 6. 9 M (]mA/cr2)Reversal at 23 , hrs§ IR Absorotion Spectra
23 hrs
22 hrs
16 hrs
K 1 , hr
1 hr
g 0 hr
1~O UWO WOO 1050.0 O.0 750.w 6W00
85

AD A28 382 INVESTIGATO O 0 A AUM-THIOH CHLORIDE BATTERYSAFET HAZARDS(U UD RESEARCH CENTER RDLLHR MEADOWSILMATERIALS LAB A I A AET AL JAN 83 38-02
UARC SIFIED N60921-H C 5383 A/ 10/ 3

L Z 13 2.5
'J.g j:2 2.
1_.25 -4I'* g 1.6
MICROCOPY RESOLUTION TEST CHARTNATIONAL BUJREAU OF STANDARDS-1963 A
F'%

FIGURE 64
SC-77 Anode Limidted - RTi6. 9 rA (ipA/a2)
Reversal at 234 hrsCurrent Switched off at 47 hrsIR Absorption Spectra
24 4 hrs
23 hrs
23 hrs
1~0 1350.0 1WD.O 1050.O 9.00 750.00 600.0
86

FIGURE 65
SC-77 Anode Limited -T
i= 6. 9 mA (hiA/a2)Difference Spectra for SO2 and S0 2 C12Reversal at 23 4 hrs
47.5 -0 hr
39.75-0 hr
243- - 0 hr
23 4 - 0 hr
22 - 0 hr
16 - 0 hr
1.5 -0 hr
1 -0 hr
1460.0 14W.0 1360.0 13M0.0 U.
______ _____87

f4ICOLCT 3-M~ 1Ch1Uh154 l13s00e
FIGURE 66
*ISC-77 Anode Limited - RCt. = 6. 9 rP (]~/2)
Reversal at 234 hrsDifference Spectra for SOCl+
475 0h
397I0h
I4!0h23 0h
1. 0h
i170.0 1070.0 870.00 670.0 770.W0 670.00 600.00
88
L 14 lb

0.10
0.08SO+
0.06
o 0.04
0.02
0 20 40 60TIME (HOURS)
(2682)
Figure 67 Cell SC-77
SO2 and SOCI + Formation During ReversalAnode Limited: i =6.9MA0lmA/cm
2 )
89

-4
0
wu 2
0> 0-j
-2.0010 20 30 40 so
TIME (HOURS) (63
Figure 68 Discharge Curve - Cell SC-77 i 6.9mA 0I mA/cm2 )Anode Limited
90

ii
Prepared for Naval Surface Weapons Center Materials LaboratorySilver Springs, Maryland Gould Research CenterContract N60921-81-C-0363 January 1983
Cell SC-79
This experiment is a duplicate of SC-77, but we were able to run it over
a longer period of time (see IR spectra in Figures 69-71). The cell
discharged at 7.4 mA for about 20 hours then was driven into reversal for
about 64 hours; measurements were taken for an additional 8 hours after
current cutoff. Difference spectra are shown for the reversal condition in
Figure 72. In spite of the prolonged period of reversal very little SO2 CI2
accumulates. SOCl+ formed during reversal decays essentially to zero within 8
hours after turning the current off. A significant peak at 665 cm-1 appears
during reversal; this peak was noticeable in the preceding experiment but had
not accumulated to any extent after only 24 hours of reversal. A peak at
1070 cm-I which appears as a shoulder on the 1115 cm-1 peak during reversal
becomes very evident after the current is turned off and SOCl+ decays. These
results are summarized in Figures 73a-d. The results for sulfur dioxide are
similar to those for SC-77 but more erratic, indicating a possible leak in the
system. Figure 74 shows the discharge curve.
-91
'i 91
I _ __ _ _

FICURE 69
SC-79 Anode Limited - IRT
Reversal at 23 hours
IR Absorption Spectra
0 hr
92
L~__ -- ~_77I

FIQUR 70
SC-79 Anode Limited - RTi = 7. 4 rn ba2
Reversal at 23 hrsIR Absorption Spectra
0089hr
0
74hr
0
067ar
a950ar
'~01
25 hrs
1500.0 1350.0 1200.0 1050.0 900.00O 750.00 600.00
93

FIGURE 71
SC0-79 in Storage after Reversal= 0
Storage at 89.2 hrs
978 r
923 r
907 rtSWO 30 1M. M0 9. . 6.meoIM1I94

rMIvLLO StI* 1n//134 1!g1lseOO
FIGURE 72
SC-79 Anode Limited -Rri 7.4 mA (1 mA/a2)Difference Spectra for Reversal and StorageReversal at 23 hrsStorage at 89.2 hrs
97.8 -0 hr
i 0
92.3 -0 hr
i
1!90.7-0 hr89 -0 hr
74 -0 hr
67 - 0 hr
0 50 -0 hr
41 - 0 hr
25 - 0 hr
20 - 0 hr
u)W.o wsa. eba.W 750.W ssa.w WO
95

0.025
S0.020
~0.010 CRNT (a) S02 %1
0.005 REVERSAL OFF
0.0000.06
0
>0.04 ()SC
4 0.02(b oi
0 REVERSAL)CURRENT
OFF
0.20:
0.15
zc0.10 Wc l070cm-1 Absorption
0U),
0
0.05REVERSAL 0 CURRENT
0 OFF
0.00 ___________________________________
0.3-
zO.2(d) 665cm'l Absorption
~0.1CURN4 REVERSAL CUREN
0.0J-0 20 40 60 80 100
TIME (HOURS) (64
3Figure 73 Cell SC-79
Anode Limited: i =7.4mA~lmA/cm2 )
96
-- - -- ....

4
02
CLw CURRENT OFF
0 2
TIME (HOURS)
(2685)
Figure 74 Discharge Curve - Cell SC-79
i 7.4mA(lmA/cm 2) Anode Limited
97

Prepared for Naval Surface Weapons Center Materials LaboratorySilver Springs, Maryland Gould Research CenterContract N60921-81-C-0363 January 1983
Cell SC-81
Cell SC-81 was discharged at -200 C. Cell construction was identical to
the preceding ones; however, the cell was placed in a controlled temperature
refrigerating bath. The electrolyte was periodically circulated with a
peristaltic pump to the spectroscopic cell located in the spectrometer
chamber. The length of the tubing leading to the spectroscopic cell and the
mass of the latter were sufficient to bring up the sample temperature to
ambient. Sampling under those conditions tended to reduce significantly cell
polarization (Figure 75). The first 17 hours of discharge were performed at 1
mA/cm 2 (8.14 mA). The current was then brought up to 5 mA/cm2 (40.70 mA) and
the cell went into reversal two hours later. We continued driving the cell
into reversal for an additional 22 hours at 5 mA/cm2 . The current was then
turned off and the temperature brought up to 200C over a period of 3 hours.
Spectral measurements were taken for another 67 hours. This sequence of
events is shown along with the discharge curve in Figure 75. Large voltage
fluctuations are observed during reversal; the voltage jumps to more positive
values every time we circulate the electrolyte. It is obvious that cell
resistance especially during reversal is very high. We have monitored the SO2
concentration during normal discharge (Figure 76), the SOCI+ concentration
during the first six hours of reversal (Figure 77), and the S02 C12
concentration during the reversal and warming up periods (Figure 78). IR
absorption spectra as well as difference spectra illustrating the behavior of
these species are shown in Figures 79-84.
The IR absorption bands at 1070cm- and 665 cm- exhibit their usual
behavior, and some moisture contamination is apparent especially after the
onset of reversal (broad band around 694 cm-1 ). We have plotted in Figure 76
the SO2 concentration as a function of mAh withdrawn. A slight curvature is
noticeable at the beginning of the discharge indicating that SO2 generation is
not linear at this temperature, at least in the early stages of the
discharge. The overall stoichiometry, however, corresponds to 7.6
Faradays/mole of SO2 generated during normal discharge. (Table 2)
98
L - . • ---- --- -I

Prepared for Naval Surface Weapons Center Materials LaboratorySilver Springs, Maryland Gould Research CenterContract N60921-81-C-0363 January 1983
One obvious effect of the low temperature is the immediate and sharp
increase of SOCl+ concentration during reversal, the increase amounting to
about 0.65 mole per Faraday (see Figure 77). At higher temperatures
regenerative processes are in effect so that only small amounts of SOCI+
accumulate in the cell.
so2C12 , however, does not begin to accumulate until at least six hours
after the onset of reversal (see Figure 78) and then increases slowly.
Turning off the current at -200C does not seem to affect the S02C12
concentration, but a dramatic jump in its concentration occurs as we warm up
the cell to 200 C, the concentration at the end of the warm up period being
outside the range of our calibration. This behavior points to a chemical
reaction between SO2 and C12 as the source of S02C12 in the cell.
Due to the very high intensity of the SOCl+ absorption we were not able
to track the absorption at 1070 cm-1 . The presence of this peak becomes
obvious, however, as the SOCI+ decays after the current is turned off and the
cell warmed up.
9
99
, .. . . . . - - - - . -•

5 WARM-UP PERIOD
T =-20%C T 200 C
1= 8.14mA,~ i =40.7mA i= 0
3 T
_j 20
ul i
SAMPLING CURRENT OFF
0_j)
-- 2
--40 25 50 75 100
TIME, HOURS
(2686)
Figure 75 Discharge CurveCell SC-81Anode Limited-~20o C
100

0.10
0.08
t 0.06
00.04
0.02 REE7S
0.00 -0 100 200 300
mAh WITHDRAWN (67
Figure 76 Cell SC-81
SO2 Formation During Discharge -20'C
- ~101-

0.6 -_ _ _ _ _ _ _ _ _ _ _ _ _ _ _
0.4
Concentration incrmasesBeyond Limits of Calibration
00.2
0.00 5 10 15
HOURS INTO REVERSAL (268
Figure 77 Cell SC-81
SOCI + Formation During ReversalAnode Limited at -20'C; i 40.5mA (5mA/CM 2)
ft 102
L i ------ S-.-

0.4
WARM-UP PERIOD>
>0.3CONCENTRATION INCREASES
BEYNDLIMTSOF CALIBRATION
0~0.2
CURRENT OFF
0.1 4010 20 30 40
HOURS AFTER ONSET OF REVERSAL
(2689)
Figure 78 Cell SC-81
S02 C12 Formation During Reversal and Warm-up AnodeLimited i =40.5mA(5mA/cm
2 ) T -200C
103

FIRE 79
SC-81 Mnode Linited (-20 C)Normal Dischargei = 8. 1 nmA 1Ac2
RL-versal at 19.75 hrs
16.9 hrs (i chanqed to 40.5 mA after this spectrum)
4 104
1040

FICURE 80
SC-81 Anode Limited (-20 C)
25.9 hrs;
24.4 hrs
23.6 hrs
imw.a I3. i.D lagoulo 97W W.OD G.O
105
FIGURE 81
SC-81 During Storage and Warm-up Periodi =0Storaqe beqiris at 41.5 hrsWarm-up Period begins at 47 hrs
68 hrs (20 C)
509ha(0C
50. hrs (20 C)
50. hrs (0 C)
49. hrs (160 C)
lw IBO.O 1M0.O IOW.O QJO.w 7w.w wI
106
L~

FIMUR 82
SC-81 knode Limited (-20)Difference Spectra for S0 during Normal Discharqe
i=8.1 mA (bnA/an 2 ) during the first 16.9 hours
1 40.5 niA (5npA/cx 2 ) after 16.9 hrs
Reversal at 19.75 hrs
N t4ZCOLET 5-I IC1B/ 134 135sIl .0
19.5 h
19. - 0 hr
16.9 - 0 hr
C;-2.8 -0 hr
I _ __ _
14 .

POIWOLET 5-t1* isIE,/IM13 135s lSsO0
F IGU RE 83 - 0 CSC-81 Anode Limited (-0C
Difference Spectra for Normal Discharqe and Reversali = 8.1 MA (br'Acrn2 4 durinq the first 16.9 hoursi = 40.5 mA (5mA/an ,) after 16.9 hoursReversal at 19.75 hrs
25.9 -0 hr
24.4 -0 hr
23.6 - 0 hr
21.6 - 0 hr
19.8 - 0 hr
19.45 -0 hr
19 - 0 hr
.16.9 - 0 hr
2.8 - 0 hr
* 10. 060.0 960.0 60.010 760.0 660.00600.0
108

FI(UR 84
SC-81 Difference SpectraS0 2 C12 during Reversal, Storaqre
and warm-up periodi = 4 0. 5 TA (5rpA/c n2)Reversal at 19.75 hrs
s Storage at 41.5 hrs (i=0)
Warm-up period begins at 47 hrs
50.0 - 0 hr (20 C)
50.1 - 0 hr (20 C)
* 508.0 - 0 hr (0 C)
470- r(-0C
49.1 - 0 hr (160 C)
-~ 25.9 - 0 hr (-20 C)
1475.0 1460.0 14E5.O 14W.0 1375.0
109

Prepared for Naval Surface Weapons Center Materials LaboratorySilver Springs, Maryland Gould Research CenterContract N60921-81-C-0363 January 1983
Table 2
S02 PRODUCTION DURING NORMAL DISCHARGE
SC-69 (5 mA/cm 2 , RT) 0.14 Mole/Faraday
SC-71 (5 mA/cm 2 , RT) 0.17 Mole/Faraday
SC-77 (1 mA/cm 2 , RT) 0.17 Mole/Faraday
SC-81 (I mA/cm 2 , -20C) 0.13 Mole/Faraday
1
* 110

Pronared for Naval Surface Weapons Center Materials LaboratorySilver Springs, Maryland Gould Research Center
Contract N60921-81-C-0363 January 1983
3.7 Conclusions
The infrared absorption spectrum of lithium-thionyl chloride cells which
initially appeared quite complex was greatly simplified as soon as the effects
of contaminants such as moisture were understood.
By measuring the spectrum in situ, we were able to limit the interaction
of moisture with the electrolyte to an acceptable level. Quantitative and
reproducible results have been obtained from run to run for anode limited
cells, and definite trends have been demonstrated.
During normal discharge at 25C SO2 is the only discharge product detected
by IR spectroscopy (sulfur and LiCl are also formed but were not measured in
this study). The rate of SO2 formation is linear and appears independent of
current density - from 1 to 5 mA/cm2 . At -20C a slightly nonlinear rate of
SO2 production is noticed, and under all conditions, the amount of SO2
produced was less than what would be predicted by the equation
4 Li + 2 SO Cl = 4 LiCl + SO + S2 2
During reversal the SO2 concentration continues to rise but at a slower
rate. Several other species begin to appear: S0Cl +, S02 C12 and species
giving rise to absorptions at 1070 cm-1 and 665 cm-1; these last two
absorptions are indirectly indicative of C12 or SC12 formation on reversal;
however, the evidence for C12 is also indirect whereas SC12 has been
positively identified by mass spectrometry. SOCl eventually reaches a steady
4state concentration which is dependent on both temperature and current
density. S02CI2 is also dependent on both temperature and current density,
and its concentration tends to surge upward particularly after disconnecting
the cell following reversal. Warming up a cold cell from -20C to +20C results
in a disturbingly large increase of S02C12 from either an increased rate of
reaction between SO2 and C12 at the higher temperature, or the sudden
degradation of an unstable compound.
111

Prepared for Naval Surface Weapons Center Materials LaboratorySilver Springs, Maryland Gould Research CenterContract N60921-81-C-0363 January 1983
Formation of SCl 2 during reversal gives rise to compounds absorbing at
1070 cm- I and 665 cm-1 whose exact nature is not known; however, complexes
such as SCl (AlCI4) have been identified in the reaction of SCl 2 and AlCl 3
(19) and may give rise to an absorption around 665 cm- . The 1070 cm-1
absorption reflects the presence of S-0 bonds. It is interesting to note that
upon addition of SC 2 to neutral electrolyte SO2CI2 and SO2 are also formed.
The increase in S02C12 which is observed after disconnecting the cells may
simply arise from this source. The weak absorption at 1070 cm-1 observed
during cathode limited reversal may also be due to formation of small
quantities of SC12 , and subsequent reactions.
It is quite evident that during anode limited reversal a highly acidic
environment is created in the cell. It might be worthwhile to perform
calorimetric studies of reactions in AlCl3/SOC12 solutions. Several
improvements in the experimental approach are also possible to better
ascertain the behavior of the lithium-thionyl chloride system. Temperature
and pressure measurements would yield additional correlations. Use of shorter
optical path lengths for our IR cells would enable us to extend our
calibration curves. Extending the FTIR spectrometer's range to 250 cm- I would
reveal additional bands in the spectrum. Electrochemical studies in carefully
prepared mixtures could help elucidate the mechanism of several
electrochemical reactions involving SOCl2. These are just a few of the many
additional experiments that need to be performed. It is also obvious that IR
spectroscopy alone may not provide all the answers, and that an attempt should
be made to identify insoluble products of discharge.
112
.. ...- ,

Prepared for Naval Surface Weapons Center Materials LaboratorySilver Springs, Maryland Gould Research CenterContract N60921-81-C-0363 January 1983
4. A Mass Speetrometric Study of Gases Evolved During
Discharge and Reversal of Anode-Limited Li/SOCl2 Cell
In this section we discuss the time-dependent results obtained from a
mass spectrometric study of an in-situ anode limited Li/SOCI2 cell, and we
report the mass spectra of pure components and their measured appearance
potentials.
4.1 Abstract
Species formed during discharge, reversal and storage of a Li/SOCI 2 cell
were identified and quantitatively measured as a function of time. Mass
spectrometric data indicate the existence of molecular HCl, SO2 , CS2, $20 ,
SC12, SOCI2 and mass 134 species (mainly S02 12). Data also reveal the
presence of high levels of chlorine fragments as well as low concentrations of
CF2+ fragments. Species with molecular weights exceeding nominal -,ass 140
were also observed. The relative concentrations of the species idenrified are
plotted versus time during discharge and reversal. These plots indicate that
the concentrations of HCl, C1- and S02 remain essentially constant in the gas
I phase during discharge, but increase after an induction period of
approximately five hours during cell reversal. The plots for CS2 and S2 0 show
little variation in concentration of these species with time during both
discharge and reversal, while the plots for SCI2 and the mass 134 species
clearly indicate that these compounds are formed only after a similar
induction period during the reversal mode. Mass spectra for pure SCI2 , SOC12
and S02C12 were obtained. The appearance potential for these pure species as
well as for SO2 and argon were also measured.
113
- -- -,-- ---- .._______________, "i

Prepared for Naval Surface Weapons Center Materials LaboratorySilver Springs, Maryland Gould Research CenterContract N60921-81-C-0363 January 1983
4.2 Experimental
A Perkin Elmer (PE 270) mass spectrometer with a home-built all glass gas
inlet system was used for the in-situ experiment. A diagram of the
experimental sampling system is shown in Figure 85A. This sampling system
consists of two (V1 and V2) stainless steel shutoff nonrotating stem valves
(Circle Seal). The sampling volume contained between V, and V2 is
approximately 0.5 cm3. The glass inlet system is comprised of four teflon
stopcocks (V3-V6), with V4 providing access to a roughing pump and V6 finally
leading to the mass spectrometer ion source. V5 provides access to a
perfluorokerosene (PFK) reservoir which is used in the calibration of the mass
scale.
The exact mass experiments were performed on an AEI MS-30 double focusing
mass spectrometer. Accurate mass measurements were performed with an Anatron
peak matching unit. These measurements were carried out with known (20)
perfluorkerosene fragments used as the mass reference. The intensity versus
time data were obtained with 80 ev electron energy on the PE270 mass
spectrometer and with 70 ev electron energy on the MS-30 mass spectrometer.
The detailed description of the cell and the method of preparation of these
chemicals are given in the previous sections of this report.
1 14
I I -i li . ... . . . I . .- "' : . . . -.. ... . .. . ..- - . .

PFK
TOV3 V V6 ION SOURCE
4
V /--HEATED ALL GLASS2 INLET SYSTEM• SAMPLING
VOLUME
TOROUGHING PUMP
' "v-CELL
"~1
Figure 85A. Mass Spectrometric Sampling System.
115
--------- Ai

Prepared for Naval Surface Weapons Center Materials Laboratory
Silver Springs, Maryland Gould Research Center
Contract N60921-81-C-0363 January 1983
4.3 Results
The discharge rate of the anode-limited Li/SOCI2 cell was set at 1 mA/cm2
of the surface area of the anode. A current level of 6.25 mA/cm2 was used
during reversal. The total surface area of the anode was 8 cm2 . The in-situ
experiment spanned 69.25 hours (Figure 85B shows the discharge curve).
Fifteen sets of mass spectra were recorded from time zero at the beginning of
the discharge through time 69.25 hours. Reversal onset occurred at time t=21
hours, and the reversal process was continued through t=66. The last set of
spectra was recorded at time t=69.25 hours. Tabulated intensities for nominal
masses appearing between and including masses 35 and 138 are given in Table
3. All intensity data are relative to the intensity of nominal mass 83
(SOC135+) which is set arbitrarily to 100. Plots of intensity versus time for
each of these masses are shown in a sequence of figures whose numbers will be
given in the discussion section. Data points in each of these graphs are
connected to facilitate following the general intensity change with time. The
uncertainty in the data shown in Table 3 and the corresponding figures is
estimated to be + 10%.
Pure samples of SCl2, SOCl 2, S02C12 were introduced into the mass
spectrometer, their spectra were recorded and the peak intensities were
entered in Table 4. Reproduction of these spectra are also shown in figures
whose numbers will be given in the discussion. In addition a sample of S2C12
whose purity is questionable has been admitted into the mass spectrometer and
the resulting tentative spectrum is shown. All of these spectra were recorded
with electron energy of 80 ev.
The appearance potential of SC12 , SOC12, So2 C12 , SO2, Ar and of slightly
impure $2 CI2 were measured on the PE270 mass spectrometer. The data obtained
for these compounds were then normalized to the appearance potential measured
for argon. The appearance potential data are plotted versus electron energy
and are shown in subsequent figures.
116
. . . . . . . W , -- =- .|

Prepared for Naval Surface Weapons Center Materials LaboratorySilver Springs, Maryland Gould Research CenterContract N60921-81-C-0363 January 1983
Three masses were accurately measured in the exact mass experiments.
These are masses 50, 76 and 80. Problems arising from the corrosive nature of
the species present in the Li/SOC12 system caused frequent ion source filament
burnouts. Further accurate mass measurements should be made in the future in
order to positively identify other important species. The results obtained
from these measurements were:
Nominal mass 50 exact mass = 49.99597 * 30 ppm
Nominal mass 76 exact mass = 75.94528 + 20 ppm
Nominal mass 80 exact mass = 79.94057 + 20 ppm
1
A
4
' 1
• ~ ~~~. :,,.4 . ' "

4
2
0
w< 0 SPIKES DUE TO SAMPLING
-2
i BmA(lmAlcm 2
i5OmA("S6.25mA/cm 2
-4 1 - I
0 20 40 60TIME (HOURS)
(2690)
Figure 85B Discharge Curve Cell SC-80 Anode Limited T 25'C
118

LA) --. L- G ot \ Tt t-0 (7% - 0 LO t- c'0 ~-;coC-('4 *LAC 0C'J *C\J00 c ~--a- * *
0Y. - - . -4 04 -C l 0 C J0 0ON _T-(Y T
m o U- 0 --0-r40 - ( J'0 D -
(d ~ ~ a'. (VN ,o -r .-j U * 0~j 00 0\ 0' 0- C ( C'' 0 0 0 0 0 -L t -'.0 - M - (Y). .- 0 '.L A- 000 -C '
t- (Y ' Y -0 % .0 t-C
,H )>1 Ln '.Ln ODcr%0 % 'NU (\0O'C)-a%00 000'.0' 0co00 m 0t--.0
U0 A t.- '- I4 C-0 L A .- 0 00LC cCj
S0) H - - 0 C 0 A '' 0
0. ~ U NH 0m 0'40 'r'.
z -0c.) r_ .) m m (YCj t- t-A-~ 00 C t-L-U-'00 t- 0'.O D VA L'. %D M Y M - 00 LA
*H 0 0 *. .r ID'C J C.
0) > C0t4 L ) -) 0 C\ I - 0" C\ - C)-T0 -)0 0C)% .00
4- > 0oCIC
c- .1 3 44 4)LAO)_z r 0 c\jt04~ - C" C
0 - -
0: m (. od. 4 4. )C C ,' ) 0 0
a) 004 S
-H 0) 01 -H -H4) (y)0 LO C\0 .0 1 %DC)0 OCo 0C 0C 0'o- o 0 0o 0 M --Z 0 0 0 C
V) .) 4 o C * 0 A U '- 00.0 N L O'- MLOD 04
> -Ho 4.)t Lc - .- j 04 -
0 10 c 4-) C\
Do m 042 8 0 LA - 04 1 O' 1' ~-' 00 00 '.'. 0
04 C ~ -~ '.0 O04
'-0 C' 4'00 0 -
0 \ m Cj 0 D-~j m
04 ry- IA CY\ I~ - --J 0 C\J U' C> 00 ) 0 00000C 0 t. 00C0
( Ln ON0 u; -4 !Y - 04(Y ~
. . .. . . . . . . . C) .

TABLE 4
Mass spectral intensities for pure SC12 , SOCl2 and S02C12*Indicates the most intense peak.
Mass SC12 SOCl2 S0 2 C12 Mass SCl2 SOC12 S02CI2 Mass SCl 2 SOC12 S02C12
30 0 0 0 67 100" 3.44 0.92 104 43.7 0 031 0 0 0 68 0.95 0 0 105 0.96 0 032 64.4 100" 36.5 69 36.4 1.32 6.27 106 8.60 0 033 0 0 0 70 9.72 0 1.27 107 0.91 0 034 1.34 1.13 0.93 71 2.71 0 0 108 0 0 035 12.1 17.7 6.67 72 5.56 0 1.17 109 0 0 036 75.3 91.4 18.7 73 0 0 0 110 0 0 037 4.10 6.55 2.76 74 1.03 0 0 111 0 0 038 26.2 27.7 9.41 75 0 0 0 112 0 0 039 1.92 0 1.46 76 2.54 2.56 2.16 113 0 0 040 4.45 7.25 3.58 77 0 0 0 114 0 0 041 4.5 0 0.93 78 0 0 0 115 0 0 042 1.86 0 1.46 79 1.05 0 0 116 0 0 043 1.95 2.23 2.50 80 0 3.00 0 117 0 0 044 1.73 2.80 3.63 81 3.63 0.23 0 118 0 3.6 045 0 0 0 82 1.30 0 0 119 0 0 046 0 0 0 83 3.5 41.5 0 120 0 2.5 047 0 0 0 84 0 0 0 121 0 0 048 1.74 49.8 53.5 85 1.79 14.5 0 122 0 0.58 049 0 0.92 0.93 86 0 0 0 123 0 0 050 0 2.81 4.09 87 0 0.62 0 124 0 0 051 2.85 0 0.93 88 0 0 0 125 0 0 0
52 2.2' 0 0 89 0 0 0 126 0 0 053 o 0 0 90 0 0 0 127 0 0 054 0 0 0 91 0.96 0 0 128 0 0 055 6.69 0 0.90 92 0 0 0 129 0 0 056 2.15 0 0 93 1.09 0 0 130 0 0 057 5.24 0 0.98 94 0 0 0 131 0 0 058 0 0.75 0.91 95 4.76 0 0 132 0 0 0
59 0 0 0 96 1.11 0 0 133 0 0 060 0 0.63 0.78 97 3.70 0 0 134 0 0 6.8461 0 0 0 98 0 0 0 135 0 0 062 0 0 0 99 0 0 35.3 136 0 0 5.0863 0 0 0 100 0 0 1.17 137 0 0 064 4.00 31.1 100' 101 0 0 12.9 138 0 0 1.1765 0 0 2.28 102 67.8 0 0 139 0 0 066 0 2.06 7.54 103 0.83 0 1.17 140 0 0 0
120
IL .'+ +

Prepared for Naval Surface Weapons Center Materials LaboratorySilver Springs, Maryland Gould Research CenterContract N60921-81-C-0363 January 1983
4.4 Discussion
For the purpose of this discussion we will assume that the ratio of peak
intensities in a mass spectrum is equal to the partial pressure ratio of the
species giving rise to these peaks. We realize that this is not strictly
correct since pressure calibration constants are needed in order to convert
relative intensities into accurate partial pressures. All times reported in
this discussion will be given the symbol t and units of hours.
4.4.1 C1+ , HUI
Intensity versus time profiles for masses 35 through 38 are shown in
Figure 86-89 respectively, and numerical data for these masses are entered in
Table 3. The peak intensities of mass 35 (C,35+) and mass 37 (Cl37+ ) are seen
to be essentially constant (within + 10%) at times up to t=26 beyond which a
sudden increase in their intensities is observed. With reversal occurring at
t=21, there exists an induction period of approximately 5 hours. After this
induction period an escalating level of chlorine fragments indicates chemical
reactions leading to increased levels of chlorine production. The average
concentration 3f C135+ between t~o and t=26 is calculated to be 17.7% while
that between t=42 and t=66 is calculated to be 62.1%. These values are
obtained from averaging intensities of mass 35 between the specified times
listed in Table 3. Thus a 3.6 fold increase is seen in the concentration of
C135+ fragments during the reversal process for the anode-limited Li/SOCI 2
cell.
Similar observations can be made regarding C137+ isotope fragments. The
ratio just calculated for mass 35 is repeated for mass 37. This is the ratio
of the average concentration of C137+ from t=42 through t=66 and the average
concentration of this same species (C137+) from t=o through t=26, and is
calculated to be 3.2. Comparing these two results, it is seen that C135+ and
C137 concentrations have increased between 3.2 and 3.6 fold on or after
t=42. The maximum concentration of both of these species occurs at
121
'~-~'
~4.1 ?1
Prepared for Naval Surface Weapons Center Materials LaboratorySilver Springs, Maryland Gould Research CenterContract N60921-81-C-0363 January 1983
approximately t=50.25. The ratio of the average intensity of C135 to C137 is
calculated from our data to be 35.69/11.69 or 3.05 + 0.3 while the isotope
abundance of C13 5 /C1 3 7 is given by 75.53/24.47 or 3.09. Thus our result
agrees well with the reported values of chlorine isotope abundance.
For masses 36 and 38 (HC135+ and HC137+, respectively), the increase in
their relative intensities is seen to begin about the same time as does the
increase in chlorine fragment intensities, namely at t=26. Thus the induction
period for HCI is approximately 5 hours and is similar to the induction period
of chlorine fragments. Also the maximum concentration of both of the HCl+
species occurs at approximately t=50.25, the same time at which chlorine
fragment concentrations are seen to reach their maxima. For HC135+ the ratio
of the average concentration on and beyond t=26 to that below t=26 is
calculated to be 4.9 while this ratio for HC137+ is found to be 3.9. Thus an
increase of HCl+ concentration between 3.9 and 4.9 fold is seen during the
voltage reversal stage of the anode-limited Li/SOCI2 battery.
Considering the tabulated data (Table 3) we observe a noncharacteristic
pulse in both Cl+ and HCl+ concentrations at time t=18.5 (see Figure 86-89).
This pulse can arise from either a true surge of these species in the system
or it can be attributed to unresolved experimental variables. Additional
experimental work should be performed to resolve this point.
It is interesting to note that the HC1 concentration is generally higher
than the chlorine concentration in this system. The ratios of the average HCI
concentration to the average chlorine concentration before and after an
induction period of 5 hours are 3.2 and 5.1 for C135+ and HC135+ respectively
and 3.8 and 5.2 for C137 and HC137+ respectively. A few remarks need to be
made about these numbers.
First the existence of both HC135+ and HC137+ in higher concentrations
than Cl+ concentration implies the existence of a substantial source of
hydrogen in the Li/SOC12 system. McDonald (16) observed that hydrogen gas is
122

Prepared for Naval Surface Weapons Center Materials LaboratorySilver Springs, Maryland Gould Research CenterContract N60921-81-C-0363 January 1983
one of the sources of pressure generated during normal discharge of Li/SOCI 2
batteries. He also postulated that water-contaminated electrolyte can give
rise to the source of hydrogen in these batteries. Additional hydrogen
sources may include the highly porous carbon cathode. Experiments leading to
the characterization of cathode surfaces should be performed in order to
reveal the role of these surfaces as gas adsorbers.
Second, although McDonald (16) was unable to detect either Cl+ or HCI+ in
his mass spectrometric discharge-only study, we believe that this was due to
difficulties in detecting these species with indirect sampling procedures. A
number of investigators (11, 12) have reported the presence of chlorine
species in the Li/SOC12 system. Our results outlined above clearly show that
HCI is formed during both discharge and reversal in this system.
Third, we observe that the ratio of the HC135+ concentration to the
HC137+ concentration corresponds within experimental errors to the isotopic
abundance ratio of C135 to C137 .
Fourth, the increase in HCI concentration is larger (5.1-5.2 fold) during
reversal than the concentration rise (3.2-3.8 fold) for Cl+ species. This
last observation indicates that during reversal, hydrogen-chlorine reactions
leading to the formation of HCl are more favorable than during normal
discharge of the anode-limited Li/SOCl2 cell.
* • 123
6j ----

iL100- MASS=35 (MASS 83= 100)
I-8
D.- . 4'REVERSAL._ OFF'&4
so--
'I.
-
Li1 2 24 3 48 67
TIME(HRS)
Figure 86. Mass 35 (C.35 ) vs. Time (Hrs.)
S
124

0,00MiASS=36 (MAiSS 83=100)
~JREVERSAL OFF--40--
w
30-
:'2 24 36 4'08 72TIME (HRS:
Figure 87. Mass 36 (HC1l ) vs. Time (Hrs)
125

MASS=37 (MASS 83=i00)
+-REVERSAL OFF+'40-
w30-II
W 20,
I-'
12 36 48 60 72T IME(HRS)
Figure 88. Mass 37 (Cl 37 ) vs. Time (Hrs.)
126
L

MASS=38 (MASS 83=i88288-
+ REVERSAI OFF+i-o-i6
z%
I-
0,.
0 "12' 214' 36 4 '15b 74TIME (HRS)
Figure 89. Mass 38 (HC137) vs. Time (Hrs.)
127

Prepared for Naval Surface Weapons Center Materials LaboratorySilver Springs, Maryland Gould Research CenterContract N60921-81-C-0363 January 1983
4.4.2 S02, SO&
Data for the relative intensities of masses 64 and 48 are contained in
Table 3 and plots depicting this data are shown in Figure 90 and 91
respectively. Unlike Cl+ and HCl+ the intensities of masses 64 (SO+2 ) and 48
(SO+ ) begin to increase early in the discharge stage and continue to rise at a
faster rate in the reversal mode. The S0+2 intensity achieves the highest
level of any species during reversal. Our data indicate that the maximum
intensity of SO2+ occurs at t equal to 50 which is approximately the time at
which both Cl+ and HCl+ reach their maxima. This is approximately 29 hours
after the onset of the voltage reversal in the anode-limited Li/SOCI2 cell.
Examination of the tabulated data for S02+ and for SO+ yields interesting
trends. If the data for these masses are plotted on the same figure and on
the same intensity scale, Figure 92 results. This figure clearly shows that
the SO+ intensity-time profile correlates well with the SO2+ intensity-time
profile. The most interesting feature of this plot is that the S02+ rate ofincrease is larger than the corresponding rate for the SO+ fragment intensity.
To illustrate this point we plot the difference in relative intensities
of So2+ and SO+ . Let IS02 denote the intensity of S02+ and ISO denote the So+
intensity. A plot of (Is02-Iso) versus time is shown in Figure 93.
Inspection of this figure shows that the difference in concentration between
So2 and SO+ fragments increases rapidly after the onset of reversal reaches a
maximum and then levels off. Another representation is shown in Figure 94
where the ratio ISO/ISo2 is plotted versus time. It is interesting to note
that this ratio for pure SO2 is approximately 0.5. Thus it is seen from
Figures 92-94 that the SO+ intensity in the discharge mode is higher than that
accounted for by S02 fragmentation alone. Upon reversal the S0+/S02+ ratio
decreases and approaches its limiting value predicted by 302 fragmentation
alone.
128

Prepared for Naval Surface Weapons Center Materials LaboratorySilver Springs, Maryland Gould Research CenterContract N60921-81-C-0363 January 1983
It is clear from the foregoing analysis that during discharge SO+
intensity results from at least two major contributions. The first is from
fragmentations of the SO2 present in the system, and a second arises from
fragmentation of the SOC12 . However, as the cell is brought into reversal,
the S02 concentration increases and SO2 fragmentation becomes the major source
of So+ production in the ion source. It is also worth noting that the average
concentration of SO2 on or after t=26 in the reversal mode is 3.4 times that
before t=26.
In summary, our data suggest that mass 48 ions are produced b"
fragmentation in the electron impact ionization event. There is no strong
evidence to postulate that either SO or SO* travels from the battery through
the sampling system and into the ion source. McDonald's data (16) regarding
the S02+, SO+ pair is puzzling. Although his study spanned only the discharge
stage of anode-limited Li/SOCI 2 cells, his findings are contradicted by our
data. We have clearly shown that SO+ fragments arise from more than one
source, namely SO2 and SOC12, during the discharge mode. McDonald suggests
however that no SO+ was detected in his mass spectrometric study. Although SO
species in battery electrolytes cannot be detected mass spectrometrically, the
role of SO as an intermediate is discussed by a number of investigators
including Schlaikjer et al. (10), Bowden and Dey (21) and Salmon and Ramsav
(22).
The foregoing analysis of the data obtained here shows that SO+ is a
fragment formed in the ionization of SO2 (g) and SOCl2 (g) during discharge
and to a much greater extent from SO2 during' reversal of the anode-limited
Li/SOC12 cell.
129
* ~ ~ ,&~*'.
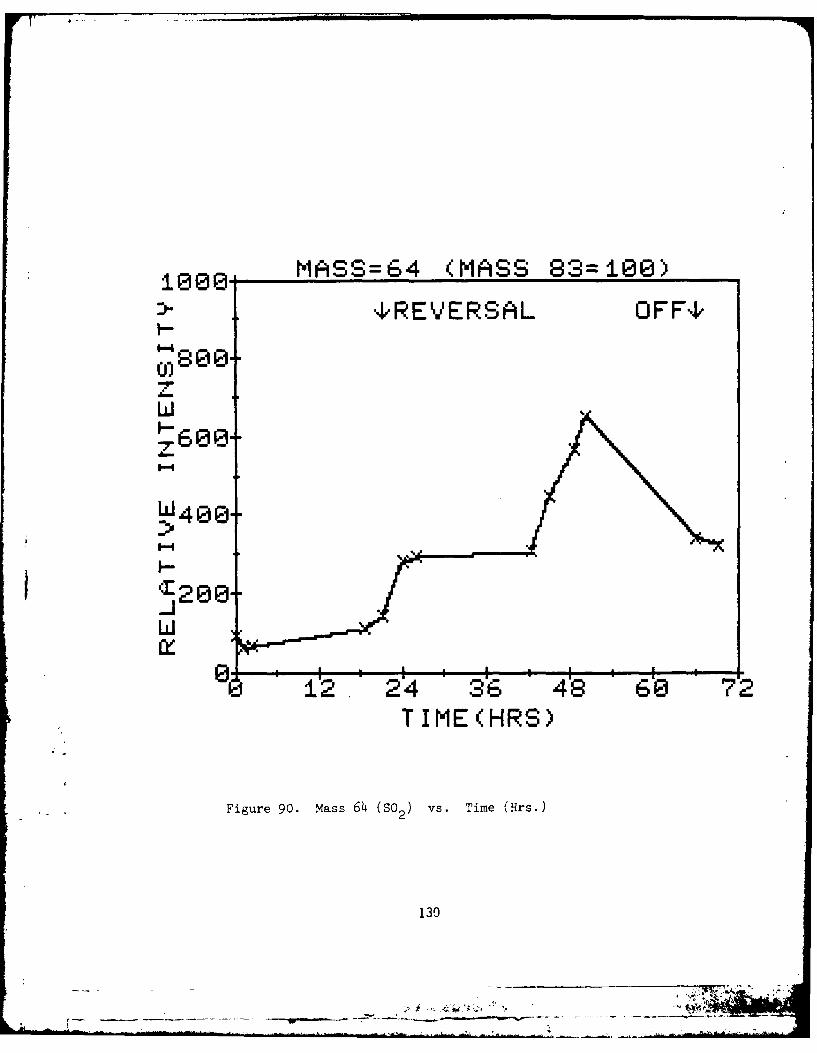
1~000 MASS=64 (MASS 83=180)
+REVERSAL OFF+
0)8003zw
60--
W400--
S--4
1 214 3 ' '6 '4's '6' 72TIME(HRS)
Figure 90. Mass 64 (So2) vs. Time (Hrs.)
130
, 7V

MASS=48 (MASS 83=100)400
> REVERSAL OFF4-I-
(p320'zw
~240-
-..
ILI
i' 24 36 418 60 72TIME (HRS)
Figure 91. Mass 48 (So+) vs. Time (Hrs.)
131

MASS=48,64 (MASS 83=100)
4,REVERSAL OF FI,800-
w6M=64
JJ00 4M=48
0..
12 24 36 4 7T IME (HRS)
Figure 92. Mass 48 and 64 (So+ and SO2 ) vs. Time (Hrs.)
J
132
AINWOi . .. . .-

500-M=64 -M=48 (MASS 83=100)
+~REVERSAL 0FF4,
;400-
w300-
z-
81'2 24 3*6 4'8 6'0 72TIME (HRS)
*Figure 93. Mass 64 (So 2 Mass 48 (Set vs. Time (Hr's.)
133
AW

MASS=48 / MASS=64
+REVERSPIL OFF.+
I-
Of)
.6 O
I- 4 --
H
-1 .2
0! 0 I I I I I I
12 24 36 48 60 72TIME(HRS)
Figure 94. Mass 48 (SO)/ Mass 64 (so2) vs. Time (Hrs.)
134

Prepared for Naval Surface Weapons Center Materials Laboratory
Silver Springs, Maryland Gould Research CenterContract N60921-81-C-0363 January 1983
4.4.3 CS2 , $20
Mass spectrometric data obtained for nominal masses 76, 78, 80 and 82,
and accurate mass measurements for masses 76 and 80 indicate the presence of
carbon disulfide and disulfur monoxide in the anode-limited Li/SOCI2 cell
tested. Numerical intensity versus time data for these masses are listed in
Table 3. Plots for mass pairs 76, 78 and 80, 82 are shown in Figure 95 and
Figure 96 respectively. From these graphs it can be seen that the
concentrations of both CS2 and S20 relative to the SOC12 concentration show
little variation with time. Since the abundance of S3 4 is 4.22%, we expect
that the ratio of the peak intensity of mass 78 (CS2 34+) to that of mass 76
(CS23 2+) to be close to 8.88%. (See the attached appendix for the method of
calculations.) The same holds true for the ratio of peak intensity of mass 82
(S234+0+) to that of mass 80 (S232 0+). The average intensity of mass 78 is
calculated from the data in Table 3 to be 1.21% and that for mass 76 to be
14.29% of nominal mass 83. Thus the ratio of mass 78 intensity expressed in
percent of that of mass 76 is 8.5 + 0.8%. In addition our accurate mass
measurement for nominal mass 76 yielded the mass 75.94528 + 20 ppm. With the
atomic weights of C12 and S3 2 given by 12.00000 and 31.97207 respectively, thetheoretical exact mass for CS 232 is 75.94414. This indicates that within the
experimental errors nominal mass 76 detected in the anode-limited Li/SOCl 2
battery arises from CS2 32+.
Analogous treatments are carried out for masses 80 and 82. The average
intensity of mass 82 is calculated from the data presented in Table 3 to be
1.97% and the average intensity of mass 80 is similarily calculated to be
21.99%. Thus the ratio of mass 82 intensity to that of mass 80 equals 8.96 +
0.9%. Our accurate mass measurement for nominal mass 80 yielded the mass
79.94057 + 20 ppm. With the atomic weight reported for 016 of 15.99491, the
exact mass of S2 3201 6 + is 79.93905. These results indicate that within the
experimental errors the nominal mass 80 arises from S20.
In a mass spectrometric study (23) carried out by Meschi and Myers the
135
~ ~ |

Prepared for Naval Surface Weapons Center Materials Laboratory
Silver Springs, Maryland Gould Research Center
Contract N60921-81-C-0363 January 1983
authors identified both S20 and CS2 as products of a discharge tube reaction
between elemental sulfur and sulfur dioxide. Thermal decomposition of thionyl
chloride was shown to yield S20 as a product. It is worth noting that
altnough gaseous sulfur is not detected in our present mass spectrometric
study, elemental sulfur was reported to be formed in the condensed phase of
the Li/SOC12 system (10). Since our data clearly show that S2 0 is formed in
this battery system, we conclude that the conditions for $20 formation in the
Li/SOCl2 battery are favorable.
It is perhaps worth noting that the intensity ratio CS 232+/2 320+ from
the Meschi and Myers data is 0.73 whereas our data yield 0.65 + 0.07 for this
same ratio. It is also interesting to note that both nominal masses 76 and 80
(see Table 4 and Figure 121) appear in the spectrum of pure thionyl
chloride. The ratio of intensities of mass 76 to that of mass 80 is 0.85 +
0.09. Although accurate mass measurements for these two nominal masses were
not obtained in the pure SOC12 spectrum the data suggest that some S20 and CS2
may be present in "pure" samples of thionyl chloride. This question of purity
should be investigated more thoroughly.
136

* -REVERSAIL OFF+1
~24-
wI-zi18 M7
W M= 78
00 12 24 :36 48 6'0 7*T IME (HRS)
Figure 95. Mass 76 and 78 (Cs2) vs. Time (Hrs.)
137

rMfSSJ=-OOJ. 2 (MAiSS 83-100)
V.1REVERSAiL OFF,-'32-
z:
w24> M=80z 4
W .: M=82
1 22 :3' 4: 60 72T IME (HRS)
Figure 96. Mass 80 and 82 (S 0) vs. Time 1(Hrs.)
138
tMap_

Prepared for Naval Surface Weapons Center Materials LaboratorySilver Springs, Maryland Gould Research Center AContract N60921-81-C-0363 January 1983
4.4.4 SOC12, SOCI +
The intensity data for the in-situ experiment were normalized to the
intensity of mass 83 (SOC135+). The data for SOC12+ and SOC137+ are listed in
Table 3, and intensity versus time plots for SOC12+ (118, 120, 122) and
SOC1 37+ (85) are shown in Figures 97-100, respectively. Figure 101
illustrates the parent peaks of SOC 2 at masses 118, 120 and 122. Now, since
SOC1 3 5 + was chosen in this present study as a reference peak, and since it
(SOC135 ) arises from SOC12 (see pure thionyl chloride spectrum in Figure 121)
constant concentrations of both SOC12+ and SOC137+ will be expected. We
realize that this normalization assumes constant SOC1 2 concentration
throughout the in-situ experiment. However, the data obtained for SOC12 and
for SOC1 37+ have been used to calibrate the uncertainty bounds in the
intensity data. Since no information is available from this study on the
change of SOC1 2 concentration with time further experimental modifications are
needed in order to normalize subsequent data to a known pressure of an inert
species.
With isotopic abundances for C135 and C137 of 75.53% and 24.47%
respectively and for S32 and S3 4 of 95.00% and 4.22% the theoretical SOC1 2
intensities for masses 120 and 122 relative to mass 118 are 0.692 and 0.135respectively (see Appendix for method of calculation).
The experimental results derived from the data in Table 3 yield SOC1 2
intensities for masses 120 and 122 relative to mass 118 of 0.731 + 0.08 and
0.135 + 0.03. These results are consistent with their theoretical
counterparts within the experimental errors.
139
,U- - - - ,.-..,: , ."- ,

+REVERSAFL OFF4-
o'20.If I
'140
Ai La

25 MASS= 120 (MA~SS 83=100)
+~REVERSAiL OFF+-
20-zV
w
I-
L-
1'2 '24 3'6 4'8 6'0 72TIME (HRS)
Figure 98. Mass 120 (SOCJ. 2 vs. Time (Hrs.)
141
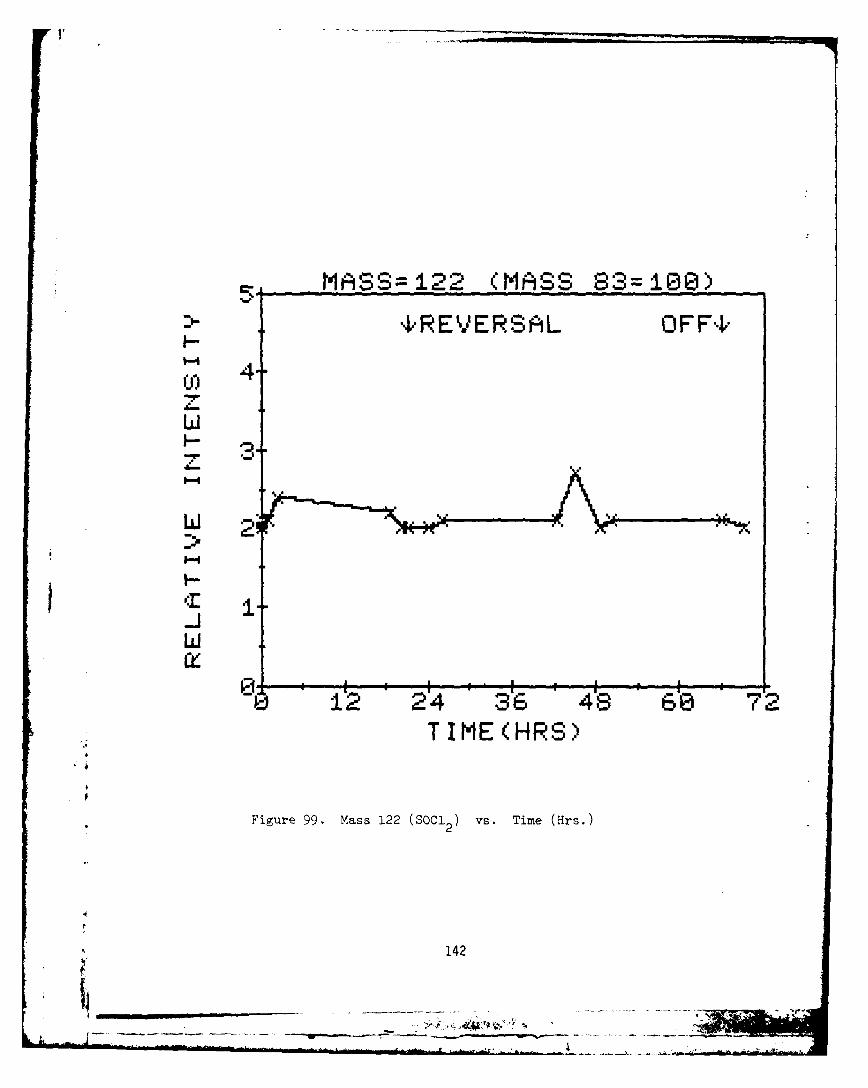
MA~SS=i22 (MAl~SS 83=100e)
-~ +REVERSAIL OFF+
4-
2'i
~~142

50- MASS=85 (MASS 83=100)
'40
-7-
20-
'143

25MfiSS= 118, 120,122 (MA~SS 83=100)
4,,REVERSAiL 0OF F 4,
m20:.
w
'144

Prepared for Naval Surface Weapons Center Materials LaboratorySilver Springs, Maryland Gould Research CenterContract N60921-81-C-0363 January 1983
4.4.5 SC12, SC1+
The data for the mass triplet 102, 104, 106 are contained in Table 3 and
the intensity versus time data are plotted as shown in Figures 102-105. The
most interesting feature about this mass triplet is observed in Figure 105.
This figure clearly shows that masses 102, 104 and 106 appear only during the
reversal mode. The exact time at which these masses appear in the spectrum
cannot be determined from our present data. However, an induction period in
the reversal mode of approximately 5 hours precedes the formation and
subsequent appearance of these masses. This induction period is found to
coincide ith the induction periods for Cl+, H-l+, discussed earlier in
section 4.4.'. The maximum intensity of masses 102, 104 and 106 is reached at
approximately t=45, which is about 5 hours earlier than the time at which Cl+ ,
HCl+, SO+ and S 2 reach their maxima during the reversal regime. Beyond t=45
the intensities of these masses gradually decline and then remain at a
significant level at the conclusion of our experiment at t=69.25.
The intensities of masses 104 and 106 relative to the intensity of mass102 are calculated from our data to be 0.728 + 0.08 and 0.152 +_ 0.02,
respectively. Comparing these results with the theoretical isotopic
abundances for the intensities of mass 102, 104 and 106 for pure SC12 gives
the corresponding values of 0.692 and 0.135. Thus our data show that masses
102, 104 and 106 arise from SC12 formed during the reversal mode, beyond t=26.
Next we wish to investigate the species giving rise to masses 67 and
69. Intensity measurements for these masses are contained in Table 3 andplotted in Figure 106 and 107, respectively. As seen from the fragmentation
pattern of SC12 (Table 4), mass 67 (SC135+) is the most intense fragment and
the intensity of mass 69 (SC137+) is 0.364 of that of mass 67. Thus both 67
and 69 fragments can arise from SC12 fragmentation. However since no SC12 isdetected at and prior to t=26, then the intensities measured for masses 67 and
69 at and prior to t=26 do not arise from SC1 2 fragments. This result alsoimplies that species other than SC2 give rise to masses 67 and 69 in the
145
t

V .... . ... ___ . . .. _
Prepared for Naval Surface Weapons Center Material3 LaboratorySilver Springs, Maryland Gould Research CenterContract N60921-81-C-0363 January 1983
anode-limited Li/SOCl2 cell. Although S2C12 (S2C12, mass triplet 134, 136,
138, will be discussed in Section 4.4.6) can give rise to fragments of masses
67 (SC137+), 99 (S2C135+) and 101 (S2 .C137+), we observe no intensities of any
of the masses 134, 136, 138, 99 and 101 at and prior to t=26. Thus as for the
case of SC12 , $2C12 does not give rise to fragments of masses 67 and 69 at and
prior to t=26 for the anode-limited Li/SOC12 battery tested in the present
study. It is important to note that chlorine dioxide (CIO2, mass 67, 69) can
give rise to these masses. Theoretical isotopic abundance considerations
yield mass 69/mass 67 ratio of 24.47/75.53 or 0.324. Our data for masses 67
and 69 at and prior to t=26 show that the average mass 69/mass 67 intensity
ratio is 0.39 + 0.04. This result is seen to neither confirm nor rule out
ClO2 as species giving rise to masses 67 and 69. However since chlorine
dioxide is known to be an explosive species (24), and since a study (11) by
Salmon et al. indicates that both C120 and C10 2 are possible products in the
anode-limited battery we suggest a careful study to positively identify the
species giving rise to the appearance of masses 67 and 69 during both
discharge and reversal of this system. It is also noteworthy that the absence
of both parent (86, 88, 90) peaks and fragments (51, 53) in the mass spectrum
strongly suggests that C120 is not present in measurable concentration in this
system.
146

MASS= 102 (MASS 83= 100)
. REVERSAL, OFFe1--
14-
-
W A
1'2 36, 4' 6'0 72T IME (HRS)
Figure 102. Mass 102 (SCI 2 ) vs. Time (Hrs.)
147
147
2l

10, MASS= 104 (MASS 83=100)
-REVERSAL OFF+-
I- '
z IX"'w
I 4-
2
lo i: LA. %W% 2 % ' '12 6" 48 60 72TIME(HRS)
Figure 103. Mass 104 (SCi 2) vs. Time (Hrs.)
148
_L________ IN '

MASS=106 (MASS 83=108)2-
, REVERSAL OFF,I- .
i.2
2'2 316 '48 6'TIME(HRS)
-I-
Figure 104. Mass 106 (SCI ) vs. Time (Hrs.)
149
4

B0 ASS=102, 104, ±06 (MAiSS 83=100)
4eREVERSAIL, OFF4-8--
Q) 0 M= 102
4--
2--
01'2 3'6 48 2
T IME (HRS)
Figure 105. Mass 102, 104 and lo6 (sci 2 vs. Time (Hrs.)
150
. ~Li~~Z2%.-i----- -

MASS=67 (MASS 83=100)58-
SIREVERSAL OFF+J
~40-
z ,w~30-
T-1w2,
12 24 36 48 60 72TIME(HRS)
Figure 106. Mass 67 vs. Time (Hrs.)
151
AL T . . . .. . . .
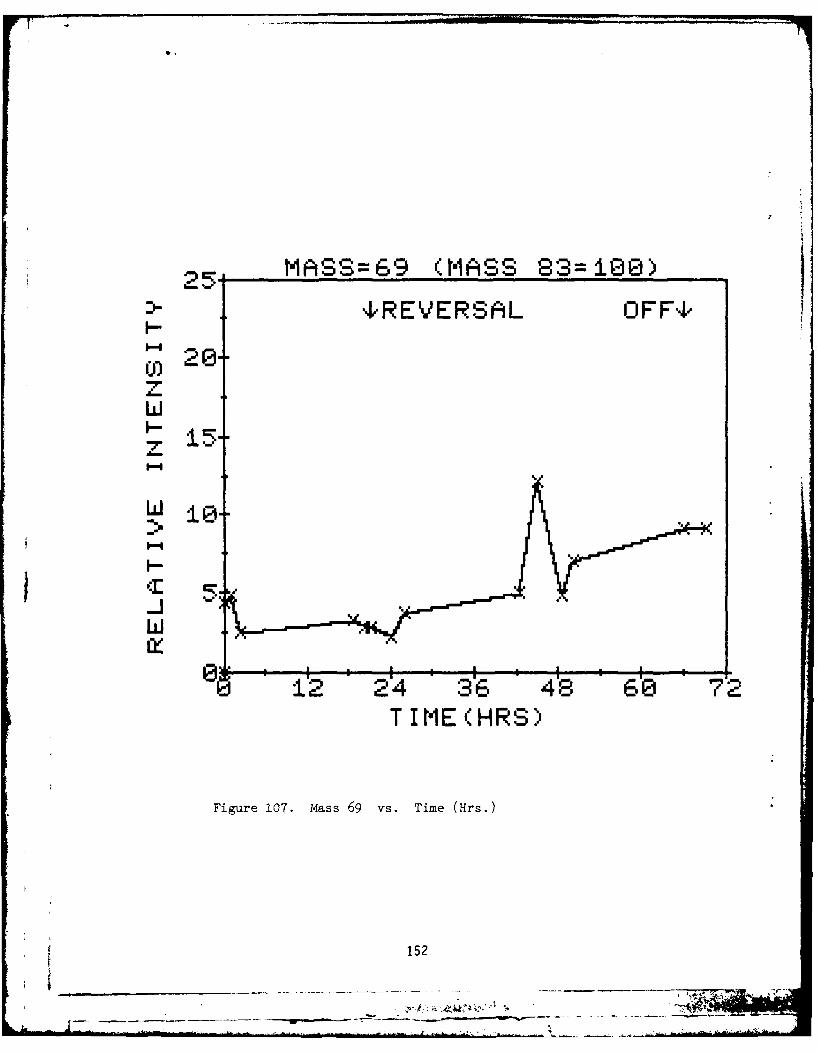
MAtSS= 69 (MAiSS 83= 100))
4REVERSAiL OFF4'20-
w 202
wA

-l
Prepared for Naval Surface Weapons Center Materials LaboratorySilver Springs, Maryland Gould Research CenterContract N60921-81-C-0363 January 1983
4.4.6 Mass 134 Species (Mainly S02C12 )
Intensity measurements for masses 134, 136 and 138 are presented in Table
3 and are plotted in Figure 108, 109, and 110, respectively. Figure 111 shows
the combined data for these three masses plotted simultaneously. Examination
of these figures reveals that these masses are detected during reversal
only. The time at which this triplet appears coincides identically with that
time at which SCl2 first appears, namely t=42.33. However, unlike SCl2 the
maximum concentration of the species giving rise to the intensities at masses
134, 136 and 138 occurs at t:42.33 while the maximum for SC12 was seen to
occur at t=45. It is also seen from the figures cited above that the former
maximum (for 134, 136 and 138) is followed by a slow decline to a stable level
at times exceeding t=50.
Identification of the species giving rise to the intensities measured at
134, 136 and 138 will be considered next. The intensity ratios 136/134 and
138/134 indicate that the molecule from which these species arise contains two
chlorines. Two likely compounds of molecular weight corresponding to triplet
134, 136 and 138 and each having two chlorines will be discussed. These are
S02CI2 and S2C12. A number of investigations conducted on the Li/SOC12
battery system indicate that these species may be products of the reactions
taking place in these batteries. Abraham and Mank (12) identified S02C12
among other species in an anode-limited Li/SOC12 cell, while Schlaikjer et al.
(10) suggested that S2C12 may be formed according to the reaction:
3S + 2SOC1 2 -- SO2 + 2S2 C12
Since both S02C12 and S2C12 are expected to yield the fragments 99 (S02C135
or S2C135+) and 101 (SO2C1
37+ or S2C,37+) in their mass spectra, examination
of these peaks will be conducted next. The data for masses 99 and 101 are
plotted in Figures 112 and 113, respectively while Figure 114 shows the
combined data for these two masses. The mass spectrum for a pure sample of
S02C12 is shown in Figure 123 and the numerical intensities of masses 134, 136
153
N A, ;.: - ;, . ..

Prepared for Naval Surface Weapons Center Materials LaboratorySilver Springs, Maryland Gould Research Center
Contract N60921-81-C-0363 January 1983
and 138 relative to mass 99 are 0.194, 0.144 and 0.033, respectively. Now,
considering the data obtained from the in-situ experiment for masses 99, 134,
136 and 138 (Table 3), we find that the average intensities of the latter
three masses relative to the intensity of mass 99 are 0.748 + 0.07, 0.466 +
0.05 aid 0.129 + 0.01, respectively. These results are not consistent with
the results obtained for pure S02 C19 . Although no mass spectrum is available
for pure S2 C12 , a theoretical isotopic abundance calculation is possible for
$2CI2 (see Appendix for method of calculation). The theoretical intensity
distribution for masses 134, 136 and 138 are given by 0.515, 0.379 and 0.085,
respectively for S2C12 and 0.542, 0.375 and 0.073, respectively for SO2 CI2 .
We now wish to compare our data for masses 134, 136 and 138 with the
theoretical distributions for S2 C12 and S02 CI2 . The average intensities for
these masses calculated from the in-situ data are 0.928, 0.578 and 0.160 for
134, 136 and 138, respectively. Taking mass 134 as a reference we construct
Table 5 in which the theoretical ratios are compared to the experimental mass
ratios. From this table it can be seen that the in-situ data is consistent
with the mass 136/134 ratio for S02C12 and with the mass 138/134 ratio for
S2 C12. Thus no clear case exists for either S02 C12 or S2C12. It may be
pointed out that a mixture of these two species might lead to such results.
In any case we feel that accurate mass measurements can easily resolve this
dilemma. (Note: the infrared evidence, however, points strongly to formation
o S02 C12 as the major component of that peak.)
154

Prepared for Naval Surface Weapons Center Materials Laboratory
Silver Springs, Maryland Gould Research Center
Contract N60921-81-C-0363 January 1983
Table 5
Calculated Isotopic Mass Ratios Compared
to Experimental Mass Ratios
Calculated Mass Ratios Experimental Mass Ratios
Molecule 136/134 138/134 136/134 138/134
S02C12 0.692 0.135 - -
S2C12 0.737 0.164
Mass 134 - - 0.622+0.06 0.174+.02
155
JI

2 MASS=134 (MAiSS 83=i00)4,,REVERSAL 0OF FI
~~156

2' MASS=±36 (MASS 83=100)2-I-IVRSL0F ,,
fxJ'
z1.
w
0:.:316 460 72TIME (HRS)
Figure 109. Mass 136 vs. Time (Hrs.)
157

5 MASS=138 (MAiSS 83=100)
+.REVERSAL OFF+JI-
-- N2.
TIME (HRS)
II
Figure 110. Mass 138 vs. Time (Hrs.)
158
!-

NASS1343'1363138 (MASS 83=100)%I-REVER5FiL OF F4,
1.--
~1.2-
~411
W M 1:38
8A f22 3"6-484' 60 7 2TIME(HRS)
Figure 111. Mass 134, 136 ard 138 vs. Time (Hrs.)
159

2.5 MASS=99 (MASS 83=100)+'REVERSAL OFF+
2--
"I-2'wr 4 0 7
2IEHS
Fiue12zas9 s ie(r.
16

MASS=i81 (MASS 83=180)
+REVERSAL OFF+I-
~~161
I-4
I- 4
0. 12 , 36 48 6 72
T IME (HRS)
Figure 13. Mass 01 vs. Time (Hrs.)
161

2~5 MAS=99.±01 (MASS 83=100)4-REVERSAL OFF+4
2--
M99
M I
8." :12 - 4 3-6 48 60 7TIME (HRS:
Figure 114g. Mass 99 and 101 vs. Time (Hrs)
162

Prepared for Naval Surface Weapons Center Materials LaboratorySilver Springs, Maryland Gould Research CenterContract N60921-81-C-0363 January 1983
4.4.7 CF2
The accurate mass of nominal mass 50 appearing in the in-situ experiment
was found to be 49.99597 + 30 ppm. It is interesting to note that the
calculated mass for CF2+ is 49.99680. The agreement between the theoretical
value and the measured value provides strong evidence that CF2+ is the correct
identity of this mass 50 fragment.
The existence of fluorine-containing fragments is a point worth noting
because the only cell component which contains fluorine is the Teflon binder
used in the cathode construction. Thus the existence of CF2+ implies that the
Teflon-impregnated porous carbon electrode is undergoing electrochemical
attack during both discharge and reversal (See Figure 125).
We suggest that further work needs to be done in order to characterize
the cathode according to:
1. The effect of preparation procedure on the production of CF2+ and
other fluorinated and/or chlorinated species (e.g., HCl).
2. The effect of preparation procedure on the surface properties of the
cathode, both before and after discharge and reversal.
163
L

Prepared for Naval Surface Weapons Center Materials LaboratorySilver Springs, Maryland Gould Research CenterContract N60921-81-C-0363 January 1983
4.4.8 Higher Molecular Weight Species
In the late stages of reversal, the formation of ions with masses 146,
148, 150, 160, 161, 163, 165, 192, 267 and 269 was observed. Further work
must be performed in order to identify the precursors of these species.
4.4.9 Mass Spectra and Appearance Potentials for the Pure Coipoumds
The mass spectra measured at 80 ev for the compounds SOC12, SC12 and
S02 C12 are presented in Figure 121, 122 and 123 respectively. Numerical
intensity data for these spectra are presented in Table 4. A tentative mass
spectrum for a sample of S2C12 whose purity is questionable is presented in
Figure 124.
The appearance potentials for the compounds S02 , SOC12 , SC12 , S02 C12 and
a slightly impure sample of $2 C12 are presented in Figures 115, 116, 117, 118
and 119, respectively. The energy scale was calibrated using argon as a
standard (see Figure 120). The measured appearance potentials for S02 , SOC12
and $02 C12 were found to be 12.4 + 0.3 ev, 10.8 + 0.3 ev and 11.9 + 0.5 ev,
respectively.
The data for S2 C12 show considerable experimental uncertainty. An
appearance potential for $2 C12 is estimated to be 10.4 + 0.6 ev. The data for
SC12 is slightly complicated because of the existence of two linear regions in
the appearance potential data. Since the other species containing both sulfur
and chlorine have appearance potentials in the range of 10.8 to 11.9 ev, the
value of 10.9 + 0.4 ev is chosen for the first linear region of the SC 2 data.
_164

100 APPEARANCE POTENTIAL
I-o
88.
U6 0 -
-7-
260-
z +
cr 2 2+165
.. 65_____L* J ,

100-APPEAiRANCE POTENT IAL
SOCL 2
60-
40-
20-
-:% I:~ -ELCTO ENRY(V
Fiue16 eaieItest f-~ s onzn lcrnEeg
16

APPEARANCE POTENT IAL
SCL 2I-80
wI-- 6 .
I--
L 2 0 1
ELCRO NEG+(V
Oi
T1 1311571 '19 .. 21ELECTRON ENERGY (EV)
Figure 117. Relative Intensity of SCl2 vs. Ionizing Electron Energy
167
----------

APPEARANCE POTENT I AL
SO 2 CL2
-80-z
z6 0 -
._1
20-
+0 " 13 1. 1 ±9 21
ELECTRON ENERGY (EV)
Figure 118. Relative Intensity of S021 2 vs. Ionizing Electron Energy
t 168
... .. . .. ..- -1'."-- - . .... - -,-.

APPEARANCE POTENT IAL
. SCL + +
-0
ZwZ 608.
I- +/ +
1f: 1'3 l 5 1 f9 "21ELECTRON ENERGY (EV)
Figre 19.Relative Intensity of S2CI2 vs. Ionizing Electron Energy
I-2 +
169
II
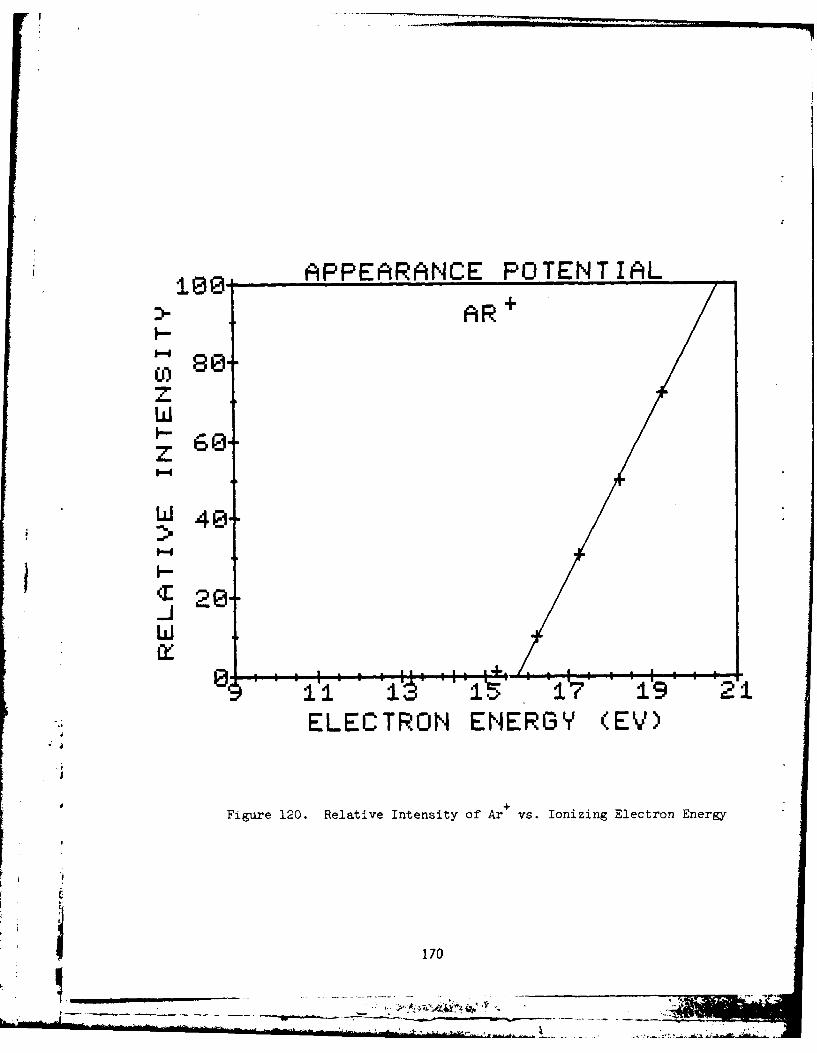
1 A88 PPEARANCE POTENT IA LAR +
!--S813,
0-z 6 1
w 40,
_ 21
ELECTRON ENERGY (EV)
Figure 120. Relative Intensity of Ar vs. Ionizing Electron Energyt170

SOCL2
10080-
U) 6z M= 1i18
0- 4' 6. 'o ' o! 4
Figure 121. Mass Spectrum of SOCI2 at 80 eV Electron Energy
171
40 w~l I

SCL 210-
80.. M= 102,4
60.
zW 40-z
,~~~ ~ t1.1,,, 1., fil I I., ..,l L . ,
Figure 122. Mass Spectrum of SCI at 80 eV Electron Energy2
-- I
172
___. ."_. .____" --- , ~ *~"'4 '

S02 CL2
180I-
I-I- M=134,
W40-
6008
MASS
Figure 123. Mass Spectrum of SO2 C 2 at 80 eV Electron Energy
173

S2CL 2
i00-
.80..I 6-7_ M= 134-
40I-
1 +1 .L .it a 111- 1 oio1041 18
410610 8 0 1 0 1; 0 140
MASS
Figure 12h. Mass Spectrum of S2CI 2 at 80 eV Ionizing Electron Energy
4
174
.... . . . . .. . ... ... TI , .. .. . ... ..... . . 1 .. ... . 0, ... ...... ..... ..

MAtSS='50 (MAS8S 83=i00)
+4REVERSA~L OFF+J40-
~30-
~20-
12 24 36 48 6 7TIME(HRS)
Figure 125. Relative Intensity of Mass 50 (CF)2 vs. Time (Hrs.)
175

Prepared for Naval Surface Weapons Center Materials LaboratorySilver Springs, Maryland Gould Research CenterContract N60921-81-C-0363 January 1983
4.5 Conclusions
In this study mass spectrometric techniques have been used to investigate
the gases present in and evolved from an anode-limited lithium thionyl
chloride cell during both discharge and reversal. The species HCI, CS2, S02,
S 20, SC12 and SOCI2 were identified as the components present in the vapor
over the cell electrolyte. The formation of hydrogen chloride indicates that
hydrogen source(s) must exist among the components comprising the cell
electrolytes, electrodes and/or the physical structure of the battery.
An induction period of approximately five hours after the onset of
reversal is observed beyond which the concentrations of chlorine fragments,
HCI and SO 2 increase substantially. The formation of SC12 and of species of
mass 1:4 is detected only after a similar induction period after the onset of
reversal. The identity of the species appearing at mass 134 is postulated to
be either S0 2 C12 or S2 C12 ; the infrared evidence, however, strongly suggests
that it is mainly S02C12.
HCl is observed to achieve the highest concentration of any species
during discharge while SO2 becomes the most abundant vapor species observed
during reversal. The concentration of CS2 and S20 were observed to remain
essentially constant with time throughout the experiment.
Frigments identified as CF2+ were observed in a measurable concentration
in t' system. The origin of these fragments is postulated to be the Teflon
* bind used in the construction of the porous carbon cathode. Other higher
- 6 molecular weight species give rise to a number of observed fragments detected
after lengthy reversal times.
j __ _ 176

Prepared for Naval Surface Weapons Center Materials LaboratorySilver Springs, Maryland Gould Research CenterContract N60921-81-C-0363 January 1983
4.6 Recommendation for Future Investigations
The results obtained in this mass spectrometric investigation clearly
show that the techniques used can provide valuable insights into the chemistry
which takes place not only during normal discharge but also during voltage-
reversal. These results were obtained using the simple direct sampling system
constructed for this work with the mass spectrometers. Improvements of this
system should provide more accurate and reproducible data for further
studies. These improvements include the use of an accurate pressure measuring
device, modification of the ion sources to minimize corrosion problems, the
use of improved hardware to ensure highly reproducible sample size and the use
of a simple existing data acquisition system in order to acquire and process
the large volume of data generated in these experiments.
The experimental evidence obtained in this work clearly suggests that a
better understanding of the chemistry involved in the Li/SOCl2 battery may be
reached by conducting the following proposed experiments.
1. Accurate mass experiments will clearly resolve a number of important
questions. These include the positive identification of the following
masses:
(a) Mass 67: Presence or absence of ClO2.
(b) Mass 69: Presence or absence of CF3+.
(c) Mass 134: S2C12 or S02C12.
(d) The positive identification of higher molecular weight species
generated in the latter stages of battery reversal.
2. Electrode characterization studies. The formation of species such as HCI,
CF+ and other chlorinated and/or fluorinated compounds arising from
impurities in this battery system should be studied as a function of the
method of electrode preparation. These studies may include electrode
surface characterization. We propose simple Auger electron spectroscopy
177
I~. .

Prepared for Naval Surface Weapons Center Materials LaboratorySilver Springs, Maryland Gould Research CenterContract N60921-81-C-0363 January 1983
(AES) experiments and thermal desorption investigations in order to reveal
the amount and the identity of species adsorbed on the electrode
surfaces. Such investigations have the potential of yielding valuableinsights into the mechanism(s) of processes taking place within the cell.
3. Measurements of the total cell pressure as a function of time during
discharge and reversal. It is desirable to investigate the relationship
between the observed partial pressure fluctuations and possible total
pressure variations.
I
178
- u4

Prepared for Naval Surface Weapons Center Materials Laboratory 4
Silver Springs, Maryland Gould Research CenterContract N60921-81-C-0363 January 1983
5. EPR Spectroscopy of Lithium Thionyl Chloride Cell
During both discharge and reversal, free radicals are probably
generated. For example, a proposed reduction scheme for thionyl chloride
involves SOCI as an intermediate
SOCI2 + e : SOCI + Cl
SOCI + e SO + Cl
2 SO S02 + S
Species such as SOC1 are paramagnetic and EPR spectroscopy is an ideal
technique for detecting its presence if it accumulates in sufficient
concentration. The above reactions may be rate dependent and SOC1 may react
chemically in low rate cells before any further reduction can occur,
SOC1 = (k) (Products)
The possible deactivation of SOCI by a chemical process as a rate related
phenomenon may explain the reported effect of discharge rates on the safety of
discharged cells.
Samples of electrolyte from discharged cells and from cells driven into
either anode or cathode limited reversal were tested for free radical
formation and all give strong EPR signals with the same g value. Equally
puzzling was the fact that samples of fresh acid electrolyte gave similar
signals whereas samples of fresh neutral electrolyte (1 .4 M LiAlCI 4 ) gave no
signal at all. To resolve the question several in situ experiments were
performed.
179

Prepared for Naval Surface Weapons Center Materials LaboratorySilver Springs, Maryland Gould Research CenterContract N60921-81-C-0363 January 1983
5.1 In Situ EPR Study
The cell is described in Figure 126. It was assembled in a 3 mm ID
quartz tube filled with SOC12 /1.4 M LiAICl4 . The lithium electrode,
positioned near the bottom of the tube, consisted of a 5 mil lithium strip
pressed on nickel exmet about 2 cm long and 2 mm wide. The cathode was made
of our usual 20 mil thick carbon-Teflon formulation pressed on nickel exmet.
Insulated nickel wires through the top of the tube were spot welded to the
current collectors. The tube was capped then placed in the microwave cavity
of an E-4 EPR spectrometer (Varian). Base line measurements before passing
any current through the cell showed the presence of a strong signal traceable
to the position of the positive electrode in the microwave cavity; this signal
obviously due to the carbon did not appear to be affected by the passing of
current. The baseline signal disappeared, however, when the carbon electrode
was positioned higher up in the tube, just outside of the microwave cavity.
During normal discharge (only the negative electrode was in the cavity)
no signal was detected, even at currents as high as 2-3 mA. However, after
the onset of anode limited reversal a signal with poorly defined fine
structure centered at 3419 gaur (g=1.99) and spread over 20-30 gauss appeared
at a relatively high current ansity.
At 0.5 mA/cm2 no signal was observed after 30 minutes. At 2.0 mA/cm2 a
signal was noticeable after less than six minutes. The signal increased with
time and disappeared slowly when the current was turned off.
Due to instrumental difficulties, we were not able to duplicate these
results. In spite of this, we have analyzed the few results obtained keeping
in mind that this experiment has to be repeated using a more modern instrument
and lower temperatures.
In Figure 127 we have plotted the signal peak height as a function of
time. The intensity of the signal appears to increase linearly during
180
-7'

Prepared for Naval Surface Weapons Center Materials LaboratorySilver Springs, Maryland Gould Research CenterContract N60921-81-C-0363 January 1983
reversal then decay exponentially after the current is cutoff. We have used
the following model to analyze the signal decay:
If R. is the free radical generated then
R. k R with -d(R)•dt k (R.)-kt
leading to (R.) = (R.) ° e
and log (R.) = log (R.) -kt
where k is the deactivation constant and (R.)o is the initial radical
concentration.
Plotting the log of the intensity as a function of time yields a straight
line with a slope of -k (nee Figure 128)
DEACTIVATION CONSTANT .07 min -1
HALF-LIFE 7 min.
181
- w--- - --
k -AD-A128 382 INVESTI&ATON 0F LIHIAM-HIONY CHLORIDE BATTERYISAFET HAZARDS U) GOULD RESEA RCH CENT ER R 0L NA MEADOWSIMAERALS LAR A IA AET AL dAN83R83802UNCLASFE N6918--36 / 03

1111 1.2 III1.4 2.2_11111 11.6
1 .251 - 1111_
MICROCOPY RESOLUTION TEST CHARTa' NATIONAL BUREAU OF STANDARDS 1963-A
A A

CARBON ELECTRODE
SOCI /1.4M LiAICI4
QUARTZ TUBE 3MM IDDISTANCEBETWEENTHEELECTRODESIS VARIABLE(1 - 10cm) LITHIUM ELECTRODE
U 12693)
Figure 126 Spectro. Electrochemical Cell for
EPR Measurements
182
L AL
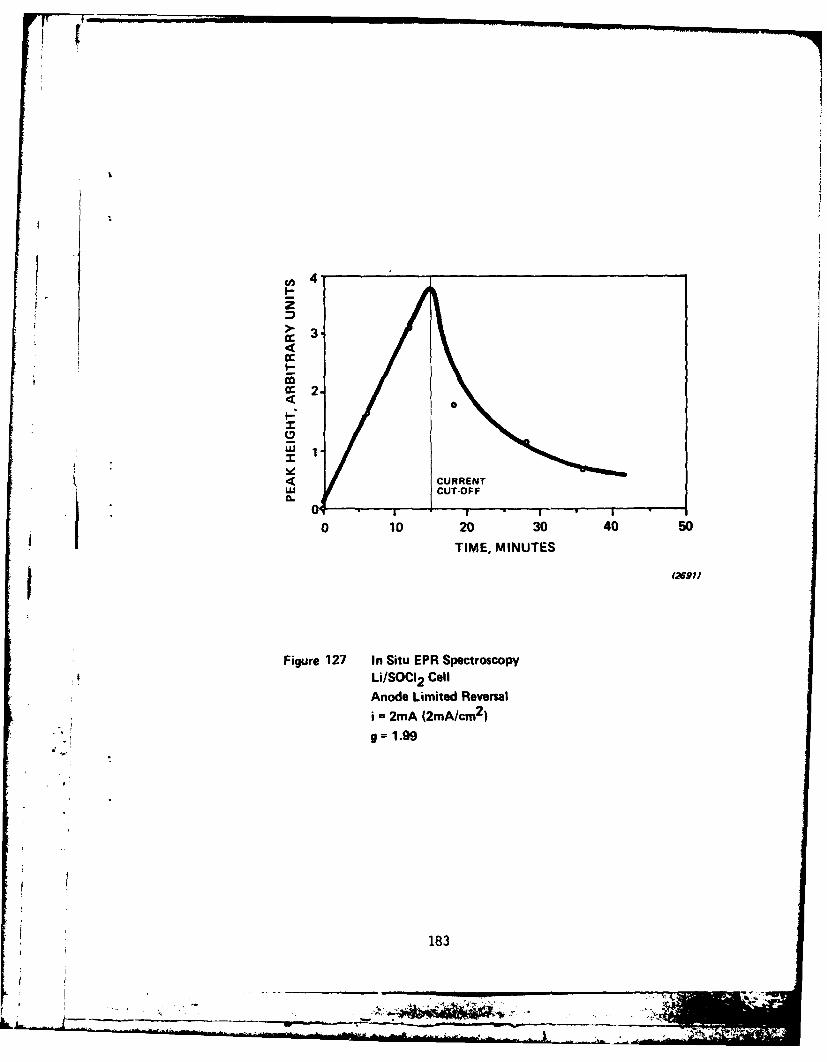
4'
I.
LiSOI CllOFAnod Limie Reer
0 10m (2030 402
TIM,1INTE
18391
Figue 12 In itu PR Sectrscop

~1.5Z DEACTIVATION CONSTANT 0.07m0 1
~ ~HALF-LIFE aE7min'1
.,0 0j
~0.0
LA.5
0 10 20 30TIME, MINUTES
t2692)
IFigure 128 Decay of Free Radical Formed duringAnode Limited Reversal
T 25'C
184

Prepared for Naval Surface Weapons Center Materials LaboratorySilver Springs, Maryland Gould Research CenterContract N60921-81-C-0363 January 1983
6. Thermal Study of a Lithium-Thionyl Chloride Cell
Microcalorimetric measurements on a small cell during anode limited
reversal might detect unusual reactions that could lead to a thermal runaway
or other safety hazard in larger cells.
$ A button type Li/SOCI 2 cell about 1 inch in diameter (Figure 129) was
introduced in the measuring chamber of a Tronac (Model 351) microcalorimeter
and allowed to reach a steady state prior to discharge. A heat flow of 380 P W
was measured amounting to a specific heat flow of 75 P W/cm2 . This translates
to a corrosion current of 20 PA/cm2 for the lithium electrode.
The cell was then discharged at a constant current of 5 mA (1 mA/cm2).
An average heat evolution of 3 mW was measured during the discharge with a
sharp increase at the end of the discharge to 5.1 mW. This higher heat flow
remained stable throughout the reversal period.
The voltage was also stable at 3.5 V during discharge and dropped
abruptly to -0.7 V then slowly to -1.3 V when reversal occurred.
The results are described in Figure 130. Nothing unusual happened during
the discharge except for the nearly doubling of the heat evolved at the end of
discharge. This increase may very well be the result of several chemical
processes occurring in the cell following oxidation of SOC12 at the anode
S2 SOC12 --) 2 SOC1 + 2e + Cl2
. SOCI + + AlClJ - SOCI + AIC 4 -
* LiCl + SOCI+AIC - - SOCl 2 + LiAICl 4
The reaction between C12 and SO2 to form S02C12 may also be a factor.
Preliminary calculations show that the amount of heat evolved in the formation
of S02C12 may be as high as 17 kcal/mole.
185
C7 t~~- TEXT. .

FEEDTHROUGH AND FILL TUBE
WELTMET
CATHODE
J ~ ~SEPARATORAND
Figure 129 Schematic Cross Section of 25mnm Diameter CellUsed for Calorimetric Study
186

6.0 4.0
HEAT EVOLVED (mW) oIm
S4.0 2.d<wj 0
00
REVERSAL CIW, g r
<2.0 0w r
CELVOLTAGE (VOLTS)
0.0 w I- 2.0
-- 20 20 60 100
TIME, HOURS
t2694)
Figure 130 Heat Evolved from a Li/SOCI2 Cell Driven into Reversal
5mA (1mA/cm2 )
187
I~

Prepared for Naval Surface Weapons Center Materials LaboratorySilver Springs, Maryland Gould Research CenterContract N60921-81-C-0363 January 1983
References
1. J. Auborn, K. W. French, S. I. Lieberman, U. K. Shan and A. Heller, J.
Electrochem Soc., 120, 1613 (1973).
2. D. I. Chua, J. 0. Crabb and S. H. Deshpande, "Proceedings of the 28thPower Souries Symposium", Atlantic City, N.J., 28 247 (1978).
3. F. Goebel, R. C. McDonald and N. Marincic "Proceedings of the 15th
Intersociety Energy Conversion Engineering Conference", Seattle, WA,
15, 2173 (1980).
4. M. Domeniconi, A. Zolla, R. Waterhouse, D. DeBiccari and G. Griffin,
Jr., "Proceedings of the 15th Intersociety Energy Conversion
Conference", Seattle, WA, 15 (1980).
5. Private communication, J. C. Hall, Altus.
6. K. M. Abraham et al, "Proceedings of the 28th Power Sources
Symposium", Atlantic City, NJ, 28, 255 (1978).
7. A. N. Dey, "Proceedings of the 28th Power Sources Symposium", Atlantic
City, NJ 28, 251 (1978).
8. Private Communication from J. C. Hall, Altus.
9. W. K. Istone and R. J. Brodd, J. Electrochem. Society, 129, 1853
(1982).
10. C. R. Schlaikjer, F. Goebel and N. Marincic, J. Electrochem. Society,
126 513 (1979).
11. D. J. Salmon et al, J. Electrochem. Society, 129, 2496 (1982).
188

Prepared for Naval Surface Weapons Center Materials LaboratorySilver Springs, Maryland Gould Research CenterContract N60921-81-C-0363 January 1983
12. K. M. Abraham and R. M. Mank, J. Electrochem. Society, 127, 2091
(1980).
13. J. C. Bailey and G. E. Blomgren "Proc. Vol. 82-2, The Electrochemical
Society, Pennington, NJ, pg. 485.
14. K. Hedberg, J. Chem Phys. 19 509 (1951).
15. G. Nickless, Inorganic Sulfur Chemistry, Elsevier, Amsterdam, 1978, p.
409.
16. R. C. McDonald, J. Electrochem. Society, 129 2453 (1982).
17. R. J. Gillespie and E. A. Robinson, Can. J. Chem 39 2171 (1961).
18. W. J. Potts, Jr., Chemical Infrared Spectroscopy, John Wiley & Sons,
New York, 1963, Vol. 1, p. 155ff.
19. S. Nabi and M. A. Khaleque, J. Chem. Soc. 3626 (1965).
20. Perfluoro kerosene mass spectral Table. PCR Research Chemical, Inc.,P.O.B. 1778, Gainesville, Fla 32602.
21. W. L. Bowden and A. N. Dey, Paper 34, presented at the Electrochemical
Society Meeting, Los Angeles, Cal. (1979).
22. D. J. Salmon and G. R. Ramsay, paper 35, Presented at the
Electrochemical Society Meeting, Los Angeles, Cal. (1979).
23. D. J. Meschi and R. J. Myers, J. Am. Chem. Soc., 18 6220 (1956).
24. W. J. Masschelein, "Chlorine Dioxide. Chemistry and Environmental
Impact of Oxychlorine Compounds," Rip G. Rice, Editor, Ann Arbor
Science, Pub. (1979).
189

Prepared for Naval Surface Weapons Center Materials LaboratorySilver Springs, Maryland Gould Research CenterContract N60921-81-C-0363 January 1983
APPENDIX
The Use of Isotope Ratios in the Mass Spectrometric Identification atf
Molecular Species
The abundance of the isotopes of many naturally occurring elements can
provide characteristic mass spectral patterns. These patterns can be of help
in determining molecular composition in certain cases.
In general consider a molecule containing n atoms of the element. Let
the fractional natural abundance of the isotopes of this element be given by
a, b, c, ... where a+bic+...=l. The multinomial expansion (a+b+c+...)n
provides a method for expressing the probability of the occurence of the
different isotope combinations. As an example consider the element
chlorine. Hence:
a = the natural fractional abundance of C135 = 0.755.b = the natural fractional abundance of C137 = 0.245 and assume that the
molecule contains two atoms of chlorine, i.e., n=2. Now the expansion becomes
(a4b)2 = (0.755)2 + 2 (0.775) (0.245) + (0.245)2 where
(0.755)2 = 0.570 fractional abundance of a molecule containing C135C135 and
2(0.775) (0.245) 0.370 = fractional abundance of a molecule containing
C135C137 and (0.245)2 = 0.060 = fractional abundance of a molecule containing
C137 C137 .
Note that the sum of all three fractions (0.570 + 0.370 + 0.060) equals 1.
We can expand this argument to a molecule containing two elements, each
of which possess a characteristic isotope distribution as follows:
assume that element M occurs m times in the molecule and has two isotopes
a and b, and assume that element N occurs n times in the molecule and has
two isotopes c and d. In this case the multinomial expansion becomes:
190
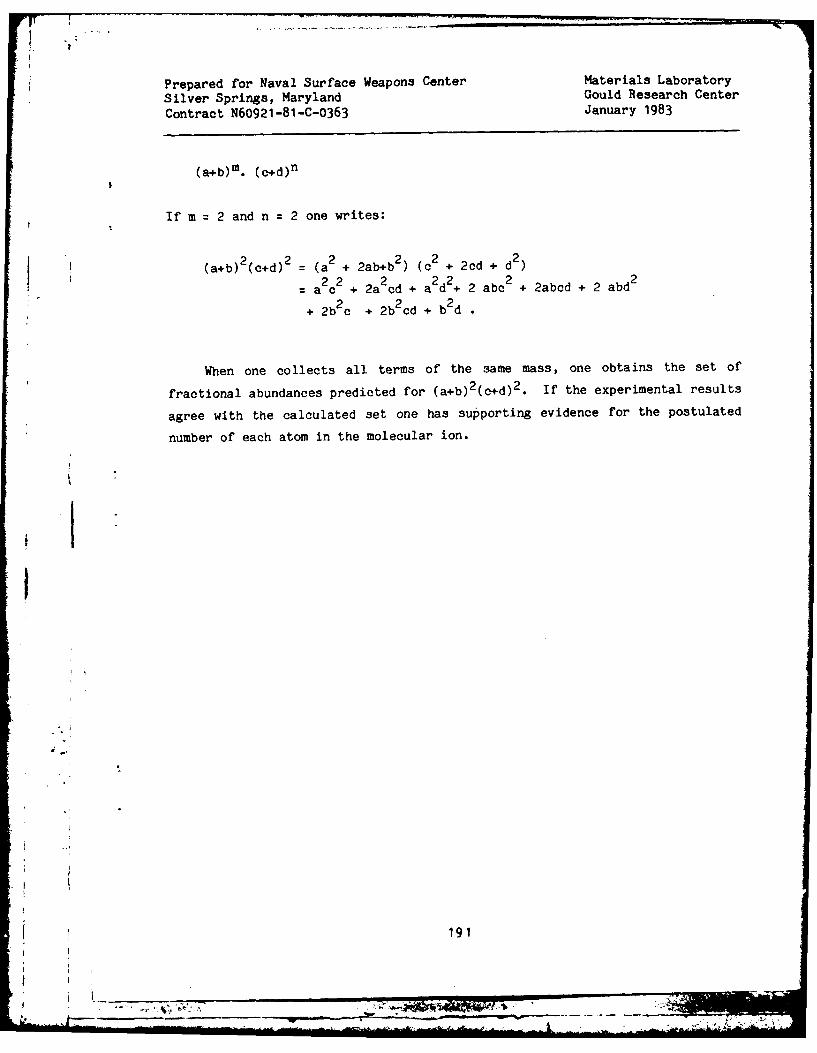
Prepared for Naval Surface Weapons Center Materials Laboratory
Silver Springs, Maryland Gould Research Center
Contract N60921-81-C-0363 January 1983
(a+b)m. (c+d)n
If m = 2 and n = 2 one writes:
2 2 2 2 2 2(a+b) (c+d) = (a + 2ab+b ) (c + 2cd + d2 )
22 2 22 2= a c + 2a ad + a d + 2 abc + 2abcd + 2 abd2
2b2 c + 2b2 cd + b2d
When one collects all terms of the same mass, one obtains the set of
fractional abundances predicted for (a+b)2 (c+d)2 . If the experimental results
agree with the calculated set one has supporting evidence for the postulated
number of each atom in the molecular ion.
1
191
V

DISTRIBUTION
Copies Copies
Defense Documentation Center Naval Electronic Systems CommandCameron Station Attn: A. H. Sobel
Alexandria, VA 22314 12 (Code PME 124-31) 1Washington, DC 20360
Defense Nuzlear AgencyAttn: Library 2 Naval Sea Systems C ..ndWashington, DC 20301 Attn: F. Romano (( 63R3) 1
E. Anderson I
Institute for Defense Analyses E. Daugherty " de 06113) 1R&E Support Divison J. Pastine 06R) 1400 Army-Navy Drive Washington, DC 20'.
Arlington, VA 22202 1Strategic Systems Project Office
Naval Material Command Attn: K. N. Boley (Code NSP 2721) 1Attn: Code 08T223 1 M. Meserole (Code NSP 2722) 1Washington, DC 20360 Department of the Navy
Washington, DC 20360Office of Naval ResearchAttn: G. Neece (Code ONR 472) 1 Naval Air Development Center
J. Smith I Attn: J. Segrest (Code 6012) 1800 N. Quincy Street R. Schwartz (Code 30412) 1
Arlington, VA 22217 Warminster, PA 18974
Naval Research Laboratory Naval Intelligence Support Center
Attn: A. Simon (Code NRL 6130) 1 Attn: Dr. H. Ruskie (Code 362) 1Code NRL 6100 1 Washington, DC 20390
4555 Overlook Avenue, S.W.Chemistry Division Naval Ocean Systems CenterWashington, DC 20360 Attn: Dr. S. Szpak (Code 6343) 1
San Diego, CA 92152Naval Postgraduate SchoolAttn: Dr. William M. Tolles U. S. Development and Readiness
(Code 612) 1 Command
Dr. Oscar Biblarz 1 Attn: J. W. Crellin (Code DRCDE-L) 1Monterey, CA 93940 5001 Eisenhower Avenue
Alexandria, VA 22333
Naval Air Systems ComnandAttn: Dr. H. Rosenwasser
(Code NAVAIR 301C) 1E. Nebus(Code NAVAIR 5332) 1
Washington, DC 20361
V

V
Copies Copier,
Union Carbide Battery Products Headquarters, Department ofDivision Transportation
Attn- R. A. Powers I Attn: R. PotterP.O. Box 6116 (Code GEOE-3/61)Cleveland, OH 44101 U. S. Coast Guard, Ocean
Engineering Division
Wilson Greatbatch LTD. Washington, DC 20590Attn: Library 1
R. M. Carey 1 NASA Headquarters
1000 Wehrle Drive Attn: Dr. J. H. AmbrusClarence NY 14030 Washington, DC 20546
Yardney Electric Corporation NASA Goddard Space Flight Center
Attn: Library I Attn: G. Halpert (Code 711)
82 Mechanic Street Greenbelt, MD 20771Pawcatuck, CT 02891
NASA Lewis Research Center
Naval Surface Weapons Center Attn: J. S. FordyceAttn: W. P. Kilroy (Code R33) 12 (Code MS 309-1) 1New Hampshire Avenue M. Reid 1
Silver Spring, MD 20910 2100 Brookpark RoadCleveland, OH 44135
Army Material and MechanicalResearch Center Naval Electronic Systems Cormmand
Attn: J. J. DeMarco I Attn: T. SliwaWatertown, MA 01272 (Code NAVELEX-01K)
Washington, DC 20360
USA Mobility EquipmentR and D Command Naval Weapons Center
Attn: J. Sullivan (Code DRXFB) I Attn: Dr. E. Royce (Code 38) 1Code DRME-EC Dr. A. Fletcher
Electrochemical Division China Lake, CA 93555
Fort Belvoir, VA 22060Naval Weapons Support Center
Edgewood Arsenal Attn: M. Robertson (Code 305)Attn: Library D. MainsAberdeen Proving Ground Electrochemical Power SourcesAberdeen, MD 21010 Division
Crane, IN 47522
Picatinny ArsenalAttn: Dr. B. Werbel Naval Coastal Systems Center
(Code SAROA-FR-E-L-C) 1 Attn: LibraryA. E. Magistro Panama City, FL 32407
(Code SARPA-ND-D-B) 1U. S. Army Naval Underwater Systems CenterDover, NJ 07801 Attn: 3. Moden (Code SB332)
Newport, RI 02840
Harry Diamond LaboratoryAttn: J. T. Nelson David W. Taylor Naval Ship
(Code DELHD-DE-OP) R & D CenterDepartment of Army Material Annapolis LaboratoryChief, Power Supply Branch Annapolis, MD 214022800 Powder Mill RoadAdelphi, MD 20783
j

copies Copies
Honeywell Corporate Technology U. S. Army Research OfficeCenter Attn: B. F. Spielvogel
Attn: H. V. Venkatasetty 1 P.O. Box 12211Steven Schafer 1 Research Triangle Park, NC 27709
10701 Lyndale Ave. So.,Bloomington, MN 55420 NASA Scientific and Technical
Information Facility
Honeywell Inc. Attn: LibraryMat & Process Eng. P.O. Box 33K. Y. Kim MN11-1812 1 College Park, MD 20740600 2nd St. N.E.Hopkins, MN 55343 National Bureau of Standards
Metallurgy DivisionThe Aerospace Corporation Inorganic Materials DivisionAttn: Harlan Bittner 1 Washington, DC 20234P.O. Box 92957Los Angeles, CA 90009 Battelle Memorial Institute
Defense Metals & CeramicsHoneywell Power Sources Center Information CenterAttn: Dr. D. L. Chua 1 505 King Avenue
N. Doddapaneni I Columbus, OH 43201104 Rock RoadHorsham, PA 19044 Bell Laboratories
Attn: Dr. J. J. AubornAir Force Aero Propulsion 600 Mountain Avenue
Laboratory Murray Hill, NJ 07974Attn: W. S. Bishop
(Code AFAPL/POE-l) 1 Brookhaven National LaboratoryR. Marsh Attn: J. Sutherland
r t(Code AFWAL-POOC-) Building 815Wright-Patterson AFB, OH 45433 Upton, NY 11973
Air Force Rocket Propulsion California Institute of
Laboratory TechnologyAttn: LT. D. Ferguson Attn: Library
(Code MKPA) B. CarterEdwards Air Force Base, CA 93523 R. Somoano
H. FrankHeadquarters, Air Force Special Jet Propulsion Laboratory
Con munications Center 4800 Oak Grove DriveAttn: Library I Pasadena, CA 91103USAFSSSan Antonio, TX 78243 Argonne National Laboratory
Attn: Dr. E. C. GayOffice of Chief of Research 9700 South Cass Avenue
and Development Argonne, IL 60439Department of the ArmyAttn: Dr. S. J. Magram John Hopkins Applied PhysicsEnergy Conversion Branch LaboratoryRoom 410, Highland Building Attn: LibraryWashington, DC 20315 Howard County
Johns Hopkins RoadLaurel, MD 20810
........... I

Copies Copies
Oak Ridge National Laboratory Foote Mineral Company
Attn: K. Braunstein 1 Attn: H. R. Grady
Oak Ridge, TN 37830 Exton, PA 19341
Sandia Laboratories Gould, Inc.Attn: Sam Levy (Mail Services Attn: S. S. Nielsen 1
Section 3154-3) 1 A. Attia 1P.O. Box 5800 R. Putt 1Albuquerque, NM 87715 40 Gould Center
Rolling Meadows, IL 60008
University of TenneseeAttn: G. Mamantov I GT & E LaboratoryDepartment of Chemistry Attn: R. McDonald IKnoxville, TN 37916 F. Dampier 1
K. Kliendienst IUniversity of Florida W. Clark 1Attn: R. D. Walker 1 520 Winter St.
Department of Chemical Waltham, MA 02254Engineering
Gainesville, FL 32611 Hughes Aircraft Company
Attn: Dr. L. H. FentnorApplied Research Laboratory Aerospace GroupsAttn: Library 1 Missile Systems Group
Penn State University Tucson Engineering Laboratory
University Park, PA 16802 Tucson, AZ 85734 1
Catalyst Research Corporation Saft Score, Inc.Attn: G. Bowser 1 Attn: L. A. Stein
J. Joelson 1 200 Wight AvenueA. Schneider I Cockeysville, MD 21030
1421 Clarkview RoadBaltimore, MD 21209 Lockheed Missiles and Space
Company, Inc.ESB Research Center Attn: LibraryAttn: Library 1 Lockheed Palo Alto Research
19 W. College Avenue LaboratoryYardley, PA 19067 3251 Hanover Street
Palo Alto, CA 94304EIC CorporationAttn: S. B. Brunmner 1 Duracell Int., Inc.
K. M. Abraham 1 Attn: B. McDonald 155 Chapel Street Battery Division
Newton, MA 02158 South BroadwayTarrytown, NY 10591
Eagle-Picher Industries, Inc.Attn: Robert L. Higgins I Duracell Int., Inc.
J. Dines 1 Attn: W. Bowden 1
L. R. Erisman 1 A. N. Dey 1Electronics Division H. Taylor 1P.O. Box 47 Library 1
Joplin, MO 64802 Laboratory for PhysicalScience
Burlington, MA 01803
I
_j _ - .

U. S. Army Electronics Command
RAY-O-VAC
Attn: A. J. Legath Attn: R. Foster Udell
(Code DRSEL-TL-P) 1 101 East Washington AvenueE. Brooks Madison, WI 53703(Code DRSEL-TL-PD) 1G. DiMasi Litton Data Systems DivisionDr. W. K. Behl Attn: Frank Halula, MS 64-61Dr. Sol Gilman 8000 Woodley Avenue(Code DELET-PR) I Van Nuys, CA 91409
Fort Monmouth, NJ 07703*Lawrence Berkeley Laboratory
Callery Chemical Company Attn: F. M4cLarnonAttn: Library 1 University of CaliforniaCallery, PA 16024 Berkeley, CA 94720
Rockwell International TRW Systems
Attn: Dr. Samuel J. Yosim 1 Attn: I. J. Groce I
Atomics International Division G. L. Juvinal I
8900 DeSoto Avenue Ed Moon, Rm. 2251,
Canoga Park, CA 91304 Bldg. 01 3One Space Park
Stanford University Redondo Beach, CA 90278Attn: C. John Wen I
Center for Materials Research ALTUS Corporation
Room 249, McCullough Building Attn: Dr. Adrian E. Zolla,
Stanford, CA 94305 Library 2
1610 Crane CourtEDO Corporation San Jose, CA 95112Attn: E. P. DiGiannantonio 1
Government Products Division Capt. A. S. Alanis
2001 Jefferson Davis Highway BMO/ENBEArlington, VA 22202 Norton AFBI CA 92409
Globe Union Inc.
Attn: Dr. K. R. Bullock I Norton AFB
5757 N. Green Bay Avenue Code AFISC/SES
Milwaukee, WI 53201 CA 92409
University of Missouri, Rolla PCIAttn: Dr. J. M. Marchello 1 Attn: Thomas Reddy210 Parker Hall 495 BoulevardRolla, MO 65401 Elmwook Park, NJ 07407
RAI Research Corporation Dr. P. BroAttn: Dr. Carl Perini 1 Hyde Park Estates
225 Marcus Boulevard Santa Fe, NM 87501Hauppauge, NY 11787
Old Dominion University
Battery Engineering Attn: R. L. AkeAttn: Dr. N. Marincic 1 Dept. of Chemical Sciences
80 Oak Street Norfold, VA 23508
Newton, MA 02164
.? - , r ' ?' , '
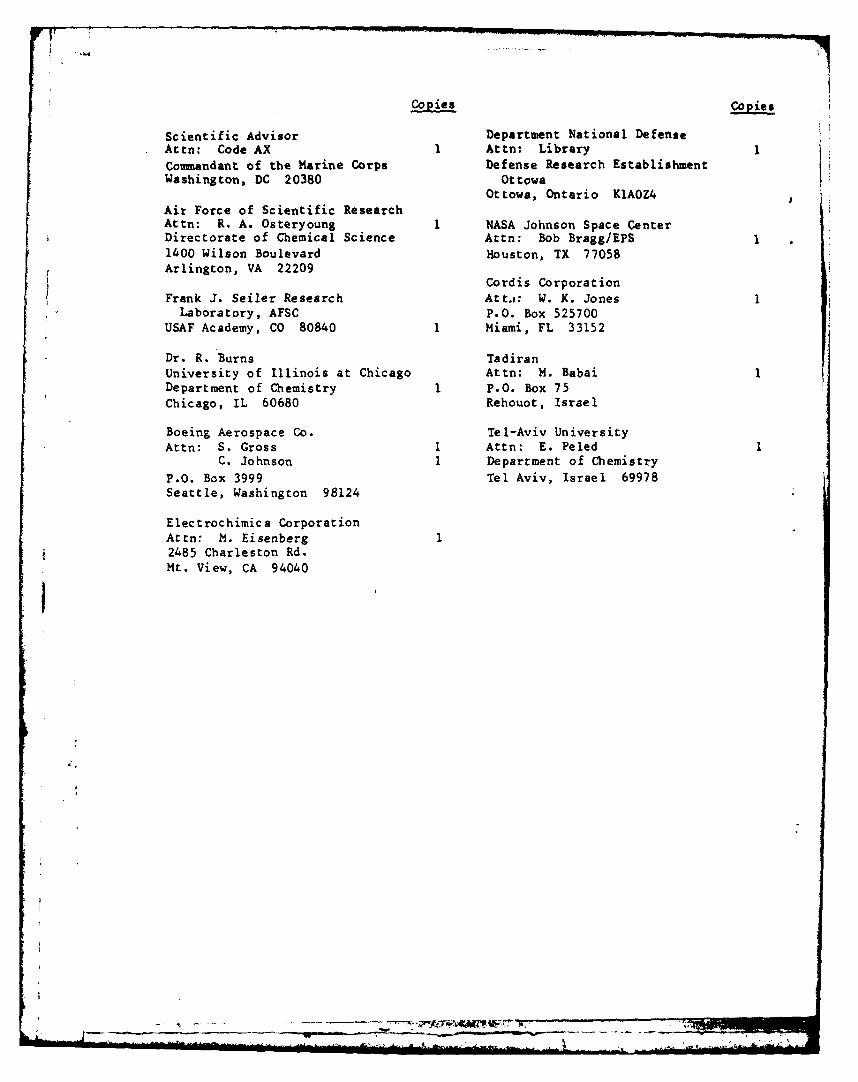
COP1e5 copies
Scientific Advisor Department National DefenseAttn: Code AX 1 Attn: LibraryCommandant of the Marine Corps Defense Research EstablishmentWashington, DC 20380 Ottowa
Ottowa, Ontario KlAOZ4Air Force of Scientific ResearchAttn: R. A. Osteryoung 1 NASA Johnson Space CenterDirectorate of Chemical Science Attn: Bob Bragg/EPS1400 Wilson Boulevard Houston, TX 77058Arlington, VA 22209
Cordis CorporationFrank J. Seiler Research Art,: W. K. JonesLaboratory, AFSC P.O. Box 525700
USAF Academy, CO 80840 1 Miami, FL 33152
Dr. R. Burns TadiranUniversity of Illinois at Chicago Attn: M. BabaiDepartment of Chemistry 1 P.O. Box 75Chicago, IL 60680 Rehouot, Israel
Boeing Aerospace Co. Tel-Aviv UniversityAttn: S. Cross 1 Attn: E. Peled
C. Johnson I Department of ChemistryP.O. Box 3999 Tel Aviv, Israel 69978Seattle, Washington 98124
Electrochimic a CorporationAttn: M. Eisenberg I2485 Charleston Rd.Mt. View, CA 94040I

ammop,
MIL

38R22 INVESTIGATION OF LITHIIIM-THIONYL CHLORIDE BATTER7SAFETY HAZARDS(U) GOULD RESEARCH CENTER ROLLING MEADOWSIL MATERIALS LAB A I ATTIA ET AL. JAN 83 838-012
7NLSSFlED N601921-81-C-036,' F/G 10/'3 NL
MEMELK

.2.2
136~
42.
11111 E~___ *U2
1.2 11111. 1.6i"
MICROCOPY RESOLUTION TEST CH-ART -maw .NATIONAL BURAA. OF OTANDARC 19-
%.' %..
* =- -N

.- C 1 -1 7 7 771-W. P.-w
SUPPL EMENTAR'T
I we
A M m
AT...
2. 2.
- - - -*..
4.. .. .
I-
" t§171 FO.M..O ...1 4 I
,.-,. 4t

-0 Gould Inc, Micro Power Producs Division OUL
Electronics
March 6, 1984..
L ( Thomas Lin. - Defense Logistic Agency
DTIC- Stop #3
Cameron StationAlexandria, Virginia 22314
REF: Error in Document Abstract( AD-A128 382*
Dear Mr. Lin:
I am enclosing an abstract of n report "Investigation of Lithium-ThionylChloride Battery Safety Hazards which I believe more closely describes the
-+ contents of the report.
, This work was performed in 1982, for the Naval Surface Weapons Center,under contract No. : N60921-81-C-0363o The report contains useful in-formatlon which is not at all evident in the current abstract.
I wish to thank you for your willingness to replace the current abstract.with the more accurate version.
Very truly yours,
,.." Alan I. Attia
Project Manager
AIA:rcw
Enclosure
L ITHMRPT
-1
*.'
** *.- .'*-*

--- ABSTRACT
, In-situ Infrared spectroscopy and Mass spectrometry were used to identify thereaction products in Li/SOCI2 batteries during low rate discharge and anodelimited reversal.
o The sources of all the absorption bands in the IR absorption spectrum ofthe electrolyte were identified and quantitated.
o Processes giving rise to free radical formation were detected by in-situEPR spectroscopy.
..J o The technique of direct-inlet in-situ mass spectrometry was applied forthe first time to the Li/SOCI system to identify without any ambiguitythe presence of HCl, SOJ, CS2, $20, S1 2 and S02C12 as well as Cl+ andCFj+ fragments in the gas phase above an operating cell.
o S20 was not detected in the liquid phase.
o The appearance potentials for SClj, SOCI2, S02C 2 and S2CI2 were measured.
o Evidence for the formation of C120 was refuted.
" o Significant effects directly attributable to temperature and currentdensity were identified and quantified.
o No clearly hazardous reactions were identified other than those inherentin the system.
As a result of this work, a much clearer understanding of the chemistry of theLi/SOCI2 system has been achieved. Several analytical techniques have beendeveloped and applied for the first time to the Li/SOCI2 system, which couldpotentially lead to a more complete explanation of the chemistry of thesystem.
"-'4
- . . . . . . . .

0c0.
v0
-'0 1 Yp &,i bY
V'