Actuarial Risk Analysis - soa.org · Actuarial Risk Analysis using Predictive Analytics,...
43
Actuarial Risk Analysis using Predictive Analytics, Segmentation and Decomposition Techniques R. DALE HALL, FSA, CERA, MAAA, CFA Managing Director of Research, Society of Actuaries May 10, 2018
Transcript of Actuarial Risk Analysis - soa.org · Actuarial Risk Analysis using Predictive Analytics,...

Actuarial Risk Analysis using Predictive Analytics, Segmentation and Decomposition TechniquesR. DALE HALL, FSA, CERA, MAAA, CFAManaging Director of Research, Society of ActuariesMay 10, 2018

The Society of Actuaries

Society of Actuaries
3
Mission: Through education and research, the SOA advances actuaries as leaders in measuring and managing risk to improve financial outcomes for individuals, organizations, and the public.
Vision: Actuaries are highly sought-after professionals who develop and communicate solutions for complex financial issues.
Professional association serving 30,000 global members

Society of Actuaries Education: ASA
4
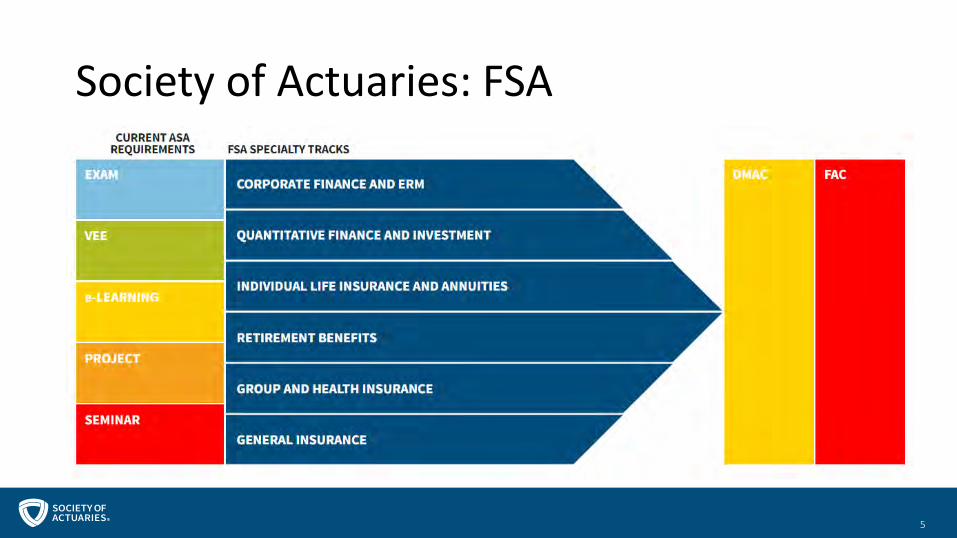
Society of Actuaries: FSA
5

Society of Actuaries Research
6

Actuarial Risk Analysis

Actuarial Risk Analysis
8
• “Right Price for Right Risk”• Predictive Analytics techniques have emerged to be
lead tools in the assessment of insurance risk• Data science has evolved… but so has data value and
computing power• Not uncommon for insurance rating filings to use
techniques such as generalized linear models

Actuarial Risk Analysis
9
• Generalized Linear Models• Target = b0 + b1 xi1 + b2 xi2 + … + bp xip• Explanatory / predictor variables• Target often a value used in ratemaking for insurance
products• Claims per unit exposure• Dollars per claim• Pure Premium• Loss Ratio
Variable Selection Using Parallel Random Forest for Mortality Prediction in Highly Imbalanced Data, Mahmoud Shehadeh,Rebecca Kokes, and Guizhou Hu, 2016, Society of Actuaries
Generalized Linear Models for Insurance Rating, Mark Goldburd, Anand Khare, and Dan Tevet, 2016, Casualty Actuarial Society

Actuarial Risk Analysis
10
• Predictive analytic techniques helping increase the number, usefulness and types of variables being used to assess insurance risk
• Across all lines of business• Property/Casualty: Auto, Home, Business• Health: Medical, Disability, Long Term Care• Life Insurance: Mortality, Policyholder Behavior
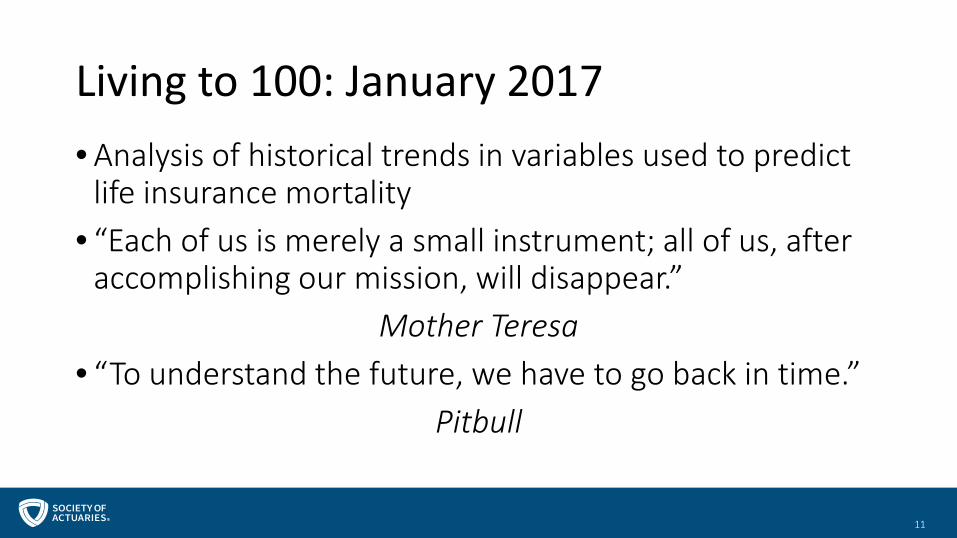
Living to 100: January 2017
11
• Analysis of historical trends in variables used to predict life insurance mortality
• “Each of us is merely a small instrument; all of us, after accomplishing our mission, will disappear.”
Mother Teresa• “To understand the future, we have to go back in time.”
Pitbull
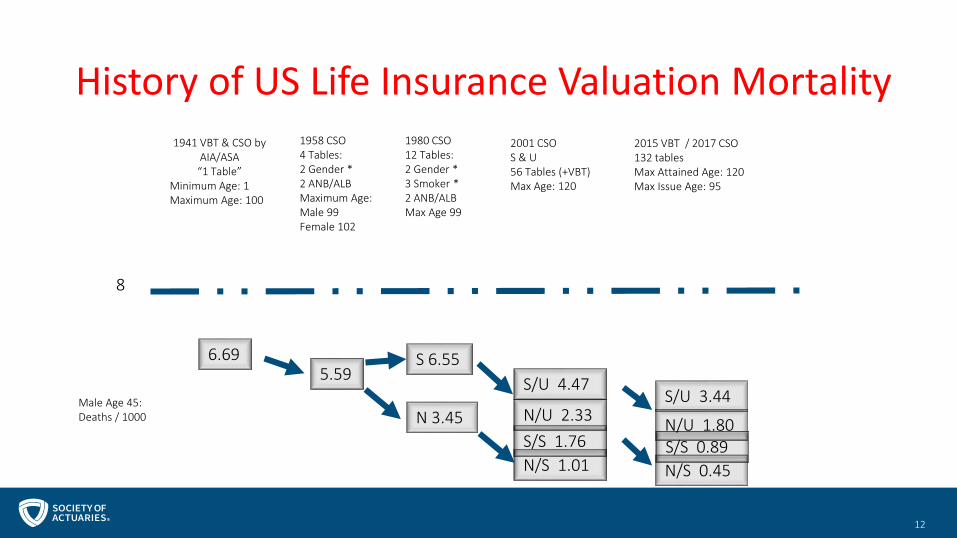
History of US Life Insurance Valuation Mortality
12
1941 VBT & CSO by AIA/ASA“1 Table”
Minimum Age: 1Maximum Age: 100
6.69
Male Age 45:Deaths / 1000
1958 CSO4 Tables:2 Gender * 2 ANB/ALBMaximum Age: Male 99Female 102
5.59
1980 CSO 12 Tables:2 Gender * 3 Smoker * 2 ANB/ALBMax Age 99
S 6.55
N 3.45
2001 CSOS & U56 Tables (+VBT)Max Age: 120
2015 VBT / 2017 CSO 132 tablesMax Attained Age: 120 Max Issue Age: 95
N/S 1.01
N/U 2.33S/S 1.76
S/U 4.47S/U 3.44
N/S 0.45
N/U 1.80S/S 0.89
8

Relative Risk Mortality Assessment
13
• High end use of predictive analytics models to differentiate risks
• “Predictive Modeling for Life Insurance”• Mike Batty, FSA, CERA, et al., Deloitte, 2010
• Overview of modeling and differentiating mortality risks through data-driven processes
• “Can non-invasive underwriting techniques work?”

Relative Risk Mortality Assessment
14
• Data-driven, predictive analytics based, underwriting assessment tools have increased in recent years
• Medical Information Bureau (MIB)• Motor Vehicle Record (MVR)• Electronic Prescription Profile (“Script Checks”)• Electronic Health Records (HER)• Consumer Credit Data• Third party marketing datasets• Social media information

Relative Risk Mortality Assessment
15

Actuarial Risk Analysis
16
• K-Means Clustering• Marketing Segmentation; Risk Segmentation
• Support Vector Machine• Machine learning / classification• Example: BMI

Actuarial Risk Analysis
17
• Use in SOA Experience Studies• Evolution from “tables” to “models”• 2017: Group LTD Recovery using Tree
Models• 2015: Long Term Care Experience
Basic Table Development• 2015: Lapsation for Post-Level Term
Period

Actuarial Risk Analysis
18
• Regulator involvement• Marketing Segmentation• Insurance rating
• Big Data commonly discussed topic at National Association of Insurance Commissioners (“NAIC”) meetings

Actuarial Risk Analysis
19
• 2018 Charges of NAIC Big Data (EX) Working Group• “Review current regulatory frameworks used to oversee
insurers' use of consumer and non-insurance data”• “…provide resources and allow the states to share
resources to facilitate their ability to conduct technical analysis of, and data collection related to, the review of complex models used by insurers for underwriting, rating and claims.”
• Price optimization
Decomposition and Attribution in Population Mortality Statistics
Decomposition and Attribution in Population Mortality Statistics
21
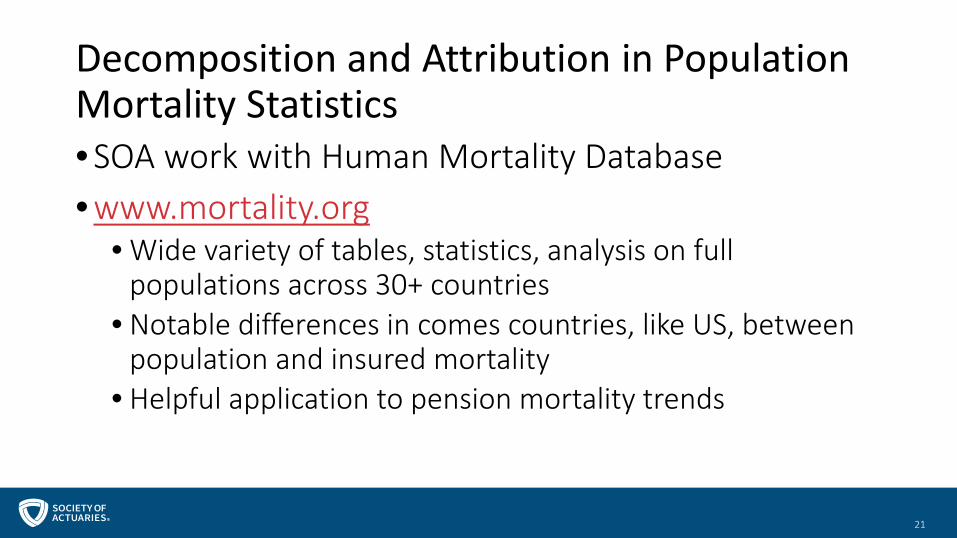
• SOA work with Human Mortality Database• www.mortality.org
• Wide variety of tables, statistics, analysis on full populations across 30+ countries
• Notable differences in comes countries, like US, between population and insured mortality
• Helpful application to pension mortality trends

Decomposition and Attribution in Population Mortality Statistics
22
• Expansion of work in 2017 to Causes of Death• 8 high income populations where consistency of
cause and use of International Statistical Classification of Diseases and Related Health Problems (ICD)
• Coming soon in 2018: State-based mortality tables in US

• Trends often described in Life Expectancy from birth• Data from Human Mortality Database highlights trends
on Total Populations• England and Wales: 1841 – 2013
• e0: 1841: 41.6 2013: 81.1• Canada: 1921 – 2011
• e0: 1921: 57.0 2011: 81.7• USA: 1933 – 2015
• e0: 1933: 60.9 2015: 79.0• Taiwan: 1970 – 2014
• e0: 1970: 68.7 2014: 79.6
23
Decomposition and Attribution in Population Mortality Statistics

• Decomposition Algorithms• Andreev, Shkolnikov and Begun (2002)
• Attribute change in e0 over time to each age or age group• Example: • Change in e0 from year 1 to year 2; Attribution of change to each age x
• Decomposition from year 2 to year 1 can also be calculated• Final evaluation as average of two decompositions
24
𝛿𝛿𝑥𝑥2−1 = 𝑙𝑙𝑥𝑥2(𝑒𝑒𝑥𝑥2 − 𝑒𝑒𝑥𝑥1) - 𝑙𝑙𝑥𝑥+12 (𝑒𝑒𝑥𝑥+12 − 𝑒𝑒𝑥𝑥+11 )
𝑒𝑒02 − 𝑒𝑒01 = �𝑥𝑥=0
𝜔𝜔
𝛿𝛿𝑥𝑥2−1
Decomposition and Attribution in Population Mortality Statistics

• Change in EAW e0 over 5 year time span, attributed to age groups
25
Decomposition and Attribution in Population Mortality Statistics

• While life expectancy important, at times historically becomes more of an “age 0” question
• BUT…. Changing in recent years
26
Decomposition and Attribution in Population Mortality Statistics
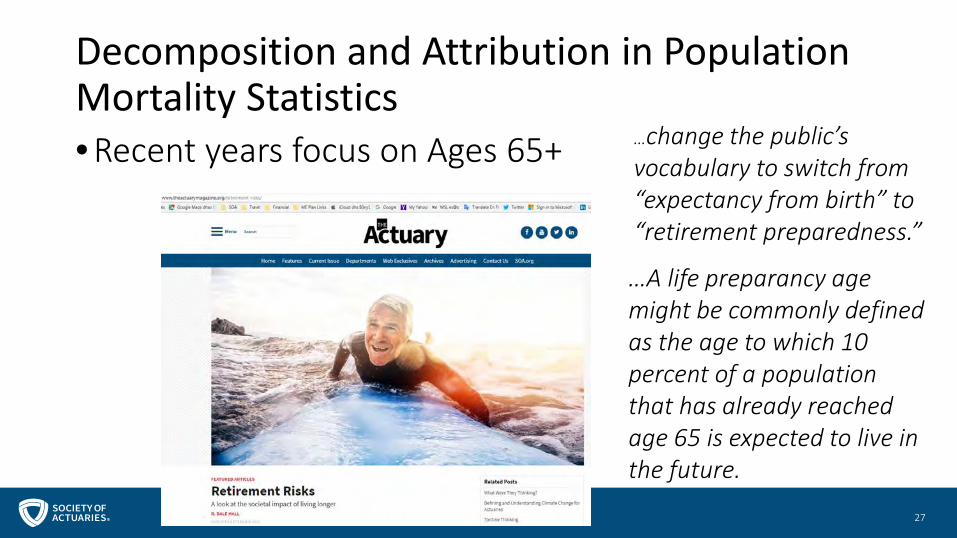
• Recent years focus on Ages 65+
27
…change the public’s vocabulary to switch from “expectancy from birth” to “retirement preparedness.”
…A life preparancy age might be commonly defined as the age to which 10 percent of a population that has already reached age 65 is expected to live in the future.
Decomposition and Attribution in Population Mortality Statistics
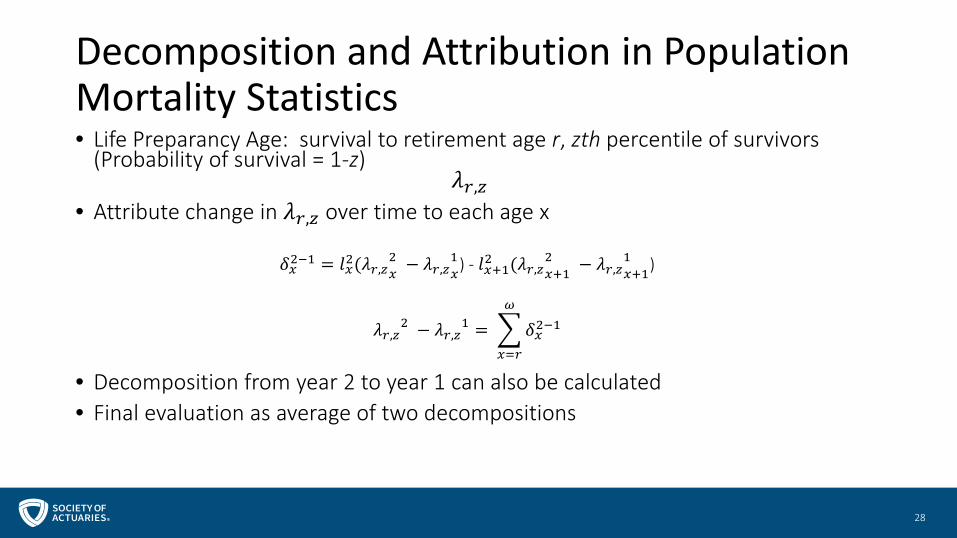
• Life Preparancy Age: survival to retirement age r, zth percentile of survivors (Probability of survival = 1-z)
𝜆𝜆𝑟𝑟,𝑧𝑧• Attribute change in 𝜆𝜆𝑟𝑟,𝑧𝑧 over time to each age x
• Decomposition from year 2 to year 1 can also be calculated• Final evaluation as average of two decompositions
28
𝛿𝛿𝑥𝑥2−1 = 𝑙𝑙𝑥𝑥2(𝜆𝜆𝑟𝑟,𝑧𝑧𝑥𝑥2 − 𝜆𝜆𝑟𝑟,𝑧𝑧𝑥𝑥
1) - 𝑙𝑙𝑥𝑥+12 (𝜆𝜆𝑟𝑟,𝑧𝑧𝑥𝑥+12 − 𝜆𝜆𝑟𝑟,𝑧𝑧𝑥𝑥+1
1 )
𝜆𝜆𝑟𝑟,𝑧𝑧2 − 𝜆𝜆𝑟𝑟,𝑧𝑧
1 = �𝑥𝑥=𝑟𝑟
𝜔𝜔
𝛿𝛿𝑥𝑥2−1
Decomposition and Attribution in Population Mortality Statistics

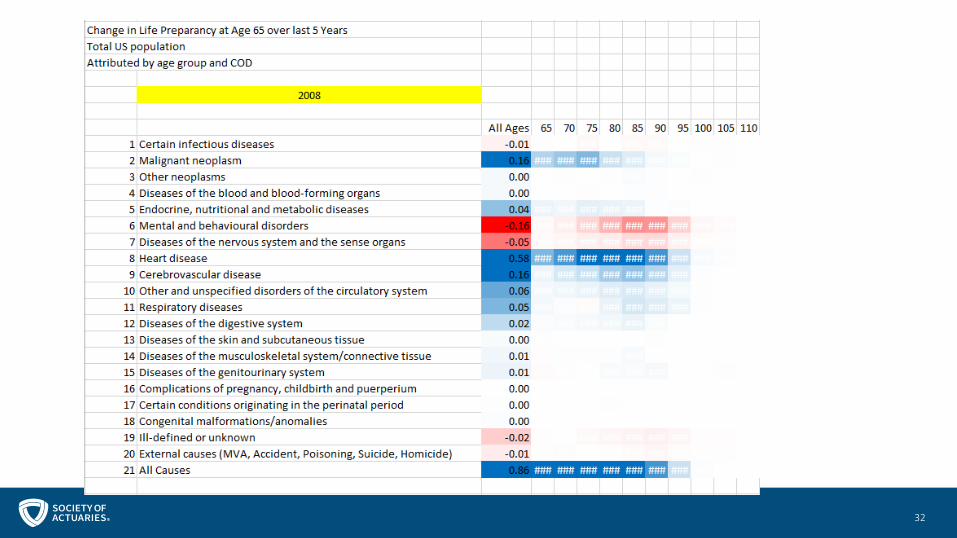
• Attribute each “age attribution” to causes of death chapters, y
29
1 Certain infectious diseases 11 Respiratory diseases
2 Malignant neoplasm 12 Diseases of the digestive system
3 Other neoplasms 13 Diseases of the skin and subcutaneous tissue
4 Diseases of the blood and blood-forming organs 14 Diseases of the musculoskeletal system/connective tissue
5 Endocrine, nutritional and metabolic diseases 15 Diseases of the genitourinary system
6 Mental and behavioral disorders 16 Complications of pregnancy, childbirth and puerperium
7 Diseases of the nervous system and the sense organs 17 Certain conditions originating in the perinatal period
8 Heart disease 18 Congenital malformations/anomalies
9 Cerebrovascular disease 19 Ill-defined or unknown
10 Other and unspecified disorders of the circulatory system 20 External causes (MVA, Accident, Poisoning, Suicide, Homicide)
21 All Causes
Decomposition and Attribution in Population Mortality Statistics

• Attribute each “age attribution” to causes of death chapters, y
• Let 𝑞𝑞𝑥𝑥,𝑦𝑦 be the cause of death due to chapter y for age x
30
𝛿𝛿𝑥𝑥 = 𝛿𝛿𝑥𝑥2−1−𝛿𝛿𝑥𝑥1−22
𝛿𝛿𝑥𝑥,𝑦𝑦 = 𝛿𝛿𝑥𝑥𝑞𝑞𝑥𝑥,𝑦𝑦
𝑞𝑞𝑥𝑥
𝛿𝛿𝑥𝑥 = �𝑦𝑦=1
20
𝛿𝛿𝑥𝑥,𝑦𝑦
𝜆𝜆𝑟𝑟,𝑧𝑧2 − 𝜆𝜆𝑟𝑟,𝑧𝑧
1 = �𝑥𝑥=𝑟𝑟
𝜔𝜔
�𝑦𝑦=1
20
𝛿𝛿𝑥𝑥,𝑦𝑦
Decomposition and Attribution in Population Mortality Statistics

31
• US Total Life Preparancy Age (65, 90) in 2003 = 94.17• US Total Life Preparancy Age (65, 90) in 2008 = 95.03• Change over 5 year period is 0.86 years
• What Age Groups and Causes of Death are attributing to that change in Life Preparancy Age?
• Determine Annual Attribution to each Age and Year• Bundle to Age Groups and Years
Decomposition and Attribution in Population Mortality Statistics
32

33

34

35

36

37

US Population Mortality Analysis 2016• Decrease in Life Expectancy
• 0.6% Decrease in Age-Adjusted Population Mortality
• Wide variety of mortality changes across ages
• Comparison of mortality by county average incomes
• https://www.soa.org/research-reports/2017/population-mortality-observations/
38

US Population Mortality Analysis 2016
39

US Population Mortality Analysis 2016
40
• Insert results by age group and gender hereAnnual ImprovementBoth Genders Female Male
Age Group 1999-2016 2011-2016 2015-2016 1999-2016 2011-2016 2015-2016 1999-2016 2011-2016 2015-2016< 1 1.4% 0.6% 1.1% 1.3% 0.6% 1.3% 1.4% 0.6% 0.9%
1 - 4 1.7% 0.7% -1.8% 1.6% 0.3% -6.0% 1.8% 1.0% 1.3%5 - 14 1.9% -0.4% -1.9% 1.6% -1.2% -4.8% 2.1% 0.2% 0.2%
15 - 24 0.3% -2.0% -7.7% 0.5% -2.2% -5.9% 0.3% -2.0% -8.3%25 - 34 -1.4% -4.3% -10.5% -1.2% -3.6% -9.1% -1.4% -4.5% -11.0%35 - 44 0.2% -2.2% -6.8% 0.0% -1.5% -4.6% 0.3% -2.7% -8.0%45 - 54 0.2% 0.2% -0.4% -0.2% 0.0% -0.2% 0.4% 0.4% -0.5%55 - 64 0.8% -0.8% -1.0% 0.9% -0.9% -1.3% 0.7% -0.8% -0.7%65 - 74 1.9% 0.6% 0.5% 1.8% 0.9% 0.8% 2.0% 0.5% 0.2%75 - 84 1.4% 1.2% 2.3% 1.3% 1.2% 2.5% 1.7% 1.3% 2.2%
85+ 0.9% 0.6% 2.1% 0.8% 0.6% 2.3% 1.1% 0.7% 1.8%

US Population Mortality Analysis 2016
41

[email protected] @rdalehallR. DALE HALL, FSA, CERA, MAAA, CFAManaging Director of Research, Society of ActuariesMay 10, 2018