
Activity 27.1 BRicS Flags BRAZIL
17
HIGH SCHOOL ECONOMICS 3rd EDITION © COUNCIL FOR ECONOMIC EDUCATION, NEW YORK, NY 425 WHERE TO BUILD A FACTORY LESSON 27 ACTIVITY 27.1 BRICS Flags BRAZIL
Transcript of Activity 27.1 BRicS Flags BRAZIL

HIGH SCHOOL ECONOMICS 3rd EDITION © COUNCIL FOR ECONOMIC EDUCATION, NEW YORK, NY 425
Where to Build a Factory Lesson 27
Activity 27.1BRicS Flags
BRAZIL
BK-CEE-ECONOMICS-131302-Lesson27.indd 425 27-05-2014 03:43:39

HIGH SCHOOL ECONOMICS 3rd EDITION © COUNCIL FOR ECONOMIC EDUCATION, NEW YORK, NY426
Lesson 27 Where to Build a Factory
Activity 27.1 (continued)
RUSSIA
INDIA
BK-CEE-ECONOMICS-131302-Lesson27.indd 426 27-05-2014 03:43:40

HIGH SCHOOL ECONOMICS 3rd EDITION © COUNCIL FOR ECONOMIC EDUCATION, NEW YORK, NY 427
Where to Build a Factory Lesson 27
Activity 27.1 (continued)
CHINA
SOUTH AFRICA
BK-CEE-ECONOMICS-131302-Lesson27.indd 427 27-05-2014 03:43:41

HIGH SCHOOL ECONOMICS 3rd EDITION © COUNCIL FOR ECONOMIC EDUCATION, NEW YORK, NY428
Lesson 27 Where to Build a Factory
Activity 27.2Key Decision Factors
In today’s global economy, many companies try to reduce production costs and sell more products more efficiently by building factories abroad. Your group will choose a country in which to build an automotive factory—but before you decide, you need to consider key factors about each of the countries you’re considering:
• Wages. How much do factory workers get paid? Wages are a key cost of production.
• Availability of skilled labor. How good is the education system? Can you easily obtain enough experienced and educated workers? You’ll need engineers, mechanics, welders, computer programmers and technicians, accountants, and managers.
• Political stability. How stable is the government? Can the government main-tain law and order? To protect your investment, you need to be reasonably sure that you can continue to operate the factory for years. A major concern for multinational corporations with production facilities in developing countries is whether or not a revolutionary government could come to power and take over (nationalize) their factories. A commitment to well-defined property rights is very important.
• Transportation, infrastructure, and communications systems. How well is the country linked to the rest of the world? This means transportation, infrastructure, and communication technologies as well as the location of each country compared to potential trading partners. Will you be able to obtain needed supplies and ship finished products efficiently? Ideally, your factory should be near leading markets or where there is a good opportunity to establish strategic positions in a market—or markets—expected to grow rapidly.
• Import/export restrictions. Are there tariffs, import quotas, or other trade barriers that make import/export more expensive? Where there are tariffs and quotas, importing and exporting will be more costly. Trade will be less expen-sive in countries participating in free-trade agreements.
• Government regulation. What government regulations must we comply with? Will excessive red tape interfere with our company’s ability to do business? How much will our company have to pay in taxes?
BK-CEE-ECONOMICS-131302-Lesson27.indd 428 27-05-2014 03:43:41

HIGH SCHOOL ECONOMICS 3rd EDITION © COUNCIL FOR ECONOMIC EDUCATION, NEW YORK, NY 429
Where to Build a Factory Lesson 27
• Cultural and linguistic factors. Will language differences create communi-cation problems? Will the nation’s customs be compatible with the established principles and procedures of your company? Prospects for good relationships between labor and management are important.
• Size of market. The size of the potential market for your good should be considered. If you can sell more finished goods in a particular country, other things being equal, you might want to move your factory to the country with the larger market.
In your group, discuss and answer each of these questions:
1. Which of these eight factors is most important in deciding where to build our automotive factory? Why?
2. Which of these eight factors would be least important in deciding where to build our automobile factory? Why?
3. Rank the factors, from most important (1) to least important (8), that our com-pany needs to consider before deciding where to build our automotive factory.
_______ Wages _______ Import/export restrictions_______ Availability of skilled labor _______ Government regulation_______ Political stability _______ Cultural and linguistic
factors_______ Transportation, infrastructure, and communications system _______ Size of market
4. Are there factors not listed above that we, as a company, need to consider before deciding where to build our automobile factory? If so, what are they?
BK-CEE-ECONOMICS-131302-Lesson27.indd 429 27-05-2014 03:43:41

HIGH SCHOOL ECONOMICS 3rd EDITION © COUNCIL FOR ECONOMIC EDUCATION, NEW YORK, NY430
Lesson 27 Where to Build a Factory
Activity 27.3Group choice cards
GROUP 1 GROUP 2
GROUP 3 GROUP 4
GROUP 5 GROUP 6
BK-CEE-ECONOMICS-131302-Lesson27.indd 430 27-05-2014 03:43:43

HIGH SCHOOL ECONOMICS 3rd EDITION © COUNCIL FOR ECONOMIC EDUCATION, NEW YORK, NY 431
Where to Build a Factory Lesson 27
Activity 27.4Where to Build a Factory
Directions
Before deciding where to build a factory, people that own and manage a company must gather information about nations where the factory might be built. Your group must decide in which of these countries your automobile factory should be built.
This is basic information about five countries under consideration for your com-pany’s large automobile factory. Use this information to gain an understanding of these countries’ business, political, and economic climates.
Information for each of the countries comes from The World Factbook produced by the CIA and from the Heritage Foundation’s Index of Economic Freedom, which measures levels of economic freedom on a scale of 0 to 100, with 100 representing the highest level of economic freedom.
The economic freedoms measured in the index are in four broad categories:
• Rule of Law. Are property rights protected? Is there freedom from corruption?
• Limited Government. Fiscal freedom—is taxation limited? Is government spending reasonable?
• Regulatory Efficiency. Can businesses open and close easily? Can workers be hired and fired easily? Are prices free from controls and inflation?
• Open Markets. Is trade free from tariffs or quotas? Can financial capital be easily moved into and out of the country? Are financial transactions easy to conduct?
The analysis of each country highlights important economic factors as they existed in late 2011 or early 2012, unless otherwise noted.
Each group will be asked to report on its decision and to explain how that decision was made.
BK-CEE-ECONOMICS-131302-Lesson27.indd 431 27-05-2014 03:43:43

HIGH SCHOOL ECONOMICS 3rd EDITION © COUNCIL FOR ECONOMIC EDUCATION, NEW YORK, NY432
Lesson 27 Where to Build a Factory
Activity 27.4 (continued)
BRAZIL
Index of Economic Freedom Score: 57.7 out of 100
Country Ranking: 100 out of 177 (Index of Economic Freedom)
• Brazil is the largest country in South America in terms of both population and land area. With vast natural resources and a 2013 population of approximately 201 million, Brazil has the largest economy in South America.
• Brazil has the world’s 8th largest GDP and 106th largest per capita GDP.
• The Brazilian government has liber-alized trade policy to welcome foreign investors. Leading exports include transport equipment, iron ore, soybeans, footwear, coffee, and autos. Brazil’s trade-weighted tariff rate is 7.6 percent.
• Free and open presidential elections are held every four years. President Dilma Rousseff came to power in 2011.
• Brazil ranks 2nd in the world in the total number of airports, trailing only the United States.
• Brazil ranks 10th in the world in total miles of a useable railway network.
• Brazil spends 5.6 percent of its GDP on education. The literacy rate for all Brazilians over the age of 15 is 88.6 percent. The average Brazilian student can expect to receive 14 years of schooling.
• The process of obtaining business permits in Brazil is sometimes lengthy, which slows the start of businesses. Contracts are generally considered secure.
• The income tax rate in Brazil is 27.5 percent. The effective corporate tax rate is around 34 percent.
• Brazil ranks 25th internationally in terms of total amount of merchandise exported ($242.6 billion in 2012).
Economic Snapshot (2012 est.)
GDP: $2.394 trillion
Per Capita GDP: $12,100
Unemployment Rate: 5.5%
Inflation Rate: 5.4%
Deepwater Ports
Home to the 41st largest port in the world
BK-CEE-ECONOMICS-131302-Lesson27.indd 432 27-05-2014 03:43:44

HIGH SCHOOL ECONOMICS 3rd EDITION © COUNCIL FOR ECONOMIC EDUCATION, NEW YORK, NY 433
Where to Build a Factory Lesson 27
Activity 27.4 (continued)
• Portuguese is the most commonly spoken language.
• Leading trading partners include China, the United States, and Argentina.
Population Pyramid
0 01.8 1.83.6 3.65.4 5.47.2 7.29 9
Population (in millions) Population (in millions)
Male FemaleBrazil - 2013
Age group
0 - 45 - 9
10 - 1415 - 1920 - 2425 - 2930 - 3435 - 3940 - 4445 - 4950 - 5455 - 5960 - 6465 - 6970 - 7475 - 7980 - 8485 - 8990 - 9495 - 99100+
Sources: CIA Factbook (www.cia.gov/library/publications/the-world-factbook/); 2013 Index of Economic Freedom (http://www.heritage.org/index/).
BK-CEE-ECONOMICS-131302-Lesson27.indd 433 27-05-2014 03:43:46

HIGH SCHOOL ECONOMICS 3rd EDITION © COUNCIL FOR ECONOMIC EDUCATION, NEW YORK, NY434
Lesson 27 Where to Build a Factory
Activity 27.4 (continued)
RUSSIA
Index of Economic Freedom Score: 51.1 out of 100
Country Ranking: 139 out of 177 (Index of Economic Freedom)
• Russia is the largest country in the world in terms of land area. With vast natural resources and a 2013 population of approximately 142.5 million, Russia continues to make the transition from command to market economy after the collapse of communism in the former Soviet Union in 1991.
• Russia has the world’s 7th largest GDP and 77th largest per capita GDP.
• Some non-tariff barriers to trade limit the flow of goods and services in and out of Russia. Leading exports include petroleum and petroleum products, natural gas, metals, wood and wood products, and chemicals. Russia’s trade-weighted tariff rate is 3.8 percent.
• Russia’s government is semi-authoritarian with much power resting in the hands of President Vladimir Putin. Mr. Putin is serving his third term as president after winning election in 2012. Presidential terms now last six years.
• Russia ranks 5th in the world in the total number of airports, trailing only the United States, Brazil, Mexico, and Canada.
• Russia ranks 2nd in the world in total miles of a useable railway network.
• Russia spends 4.1 percent of its GDP on education. The literacy rate for all Russians over the age of 15 is 99.6 percent. The average Russian student can expect to receive 14 years of schooling.
• The process of obtaining business permits in Russia is burdensome and inconsistent, which slows the start of businesses. Business regulations are not consistently enforced.
• The income tax rate in Russia is a flat 13 percent. The effective corporate tax rate is 20 percent.
Economic Snapshot
GDP: $2.555 trillion
Per Capita GDP: $18,000
Unemployment Rate: 5.7%
Inflation Rate: 5.1%
Deepwater Ports
None ranking in the top 50
BK-CEE-ECONOMICS-131302-Lesson27.indd 434 27-05-2014 03:43:46

HIGH SCHOOL ECONOMICS 3rd EDITION © COUNCIL FOR ECONOMIC EDUCATION, NEW YORK, NY 435
Where to Build a Factory Lesson 27
Activity 27.4 (continued)
• Russia ranks 9th internationally in terms of total amount of merchandise exported ($529.6 billion in 2012).
• Russian is the most commonly spoken language.
• Leading trading partners include the Netherlands, China, Germany, and Ukraine.
Population Pyramid
0 01.4 1.42.8 2.84.2 4.25.6 5.67 7
Population (in millions) Population (in millions)
Male FemaleRussia - 2013
Age group
0 - 45 - 9
10 - 1415 - 1920 - 2425 - 2930 - 3435 - 3940 - 4445 - 4950 - 5455 - 5960 - 6465 - 6970 - 7475 - 7980 - 8485 - 8990 - 9495 - 99100+
Sources: CIA Factbook (www.cia.gov/library/publications/the-world-factbook/); 2013 Index of Economic Freedom (http://www.heritage.org/index/).
BK-CEE-ECONOMICS-131302-Lesson27.indd 435 27-05-2014 03:43:47

HIGH SCHOOL ECONOMICS 3rd EDITION © COUNCIL FOR ECONOMIC EDUCATION, NEW YORK, NY436
Lesson 27 Where to Build a Factory
Activity 27.4 (continued)
INDIA
Index of Economic Freedom Score: 55.2 out of 100
Country Ranking: 119 out of 177 (Index of Economic Freedom)
• India is the 7th largest country in the world in terms of land area. With a population of 1.2 billion people, India is the 2nd most populated country on the planet.
• India has the world’s 4th largest GDP and 168th largest per capita GDP.
• Some non-tariff barriers to trade limit the flow of goods and services in and out of India. Leading exports include petroleum products, precious stones, machinery, iron and steel, chemicals, vehicles, and apparel. India’s trade-weighted tariff rate is 8.2 percent.
• India is the world’s largest democracy in terms of population. India’s com-mon law system is based on the English model. The head of the government is Prime Minister Manmohan Singh, who has been in office since 2004.
• India ranks 22nd in the world in the total number of airports, with a total of 352 for the entire country.
• India ranks 4th in the world in total miles of a useable railway network.
• India spends 3.3 percent of its GDP on education. The literacy rate for all Indians over the age of 15 is 61 percent. The average Indian student can expect to receive 11 years of schooling.
• The process of obtaining business permits in India is burdensome, lengthy, and expensive, which slows the start of businesses.
• The top income tax rate in India is 30 percent. The top corporate tax rate is 33 percent.
• India ranks 21st internationally in terms of total amount of merchandise exported ($298.4 billion in 2012).
Economic Snapshot
GDP: $4.761 trillion
Per Capita GDP: $3,900
Unemployment Rate: 8.5%
Inflation Rate: 9.3%
Deepwater Ports
Home to the 29st largest port in the world
BK-CEE-ECONOMICS-131302-Lesson27.indd 436 27-05-2014 03:43:48

HIGH SCHOOL ECONOMICS 3rd EDITION © COUNCIL FOR ECONOMIC EDUCATION, NEW YORK, NY 437
Where to Build a Factory Lesson 27
Activity 27.4 (continued)
• English is the subsidiary official language and is the most important for national, political, and commercial communication. There are 14 other official languages, with Hindi being the most common.
• Leading trading partners include the United States, China, the United Arab Emirates, and Saudi Arabia.
Population Pyramid
0 013 1326 2639 3952 5265 65
Population (in millions) Population (in millions)
Male FemaleIndia - 2013
Age group
0 - 45 - 9
10 - 1415 - 1920 - 2425 - 2930 - 3435 - 3940 - 4445 - 4950 - 5455 - 5960 - 6465 - 6970 - 7475 - 7980 - 8485 - 8990 - 9495 - 99100+
Sources: CIA Factbook (www.cia.gov/library/publications/the-world-factbook/); 2013 Index of Economic Freedom (http://www.heritage.org/index/).
BK-CEE-ECONOMICS-131302-Lesson27.indd 437 27-05-2014 03:43:49

HIGH SCHOOL ECONOMICS 3rd EDITION © COUNCIL FOR ECONOMIC EDUCATION, NEW YORK, NY438
Lesson 27 Where to Build a Factory
Activity 27.4 (continued)
CHINA
Index of Economic Freedom Score: 51.9 out of 100
Country Ranking: 136 out of 177 (Index of Economic Freedom)
• China is the 4th largest country in the world in terms of land area. With a population of 1.35 billion people, China is the most populated country on the planet.
• China has the world’s 2nd largest GDP and 123rd largest per capita GDP.
• Some non-tariff barriers to trade limit the flow of goods and services in and out of China. Leading exports include electrical and other machinery, apparel, radio telephone handsets, and textiles. China’s trade-weighted tariff rate is 4 percent.
• China is a communist country that has been slowly introducing more market-based economic policies. President Xi Jinping has been in power since being elected by the National People’s Congress in 2013.
• China ranks 14th in the world in the total number of airports, with a total of 497 for the entire country.
• China ranks 3rd in the world in total miles of a useable railway network.
• The literacy rate for all Chinese citizens over the age of 15 is 92 percent. The average Chinese student can expect to receive 12 years of schooling.
• Business regulations in China are burdensome, arbitrary, expensive, and uneven, which slows the start of businesses.
• The top income tax rate in China is 45 percent. The top corporate tax rate is 25 percent.
• China ranks 1st internationally in terms of total amount of merchandise exported ($2.057 trillion in 2012).
Economic Snapshot
GDP: $12.61 trillion
Per Capita GDP: $9,300
Unemployment Rate: 6.5%
Inflation Rate: 2.6%
Deepwater Ports
Home to 6 of the 10 largest ports in the world
BK-CEE-ECONOMICS-131302-Lesson27.indd 438 27-05-2014 03:43:49

HIGH SCHOOL ECONOMICS 3rd EDITION © COUNCIL FOR ECONOMIC EDUCATION, NEW YORK, NY 439
Where to Build a Factory Lesson 27
Activity 27.4 (continued)
• Numerous dialects—including Mandarin, Yue, Wu, Minbei, Minnan, Xiang, Gan, and Hakka—are spoken in China.
• Leading trading partners include the United States, Japan, South Korea, and Germany.
Population Pyramid
0 013 1326 2639 3952 5265 65
Population (in millions) Population (in millions)
Male FemaleChina - 2013
Age group
0 - 45 - 9
10 - 1415 - 1920 - 2425 - 2930 - 3435 - 3940 - 4445 - 4950 - 5455 - 5960 - 6465 - 6970 - 7475 - 7980 - 8485 - 8990 - 9495 - 99100+
Sources: CIA Factbook (www.cia.gov/library/publications/the-world-factbook/); 2013 Index of Economic Freedom (http://www.heritage.org/index/).
BK-CEE-ECONOMICS-131302-Lesson27.indd 439 27-05-2014 03:43:50
HIGH SCHOOL ECONOMICS 3rd EDITION © COUNCIL FOR ECONOMIC EDUCATION, NEW YORK, NY440
Lesson 27 Where to Build a Factory
Activity 27.4 (continued)
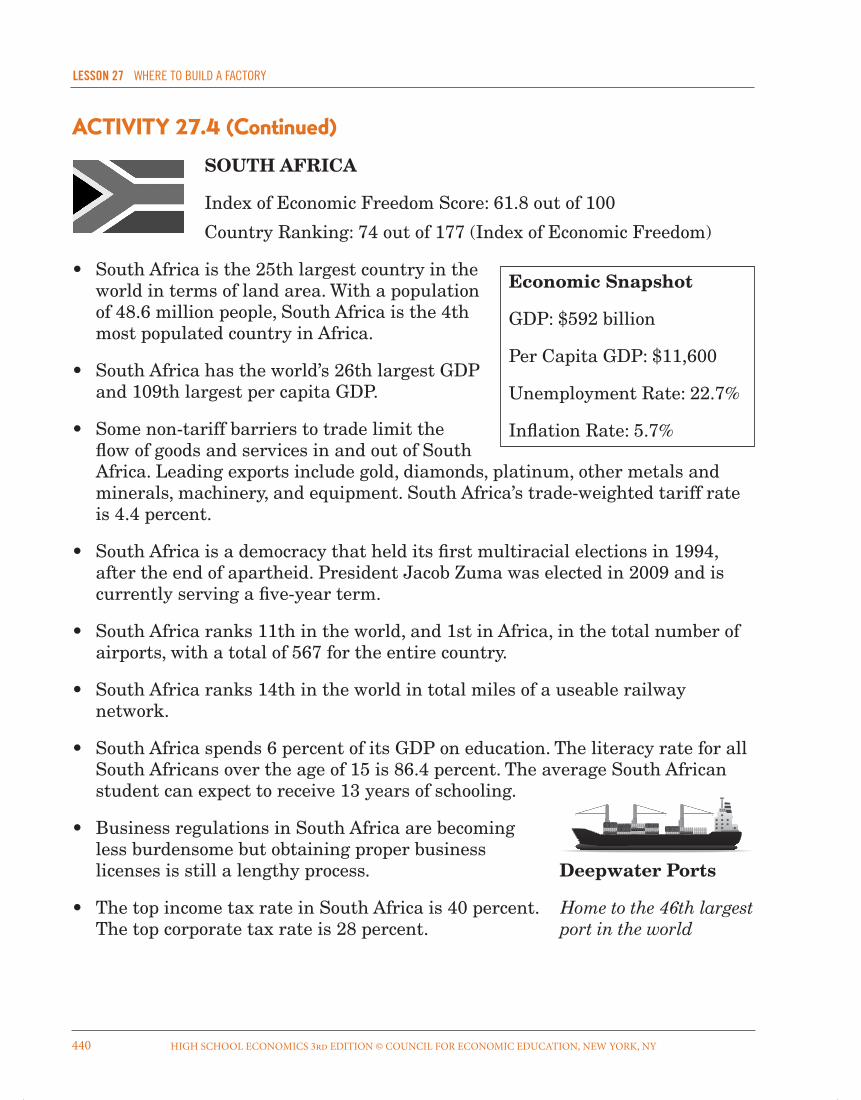
SOUTH AFRICA
Index of Economic Freedom Score: 61.8 out of 100
Country Ranking: 74 out of 177 (Index of Economic Freedom)
• South Africa is the 25th largest country in the world in terms of land area. With a population of 48.6 million people, South Africa is the 4th most populated country in Africa.
• South Africa has the world’s 26th largest GDP and 109th largest per capita GDP.
• Some non-tariff barriers to trade limit the flow of goods and services in and out of South Africa. Leading exports include gold, diamonds, platinum, other metals and minerals, machinery, and equipment. South Africa’s trade-weighted tariff rate is 4.4 percent.
• South Africa is a democracy that held its first multiracial elections in 1994, after the end of apartheid. President Jacob Zuma was elected in 2009 and is currently serving a five-year term.
• South Africa ranks 11th in the world, and 1st in Africa, in the total number of airports, with a total of 567 for the entire country.
• South Africa ranks 14th in the world in total miles of a useable railway network.
• South Africa spends 6 percent of its GDP on education. The literacy rate for all South Africans over the age of 15 is 86.4 percent. The average South African student can expect to receive 13 years of schooling.
• Business regulations in South Africa are becoming less burdensome but obtaining proper business licenses is still a lengthy process.
• The top income tax rate in South Africa is 40 percent. The top corporate tax rate is 28 percent.
Economic Snapshot
GDP: $592 billion
Per Capita GDP: $11,600
Unemployment Rate: 22.7%
Inflation Rate: 5.7%
Deepwater Ports
Home to the 46th largest port in the world
BK-CEE-ECONOMICS-131302-Lesson27.indd 440 27-05-2014 03:43:51

HIGH SCHOOL ECONOMICS 3rd EDITION © COUNCIL FOR ECONOMIC EDUCATION, NEW YORK, NY 441
Where to Build a Factory Lesson 27
Activity 27.4 (continued)
• South Africa ranks 39th internationally in terms of total amount of merchan-dise exported ($100.7 billion in 2012).
• South Africa has 11 official languages, including Zulu, Xhosa, Afrikaans, and English.
• Leading trading partners include China, the United States, Japan, and Germany.
Population Pyramid
0 00.6 0.61.2 1.21.8 1.82.4 2.43 3
Population (in millions) Population (in millions)
Male FemaleSouth Africa - 2013
Age group
0 - 45 - 9
10 - 1415 - 1920 - 2425 - 2930 - 3435 - 3940 - 4445 - 4950 - 5455 - 5960 - 6465 - 6970 - 7475 - 7980 - 8485 - 8990 - 9495 - 99100+
Sources: CIA Factbook (www.cia.gov/library/publications/the-world-factbook/); 2013 Index of Economic Freedom (http://www.heritage.org/index/).
BK-CEE-ECONOMICS-131302-Lesson27.indd 441 27-05-2014 03:43:52


![[AW]policy BRICS - ITD · กลุ่มประเทศ brics จะก่อให้เกิดประโยชน์ทางเศรษฐกิจกับไทย”](https://static.fdocuments.net/doc/165x107/5eb6589d95ac763ff45c6af5/awpolicy-brics-aaaaaaaaaaa-brics-aaaaaafaaaaaaaaaaaaaaoeaaaaaaaaaaaaaaaaaa.jpg)


