Active vs. Passive Asset Management - Envestnet portfolio construction ... managers seem to be...
8
Active vs. Passive Asset Management Investigation Of The Asset Class And Manager Selection Decisions Jianan Du, Quantitative Research Analyst, Quantitative Research Group, Envestnet | PMC Janis Zvingelis, Director of Quantitative Research, Quantitative Research Group, Envestnet | PMC Brandon Thomas, CIO, Envestnet | PMC APPROVED FOR ADVISOR/PROFESSIONAL USE ONLY— IT IS NOT INTENDED FOR PRIVATE INVESTORS
Transcript of Active vs. Passive Asset Management - Envestnet portfolio construction ... managers seem to be...
Active vs. Passive Asset Management Investigation Of The Asset Class And Manager Selection Decisions
Jianan Du, Quantitative Research Analyst, Quantitative Research Group, Envestnet | PMC
Janis Zvingelis, Director of Quantitative Research, Quantitative Research Group, Envestnet | PMC
Brandon Thomas, CIO, Envestnet | PMC
APProved for Advisor/ProfessionAl Use only— it is not intended for PrivAte investors
2 Active vs. Passive Asset ManagementAPProved for Advisor/ProfessionAl Use only—it is not intended for PrivAte investors
1. introductionThe goals of this research paper are several: first, to measure the statistical significance of every percentile in the cross-sectional (i.e., across a given Morningstar category) distribution of alphas; second, to use the statistical significance percentile data to designate particular Morningstar categories as candidates for either active or passive management; and third, to conduct predictive analysis along several dimensions to formulate an a priori decision rule for selecting funds with the highest probability of future outperformance.
Overall, in terms of equity asset classes, the results tend to support the traditional active/passive portfolio construction framework, in which domestic large-cap equity is passively managed and active managers are selected for satellite asset classes, particularly domestic and foreign small-cap growth. As for fixed income, the data suggest that municipal bond and short-term government allocations should be passively managed. When analyzing different market environments, contrary to what occurred in the midst of the financial crisis in 2008, active managers generally produce higher alphas during bear market periods than in bull periods. Finally, the data show positive out-of-sample results for portfolios constructed based on certain dimensions, such as low expense ratio or high active return for the previous month.
2. summary of results
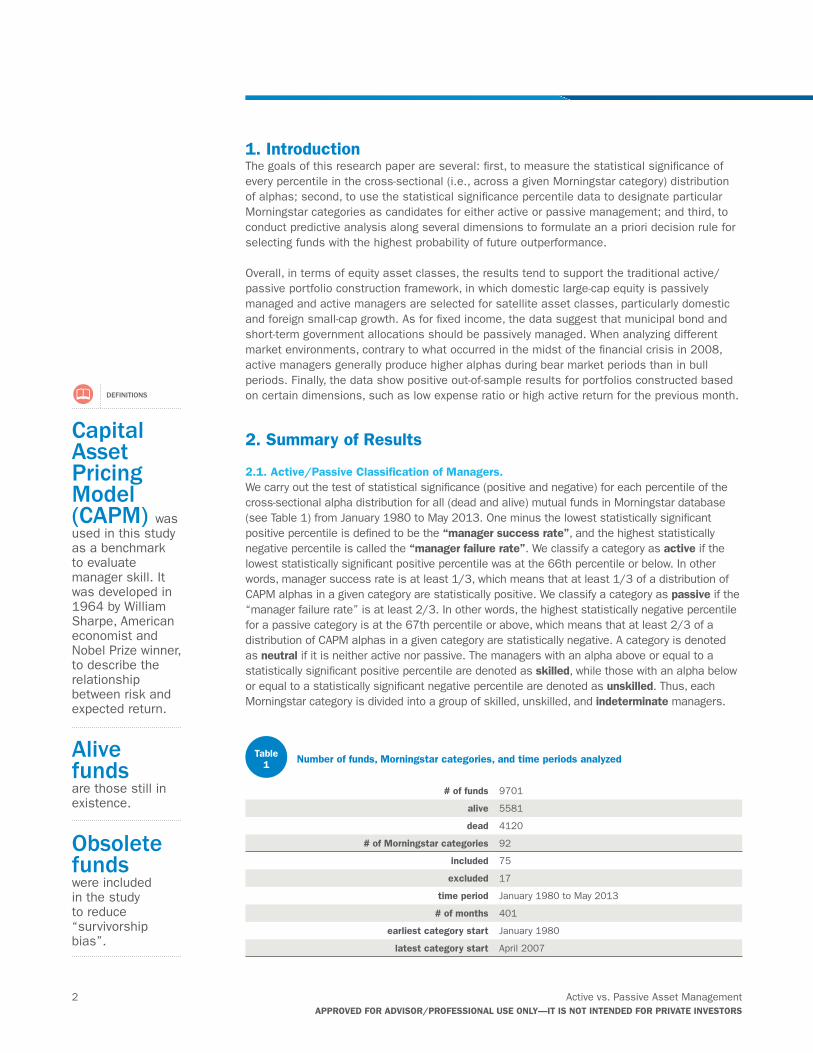
2.1. Active/Passive Classification of Managers. We carry out the test of statistical significance (positive and negative) for each percentile of the cross-sectional alpha distribution for all (dead and alive) mutual funds in Morningstar database (see Table 1) from January 1980 to May 2013. One minus the lowest statistically significant positive percentile is defined to be the “manager success rate”, and the highest statistically negative percentile is called the “manager failure rate”. We classify a category as active if the lowest statistically significant positive percentile was at the 66th percentile or below. In other words, manager success rate is at least 1/3, which means that at least 1/3 of a distribution of CAPM alphas in a given category are statistically positive. We classify a category as passive if the “manager failure rate” is at least 2/3. In other words, the highest statistically negative percentile for a passive category is at the 67th percentile or above, which means that at least 2/3 of a distribution of CAPM alphas in a given category are statistically negative. A category is denoted as neutral if it is neither active nor passive. The managers with an alpha above or equal to a statistically significant positive percentile are denoted as skilled, while those with an alpha below or equal to a statistically significant negative percentile are denoted as unskilled. Thus, each Morningstar category is divided into a group of skilled, unskilled, and indeterminate managers.
# of funds 9701
alive 5581
dead 4120
# of Morningstar categories 92
included 75
excluded 17
time period January 1980 to May 2013
# of months 401
earliest category start January 1980
latest category start April 2007
table 1 number of funds, Morningstar categories, and time periods analyzed
definitions
Capital Asset Pricing Model (CAPM) was used in this study as a benchmark to evaluate manager skill. It was developed in 1964 by William Sharpe, American economist and Nobel Prize winner, to describe the relationship between risk and expected return.
Alive funds are those still in existence.
Obsolete fundswere included in the study to reduce “survivorship bias”.
Active vs. Passive Asset Management 3APProved for Advisor/ProfessionAl Use only—it is not intended for PrivAte investors
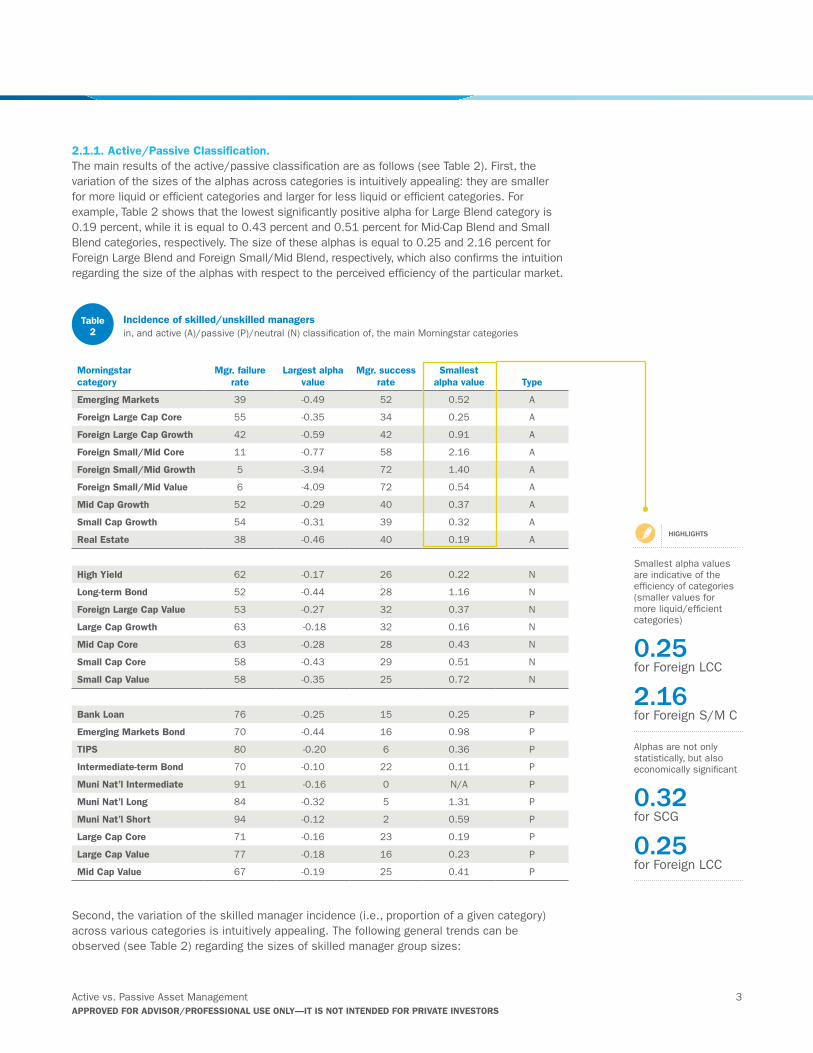
2.1.1. Active/Passive Classification. The main results of the active/passive classification are as follows (see Table 2). First, the variation of the sizes of the alphas across categories is intuitively appealing: they are smaller for more liquid or efficient categories and larger for less liquid or efficient categories. For example, Table 2 shows that the lowest significantly positive alpha for Large Blend category is 0.19 percent, while it is equal to 0.43 percent and 0.51 percent for Mid-Cap Blend and Small Blend categories, respectively. The size of these alphas is equal to 0.25 and 2.16 percent for Foreign Large Blend and Foreign Small/Mid Blend, respectively, which also confirms the intuition regarding the size of the alphas with respect to the perceived efficiency of the particular market.
Second, the variation of the skilled manager incidence (i.e., proportion of a given category) across various categories is intuitively appealing. The following general trends can be observed (see Table 2) regarding the sizes of skilled manager group sizes:
Morningstar category
Mgr. failure rate
largest alpha value
Mgr. success rate
smallest alpha value type
emerging Markets 39 -0.49 52 0.52 A
foreign large Cap Core 55 -0.35 34 0.25 A
foreign large Cap Growth 42 -0.59 42 0.91 A
foreign small/Mid Core 11 -0.77 58 2.16 A
foreign small/Mid Growth 5 -3.94 72 1.40 A
foreign small/Mid value 6 -4.09 72 0.54 A
Mid Cap Growth 52 -0.29 40 0.37 A
small Cap Growth 54 -0.31 39 0.32 A
real estate 38 -0.46 40 0.19 A
High yield 62 -0.17 26 0.22 N
long-term Bond 52 -0.44 28 1.16 N
foreign large Cap value 53 -0.27 32 0.37 N
large Cap Growth 63 -0.18 32 0.16 N
Mid Cap Core 63 -0.28 28 0.43 N
small Cap Core 58 -0.43 29 0.51 N
small Cap value 58 -0.35 25 0.72 N
Bank loan 76 -0.25 15 0.25 P
emerging Markets Bond 70 -0.44 16 0.98 P
tiPs 80 -0.20 6 0.36 P
intermediate-term Bond 70 -0.10 22 0.11 P
Muni nat’l intermediate 91 -0.16 0 N/A P
Muni nat’l long 84 -0.32 5 1.31 P
Muni nat’l short 94 -0.12 2 0.59 P
large Cap Core 71 -0.16 23 0.19 P
large Cap value 77 -0.18 16 0.23 P
Mid Cap value 67 -0.19 25 0.41 P
highlights
Smallest alpha values are indicative of the efficiency of categories (smaller values for more liquid/efficient categories)
0.25 for Foreign LCC
2.16 for Foreign S/M C
Alphas are not only statistically, but also economically significant
0.32 for SCG
0.25 for Foreign LCC
table 2
incidence of skilled/unskilled managersin, and active (A)/passive (P)/neutral (N) classification of, the main Morningstar categories
4 Active vs. Passive Asset ManagementAPProved for Advisor/ProfessionAl Use only—it is not intended for PrivAte investors
• They are generally larger for equity categories than for fixed income categories.• They are generally larger for the growth than for value categories (for both domestic and
foreign equity).• They are generally larger for foreign small than for foreign large/mid categories.• They are generally larger for foreign than for domestic equity.• The size of the group of skilled managers for muni bonds and TIPS is close to zero.
Third, the alphas of the skilled group of managers are not only statistically, but also economically significant. Since the return data is net of fees, the estimated alphas reflect the relevant outperformance of a fund over a benchmark. For example, for the whole time period, the lowest alpha for the skilled group in Small Growth category is 0.32 percent per year, while for the Foreign Large Cap Core category it is 0.25 percent per year (see Table 2).
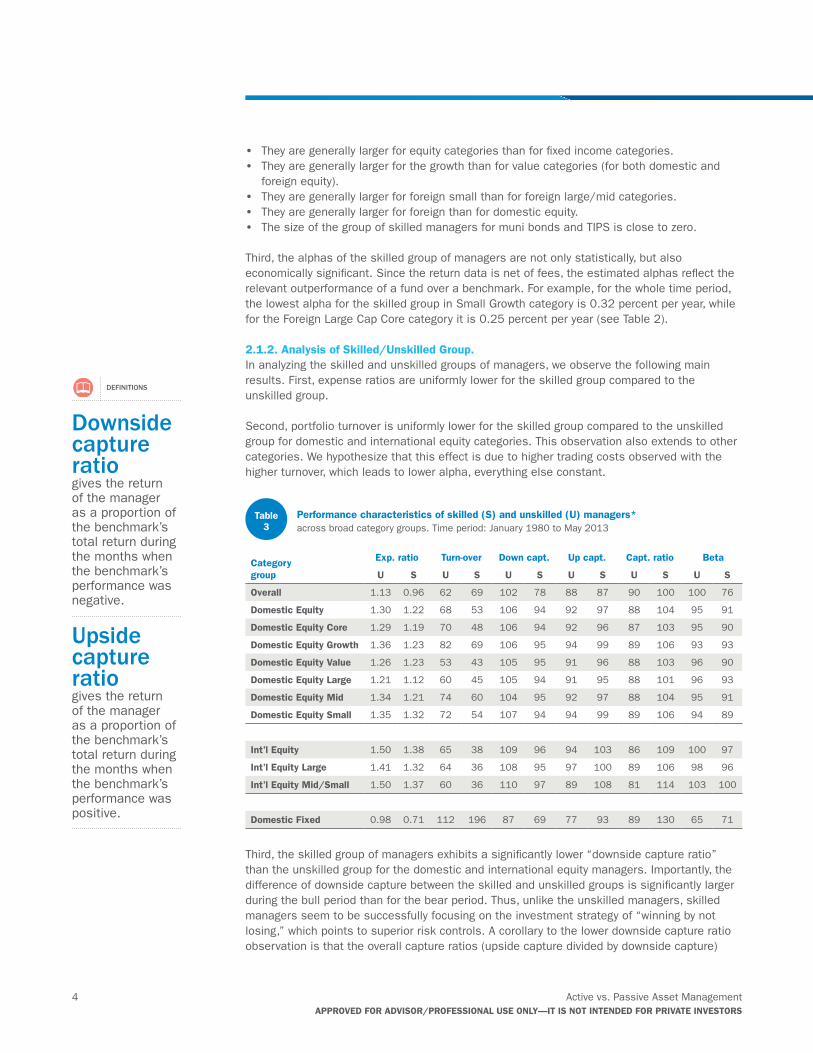
2.1.2. Analysis of skilled/Unskilled Group. In analyzing the skilled and unskilled groups of managers, we observe the following main results. First, expense ratios are uniformly lower for the skilled group compared to the unskilled group.
Second, portfolio turnover is uniformly lower for the skilled group compared to the unskilled group for domestic and international equity categories. This observation also extends to other categories. We hypothesize that this effect is due to higher trading costs observed with the higher turnover, which leads to lower alpha, everything else constant.
Third, the skilled group of managers exhibits a significantly lower “downside capture ratio” than the unskilled group for the domestic and international equity managers. Importantly, the difference of downside capture between the skilled and unskilled groups is significantly larger during the bull period than for the bear period. Thus, unlike the unskilled managers, skilled managers seem to be successfully focusing on the investment strategy of “winning by not losing,” which points to superior risk controls. A corollary to the lower downside capture ratio observation is that the overall capture ratios (upside capture divided by downside capture)
Category group
exp. ratio turn-over down capt. Up capt. Capt. ratio Beta
U s U s U s U s U s U s
overall 1.13 0.96 62 69 102 78 88 87 90 100 100 76
domestic equity 1.30 1.22 68 53 106 94 92 97 88 104 95 91
domestic equity Core 1.29 1.19 70 48 106 94 92 96 87 103 95 90
domestic equity Growth 1.36 1.23 82 69 106 95 94 99 89 106 93 93
domestic equity value 1.26 1.23 53 43 105 95 91 96 88 103 96 90
domestic equity large 1.21 1.12 60 45 105 94 91 95 88 101 96 93
domestic equity Mid 1.34 1.21 74 60 104 95 92 97 88 104 95 91
domestic equity small 1.35 1.32 72 54 107 94 94 99 89 106 94 89
int’l equity 1.50 1.38 65 38 109 96 94 103 86 109 100 97
int’l equity large 1.41 1.32 64 36 108 95 97 100 89 106 98 96
int’l equity Mid/small 1.50 1.37 60 36 110 97 89 108 81 114 103 100
domestic fixed 0.98 0.71 112 196 87 69 77 93 89 130 65 71
table 3
Performance characteristics of skilled (s) and unskilled (U) managers*across broad category groups. Time period: January 1980 to May 2013
definitions
Downside capture ratio gives the return of the manager as a proportion of the benchmark’s total return during the months when the benchmark’s performance was negative.
Upside capture ratio gives the return of the manager as a proportion of the benchmark’s total return during the months when the benchmark’s performance was positive.
Active vs. Passive Asset Management 5APProved for Advisor/ProfessionAl Use only—it is not intended for PrivAte investors
are higher for the skilled group. This holds uniformly across all time periods, for domestic, international equity, as well as most other categories.
As a side note, our results confirm those from Kosowski (2011), that the average active manager outperforms in periods of recession and high volatility and dispersion. Our research adds more detail to this observation. Namely, it is true that the performance of the average manager (in terms of active return and alpha) is much better in the bear periods compared to bull periods. However, it turns out that the active unskilled manager does (a little) worse in bear markets than bull markets, but the active skilled manager does (a lot) better in bear markets than in bull markets, in active return and CAPM alpha terms (see Table 3).
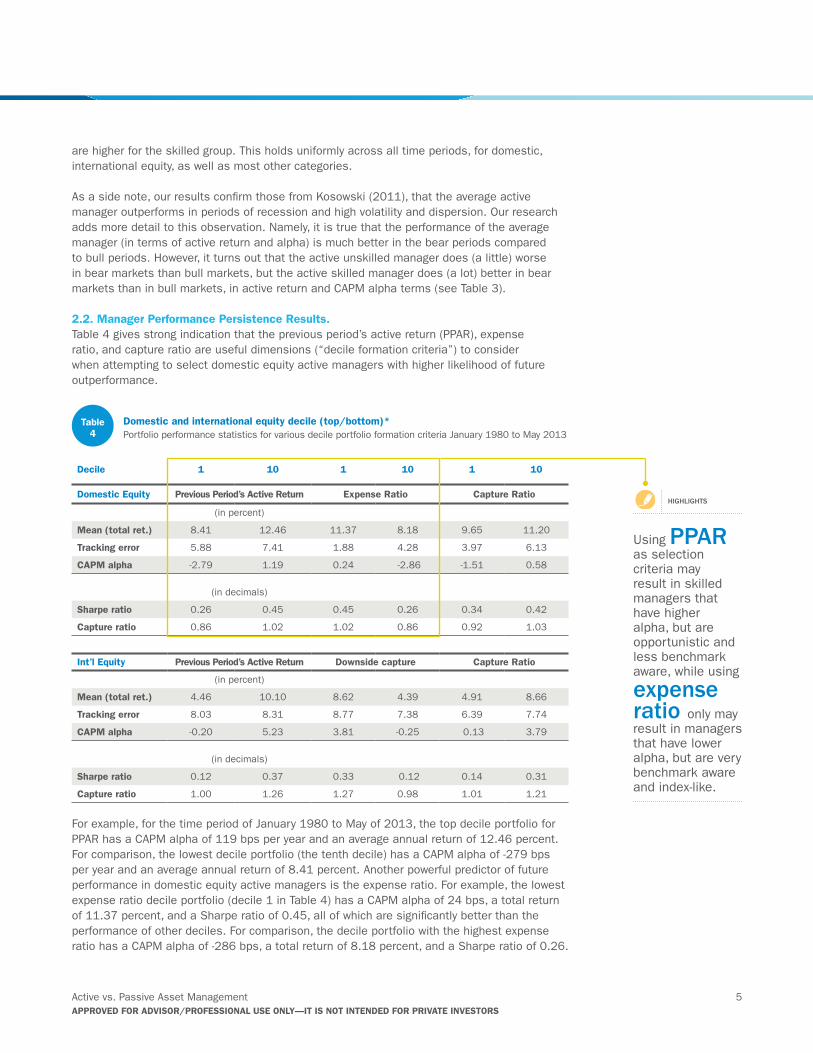
2.2. Manager Performance Persistence results. Table 4 gives strong indication that the previous period’s active return (PPAR), expense ratio, and capture ratio are useful dimensions (“decile formation criteria”) to consider when attempting to select domestic equity active managers with higher likelihood of future outperformance.
For example, for the time period of January 1980 to May of 2013, the top decile portfolio for PPAR has a CAPM alpha of 119 bps per year and an average annual return of 12.46 percent. For comparison, the lowest decile portfolio (the tenth decile) has a CAPM alpha of -279 bps per year and an average annual return of 8.41 percent. Another powerful predictor of future performance in domestic equity active managers is the expense ratio. For example, the lowest expense ratio decile portfolio (decile 1 in Table 4) has a CAPM alpha of 24 bps, a total return of 11.37 percent, and a Sharpe ratio of 0.45, all of which are significantly better than the performance of other deciles. For comparison, the decile portfolio with the highest expense ratio has a CAPM alpha of -286 bps, a total return of 8.18 percent, and a Sharpe ratio of 0.26.
decile 1 10 1 10 1 10
domestic equity Previous Period’s Active return expense ratio Capture ratio
(in percent)
Mean (total ret.) 8.41 12.46 11.37 8.18 9.65 11.20
tracking error 5.88 7.41 1.88 4.28 3.97 6.13
CAPM alpha -2.79 1.19 0.24 -2.86 -1.51 0.58
(in decimals)
sharpe ratio 0.26 0.45 0.45 0.26 0.34 0.42
Capture ratio 0.86 1.02 1.02 0.86 0.92 1.03
int’l equity Previous Period’s Active return downside capture Capture ratio
(in percent)
Mean (total ret.) 4.46 10.10 8.62 4.39 4.91 8.66
tracking error 8.03 8.31 8.77 7.38 6.39 7.74
CAPM alpha -0.20 5.23 3.81 -0.25 0.13 3.79
(in decimals)
sharpe ratio 0.12 0.37 0.33 0.12 0.14 0.31
Capture ratio 1.00 1.26 1.27 0.98 1.01 1.21
table 4
domestic and international equity decile (top/bottom)*Portfolio performance statistics for various decile portfolio formation criteria January 1980 to May 2013
highlights
Using PPAR as selection criteria may result in skilled managers that have higher alpha, but are opportunistic and less benchmark aware, while using
expense ratio only may result in managers that have lower alpha, but are very benchmark aware and index-like.
6 Active vs. Passive Asset ManagementAPProved for Advisor/ProfessionAl Use only—it is not intended for PrivAte investors
When comparing the top performing deciles for PPAR and expense ratio decile formation criteria, the results suggest that the types of managers selected by these criteria are those skilled managers, who are opportunistic and less benchmark aware, while the managers selected by the expense ratio criterion are very benchmark aware and index-like.
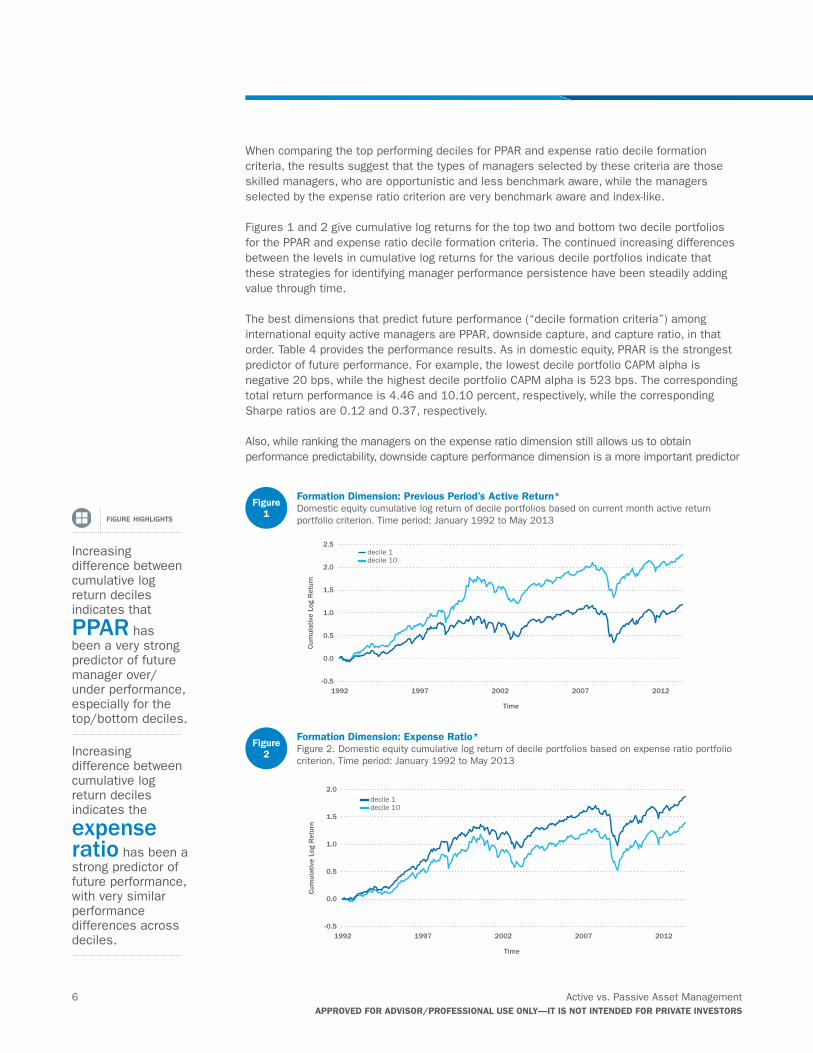
Figures 1 and 2 give cumulative log returns for the top two and bottom two decile portfolios for the PPAR and expense ratio decile formation criteria. The continued increasing differences between the levels in cumulative log returns for the various decile portfolios indicate that these strategies for identifying manager performance persistence have been steadily adding value through time.
The best dimensions that predict future performance (“decile formation criteria”) among international equity active managers are PPAR, downside capture, and capture ratio, in that order. Table 4 provides the performance results. As in domestic equity, PRAR is the strongest predictor of future performance. For example, the lowest decile portfolio CAPM alpha is negative 20 bps, while the highest decile portfolio CAPM alpha is 523 bps. The corresponding total return performance is 4.46 and 10.10 percent, respectively, while the corresponding Sharpe ratios are 0.12 and 0.37, respectively.
Also, while ranking the managers on the expense ratio dimension still allows us to obtain performance predictability, downside capture performance dimension is a more important predictor
-0.5
0.0
0.5
1.0
1.5
2.0
2.5
20122007200219971992
Cum
ulat
ive
Log
Ret
urn
Time
decile 1 decile 10
-0.5
0.0
0.5
1.0
1.5
2.0
20122007200219971992
Cum
ulat
ive
Log
Ret
urn
Time
decile 1 decile 10
figure highlights
Increasing difference between cumulative log return deciles indicates that
PPAR has been a very strong predictor of future manager over/under performance, especially for the top/bottom deciles.
Increasing difference between cumulative log return deciles indicates the
expense ratio has been a strong predictor of future performance, with very similar performance differences across deciles.
figure 1
formation dimension: Previous Period’s Active return*Domestic equity cumulative log return of decile portfolios based on current month active return portfolio criterion. Time period: January 1992 to May 2013
figure 2
formation dimension: expense ratio*Figure 2. Domestic equity cumulative log return of decile portfolios based on expense ratio portfolio criterion. Time period: January 1992 to May 2013
Active vs. Passive Asset Management 7APProved for Advisor/ProfessionAl Use only—it is not intended for PrivAte investors
for the international equity managers than for the domestic equity managers (see Table 4). This suggests that having proper risk controls that deliver lower downside capture are crucial in the international equity manager space. For example, CAPM alpha for the lowest downside capture decile portfolio is 381 bps, while it is equal to negative 25 bps for the highest downside capture decile portfolio. The corresponding Sharpe ratios are 0.33 and 0.12.
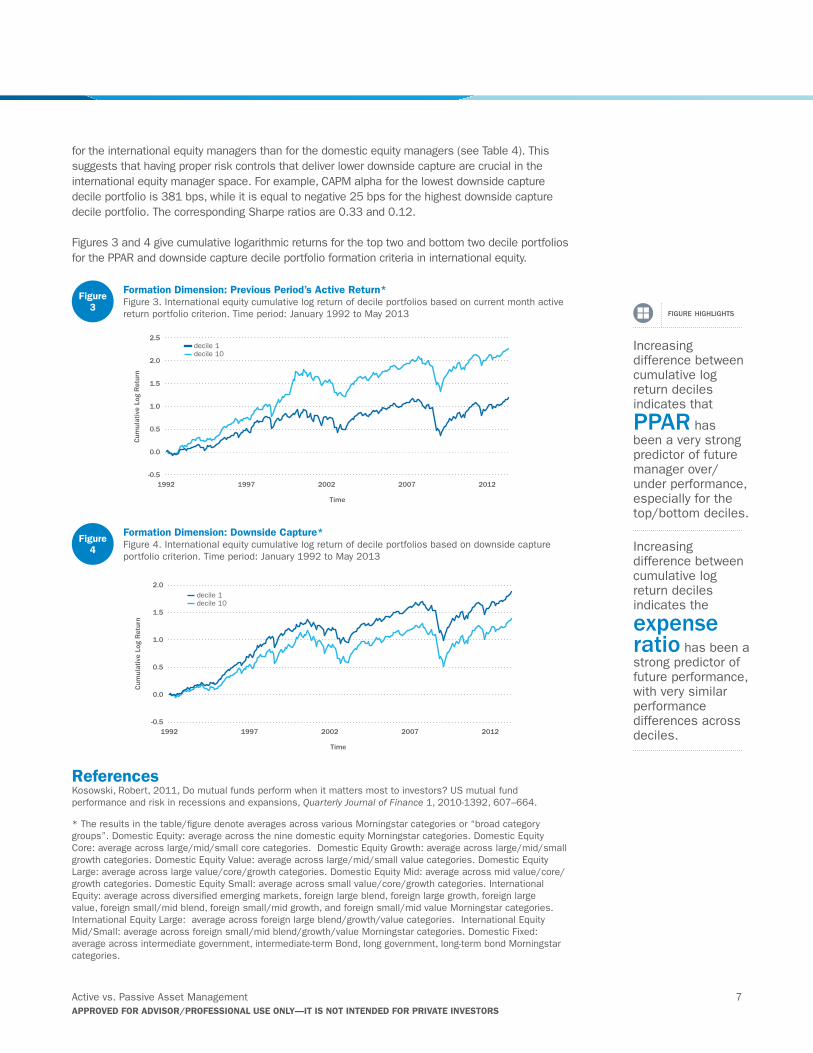
Figures 3 and 4 give cumulative logarithmic returns for the top two and bottom two decile portfolios for the PPAR and downside capture decile portfolio formation criteria in international equity.
referencesKosowski, Robert, 2011, Do mutual funds perform when it matters most to investors? US mutual fund performance and risk in recessions and expansions, Quarterly Journal of Finance 1, 2010-1392, 607–664.
* The results in the table/figure denote averages across various Morningstar categories or “broad category groups”. Domestic Equity: average across the nine domestic equity Morningstar categories. Domestic Equity Core: average across large/mid/small core categories. Domestic Equity Growth: average across large/mid/small growth categories. Domestic Equity Value: average across large/mid/small value categories. Domestic Equity Large: average across large value/core/growth categories. Domestic Equity Mid: average across mid value/core/growth categories. Domestic Equity Small: average across small value/core/growth categories. International Equity: average across diversified emerging markets, foreign large blend, foreign large growth, foreign large value, foreign small/mid blend, foreign small/mid growth, and foreign small/mid value Morningstar categories. International Equity Large: average across foreign large blend/growth/value categories. International Equity Mid/Small: average across foreign small/mid blend/growth/value Morningstar categories. Domestic Fixed: average across intermediate government, intermediate-term Bond, long government, long-term bond Morningstar categories.
-0.5
0.0
0.5
1.0
1.5
2.0
2.5
20122007200219971992
Cum
ulat
ive
Log
Ret
urn
Time
decile 1 decile 10
-0.5
0.0
0.5
1.0
1.5
2.0
20122007200219971992
Cum
ulat
ive
Log
Ret
urn
Time
decile 1 decile 10
figure highlights
Increasing difference between cumulative log return deciles indicates that
PPAR has been a very strong predictor of future manager over/under performance, especially for the top/bottom deciles.
Increasing difference between cumulative log return deciles indicates the
expense ratio has been a strong predictor of future performance, with very similar performance differences across deciles.
figure 3
formation dimension: Previous Period’s Active return*Figure 3. International equity cumulative log return of decile portfolios based on current month active return portfolio criterion. Time period: January 1992 to May 2013
figure 4
formation dimension: downside Capture*Figure 4. International equity cumulative log return of decile portfolios based on downside capture portfolio criterion. Time period: January 1992 to May 2013

The information, analysis, and opinions expressed herein are for general and educational purposes only. Nothing contained in this document is intended to constitute legal, tax, accounting, securities, or investment advice, nor an opinion regarding the appropriateness of any investment, nor a solicitation of any type. All investments carry a certain risk, and there is no assurance that an investment will provide positive performance over any period of time. An investor may experience loss of principal. Investment decisions should always be made based on the investors specific financial needs and objectives, goals, time horizon, and risk tolerance. The asset classes and/or investment strategies described may not be suitable for all investors and investors should consult with an investment advisor to determine the appropriate investment strategy. Past performance is not indicative of future results.
APProved for Advisor/ProfessionAl Use only—it is not intended for PrivAte investors
© 2014 Envestnet. All rights reserved. PMC-AP-0114