Active and passive fluxes of carbon, nitrogen, and ...
22
Biogeosciences, 18, 5141–5162, 2021 https://doi.org/10.5194/bg-18-5141-2021 © Author(s) 2021. This work is distributed under the Creative Commons Attribution 4.0 License. Active and passive fluxes of carbon, nitrogen, and phosphorus in the northern South China Sea Jia-Jang Hung, Ching-Han Tung, Zong-Ying Lin, Yuh-ling Lee Chen, Shao-Hung Peng, Yen-Huei Lin, and Li-Shan Tsai Department of Oceanography, National Sun Yat-sen University, Kaohsiung, Taiwan Correspondence: Jia-Jang Hung ([email protected]) Received: 27 January 2021 – Discussion started: 21 April 2021 Revised: 20 August 2021 – Accepted: 23 August 2021 – Published: 20 September 2021 Abstract. This paper presents the measured active and passive fluxes of carbon (C), nitrogen (N), and phospho- rus (P) and their response to seasonal and event-driven oceanographic changes in the northern South China Sea (NSCS). The total vertical flux of carbon (TFC) is de- fined as the sum of active and passive fluxes of biogenic carbon in the surface layer, which may be considered as the central part of marine carbon cycle. These active and passive fluxes of N and P were also considered to understand stoichiometric flux patterns and the roles of nutrients involved in the TFC. The magnitudes of total C, N, and P fluxes were, respectively, estimated to be 71.9–347 (mean ± SD, 163 ± 70) mg C m -2 d -1 , 13.0–30.5 (21.2.± 4.9) mg N m -2 d -1 , and 1.02–2.97 (1.94 ± 0.44) mg P m -2 d -1 , which were higher than most previously reported vertical fluxes in open oceans, likely because a quarter of the fluxes was contributed from active fluxes that were unaccounted for in vertical fluxes previously. Moreover, the passive fluxes dominated the total vertical fluxes and were estimated to be 65.3–255 (125 ± 64.9) mg C m -2 d -1 (77 ± 52 % of total C flux), 11.9– 23.2 (17.6 ± 4.2) mg N m -2 d -1 (83 ± 28 % of total N flux), and 0.89–1.98 (1.44 ± 0.33) mg P m -2 d -1 (74 ± 24 % of total P flux). Vertical fluxes of dissolved organic C, N, and P were small (< 5 %) relative to passive fluxes. The contrasting patterns of active and passive fluxes found between summer and winter could mainly be attributed to surface warming and stratification in summer and cooling and wind-induced turbulence for pumping nutrients into the euphotic zone in winter. In addition to seasonal variations, the impact of anticyclonic eddies and internal-wave events on enhancing active and passive fluxes was apparent in the NSCS. Both active and passive fluxes were likely driven by nutrient availability within the euphotic zone, which was ultimately controlled by the changes in internal and external forcings. The nutrient availability also determined the inventory of chlorophyll a and new production, thereby allowing the estimates of active and passive fluxes for unmeasured events. To a first approximation, the South China Sea (SCS) may effectively transfer 0.208 ± 0.089 Gt C yr -1 into the ocean’s interior, accounting for approximately 1.89 ± 0.81 % of the global C flux. The internal forcing and climatic conditions are likely critical factors in determining the seasonal and event-driven variability of total vertical fluxes in the NSCS. 1 Introduction It is widely recognized that the global ocean may have ab- sorbed anthropogenic CO 2 as large as 50 % of total release to the atmosphere since the industrial revolution began in the middle of 18th century (Sabine et al., 2004). The uptake of atmospheric CO 2 by oceans was carried out mainly through the physical pump and biological pump (BP), and both pro- cesses played key roles in removing carbon from the surface to deep layers of oceans (Ducklow et al., 2001; Boyd et al., 2019). The physical pump was regarded as the dissolution of atmospheric CO 2 into the ocean and then transported into deep oceans through global circulation (Feely et al., 2001; Toggweiler et al., 2003). The previously reported BP con- sisted of active and passive fluxes of organic carbon synthe- sized in the euphotic zone and transported out of the surface through zooplankton migration mediation and gravitational particle settling, respectively, after escaping from respira- Published by Copernicus Publications on behalf of the European Geosciences Union.
Transcript of Active and passive fluxes of carbon, nitrogen, and ...

Biogeosciences, 18, 5141–5162, 2021https://doi.org/10.5194/bg-18-5141-2021© Author(s) 2021. This work is distributed underthe Creative Commons Attribution 4.0 License.
Active and passive fluxes of carbon, nitrogen, and phosphorusin the northern South China SeaJia-Jang Hung, Ching-Han Tung, Zong-Ying Lin, Yuh-ling Lee Chen, Shao-Hung Peng, Yen-Huei Lin, andLi-Shan TsaiDepartment of Oceanography, National Sun Yat-sen University, Kaohsiung, Taiwan
Correspondence: Jia-Jang Hung ([email protected])
Received: 27 January 2021 – Discussion started: 21 April 2021Revised: 20 August 2021 – Accepted: 23 August 2021 – Published: 20 September 2021
Abstract. This paper presents the measured active andpassive fluxes of carbon (C), nitrogen (N), and phospho-rus (P) and their response to seasonal and event-drivenoceanographic changes in the northern South China Sea(NSCS). The total vertical flux of carbon (TFC) is de-fined as the sum of active and passive fluxes of biogeniccarbon in the surface layer, which may be consideredas the central part of marine carbon cycle. These activeand passive fluxes of N and P were also considered tounderstand stoichiometric flux patterns and the rolesof nutrients involved in the TFC. The magnitudes oftotal C, N, and P fluxes were, respectively, estimatedto be 71.9–347 (mean±SD, 163± 70) mgCm−2 d−1,13.0–30.5 (21.2.± 4.9) mgNm−2 d−1, and 1.02–2.97(1.94± 0.44) mgP m−2 d−1, which were higher thanmost previously reported vertical fluxes in open oceans,likely because a quarter of the fluxes was contributedfrom active fluxes that were unaccounted for in verticalfluxes previously. Moreover, the passive fluxes dominatedthe total vertical fluxes and were estimated to be 65.3–255(125± 64.9) mgC m−2 d−1 (77± 52 % of total C flux), 11.9–23.2 (17.6± 4.2) mgNm−2 d−1 (83± 28 % of total N flux),and 0.89–1.98 (1.44± 0.33) mgPm−2 d−1 (74± 24 % oftotal P flux). Vertical fluxes of dissolved organic C, N, and Pwere small (< 5 %) relative to passive fluxes. The contrastingpatterns of active and passive fluxes found between summerand winter could mainly be attributed to surface warmingand stratification in summer and cooling and wind-inducedturbulence for pumping nutrients into the euphotic zonein winter. In addition to seasonal variations, the impact ofanticyclonic eddies and internal-wave events on enhancingactive and passive fluxes was apparent in the NSCS. Both
active and passive fluxes were likely driven by nutrientavailability within the euphotic zone, which was ultimatelycontrolled by the changes in internal and external forcings.The nutrient availability also determined the inventory ofchlorophyll a and new production, thereby allowing theestimates of active and passive fluxes for unmeasured events.To a first approximation, the South China Sea (SCS) mayeffectively transfer 0.208± 0.089 GtCyr−1 into the ocean’sinterior, accounting for approximately 1.89± 0.81 % of theglobal C flux. The internal forcing and climatic conditionsare likely critical factors in determining the seasonal andevent-driven variability of total vertical fluxes in the NSCS.
1 Introduction
It is widely recognized that the global ocean may have ab-sorbed anthropogenic CO2 as large as 50 % of total releaseto the atmosphere since the industrial revolution began in themiddle of 18th century (Sabine et al., 2004). The uptake ofatmospheric CO2 by oceans was carried out mainly throughthe physical pump and biological pump (BP), and both pro-cesses played key roles in removing carbon from the surfaceto deep layers of oceans (Ducklow et al., 2001; Boyd et al.,2019). The physical pump was regarded as the dissolutionof atmospheric CO2 into the ocean and then transported intodeep oceans through global circulation (Feely et al., 2001;Toggweiler et al., 2003). The previously reported BP con-sisted of active and passive fluxes of organic carbon synthe-sized in the euphotic zone and transported out of the surfacethrough zooplankton migration mediation and gravitationalparticle settling, respectively, after escaping from respira-
Published by Copernicus Publications on behalf of the European Geosciences Union.

5142 J.-J. Hung et al.: Active and passive fluxes of C, N, and P in the northern South China Sea
tion and grazing processes in the ocean surface (Falkowski,1998; Ducklow et al., 2001; Sarmiento and Gruber, 2006;Passow and Carlson, 2012; Steinberg et al., 2000; Steinbergand Landry, 2017; Archibald et al., 2019). The vertical dif-fusion flux of dissolved organic carbon (DOC) produced inthe surface has also been thought of as a part of passiveflux (Ducklow et al., 2001; Steinberg and Landry, 2017).The BP was commonly regarded as an efficient process indownward transfer and storage of carbon dioxide and a crit-ical one in determining the oceanic carbon cycle and bud-get (Ducklow et al., 2001; Sarmiento and Gruber, 2006; De-Vries et al., 2012; Sander et al., 2014). Thus, Turner (2015)pointed out the BP as one of the most important carbon-involved processes in the world. Without the BP that exports∼ 5 GtCyr−1 to the mesopelagic zone, the atmospheric CO2level would be much higher than it is today (Parekh et al.,2006; Cavan et al., 2019). Additionally, there was a wideconsensus that the marginal sea plays an important role inmodulating the global carbon cycling and fates (Walsh, 1991;Liu et al., 2002, 2010; Thomas et al., 2004; Chen and Borges,2009; Dai et al., 2013). Thus, the investigation of active andpassive fluxes in the large marginal sea appears to be impor-tant in increasing our understanding of the global context ofoceanic carbon cycling and budgets.
Although the passive transport has long been assumed asthe most important process in the transport of carbon fromthe surface to deep oceans, the active transport has been con-sidered as an important part of total vertical flux of carbon(TFC) showing a substantial proportion (10 %–30 %) of sink-ing flux in a variety of oceanographic regimes after 1990s(Longhurst et al., 1989; Dam et al., 1995; Steinberg et al.,2000; Bianchi et al., 2013). This active transport is importantin sustaining the metabolic requirement of the mesopelagiccommunity through providing for the partial energy demandof the mesopelagic ecosystem (Robinson et al., 2010; Stein-berg et al., 2008; Burd et al., 2010). Previous studies alsoshowed an imbalance between the heterotrophic activity inmesopelagic waters and the estimates of carbon suppliedby sinking particulate organic carbon (POC), suggesting theimportance of diel vertical migration (DVM) of zooplank-ton and micronekton in supplying additional demands formicrobial growth and respiration in the mesopelagic zone(Reinthaler et al., 2006; Boyd and Trull, 2007; Steinberget al., 2008; Baltar et al., 2009; Boyd et al., 2019). Duck-low et al. (2001) and Passow and Carlson (2012) have drawna whole picture of BP illustrating and deciphering the con-cept and processes of active, passive, and DOC fluxes indrawing down atmospheric CO2 and moving various carbonforms from the euphotic zone into the aphotic zone. Althoughless well documented, the contribution of DOC vertical fluxto TFC may not be totally neglected particularly in olig-otrophic or desert oceans. Previous studies have shown thatDOC fluxes may contribute approximately 20 %–50 % of to-tal Corg fluxes derived from new production in marginal seasand open oceans (Copin-Montégut and Avril, 1993; Hansell
and Carlson, 1998, 2001; Avril, 2002; Hung et al., 2007;Steinberg and Landry, 2017).
Regarding the determination of passive carbon fluxes, sed-iment traps have been widely used so far to measure the ver-tical fluxes of POC in various regimes of the ocean (Honjoet al., 2008; Guidi et al., 2015), although they were subject todebates on precision issues (Gardner, 2000; Buesseler et al.,2007; Burd et al., 2010). Different approaches may includecarbon and nutrient budget derivation in the euphotic zone,hydrodynamic-ecosystem model, and 234Th-POC simulationand modeling (Berelson, 2001; Ducklow et al., 2001; Bues-seler et al., 2009), but they also have certain limitations andwill not be discussed here. In terms of active transport, us-ing net captures during daytime and nighttime for samplingDVM zooplankton and micronekton remained the most pop-ular method in estimating active fluxes of carbon and relatedconstituents (Longhurst et al., 1989; Dam et al., 1995; Stein-berg et al., 2000, 2008; Hannides et al., 2009; Takahashiet al., 2009; Yebra et al., 2018). DVM represented the dailyascent of zooplankton and micronekton into the upper layerat dusk and decent into the mesopelagic zone approximatelywithin 600 m at dawn (Dam et al., 1995; Bianchi et al., 2013).For the reliable estimates of DOC vertical fluxes followingthe surface accumulation and physical transport may not bea simple work. Hansell and Carlson (2001) and Baetge et al.(2020) have employed the seasonal difference of DOC inven-tory within surface layers to derive the DOC fluxes throughthe specified depth (e.g., 100 m). Copin-Montégut and Avril(1993) may be the first study employing the Fickian-like dif-fusion law to estimate the DOC vertical flux across a strati-fied prevailing system.
The South China Sea (SCS) is the largest marginal sea inthe world and covers a variety of oceanographic domains in-cluding large estuaries, shelf, slope, and a deep central basin(see Fig. 1), ranging from< 100 to∼ 5000 m in depth (Shawand Chao, 1994). The northern SCS (NSCS) experiences astrong monsoon influence, and the surface circulation is gen-erally clockwise during winter due to prevailing of northeast-erly monsoon and anti-clockwise during summer resultingfrom prevailing southwesterly monsoon (Wyrtki, 1961, Shawand Chao, 1994; Hu et al., 2000). As a result, the physical andbiogeochemical conditions of NSCS were profoundly influ-enced by seasonal changes of climatic forcing and terrestrialinputs (Shaw and Chao, 1994; Dai et al., 2013). The NSCS isalso a hot spot of internal waves generated in the Luzon Straitand transport westward from the Luzon Strait to the Dong-sha Atoll continental shelf, causing significant impacts on theDongsha Atoll-associated environments following internal-wave dissipation and shoaling events (Wang et al., 2007, Liand Farmer, 2011; Alford et al., 2015). Therefore, the verti-cal transfers of C, N, and P may vary temporally and spatiallyunder the impacts of atmospheric and oceanic forcings in theNSCS. Although many reports have shown a balance or atiny physical pump of carbon dioxide in most oligotrophicregions (Zhai et al., 2005, 2013; Dai et al., 2013), very few
Biogeosciences, 18, 5141–5162, 2021 https://doi.org/10.5194/bg-18-5141-2021

J.-J. Hung et al.: Active and passive fluxes of C, N, and P in the northern South China Sea 5143
Figure 1. Maps of the study area and sampling stations. The sam-pling stations were located mainly in deep-water regions, except forthe shallow stations (stations 7 and 10) close to the Dongsha Atoll.All stations were renamed numerically to avoid confusion with thenames originally used in different cruises. For seasonal and spatialcomparison, the sampling stations were grouped into two domains,one located in the upper NSCS and one located in the central basinrepresented by the SEATS (11) station. SEATS denotes the South-east Asian Time-series Study station in NSCS.
studies have measured C, N, and P transfers from the sur-face to the ocean’s interior. Apparently, the study of activeand passive fluxes is essential and urgent to realize the cur-rent conditions and processes of carbon fluxes in the NSCS.Thus, our ultimate goals focus primarily on understandingthe current strengths of active and passive fluxes and theircontrolling mechanisms in the oligotrophic NSCS.
2 Materials and methods
2.1 Study area and sampling locations
Figure 1 depicts the study area and sampling stations whichare located on various domains in the NSCS. Except for sta-tions located on the Dongsha Atoll-associated shelf and up-per slope under the influence of internal-wave events, mostsampling stations were located on lower slope and basin re-gions. To avoid confusion for different names on the samelocation in different expeditions, the sampling stations wererenamed numerically (stations 1–11) to clearly distinguishthem among locations and expeditions (Table 1). Station 11is the Southeast Asian Time-series Study (SEATS) station inthe NSCS.
2.2 Sampling procedures and analytical methods forseawater samples
Seawater samplings and electronic data retrieval were carriedout on board R/V Ocean Researcher I (ORI-1039, ORI-1059,ORI-1074, and ORI-1082) and R/V Ocean Researcher III(ORIII-1073, ORIII-1184, and ORIII-1214) (Table 1). Sea-water samples were collected using a cleaned Niskin bot-tle (20 L) mounted on a CTD/rosette from six light pene-tration depths (100 %, 46 %, 38 %, 13 %, 5 % and 0.6 %) inthe euphotic zone and from various depths in the aphoticzone in each station to determine hydrological and biogeo-chemical parameters. Seawater temperature (T ), salinity (S),depth, and fluorescence were recorded with CTD and at-tached probes. Surface and subsurface irradiances were mea-sured with a PAR sensor (OSP2001, Biospherical Instru-ment, San Diego, USA). The scientific echo sounder (Sim-rad EK60) including 38 and 120 kHz was used for record-ing the signals of diel migrators located at different depthsthroughout expeditions. The euphotic zone was recorded asthe depth at which light intensity was 0.6 % of surface irra-diation (Chen, 2005). The mixed layer depth was estimatedfrom a difference of potential density (< 0.125 kgm−3) be-tween that of the ocean surface and the bottom of the mixedlayer (Monterey and Levitus, 1997). The stratification index(SI) was defined as the averaged density difference (kgm−4)between the surface and a depth of 150 m (Chen et al., 2014).
The concentration of dissolved oxygen (DO) in retrievedseawater was determined immediately following a methodof direct spectrophotometry of total iodine (Pai et al.,1993). The content of chlorophyll a (Chl a) was deter-mined with a fluorometer (Turner Designs, model AU-10)according to the method of Welschmeyer (1994) after thefiltered particulates were extracted with 90 % acetone. De-pending on the concentration of particles, various volumes(1500–2500 mL) of duplicated seawater samples were fil-tered through pre-combusted (at 450 ◦C, 4 h) GF/F filters(diameter: 25 mm) to measure dissolved nutrients and dis-solved organic carbon (DOC) in filtrate and particulate or-ganic carbon (POC) in filtered particulates. Dissolved in-organic nitrogen (NO−2 +NO−3 , hereafter DIN) and phos-phate (PO3−
4 , hereafter DIP) and silicate (H4SiO4, here-after DSi) were determined colorimetrically (Grasshoff et al.,1983) with a UV–Vis spectrophotometer (Hitachi U-3310)equipped with a module of flow injection analysis for sub-surface and deep water samples. DIN and DIP in olig-otrophic surface samples were determined by the chemilu-minescent method (Garside, 1982; Hung et al., 2007) andmodified MAGIC method (Thomson-Bulldis and Karl, 1998;Hung et al., 2007), respectively. The averaged concentra-tions and inventories of Chl a, DIN and DIP in the eu-photic zone were estimated from the mean value and trape-zoidal integration of all determinants through the euphoticzone, respectively. DOC was measured using a method ofhigh-temperature catalytic oxidation via the Shimadzu TOC-
https://doi.org/10.5194/bg-18-5141-2021 Biogeosciences, 18, 5141–5162, 2021

5144 J.-J. Hung et al.: Active and passive fluxes of C, N, and P in the northern South China Sea
Table 1. Sampling locations and time periods during various cruises in the northern South China Sea. Sampling stations were renamednumerically, and sampling periods were also noted with the associated seasons/events.
Cruise Station (renamed) Longitude (E) Latitude (N) Sampling date Season (event)
ORI-1039 A (1) 119◦22.67′ 21◦04.08′ 8 Jun 2013 SummerB (2) 118◦23.86′ 21◦05.26′ 10 Jun 2013
ORI-1059 8A (3) 118◦45.08′ 21◦00.56′ 4 Dec 2013 Winter-Ina
7A (3)e 118◦10.04′ 20◦59.90′ 8 Dec 2013 Winter-Ina
B4 (4) 118◦00′ 20◦00′ 7 Dec 2013 Winter-Outb
ORI-1074 A (5) 117◦02.33′ 20◦07.22′ 19 May 2014 Later springB (6) 118◦29.71′ 21◦04.96′ 20 May 2014
ORIII-1773 S5 (7) 116◦57.15′ 20◦43.84′ 19 Jun 2014 Summer internal waves
ORI-1082 B (8) 118◦00.92′ 21◦18.47′ 12 Jul 2014 SummerC (9) 117◦15.88′ 21◦00.39′ 13 Jul 2014 SummerD (10) 116◦57.58′ 20◦45.00′ 15 Jul 2014 Summer internal waves
ORI-708 SEATS (11) 115◦59.99′ 17◦59.97′ 16 Feb 2004 Winterc
ORI-726 6 Aug 2004 Summerd
ORI-1184 12 Nov 2017 Fallf
ORI-1214 16 Nov 2018 Fallg
ORI-1240 22 Sep 2019 Fallg
a In (inside eddy). b Out (outside eddy). a,b Vertical POC fluxes were derived from integrated new productions due to failure of trap recovery.c Vertical POC fluxes were derived from integrated new productions without trap deployment. d Active POC fluxes were derived from DIN andchlorophyll a inventories in the euphotic zone. e Station 7A (close to 8A) only had an integrated new-production value to derive vertical POC flux,and its POC flux was averaged to the flux of Station 8A to represent the vertical POC flux within the eddy (Station 3). f Passive flux data only;active flux was derived from DIN and chlorophyll a inventories. g Active flux data only; passive fluxes were derived from chlorophyll a inventories.
5000A analyzer following the established procedures (Hunget al., 2007, 2008). The quality of DOC data was regularlymonitored using reference materials (41–44 µM C) providedby Dennis A. Hansell from the University of Miami. DONwas determined from the difference between dissolved in-organic nitrogen (DIN=NO−2 +NO−3 ) and total dissolvednitrogen (TDN) that was measured with the chemilumines-cence method using an instrument of Antek models 771/720(Hung et al., 2007, 2008). Dissolved organic phosphorus(DOP) was determined from the difference between DIP andtotal dissolved phosphorus (TDP) that was measured withUV-persulfate oxidation and colorimetric method (Ridal andMoore, 1990). The precision of TDN and TDP analyses wasbetter than± 7 % and± 5 %, respectively (Hung et al., 2007,2008).
POC and particulate nitrogen (PN) in filtered particulateswere determined with an elemental analyzer (Thermo Sci-entific Flash 2000) after removal of carbonate from particu-lates with 2 M HCl (Hung et al., 2007, 2008). The analyticalprecisions of POC and PN were generally <± 0.3 µM C(N)(± 1σ ), as evaluated from eight replica samples collectedfrom the same depth. Each biogeochemical parameter wasmeasured in triplicate ensuring the data quality of analysesin the laboratory (Hung et al., 2007, 2008).
2.3 Estimates of active fluxes of carbon, nitrogen andphosphorus
The active flux was determined by collecting diel migra-tors with a zooplankton net (NORPAC net, 200 µm mesh,d: 45 cm,L: 180 cm) coupled with a flow meter (Hydro-Bios,Germany) during three daytime (10:00–13:00) and night-time (22:00–01:00) plankton tows. The difference of inte-grated biomass profiles in the upper 200 m layer betweennight and day was regarded as an estimate of the zooplank-ton and micronekton migrant biomass. The zooplankton netwas towed obliquely under 1.5–2.5 knots through the up-per layer of 200 m in each sampling time. After collection,the collecting time and water volume were recorded and thezooplankton and micronekton samples were cleaned with insitu seawater followed by Milli-Q water and stored in sealedplastic bags. The samples were frozen immediately with liq-uid nitrogen and stored at −20 ◦C until further treatmentand analyses in the land-based laboratory. In the laboratory,the migrators were size fractionated according to the previ-ously reported methods (Hannides et al., 2009; Al-Mutairiand Landry, 2001) by passing through 0.2, 0.5, 1.0, 2.0, and5.0 mm sieves. Each size sample was equally split into twoparts for experimental purposes. One part was used for im-mediate analyses of Chl a and phaeopigment contents, andthe remainder was used for species identification (data notreported here) and numeration. The zooplankton and mi-
Biogeosciences, 18, 5141–5162, 2021 https://doi.org/10.5194/bg-18-5141-2021

J.-J. Hung et al.: Active and passive fluxes of C, N, and P in the northern South China Sea 5145
cronekton abundance (A, inds m−3) of each class was es-timated from total individuals (inds) divided by the flowedwater volume (V ). The other part was filtered through pre-weighed Nuclepore PC filter (5 µm, 47 mm) to determine thedry-weight (DW) biomass (mg m−3) of various planktonicsizes after drying filtered samples in an oven at 60 ◦C for 3 d.The total migrant biomass was defined by the sum of vari-ous sized migrant biomasses derived from the difference ofsized zooplankton–micronekton biomass between nighttimeand daytime tows. The body contents of organic C, N, andP were determined by measuring a specific amount of ho-mogenized dried biomass with same analytical proceduresdescribed in the next section for settling materials.
The total active flux reported here includes gut, ex-cretory, respiratory, and mortality fluxes by zooplanktonand micronekton (Hannides et al., 2009; Hernández-Leónet al., 2019). The gut carbon flux was converted fromgut Chl a flux (carbon/Chl a= 30, Vidal, 1980), and thegut Chl a flux was estimated from gut contents (gut con-tents=Chl a+ 1.5× [phaeopigment]) and gut clearance rateconstants (k, h−1) according to the methods of Dagg andWyman (1983) and Dam and Peterson (1988). The Chl aand phaeopigment contents in zooplankton and micronek-ton were determined by following the acidification method ofStrickland and Parsons (1972). The excretory fluxes of C, N,and P were defined as the fluxes of DOC, (DIN+DON), and(DIP+DOP), where DOC, DIN, DON, DIP, and DOP fluxeswere estimated from migrant DW biomass using empir-ical allometric relationships reported by Al-Mutairi andLandry (2001). The excretory rates of ammonia (EDIN,µgNind−1 h−1) and phosphate (EDIP, µgP ind−1 h−1) wereestimated according to Eqs. (1) and (2):
lnEDIN = − 2.8900+ 0.7616ln(DW)+ 0.0511T
(T is mean temperature at 300–500mdaytime seawater), (1)
lnEDIP = − 4.3489+ 0.7983ln(DW)+ 0.0285T
(T is mean temperature at 300–500mdaytime seawater). (2)
The magnitude of organic excretion by migrators was es-timated by assuming organic products represent a constantfraction of the total amount of waste by-products releasedby migrators at depths (Hannides et al., 2009). The fractionwas 0.24 for organic C (Steinberg et al., 2000), 0.53 for or-ganic N (Le Borgne and Roder, 1997), and 0.47 for organic P(Pomeroy et al., 1963). Thus, the excretory fluxes of dis-solved organic C, N, and P (mmol releasedm−2 d−1) can beestimated by the following equations (Eqs. 3–5):
EDON = 0.53/(1− 0.53)EDIN, (3)EDOP = 0.47/(1− 0.47)EDIP, (4)EDOC = 0.24/(1− 0.24)RDIC, (5)
where RDIC is respiratory CO2 rate(µgCO2 evolved ind−1 h−1) converted from the oxygen con-sumption rate (RO) (lnRO = −0.2512+ 0.7886ln(DW)+
0.0490T (Al-Mutairi and Landry, 2001)) assuming arespiratory quotient (RQ) of 0.80 (Hayward, 1980).
The respiratory flux was determined using the followingequation (Eq. 6) developed by Takahashi et al. (2009):
Fr = Ld ·Ni ·RCi, (6)
where Fr is the respiratory flux (mgCm−2 d−1), Ld is thelength of daytime (12 h), Ni is the abundance of migra-tors (indsm−2 d−1), and RCi is the carbon respiration rate(µgCind−1 h−1), which is calculated from the empirical re-lationship (RCi=RO ·RQ ·12/22.4; Takahashi et al., 2009).The mortality flux was estimated from the reported relation-ship Fm=Bi ·Mdeep, where Bi is migrant flux through 200 m(mgCm−2 d−1), and Mdeep is the mortality rate of migrators(assuming Mdeep= 0.01) (Takahashi et al., 2009).
2.4 Experiments on passive fluxes of organic carbon,nitrogen, and phosphorus
As an exclusive part of passive flux, the vertical fluxes ofsettling POC, PN, and particulate organic phosphorus (POP)were determined by using floating sediment traps for par-ticle collection followed by elemental analyses. The trapswere deployed generally for three depths (50, 100, 150 m)in a planned station for approximately 1–3 d, depending onthe oceanic condition and ship time availability, to collectsinking particles from upper layers. The sediment-trap ar-ray modified from Knauer et al. (1979) consists of twotrap sets made from eight plexiglass tubes (aspect ratio of9.53) attached to a polypropylene cross frame, similar tothose described by Wei et al. (1994), for the depth of 50and 100 m, and a commercial sediment trap (PARFLUXMark8-13, McLane, USA) for a depth of 150 m. All sam-ple tubes were filled with saline seawater to minimize theloss of collected sinking particles. However, no poisons wereadded to retard bacterial growth and decomposition. In theparticular area of the Dongsha Atoll-associated shelf, thePARFLUX trap was attached to the thermistic-fluorescencestring moored at the planned location. After collection, theparticulate matter was removed from the PC filter (polycar-bonate, 90 mm, pore size 0.4 µm) and washed with Milli-Qwater to remove sea salts. After removing swimmers, the par-ticulate matter was freeze-dried to determine settling fluxesof sinking particles and POC, PN, and POP. In an earlier ex-periment, vertical fluxes of POC at a depth of 120 m weremeasured through summer and winter by a deep-mooredtime-series trap (TECNICAP P.P.S. 3/3) deployed near theSEATS station (18◦19.661′ N, 115◦44.103′ E) following thedeployed method described in Hung et al. (1999) and Chungand Hung (2000).
POC and PN were analyzed by placing collected partic-ulate matter in a silver cup, and a few drops of 2 M HCl
https://doi.org/10.5194/bg-18-5141-2021 Biogeosciences, 18, 5141–5162, 2021

5146 J.-J. Hung et al.: Active and passive fluxes of C, N, and P in the northern South China Sea
were added to remove carbonate. The acidified sample wasdried in an oven and then determined with an elementalanalyzer (Thermo Scientific Flash 2000). Another fractionof particulate matter without treating acid was used for to-tal carbon (TC) analyses. Particulate inorganic carbon (PIC)was the difference between TC and POC. Organic mattercontent was estimated from POC content by a factor of 2(%POM=%POC · 2; Gordon, 1970; Monaco et al., 1990).Particulate organic phosphorus (POP) was determined fromthe difference between total particulate phosphorus (PP)and particulate inorganic phosphorus (PIP). PIP was deter-mined by the extraction of particulate matter with 1 M HCl(wt/vol= 50) for 24 h, and the extracted solution was de-termined by the DIP method described above (Aspila et al.,1976). The concentration of PP was determined by combust-ing particulate matter at 550 ◦C for 6 h followed by extrac-tion and measurement as the same procedures for PIP (As-pila et al., 1976). Analytical uncertainty was<± 6 % (n= 6)evaluated from repeated analyses for a coastal sediment. Ver-tical fluxes of particulate matter, POC, PN, and POP weredetermined by dividing the collected mass and elements at aspecific depth with the trapping area and time period of de-ployed trap.
Despite playing a minor role in passive fluxes, the down-ward fluxes of DOC, DON, and DOP through a depth of100 m were estimated from Fick’s law of diffusion (Eq. 7):
F(100) = −KzdC/dz
= −
[εRf/N
2(p)(1−Rf)][(C1−C2
)/(z2− z1)
], (7)
where F(100) is the flux of DOC (N, P) through a depth of100 m, Kz is the vertical turbulent coefficient, and dC/dzis the gradient of measured parameter concentrations acrossthe boundary. The concentration gradient (dC/dz) of DOC(N, P) was calculated from the difference of mean con-centrations (C1−C2) divided by the mean depth interval(z2− z1) between two 100 m layers that were above and be-low the considered boundary (Hung et al., 2007). The Kzwas derived from the dissipation rate (ε), the Richardsonnumber (Rf), and the square of the Brunt–Väisälä frequency(N ≡ ((−g/p)(dp/dz))1/2) at the pycnocline. Therefore, theKz varies with the inverse of N2(p), as ε and Rf are taken asconstant values of 10−8 m2 s−3 and 0.2, respectively (Copin-Montégut and Avril, 1993; Doval et al., 2001).
2.5 Measurements of primary productivity and newproduction
Primary productivity (PP) and nitrate-uptake new produc-tion (NP) were measured through deck incubation by addingNaH13CO3 and Na15NO3 into seawater, respectively, follow-ing the methods of Y.-L. Chen et al. (2008). Briefly, wa-ter samples were collected from the same six depths in theeuphotic zone. The collected seawater was transferred im-mediately into two sets of three transparent polycarbonate
bottles (2.3 L), one set for primary production measurementand the other for new-production measurement. Each set in-cluded two light bottles and one dark bottle. The bottles werecovered with layers of neutral density screen to simulate irra-diances at the sampling depths and incubated on deck undernatural light in incubators circulated with flow-through sur-face seawater, starting at approximately 08:00–09:00 (localtime) and lasting for 3 h. After incubation, the concentrationsof particulate organic carbon, particulate nitrogen, and theisotopic ratios of 13C : 12C and 15N : 14N were measured byan automatic carbon-nitrogen elemental analyzer (ANCA)20-20 mass spectrometer (Europa Scientific). For details ofcalculation of PP and NP, refer to Y.-L. Chen et al. (2008).
3 Results
3.1 Hydrographic characteristics
The oceanographic conditions in the coast-excluded NSCSdomains were likely dominated by monsoon-mediated sur-face circulation and Kuroshio intrusion (Chen et al., 2005;Dai et al., 2013; Hung et al., 2007, 2020; Liu et al., 2002;Zhai et al., 2005, 2013). In general, a strong northeast mon-soon prevails between November and April, and a weaksouthwest monsoon prevails between June and September,leading to a basin-wide cyclonic circulation being domi-nant in winter and an anticyclonic circulation being dom-inant in summer (Shaw and Chao, 1994; Liu et al., 2002;Wong et al., 2007). Thus, stations 1 and 2 sampled in sum-mer (July, 2013) exhibited similar distribution (0–300 m) ofhigh surface temperature (T ), low surface salinity (S), andlow surface Chl a concentration with a subsurface maximum(Fig. 2). The mixed layer was shallow (20–27 m), and the T –S diagram reveals that their characteristics were similar to thetypical pattern in South China Sea Water (SCSW; Fig. 3a).Stations 3 and 4 sampled in winter (December, 2013) ex-hibited low surface T , high surface S, and deeper mixedlayer with surface-elevated Chl a concentration (Fig. 2). Theseawater properties shifted toward the typical features ofKuroshio water (KW; Fig. 3a), influenced apparently by theintrusion of KW. Stations 3 and 4 were located inside andoutside the anticyclonic eddy (Chen et al., 2015), respec-tively, with a pronounced deeper mixed layer (160 vs. 85 m)and higher Chl a at Station 3 than at Station 4. Stations 5and 6 sampled in later spring (May, 2014) displayed simi-lar patterns to those (T , S, and Chl a) in summer (stations 1and 2; Fig. 2). The T –S features belong to certain extentsbetween summer and winter (Fig. 3a).
Station 7 sampled at the location close to the DongshaAtoll in summer (June, 2014) was influenced by the internal-wave (IW) shoaling activity and exhibited low surface T andhigh surface S and Chl a, attributed apparently to the shoal-ing events (Fig. 2). The T –S diagram also clearly depicts thewater sourced from subsurface SCSW (Fig. 3b). Stations 8
Biogeosciences, 18, 5141–5162, 2021 https://doi.org/10.5194/bg-18-5141-2021

J.-J. Hung et al.: Active and passive fluxes of C, N, and P in the northern South China Sea 5147
Figure 2. Vertical profiles of temperature, salinity, and fluorescence (Chl a) in the upper layer (300 m) of the water column for all samplingstations during various expeditions. The data of sampling season (S1: spring; S2: summer; F: fall; W: winter) and year (e.g., 04 for 2004) areincluded for each sampling station.
and 9 sampled in summer (July, 2014) exhibited the charac-teristics of SCSW in summer, and the distribution patterns ofT , S, Chl a (Fig. 2), and T –S features (Fig. 3b) were similarto those in stations 1 and 2. Station 10 sampled in summer(July, 2014) was located at the same position as Station 7and exhibited similar features but with slight differences inT , S, Chl a, and T –S properties (Figs. 2 and 3b), due tothe different shoaling strength. Station 11 (SEATS) sampledin fall (November, 2017) also exhibited high surface T , lowsurface S, and moderate surface Chl a with an obvious sub-surface maximum (Fig. 2). The T –S features shifted slightly
toward the typical features of KW (Fig. 3b). The distribu-tion patterns of T , S, and Chl a in different seasons are alsopresented in Fig. 4; significant differences in the three pa-rameters were observed between summer and winter, witha deeper mixed layer, lower surface T , and higher surfaceChl a in winter, and vice versa in summer. Spring and fallwere apparently in transition states between winter and sum-mer (Fig. 4).
https://doi.org/10.5194/bg-18-5141-2021 Biogeosciences, 18, 5141–5162, 2021

5148 J.-J. Hung et al.: Active and passive fluxes of C, N, and P in the northern South China Sea
Table 2. A list of mesozooplankton biomass and migrant biomass in various sizes collected from night and day tows, and night / day biomassratio during different seasons and events. The dry biomass (mgm−2) denotes an integrated biomass through the top layer of 200 m.
Season/size fraction Dry biomass (mgm−2)
Night Day Night / day Migrantbiomass
Summer (grand average from OR1-1039 (2013), OR1-1074 (2014),and OR1-1082 (2014))
0.2–0.5 mm 308± 97 249± 93 1.24 59.30.5–1 mm 319± 164 252± 142 1.27 66.91–2 mm 316± 205 211± 153 1.5 1052–5 mm 243± 118 99± 60 2.47 145total (> 0.2 mm) 1186± 304 811± 236 1.46 376
Winter (anticyclonic-eddy event OR1-1059 (2013))
0.2–0.5 mm 271 132 2.05 1390.5–1 mm 196 94 2.09 1021–2 mm 267 69 3.87 1982–5 mm 336 140 2.39 196total (> 0.2 mm) 1070 435 2.46 635
Summer (grand average from OR3-1773 (2014) and OR1-1082 (2014)in internal-wave influencing fields)
0.2–0.5 mm 1061± 387 811± 388 1.31 2500.5–1 mm 1008± 401 775± 416 1.30 2331–2 mm 1018± 393 742± 213 1.37 2762–5 mm 466± 209 229± 153 2.04 237total (> 0.2 mm) 3554± 713 2557± 667 1.39 997
Fall (grand average from OR1-1214 (2018) and OR1-1240 (2019))
0.2–0.5 mm 123± 57 101± 50 1.22 22.10.5–1 mm 168± 2 132± 8 1.27 36.01–2 mm 91± 32 44± 40 2.07 47.32–5 mm 119± 31 51± 1 2.34 68.2total (> 0.2 mm) 501± 60 327± 82 1.53 174
3.2 Active fluxes of organic carbon, nitrogen, andphosphorus
3.2.1 Evidence of DVM and biomass and abundance ofzooplankton and micronekton
The vertical distribution and acoustic scattering layers of mi-grators recorded at frequencies of 38 kHz (depth > 1000 m)and 120 kHz (depth approx. ∼ 300 m), respectively, clearlyhad strong image layers around 400 m derived from 38 kHzdata during the day and approximately 100 m derived from120 kHz data during the night. This finding indicates thatthe vertical migrators were located largely at a depth of400 m during the daytime and migrated to approximately100 m during the nighttime. The major located layers ofmigrators during daytime and nighttime were comparableto those found for diel migrated fish in the northern slopeof SCS (Wang et al., 2019). Sequential tows performed
at eight time intervals (17:00, 21:00, 01:00, 03:00, 06:00,09:00, 12:00, and 15:00) at the top 200 m revealed thelargest mesozooplankton biomass (2021 mgm−2) and abun-dance (354 indsm−3) during the night (01:00) but the low-est biomass (1480 mgm−2) and abundance (270 indsm−3)during the day (12:00; Fig. S1 in the Supplement). Highermesozooplankton biomass and abundance were observed innight tows than in day tows for all size classes; the occur-rence of small mesozooplankton (0.2–2.0 mm) was generallyhigher than that of large mesozooplankton (2.0–5.0 mm), ex-cept for the highest occurrence of large (0.2–5.0 mm) meso-zooplankton in winter (Table 2). However, the magnitude ofmigrant biomass (night minus day) was usually the largestfor the 2.0–5.0 mm class, except during an internal-waveevent in summer (Table 2). The total migrant biomass (sumof all sizes) was 474 mgm−2 in late spring, ranged from235 to 418 (mean: 327) mgm−2 in summer, was 635 mgm−2
in winter with an anticyclonic event, and ranged from 158
Biogeosciences, 18, 5141–5162, 2021 https://doi.org/10.5194/bg-18-5141-2021

J.-J. Hung et al.: Active and passive fluxes of C, N, and P in the northern South China Sea 5149
Figure 3. T –S plots for comparing water-column characteristicsamong stations 1–6 (a) and stations 7–11 (b). Kuroshio and SCSindicate the typical T –S features of Kuroshio and South China Seawaters, respectively. The Kuroshio and SCS waters are typical wa-ters collected from the West Philippine Sea and central SCS, respec-tively. Note that the data of sampling season (S1: spring; S2: sum-mer; F: fall; W: winter) and year (e.g., 04 for 2004) are included foreach sampling station.
to 189 (mean: 174) mgm−2 during fall at SEATS station(Table 2). An elevated biomass of 997 mgm−2 was ob-served in the internal-wave influencing fields in summer (Ta-ble 2). The night / day ratio of migrant biomass was higherfor large mesozooplankton (2.15–3.12 for size 2.0–5.0 mm)than for small mesozooplankton (1.21–2.09 for size 0.2–0.5–1.0 mm), coincident with the size distribution of migrantbiomass (Table 2). This implied that larger migrators mightplay more crucial roles than smaller migrators in determiningthe vertical transport of materials and elements.
3.2.2 Elemental composition of mesozooplankton
The measurement of elemental contents of mesozooplank-ton is essential for determining active fluxes of C, N, and P.The planktonic contents of C, N, and P were 37.4± 4.34 %,7.86± 1.29 %, and 0.76± 0.43 %, respectively, which did
not significantly differ between daytime and nighttime towsin summer. In general, C and N contents were higher insmaller mesozooplankton (1.0–2.0 and 0.5–1.0 mm) thanin larger mesozooplankton (2.0–5.0 mm), but the P con-tent increased with an increase in mesozooplankton size.The C, N, and P contents were, respectively, 33.2± 10.3 %,6.21± 2.10 %, and 1.06± 0.69 % in winter, with an occur-rence of anticyclonic eddy; 39.4± 3.67 %, 7.88± 1.02 %,and 0.91± 0.36 % in internal-wave influencing fields in sum-mer; and 40.4± 1.13 %, 8.92± 0.43 %, and 0.60± 0.08 % infall at the SEATS station. The C and N contents were simi-lar to those reported previously (35.6 %–40 %, Parsons et al.,1979; Dam and Peterson, 1993; Kobari et al., 2013; and 9 %,Peters and Downing, 1984, respectively). The molar ratios ofC : N, C : P, and N : P varied seasonally, ranging from 5.29to 5.80 (5.55± 0.16), 79.7 to 162 (131± 30), and 15.1 to29.6 (23.6± 5.05), respectively, in summer. The elementalratios of C : N, C : P, and N : P were 4.97–7.42 (6.33± 0.71),45.3–211 (102± 50.6), and 9.12–35.3 (16.0± 8.2), respec-tively, in winter, and 5.31–6.23 (5.84± 0.27), 76.8–134(111± 29.9), and 3.5–22.0 (18.9± 3.16), respectively, insummer in the internal-wave influencing fields. Moreover,they were 4.15–5.49 (5.2± 0.27), 139–215 (176± 31), and25.2–40.6 (33.2± 6.29) in fall at the SEATS station. The el-emental ratios of C : P and N : P exhibited greater variationthan C : N, which likely resulted from the large variation inP content. The elemental composition, however, was com-parable with that found in the ALOHA station (C88N18P1;Hannides et al., 2009), the Baltic Sea (C41N7P1–C144N24P1;Pertola et al., 2002), and Norwegian fjords (C63N8P1–C348N38P1; Gismervik, 1997). Our C : N : P ratios were ap-parently higher than the Redfield ratio (C106N16P1) exceptfor some cases in C : N ratios, likely because of the rela-tively low P content in mesozooplankton compared with phy-toplankton.
3.2.3 Active fluxes of C, N, and P
Active fluxes of C, N, and P were estimated as the sum ofrespiratory, gut, excretory, and mortality fluxes for mesozoo-plankton of various size fractions, and the original data oncomponent fluxes are presented in Table S1 in the Supple-ment. In terms of C flux, the respiratory flux was the mostdominant, followed by gut flux, excretory DOC flux, andmortality flux. By contrast, the N and P fluxes were derivedmainly from excretory and mortality fluxes, and the excretoryfluxes were considerably higher than the mortality fluxes.In general, the respiratory, gut, and excretory C fluxes de-creased with an increase in the size fractions with a few ex-ceptions (Table S1). However, the excretory and mortalityfluxes of N and P did not exhibit a consistent relationshipwith size fractions (Table S1). Overall, the active C flux wasmainly accounted for by the respiration flux (49.4 %–75.8 %)and the least by the mortality flux (8.99 %–13.4 %); those re-sults were comparable to those of the proportion of respira-
https://doi.org/10.5194/bg-18-5141-2021 Biogeosciences, 18, 5141–5162, 2021

5150 J.-J. Hung et al.: Active and passive fluxes of C, N, and P in the northern South China Sea
Figure 4. Comparison of seasonal variations of temperature, salinity, and fluorescence (Chl a) profiles in the upper layer (300 m) of the watercolumn at SEATS (11) station.
Figure 5. Empirical relationship between active carbon fluxes andDIN inventories in the euphotic zone (a) and between active carbonfluxes and Chl a inventories in the euphotic zone (b). The statisticcorrelations were established from collected data in all expeditions.
tion flux contributing to active flux in the western equato-rial Pacific (54.6 %; Hidaka et al., 2001), subtropical PacificOcean (61.8 %–63.0 %; Kobari et al., 2013), and SargassoSea (BATS Station, 75 %; Steinberg et al., 2000).
Resolving spatial and seasonal variations in active fluxesin the NSCS is difficult because of unsuccessful sampling at
Figure 6. Comparisons between seasonal and spatial active car-bon fluxes in the NSCS. The active fluxes were geographicallygrouped as the central basin represented by the SEATS station andthe northern region for other sampling locations. The SEATS activefluxes were estimated using the empirical relationship between ac-tive fluxes and inventories of Chl a except for SEATS-F1 and F2(fall season), which were derived from experimental data. The dataof the northern region were all experimental data, except for theWinter/o (outside the eddy) datum derived from the empirical rela-tionship between active fluxes and Chl a inventories. Winter/i (in-side the eddy); Summer-IW (internal waves); SEATS-Su (summer);SEATS-W (winter); SEATS-F (fall).
certain stations and cruises. Nevertheless, for the first-orderapproximation, the active fluxes that could not be measuredwere estimated using the empirical relationship establishedfrom the experimental data of active fluxes and Chl a inven-tories (Fig. 5). Thus, the compiled active fluxes of C, N, andP were 7.69–93.4 mgCm−2 d−1, 1.06–7.26 mgNm−2 d−1,0.13–0.99 mgPm−2 d−1, respectively (Fig. 6). The flux dis-tribution was the highest in summer due to the impact of theinternal-wave shoaling condition, followed by winter with an
Biogeosciences, 18, 5141–5162, 2021 https://doi.org/10.5194/bg-18-5141-2021

J.-J. Hung et al.: Active and passive fluxes of C, N, and P in the northern South China Sea 5151
Figure 7. Seasonal variations in vertical POC fluxes in the SEATS-excluded region (left side) and SEATS station (right side). Summer-IWs denotes the internal-wave event in summer; Winter-In denotesvalues inside the anticyclonic eddy in winter; Winter-out denotesvalues outside the anticyclonic eddy in winter. SEATS-W1, S1, S2,F1, F2, F3, W2, and W3 represent various samplings in winter (W),summer (S), and fall (F) seasons at the SEATS station. SEATS-W2and W3 data were obtained from the bottom-moored traps at a depthof 120 m (see Fig. 11). Other SEATS data were derived from inte-grating data of the new production and Chl a (see Figs. 9 and 10)except for data of SEATS-F1, which were obtained from the de-ployed floating traps.
anticyclonic eddy, and finally by summer with a calm oceaniccondition. The smallest values were found in the fall seasonunder relatively calm condition (Fig. 3) in the central basin(SEATS, Station 11), which is far from land sources.
3.3 Passive fluxes of C, N, and P
3.3.1 Vertical fluxes of POC, PN, and POP
Vertical fluxes of POC, PN, and POP appeared to decreasewith an increase in depth from 50 to 150 m, likely dueto the increased decomposition of organic matter with in-creasing depth (Table 3). Because most euphotic zones werelocated at depths between 50 and 100 m, vertical fluxesthrough a depth 100 m were considered the measures ofpassive fluxes. To obtain a comprehensive understandingand for comparison, some fluxes through a depth of 100 mwere obtained through prediction based on the euphotic-layer inventories of new production, DIN, and Chl a (seethe Discussion section) for stations that exhibit trap re-covery failure or those with no trap deployment in previ-ous studies. Vertical POC fluxes through a depth of 100 mranged from 64.3± 1.47 mgCm−2 d−1 in typical summerto 165 mgCm−2 d−1 in typical winter. The flux increasedto 156± 15.9 mgC m−2 d−1 in summer with the internal-wave shoaling condition and to 175± 3.5 mgCm−2 d−1
in winter within the anticyclonic eddy (Table 3, Fig. 7).At the SEATS station located in the central basin, the
POC fluxes ranged from 51.4 mgCm−2 d−1 during fall to100 mgCm−2 d−1 during winter (Table 3). Additional dataobtained from previous sequentially moored traps at theSEATS station at a depth of 120 m revealed extremelyhigh fluxes (199–254 mgCm−2 d−1) in winter (SEATS-W2,SEATS-W3; Fig. 7). Although data on PN and POP fluxeswere limited, the data predicted after the addition of POC :PN and POC : POP ratios the seasonal and event-effectedpatterns followed apparently by the variability of POC fluxes(Table 3).
The molar ratios of POC : PN ranged from 5.65± 0.20 (at50 m) to 8.00± 0.15 (at 100 m), with an average value ofapproximately 6.84± 0.60 (50–100 m). The C : N ratio in-creased slightly from 50 to 150 m, likely attributed to therapid decay of PN over POC with increasing depth. Themean ratio was close to the Redfield ratio (6.6; Redfield,1958), indicating a relatively low contribution of lithogenicPOC sources. The molar ratios of POC : POP ranged from152± 1.57 (at 50 m) to 243± 15.3 (at 150 m), with an over-all value of approximately 194± 9.5. The increase in C : Pratios with increasing depth was more pronounced than thatof C : N ratios, indicating that POP was more labile than PNin settling organic matter. The C : N and C : P ratios were ap-plied to the estimation of the PN and POP fluxes not obtainedfrom the measured POC fluxes presented in Table 3.
3.3.2 Vertical fluxes of DOC and DON
Although the data on DOC and DON fluxes through a depthof 100 m were limited, for first-order approximation, consid-ering the contribution of DOC and DON fluxes to passivecarbon and nitrogen fluxes was essential. In general, the ver-tical fluxes of DOC and DON likely increased from a depthof 50 to 150 m, ranging from 0.71± 0.68 mgCm−2 d−1
at 50 m to 1.71± 0.01 mgCm−2 d−1 at 150 m inspring and from 0.78± 0.52 mgCm−2 d−1 at 50 m to1.29± 0.15 mgCm−2 d−1 at 150 m in summer (Table S2in the Supplement). Vertical fluxes of DOC througha depth of 100 m were 1.13± 0.03 mgCm−2 d−1 inspring and 1.10± 0.13 mgCm−2 d−1 in summer. TheDON fluxes ranged from 0.08± 0.06 mgNm−2 d−1
at 50 m to 0.35± 0.02 mgNm−2 d−1 at 150 m inspring and from 0.06± 0.06 mgNm−2 d−1 at 50 m to0.10± 0.08 mgNm−2 d−1 at 150 m in summer (Ta-ble S2). Vertical fluxes of DON through a depth of100 m were 0.22± 0.07 mgNm−2 d−1 in spring and0.09± 0.06 mgNm−2 d−1 in summer. The DOC andDON fluxes through a depth of 100 m increased to1.57± 1.07 mgCm−2 d−1 and 0.36± 0.25 mgNm−2 d−1,respectively, during the summer influenced by internal-waveevents. However, vertical flux data of DOC and DON inwinter could not be obtained.
https://doi.org/10.5194/bg-18-5141-2021 Biogeosciences, 18, 5141–5162, 2021

5152 J.-J. Hung et al.: Active and passive fluxes of C, N, and P in the northern South China Sea
Table 3. A list of measured and estimated fluxes of total mass, POC, PN, and POP in various sampling seasons and oceanic events in NSCS.
Seasons/events Depth Mass flux POC flux PN flux POP flux(m) (mgm−2 d−1) (mgCm−2 d−1) (mgNm−2 d−1) (mgP m−2 d−1)
Late spring 50 270± 22.3 101± 10.7 20.5± 2.61 1.71± 0.16(ORI-1074, 2014) 100 221± 28.8 66.8± 1.29 12.8± 0.38 0.99± 0.07
150 99.1± 14.1 21.6± 2.06 3.31± 0.52 0.24± 0.04Summer 50 286± 8.20 104± 13.4 21.5± 2.01 1.71± 0.16(ORI-1039, 2013; ORI-1082, 2014) 100 218± 25.0 64.3± 1.47 12.1± 0.47 0.93± 0.04
150 89.4± 4.01 19.6± 6.06 2.85± 0.82 0.21± 0.06Internal waves (summer, ORI-1082, ORIII-1773) 100 334± 33.0 156± 15.9 21.2± 1.68 1.79± 0.19Winter (ORI-1059, 2013; inside eddy) 100 – 175± 35a (25.9± 5.1) (0.90± 0.18)Winter (ORI-1059, 2013; outside eddy) 100 – 165a (24.1) (0.84)SEATS (winter, ORI-708, 2004) 100 – 100a (14.6) (0.52)SEATS (summer, ORI-722, 2004) 100 – 81.3a (11.9) (0.42)SEATS (summer, ORI-726, 2004) 100 – 72.7a (10.6) (0.37)SEATS (fall, ORI-1184, 2017) 50 230 61.9 9.46 0.85
100 201 51.4 7.00 0.61SEATS (fall, ORI-1214, 2018) 100 – 67.9b (9.93) (0.35)SEATS (fall, ORI-1240, 2019) 100 – 85.5b (12.5) (0.44)SEATS (winter, 2005)c 120c 512± 38c 226± 28c (33.2) (1.19)
a POC fluxes were derived from integrated new production (see Fig. 9). b POC fluxes were derived from Chl a inventories in the euphotic zone (see Fig. 9a); PN and POP fluxes inparentheses were estimated from POC fluxes and C : N and C : P ratios. c Data collected from deep-moored traps deployed on the site close to the SEATS station.
4 Discussion
4.1 Regulation of active C, N, and P fluxes in the NSCS
Both migrant biomass and migratory fluxes of C, N, andP varied with seasons, locations, and oceanic events. Al-though determined independently, migrant biomass and ac-tive CNP fluxes coincidently varied with seasons and oceanicevents. As a result, migrant biomass was closely corre-lated with migratory fluxes of C (r = 0.8343, p< 0.0001),N (r = 0.7800, p< 0.0001), and P (r = 0.8259, p< 0.0001;Fig. 8), indicating the crucial role of migrant biomass in de-termining the magnitudes of active C, N, and P fluxes. Theincrease in migrant biomass apparently increased the preda-tion of phytoplankton during the night in the upper layers,which likely enhanced the metabolic and clearance rates ofmigrators during the daytime in mesopelagic zones becausethe two rates dominated the magnitudes of active fluxes (Ta-ble S1). Moreover, the larger migrators, particularly those ofsizes 2–5 mm, appeared to be dominant in transporting C,N, and P into mesopelagic zones (Table 2), which is consis-tent with the results of Valencia et al. (2018), who reported2–5 mm migrators as the major group in determining activefluxes at station ALOHA, North Pacific Subtropical Gyre.Steinberg and Landry (2017) compiled the data of migrantbiomass and respiratory carbon fluxes collected from vari-ous locations in the North Atlantic and Pacific oceans anddemonstrated an increase in respiratory carbon fluxes withan increase in migrant biomass (positive correlation). In addi-tion, with an increase in respiratory carbon fluxes, the equiv-alent fraction of vertical POC fluxes measured by traps from
epipelagic zones (100–200 m) also increased. Although theoceanic conditions may influence the community structure,size distribution, and migrant biomass leading to changes inactive-flux magnitudes (Valencia et al., 2018), our data indi-cated that the 2–5 mm class exhibited the highest night/daybiomass ratios and migrant biomass in both summer and win-ter with contrasting oceanic conditions in the NSCS, imply-ing the dominant role of 2–5 mm migrators in determiningmigratory fluxes in the subtropical–tropical ocean.
The NSCS experiences contrasting atmospheric andoceanic forcings between the winter and summer, includingmost of the time during spring and fall (Liu et al., 2002; Hunget al., 2020). In general, the upper-ocean stratification pro-gressed from spring to summer (SI, 0.025–0.04 kgm−4) withan increase in temperature and weak southwesterly monsoonwinds, after which the stratification began to erode from fallto winter (SI, < 0.01 kgm−4) due to surface-water coolingand the prevailing northeasterly monsoon winds. The sub-surface nutrient pumping through the eutrophic base may in-tensify following the entry into the winter season. Thus, thediscrete contents and inventories of nutrients and Chl a inthe euphotic zone were considerably higher in winter than insummer in the NSCS, excluding the coastal and shelf zonesreported in our previous studies (Hung et al., 2007, 2020;W. Chen et al., 2008; Chen et al., 2014) and in the current ex-periments. To obtain a complete data set of active fluxes forseasonal comparison, the flux data that could not be collectedwere derived from the data of Chl a and DIN inventories us-ing appropriate correlations between active carbon fluxes andChl a inventories (r = 0.9247, p< 0.002; Fig. 5a) and be-
Biogeosciences, 18, 5141–5162, 2021 https://doi.org/10.5194/bg-18-5141-2021

J.-J. Hung et al.: Active and passive fluxes of C, N, and P in the northern South China Sea 5153
Figure 8. Plots of statistic correlations between migrant biomassand active carbon fluxes (a), active nitrogen fluxes (b), and activephosphorus fluxes (c).
tween active carbon fluxes and DIN inventories (r = 0.9641,p< 0.0001; Fig. 5b) constructed from the successfully col-lected data in the current study. These empirical relationshipsmay also indicate that the active fluxes were driven by theavailability of nutrients (DIN) in the euphotic zone, whichin turn determined Chl a inventories because of a signifi-cant correlation between integrated DIN and integrated Chl a(r = 0.9479, p< 0.0001).
In the northern region, active fluxes were generally higherin winter than in spring and summer, likely due to the in-crease of nutrient pumping in winter. In addition, the activeflux was slightly higher in the region within the anticycloniceddy (Station 3) than in the region located outside the eddy(Station 4; Fig. 5), as a result of the eddy-enhanced nutrientpumping to the euphotic zone. Although the eddy was a reg-ular anticyclonic eddy with depression of pycnocline, highnutrients and Chl a were detected in the center of eddy in theupper water column. Chen et al. (2015) demonstrated thatthis warm-core anticyclonic eddy (major axis: 420–430 km;minor axis: 240–260 km) occurring during winter was char-
acterized by a deep mixed layer of up to 140–180 m and theconcentration of nitrate and Chl a increased in the top watercolumn (0–200 m), resulting in an increase in primary pro-ductivity and new production in seawater containing abun-dant Synechococcus, coccolithophores, and diatoms. Theyattributed the biological enhancements to the conditions thatthe eddy was at its decaying stage and re-incorporating inter-mittently with an intruding Kuroshio branch or the passageof internal waves to elevate nutrient concentrations. Thus, thenutrient pumping in the euphotic zone appears to be the ma-jor driver enhancing the active carbon fluxes in winter andin anticyclonic eddy-driven events. The extremely high ac-tive carbon flux that occurred in the internal-wave influenc-ing field near the Dongsha Atoll was also attributed to thestrong nutrient uplift caused by the elevation of waves de-spite the summer season conditions (Hung et al., 2021). Atthe SEATS station located in the central basin, the active car-bon fluxes were not necessarily lower than those found in re-spective seasons in the northern region, although the lowestfluxes were noted during the fall season (Fig. 6). Similarly,the carbon fluxes were considerably higher in winter than inother seasons at the SEATS station, likely attributable to theabovementioned mechanism.
Data on active nitrogen and phosphorus fluxes in theNSCS are limited. To a first approximation, active ni-trogen and phosphorus fluxes were derived from excre-tory and mortality fluxes; they respectively ranged from1.06 mgNm−2 d−1 and 0.13 mgPm−2 d−1 during fall atSEATS station to 3.21 mgNm−2 d−1 and 0.40 mgPm−2 d−1
during spring, 1.77 mgNm−2 d−1 and 0.33 mgPm−2 d−1
during summer, 3.51 mgNm−2 d−1 and 0.57 mgPm−2 d−1
during the winter-eddy event, and 7.26 mgNm−2 d−1 and1.08 mgPm−2 d−1 during the summer-IWs event. In general,the distribution of active nitrogen and phosphorus fluxes fol-lowed the seasonal patterns of active carbon fluxes. The C : Nratios of active fluxes ranged from 6.9 (fall) to 14.2 (win-ter; mean: 10.6), and the C : P ratio ranged from 55.7 (fall)to 87.7 (winter; mean: 72.9). The C : N and C : P ratios ap-peared to increase with an increase in active fluxes, likelycaused by the increased contribution of respiration and gutfluxes to active fluxes, and the respiration and gut fluxesdid not include nitrogen and phosphorus fluxes. Moreover,higher respiration and gut fluxes occurred in winter than insummer. The C : N and C : P ratios of active fluxes were, re-spectively, higher and lower than the C : N and C : P ratiosof particulate vertical fluxes, the major component of passivefluxes.
4.2 Controlling mechanisms of passive fluxes of C, N,and P
Vertical POC fluxes varied with seasons and locations(Fig. 7), likely because of a pronounced difference in hydro-graphic and biogeochemical conditions between summer andwinter. The upper water column has been widely reported
https://doi.org/10.5194/bg-18-5141-2021 Biogeosciences, 18, 5141–5162, 2021

5154 J.-J. Hung et al.: Active and passive fluxes of C, N, and P in the northern South China Sea
Figure 9. Scatter plots depicting the relationship between integratednew production (INP) and POC fluxes through a depth of 100 m atthe SEATS station, except for a datum (star symbol) derived fromthe station near the Dongsha Atoll (Hung et al., 2021). INP datawere adapted from Y.-L. Chen et al. (2007, 2008, 2014) except for adatum derived from Hung et al. (2021). Data of POC fluxes through100–120 m were derived from the moored trap (Tsai, 2007; Hunget al., 2021) and floating traps (Wei et al., 2011), except for two dataitems derived from DIN budgets (Hung et al., 2007). The solid blackline denotes the linear regression (r = 0.8435, p< 0.01, n= 8) be-tween INP and POC fluxes for all presented data.
to undergo stratification and experience restricted nutrientavailability in summer; however, in winter surface stratifica-tion was eroded and nutrient availability increased, leading toenhanced primary productivity and new production (Figs. 2and 4; Chen, 2005; Y.-L. Chen et al., 2008, 2014; Dai et al.,2013; Zhai et al., 2013; Hung et al., 2020). By combining theprevious and current measurements, particularly our coau-thor’s (Yuh-ling Lee Chen) new production data, we founda striking relationship (r = 0.8502, p< 0.02) between inte-grated new productions and vertical POC fluxes through adepth of 100 m (Fig. 9). Vertical POC fluxes have also beenefficiently predicted from primary production (R2
= 0.69–0.97) in various regimes of the ocean (Betzer et al., 1984;Pace et al., 1987). However, Karl et al. (1996) later foundan inverse correlation between POC fluxes and primary pro-duction during the El Niño–Southern Oscillation (ENSO) pe-riod at ALOHA station. Under the oceanographic paradigm,new production is a significant contributor of primary pro-ductivity and the export production; therefore, a strong cor-relation between vertical POC fluxes and new productionsis expected. By using this empirical relationship, the data ofvertical POC fluxes that could not be collected in this studycan be estimated on the basis of the new production data, andthe more efficient data set of vertical fluxes can be used forspatial and seasonal comparisons.
Nutrient availability in the euphotic zone appeared to drivethe variability of vertical POC fluxes in the NSCS. Based onprevious results that the primary productivity and new pro-duction were determined by the availability of nutrients inthe euphotic zone of the NSCS (Chen, 2005; Y.-L. Chen et
Figure 10. Plots of positive correlations between integrated Chl aand vertical POC fluxes (a) and between DIN inventories and Chl ainventories in the euphotic zone (b).
al., 2008, 2014), the vertical POC fluxes through a depth of100 m should be dependent of nutrient availability, particu-larly the availability of N+N in the euphotic zone because ofthe remarkable nitrogen limitation ([N+N] / [DIP]� 16) inthe NSCS (Y.-L. Chen et al., 2008, 2014; Hung et al., 2020).The nutrient supply and availability were in turn determinedmainly by climatic and oceanic forcings (e.g., the winter in-tensification of wind-driven turbulence and vertical convec-tion). Therefore, vertical POC fluxes were largely determinedby integrated Chl a (r = 0.8367, p< 0.01), which was de-termined by the availability of DIN (r = 0.9151, p< 0.01)derived from the data collected in this experiment (Fig. 10).As a result, vertical POC fluxes were likely to vary with thevarying hydrographic and nutrient conditions.
By combing the experimental and estimated data, wefound that the seasonal, geographic, and ocean events affectthe vertical POC fluxes (Fig. 7). Vertical POC fluxes werehigher in winter than in other seasons in both the northernregion and central basin (SEATS). The flux was also slightlyhigher in the case influenced by an anticyclonic eddy than theone unaffected by an eddy in winter in the northern region,caused mainly by nutrient elevation similar to the mecha-nisms responsible for the increase in active fluxes. Zhou et al.(2020) reported the eddy evolution in determining the en-hanced states of POC and opal fluxes in the western SCS andattributed the difference in flux enhancement to the eddy’sstage and sampling location within the eddy. They suggested
Biogeosciences, 18, 5141–5162, 2021 https://doi.org/10.5194/bg-18-5141-2021
J.-J. Hung et al.: Active and passive fluxes of C, N, and P in the northern South China Sea 5155
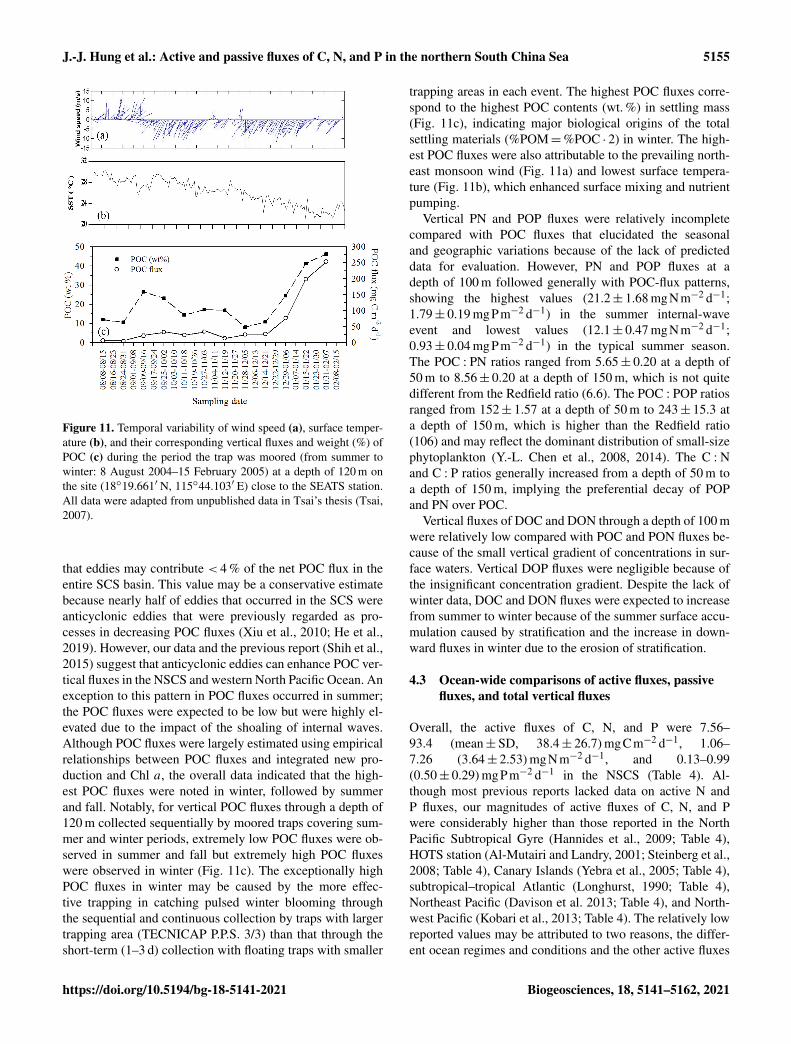
Figure 11. Temporal variability of wind speed (a), surface temper-ature (b), and their corresponding vertical fluxes and weight (%) ofPOC (c) during the period the trap was moored (from summer towinter: 8 August 2004–15 February 2005) at a depth of 120 m onthe site (18◦19.661′ N, 115◦44.103′ E) close to the SEATS station.All data were adapted from unpublished data in Tsai’s thesis (Tsai,2007).
that eddies may contribute < 4 % of the net POC flux in theentire SCS basin. This value may be a conservative estimatebecause nearly half of eddies that occurred in the SCS wereanticyclonic eddies that were previously regarded as pro-cesses in decreasing POC fluxes (Xiu et al., 2010; He et al.,2019). However, our data and the previous report (Shih et al.,2015) suggest that anticyclonic eddies can enhance POC ver-tical fluxes in the NSCS and western North Pacific Ocean. Anexception to this pattern in POC fluxes occurred in summer;the POC fluxes were expected to be low but were highly el-evated due to the impact of the shoaling of internal waves.Although POC fluxes were largely estimated using empiricalrelationships between POC fluxes and integrated new pro-duction and Chl a, the overall data indicated that the high-est POC fluxes were noted in winter, followed by summerand fall. Notably, for vertical POC fluxes through a depth of120 m collected sequentially by moored traps covering sum-mer and winter periods, extremely low POC fluxes were ob-served in summer and fall but extremely high POC fluxeswere observed in winter (Fig. 11c). The exceptionally highPOC fluxes in winter may be caused by the more effec-tive trapping in catching pulsed winter blooming throughthe sequential and continuous collection by traps with largertrapping area (TECNICAP P.P.S. 3/3) than that through theshort-term (1–3 d) collection with floating traps with smaller
trapping areas in each event. The highest POC fluxes corre-spond to the highest POC contents (wt. %) in settling mass(Fig. 11c), indicating major biological origins of the totalsettling materials (%POM=%POC · 2) in winter. The high-est POC fluxes were also attributable to the prevailing north-east monsoon wind (Fig. 11a) and lowest surface tempera-ture (Fig. 11b), which enhanced surface mixing and nutrientpumping.
Vertical PN and POP fluxes were relatively incompletecompared with POC fluxes that elucidated the seasonaland geographic variations because of the lack of predicteddata for evaluation. However, PN and POP fluxes at adepth of 100 m followed generally with POC-flux patterns,showing the highest values (21.2± 1.68 mgNm−2 d−1;1.79± 0.19 mgPm−2 d−1) in the summer internal-waveevent and lowest values (12.1± 0.47 mgNm−2 d−1;0.93± 0.04 mgPm−2 d−1) in the typical summer season.The POC : PN ratios ranged from 5.65± 0.20 at a depth of50 m to 8.56± 0.20 at a depth of 150 m, which is not quitedifferent from the Redfield ratio (6.6). The POC : POP ratiosranged from 152± 1.57 at a depth of 50 m to 243± 15.3 ata depth of 150 m, which is higher than the Redfield ratio(106) and may reflect the dominant distribution of small-sizephytoplankton (Y.-L. Chen et al., 2008, 2014). The C : Nand C : P ratios generally increased from a depth of 50 m toa depth of 150 m, implying the preferential decay of POPand PN over POC.
Vertical fluxes of DOC and DON through a depth of 100 mwere relatively low compared with POC and PON fluxes be-cause of the small vertical gradient of concentrations in sur-face waters. Vertical DOP fluxes were negligible because ofthe insignificant concentration gradient. Despite the lack ofwinter data, DOC and DON fluxes were expected to increasefrom summer to winter because of the summer surface accu-mulation caused by stratification and the increase in down-ward fluxes in winter due to the erosion of stratification.
4.3 Ocean-wide comparisons of active fluxes, passivefluxes, and total vertical fluxes
Overall, the active fluxes of C, N, and P were 7.56–93.4 (mean±SD, 38.4± 26.7) mgCm−2 d−1, 1.06–7.26 (3.64± 2.53) mgNm−2 d−1, and 0.13–0.99(0.50± 0.29) mgPm−2 d−1 in the NSCS (Table 4). Al-though most previous reports lacked data on active N andP fluxes, our magnitudes of active fluxes of C, N, and Pwere considerably higher than those reported in the NorthPacific Subtropical Gyre (Hannides et al., 2009; Table 4),HOTS station (Al-Mutairi and Landry, 2001; Steinberg et al.,2008; Table 4), Canary Islands (Yebra et al., 2005; Table 4),subtropical–tropical Atlantic (Longhurst, 1990; Table 4),Northeast Pacific (Davison et al. 2013; Table 4), and North-west Pacific (Kobari et al., 2013; Table 4). The relatively lowreported values may be attributed to two reasons, the differ-ent ocean regimes and conditions and the other active fluxes
https://doi.org/10.5194/bg-18-5141-2021 Biogeosciences, 18, 5141–5162, 2021

5156 J.-J. Hung et al.: Active and passive fluxes of C, N, and P in the northern South China Sea
Table 4. Summary and comparison of estimated active, passive (flux at a depth of 100 m), and total vertical fluxes of carbon, nitrogen, andphosphorus in NSCS and other oceans.
Region Total flux (mgm−2 d−1)a Active flux (mgm−2 d−1) Passive flux (mgm−2 d−1)∗ Refb
C N P C N P C N P
NSCS/range 71.9–347 13.0–30.5 1.02–2.97 7.56–93.4 1.06–7.26 0.13–0.99 65.3–255 11.9–23.2 0.89–1.98 1
NSCS/meanc 163± 70 21.2± 4.9 1.94± 0.44 38.4± 26.7 3.64± 2.53 0.50± 0.29 125± 64.9 17.6± 4.2 1.44± 0.33 1
NSCS (%total)d 24± 19 % 17± 13 % 26± 16 % 77± 52 % 83± 28 % 74± 24 % 1
NSCS basin 118 (summer)– 2209 (winter)
NSCS basin 61.4 (summer)– 3241 (winter)
NSCS basin 51.6 (summer)– 4116 (winter)
NSCS basin 63.6 (fall)– 5220 (spring)
BATS 29.1± 14.3 6(150 m)
NortheastPacific
68.4 5.74 0.43 7(75 m) (75 m) (75 m)
Costa RicaDome
120± 8.4 12.6± 1.5 0.81± 0.13 8
N. PacificSubtropicalGyre
33.7 5.66 0.56 4.91 1.46 0.22 29.0e 4.2e 0.34e 9(14.6 %)d (25.8 %)d (38.3 %)d (86 %)d (74 %)d (61 %)d
Subtropical–tropicalAtlantic
2.8–8.8 10(fall)
1.1–123.8 11(36.1± 33.0)
(25 %–80 %)d
HOTS(1990–1996)
3.65± 2.08 0.63± 0.36 12
HOTS 3.65 13(summer)
Canary Islands 8.42 14(eddy)
1.85(summer)
NorthwestPacific
2.2 15
NortheastPacific
144 22–24 16(modeled) (15 %–16 %)
a Total flux= (active flux)+ (passive flux). ∗ Passive flux= (POC flux)+ (DOC flux). b Ref (reference): 1 (this study); 2 (Ho et al., 2010); 3 (Wei et al., 2011); 4 (Cai et al., 2015); 5 (W. Chen et al., 2008); 6 (Helmkeet al., 2010); 7 (Knauer et al., 1979); 8 (Stukel et al., 2016); 9 (Hannides et al., 2009); 10 (Longhurst et al.,1990); 11 (Hernández-León et al., 2019); 12 (Al-Mutairi and Landry, 2001); 13 (Steinberg et al., 2008);14 (Yebra et al., 2005); 15 (Kobari et al., 2013); 16 (Davison et al., 2013). c Mean: mean± standard deviation. d %: the percentage (fraction) of total flux. e 29.0: the value reported at 150 m.
derived only from respiratory flux. The most comparableactive carbon flux was reported by Hernández-León et al.(2019) with the total active flux (36.1± 33.0 mgCm−2 d−1;Table 4) derived from the respiratory, gut, excretory, andmortality fluxes in the subtropical–tropical Atlantic. Thesedata are very close to our estimated active C fluxes, which islikely because of the same estimation method used.
It is worth noting that the estimates of active flux and as-sociated uncertainty were derived mainly from oligotrophicregions even though two shallow stations off the Dongsha
Atoll were included in this study. The uncertainty of fluxwas mainly associated with the spatial and seasonal (in-cluding extreme events) variability in the NSCS. As activefluxes and passive fluxes may increase toward mesotrophicand eutrophic domains (Steinberg and Landry, 2017; Yebraet al., 2018; Hernández-León et al., 2019), these estimates(mean±SD) may be regarded as the lower-bound fluxes un-der the state that the oligotrophic domain dominates the en-tire region of SCS. There was an interesting report suggestingthat the lateral migration of fish played an important role on
Biogeosciences, 18, 5141–5162, 2021 https://doi.org/10.5194/bg-18-5141-2021

J.-J. Hung et al.: Active and passive fluxes of C, N, and P in the northern South China Sea 5157
determining DVM transport across the slope of NSCS (Wanget al., 2019). The impact of this issue on active fluxes is un-known in the oligotrophic ocean, but this scenario warrantsfurther study.
Because of the small contributions of DOC andDON fluxes to passive fluxes, our passive fluxes can be com-pared directly with previous vertical fluxes of POC. Therange and mean values of our data are comparable with thoserecorded in the same oceanic regime (most from the SEATSstation) during various periods (W. Chen, et al., 2008; Hoet al., 2010; Wei et al., 2011; Cai et al., 2015; Table 4), al-though the passive fluxes of N and P have not been recorded.Our data are strikingly close to the fluxes of C, N, andP reported from the Costa Rica Dome upwelling system(Stukel et al., 2016; Table 4). However, our data are appar-ently higher than those reported from the Northeast Pacific(Knauer et al., 1979; Table 4), BATS station (Helmke et al.,2010; Table 4), and North Pacific Subtropical Gyre (Han-nides et al., 2009; Table 4). This may imply that the NSCSwas more effective than the open Atlantic and Pacific oceansin mediating POC transfer from the surface to the interior ofthe ocean.
The total export of carbon from the surface into theinterior of the ocean in the South China Sea (3.5× 10⁶km2)may be extrapolated from the total C fluxes measuredin the NSCS. To a first approximation, the total exportwas preliminarily projected to be 0.208± 0.089 GtCyr−1
[(163± 70 mgCm−2 d−1) · (3.5× 106 km2) · (365 dyr−1)],which is approximately 1.89± 0.81 % of the global an-nual flux (11 GtC yr−1) reported by Sanders et al. (2014).Although this value is about twice as large as the ratio ofocean area (SCS/global ocean= 0.97 %), the ratio of carbontransfer (1.89± 0.81 %) is expected to change if more datain total C flux are available for the SCS. Nevertheless, theannual C flux was higher than the value reported from theNorth Atlantic (0.55–1.94 GtCyr−1; Sanders et al., 2014)if the area of the SCS was normalized to that of the NorthAtlantic (43.45× 10⁶ km2); thus, the SCS, as the largestmarginal sea, may play a more efficient role than openoceans in the transfer of atmospheric CO2 into deep layers.
4.4 Relative contributions of active fluxes and passivefluxes to total vertical fluxes
Contributions of active fluxes of C, N, and P to total verticalfluxes of C, N, and P accounted for 24± 19 %, 17± 13 %,and 26± 16 %, respectively (Table 4). Despite the limiteddata available for other oceans, in our study, the magnitudeof the contribution of active C flux was higher, but those ofcontributions of active N and P fluxes were lower than thecorresponding findings by Hannides et al. (2009) in the NorthPacific Subtropical Gyre (Table 4). However, the magnitudeof the contribution of active C flux in our study was appar-ently lower than the range reported by Hernández-León et al.(2019; 36.1± 33.0 %, Table 4) in the subtropical–tropical At-
lantic. Hernández-León et al. (2020) also predicted a globalsupply of 0.44 PgCyr−1 transported by zooplankton into thebathypelagic ocean, comparable to the range of passive car-bon export. They argued that the active flux may accountfor about 25 % of total flux in oligotrophic zones but canreach about 80 % of total flux in meso- and eutrophic zones(Hernández-León et al., 2020). The lowest range (15 %–16 %) was reported by Davison et al. (2013; Table 4) in theNortheast Pacific, although their total vertical C flux wasestimated from modeled net primary production. Our pas-sive fluxes of C, N, and P contributed dominantly to to-tal vertical fluxes of C, N, and P accounting for 77± 52 %,83± 28 %, and 74± 24 %, respectively (Table 4). Overall,the range of difference in the proportions of total verticalfluxes was reasonable, which may imply that our findings arereliable. The C : N and C : P ratios in the total vertical fluxwere 7.69 and 84.0, respectively, indicating higher C and Penrichment compared with the Redfield ratio. This may beattributed to the more pronounced enrichment in C and P inactive fluxes (C : N= 10.4; C : P= 75.8) because the ratiosare closer to the Redfield ratio in passive fluxes (C : N= 7.1;C : P= 86.8) than in active fluxes. DVM-mediated transportmay play a crucial role in the transfer of P from the surfaceto the mesopelagic zone.
5 Conclusions
To understand the strength of carbon removal from thesurface to the interior of the ocean, the study of active andpassive fluxes is essential. Elucidating the total vertical fluxesof C, N, and P in the SCS is a high research priority not onlybecause of the limited existing data in the SCS but also for in-creasing the knowledge of the total-flux responses to chang-ing tropical oceans. Overall, the collected and estimateddata indicated that the passive fluxes of C, N, and P wereseasonally variable and particularly higher in winter than inother seasons in the NSCS. The strengths of passive fluxeswere estimated as 65.3–255 (125± 64.9) mgCm−2 d−1,11.9–23.2 (17.6± 4.2) mgNm−2 d−1, and 0.89–1.98(1.44± 0.33) mgPm−2 d−1, of which the fluxes of DOC,DON, and DOP accounted for generally less than 5 %.Active fluxes varied largely in coincidence with the sea-sonal variations of passive fluxes, ranging from 7.56to 93.4 (38.4± 26.7) mgCm−2 d−1, from 1.06 to 7.26(3.64± 2.53) mgNm−2 d−1, and from 0.13 to 0.99(0.50± 0.29) mgPm−2 d−1 in the NSCS. They usuallyaccount for less than one-third of the total vertical fluxes.Both active and passive fluxes exhibited contrasting patternsbetween summer and winter, resulting mainly from surfacewarming and stratification in summer and cooling andwind-induced turbulence in pumping nutrients into theeuphotic zone in winter. The increase in nutrient availabilityappeared to increase the primary and secondary productionin tropical winter when the temperature remained suffi-
https://doi.org/10.5194/bg-18-5141-2021 Biogeosciences, 18, 5141–5162, 2021

5158 J.-J. Hung et al.: Active and passive fluxes of C, N, and P in the northern South China Sea
ciently high for biological activity. In addition, the impactof anticyclonic eddy and internal-wave events on enhancingactive and passive fluxes was pronounced in the NSCS.Overall, the active and passive fluxes were driven by nutrientavailability within the euphotic layer, which was ultimatelycontrolled by the change in internal and external forcings.To a first approximation, the SCS may effectively transfer0.208± 0.089 GtC yr−1 into the ocean’s interior, accountingfor approximately 1.89± 0.81 % of the global C flux.
Data availability. The data published in this contribution arelargely included in this article and its Supplement. Additional datacan be obtained through email request to the corresponding author.
Supplement. The supplement related to this article is available on-line at: https://doi.org/10.5194/bg-18-5141-2021-supplement.
Author contributions. In this work, JJH planned and conductedthe experiments and wrote the article; CHT, ZYL, SHP, LST, andYHL performed experiments including collection and analyses ofhydrographic and biological pump data; YLLC performed new-production experiments and supervision.
Competing interests. The authors declare that they have no conflictof interest.
Disclaimer. Publisher’s note: Copernicus Publications remainsneutral with regard to jurisdictional claims in published maps andinstitutional affiliations.
Acknowledgements. The authors would like to thank Mei-Heui Huang, Hiao-Dan Huang, and Yi-Ting Yeh for their assistancein sampling and analyses.
Financial support. This research has been supported by the Min-istry of Science and Technology, Taiwan (grant nos. MOST 107-2621-M-110-022, MOST 108-2621-M-110-015, and MOST 109-2621-M-110-008), and the Aim for the Top University Plan of theNational Sun Yat-sen University and Ministry of Education, Tai-wan, ROC (grant no. 06C030203).
Review statement. This paper was edited by Yuan Shen and re-viewed by three anonymous referees.
References
Alford, M. H., Peacock, T. M., Mackinnon, J. A., et al.: The forma-tion and fate internal waves in the South China Sea, Nature, 521,65–69, 2015.
Al-Mutairi, H. and Landry, M. R.: Active export of carbon and ni-trogen at Station ALOHA by diel migrant zooplankton, Deep-Sea Res. Pt. II, 48, 2083–2103, 2001.
Archibald, K. M., Siegel, D. A., and Doney, S. C.: Modeling theimpact of zooplankton diel vertical migration on the carbon ex-port flux of the biological pump, Global Biogeochem. Cy., 33,181–199, https://doi.org/10.1029/2018GB005983, 2019.
Aspila, K. I., Agemian, H., and Chau, A. S. Y.: A semiautomatedmethod for determination of inorganic,organic and total phos-phate in sediments, Analyst, 101, 187–197, 1976.
Avril, B.: DOC dynamics in the northwestern Mediterranean Sea(DYFAMED site), Deep-Sea Res. Pt. II, 49, 2163–2182, 2002.
Baetge, N., Graff, J. R., Behrenfeld, M. J., and Carlson, C.: Netcommunity production, dissolved organic carbon accumulation,and vertical export in the Western North Atlantic, Front. Mar.Sci., 7, 227, https://doi.org/10.3389/fmars.2020.00227, 2020.
Baltar, F., Arístegui, J., Gasol, J. M., Sintes, E., and Herndl, G. J.:Evidence of prokaryotic metabolism on suspended particulate or-ganic matter in the dark waters of the subtropical North Atlantic,Limnol. Oceanogr., 54, 182–193, 2009.
Berelson, W. M.: The flux of particulate organic carbon into theocean interior: a comparison of four U.S. JGOFS regional stud-ies, Oceanography, 14, 59–67, 2001.
Betzer, P. R., Showers, W. J., Laws, E. A., Winn, C. D., Ditullio,G. R., and Kroopnick, P. M.: Primary productivity and particlefluxes on a transect of the equator at 153◦W in the Pacific Ocean,Deep-Sea Res. Pt. A, 31, 1–11, 1984.
Bianchi, D., Stock, C., Galbraith, E. D., and Sarmiento, J. L.: Dielvertical migration: Ecological controls and impacts on the bio-logical pump in a one-dimensional ocean model, Global Bio-geochem. Cy., 27, 478–491, https://doi.org/10.1002/gbc.20031,2013.
Boyd, P. W. and Trull, T. W.: Understanding the export of biogenicparticles in oceanic waters: Is there consensus?, Prog. Oceanogr.,72 276–312, 2007.
Boyd, P. W., Claustre, H., Levy, M., Siegel, D. A., and Weber, T.:Multi-faceted particle pumps drive carbon sequestration in theocean, Nature, 568, 327–335, https://doi.org/10.1038/s41586-019-1098-2, 2019.
Buesseler, K. O., Lamborg, C. H., Boyd, P. W., lam, P. J., Trull, T.W., Bidigare, R. R., Bishop, J. K. B., Casciotti, K. L., Dehairs, F.,Elskens, M., Honda, M., Karl, D. M., Siegel, D. A., silver, M. W.,Steinberg, D. K., Valdes, J., Van Mooy, B., and Wilson, S.: Re-visiting carbon flux through the ocean’s twilight zone, Science,316, 567–570, 2007.
Buesseler, K. O., Pike, S., Maiti, K., Lamborg, C. H., Siegel, D. A.,and Trull, T. W.: Thorium-234 as a tracer of spatial, temporal andvertical variability in particle flux in the North Pacific, Deep-SeaRes. Pt. I, 56, 1143–1167, 2009.
Burd, A. B., Hansell, D. A., Steinberg, D. K., Anderson, T. R., andAristegui, J.: Assessing the apparent imbalance between geo-chemical and biochemical indicators of meso- and bathypelagicbiological activity: What the @$#! is wrong with present calcu-lations of carbon budgets?, Deep-Sea Res. Pt. II, 57, 1557–1571,2010.
Biogeosciences, 18, 5141–5162, 2021 https://doi.org/10.5194/bg-18-5141-2021

J.-J. Hung et al.: Active and passive fluxes of C, N, and P in the northern South China Sea 5159
Cai, P., Zhao, D., Wang, L., Huang, B., and Dai, M.: Role of par-ticle stock and phytoplankton community structure in regulatingparticulate organic carbon export in a large marginal sea, J. Geo-phys. Res.-Oceans, 120, 2063–2095, 2015.
Cavan, E. L., Laurenceau-Cornec, E. C., Bressac, M., andBoyd, P. W.: Exploring the ecology of the mesopelagicbiological pump, Prog. Oceanogr., 176, 102125,https://doi.org/10.1016/j.pocean.2019.102125, 2019.
Chen, C.-T. A. and Borges, A. V.: Reconciling opposing viewson carbon cycling in the coastal ocean: Continental shelves assinks and near-shore ecosystems as sources of atmospheric CO2,Deep-Sea Res. Pt. II, 56, 578–590, 2009.
Chen, W., Cai, P., Dai, M., and Wei, J.: 234Th/238U disequilibriumand particulate organic carbon export in the northern South ChinaSea, J. Oceanogr., 64, 417–428, 2008.
Chen, Y.-L., Chen, H.-Y., Tuo, S.-H., and Ohki, K.: Seasonal dy-namics of new production from Trichodesium N2 fixation andnitrate uptake in the upstream Kuroshio and South China Seabasin, Limnol. Oceanogr., 53, 1705–1721, 2008.
Chen, Y.-L., Chen, H.-.Y., Lin, Y.-.H., Yong, T.-C., Taniuchi, Y., andTuo, S.: The relative contributions of unicellular and filamentousdiazotrophs to N2 fixation in the South China Sea and the up-stream Kuroshio, Deep-Sea Res. Pt. I, 85, 56–71, 2014.
Chen, Y.-L, Chen, H.-Y., Jan, S., Lin, Y.-H., Kuo, T.-H., and Hung,J.-J.: Biologically active warm-core anticyclonic eddies in themarginal seas of the western Pacific Ocean, Deep-Sea Res. Pt. I,106, 68–84, 2015.
Chen, Y.-L. L.: Spatial and seasonal variations of nitrate-basednew production and primary production in the South China Sea,Deep-Sea Res. Pt. I, 52, 319–340, 2005.
Chen, Y.-L. L., Chen, H.-Y., Lin, I-I, Lee, M.-A., and Chang, J.: Ef-fects of cold eddy on phytoplankton production and assemblagesin Luzon Strait boarding the South China Sea, J. Oceanogr., 63,671–683, 2007.
Chung, Y. C. and Hung, G. W.: Particulate fluxes and transports onthe slope between the southern East China Sea and the SouthOkinawa Trough, Cont. Shelf Res., 20, 571–597, 2000.
Copin-Montégut, G. and Avril, B.: Vertical distributions and tem-poral variation of dissolved organic carbon in the North WesternMediterranean Sea, Deep-Sea Res. Pt. I, 40, 1963–1972, 1993.
Dagg, M. J. and Wyman, K. D.: Natural ingestion rates of the cope-pods Neocalanus plumchrus and N. cristatus calculated from gutcontents, Mar. Ecol. Prog. Ser., 13, 37–46, 1983.
Dai, M. H., Cao, Z. M., Guo, X. H., Zhai, W. D., Liu, Z. Y., Yin, Z.Q., Xu, Y. Y., Gan, J. P., Hu, J. Y., and Du, C. J.: Why are somemarginal seas sources of atmospheric CO2?, Geophy. Res. Lett.,40, 2154–2158, https://doi.org/10.1002/grl.50390, 2013.
Dam, H. G. and Peterson, W. T.: The effect of temperature on theclearance rates constant of planktonic copepods, J. Exp. Mar.Biol. Ecol., 123, 1–14, 1988.
Dam, H. G. and Peterson, W. T.: Seasonal contrasts in the die1 ver-tical distribution, feeding behavior, and grazing impact of thecopepod Temora Zongicornis in Long Island Sound, J. Mar. Res.,51, 561–594, 1993.
Dam, H. G., Roman, M. R., and Youngbluth, M. J.: Downwardexport of respiratory by diel-migrant mesozooplankton at theJGOFS Bermuda time-series station, Deep-Sea Res. Pt. I, 42,1187–1197, 1995.
Davison, P. C., Checkley, D. M., Koslow, J. A., and Barlow, J.: Car-bon export mediated by mesopelagic fishes in the northeast Pa-cific Ocean, Prog. Oceanogr., 116, 14–30, 2013.
DeVaries, T., Primeau, F., and Deutsch, C.: The sequestration ef-ficiency of biological pump, Geophy. Res. Lett., 39, L13601,https://doi.org/10.1029/2012GL051963, 2012.
Doval, M. D., Álverez-Salgado, X. A., and Pérez, F. F.: Organicmatter distributions in the Eastern North Atlantic–Azores Frontregion, J. Marine Syst., 30, 33–49, 2001.
Ducklow, H. W., Steinberg, D. K., and Buesseler, K. O.: UpperOcean Carbon Export and the biological pump, Oceanography,14, 50–58, 2001.
Falkowski, P. G., Barber, R. T., and Smetacek, V.: Biogeochemicalcontrols and feedbacks on ocean primary production, Science,281, 200–206, 1998.
Feely, R. A., Sarbine, C. L., Takahashi, T. and Wanninkhof, R.: Up-take and storage of carbon dioxide in the ocean: the global CO2survey, Oceanography, 14, 18–32, 2001.
Gardner, W. D.: Sediment trap technology and surface sampling insurfacewaters, in: The Changing Ocean Carbon Cycle, a MidtermSynthesis of the Joint Global Ocean Flux Study, edited by: Han-son, R. B., Ducklow, H. W., and Field, J. G., Cambridge Univer-sity Press, Cambridge, UK, 2000.
Garside, C.: A chemiluminescent technique for the determination ofnanomolar concentrations of nitrate and nitrite in seawater, Mar.Chem., 11, 159–167, 1982.
Gismervik, I.: Stoichiometry of some marine planktonic crus-taceans, J. Plankton Res., 19, 279–285, 1997.
Gordon, D. C.: Some studies of the distribution and composition ofparticulate organic carbon in the North Atlantic Ocean, Deep-SeaRes., 17, 233–243, 1970.
Grasshoff, K., Ehrhardt, M., and Kremling, K.: Methods of Seawa-ter Analysis, Verlag Chimie, Weinheim, 143–187, 1983.
Guidi, L., Legendre, L., Reygondeau, G., Uitz, J., Stemmann, L.,and Henson, S. A.: A new look at ocean carbon remineralizationfor estimating deep-water sequestration, Global Biogeochem.Cy., 29, 1044–1059, https://doi.org/10.1002/2014gb005063,2015.
Hannides, C. C. S., Landry, M. R., Benitez-Nelson, C. R., Styles,R. M., Montoya, J. P., and Karl, D. M.: Export stoichiometryand migrant-mediated flux of phosphorus in the North PacificSubtropical Gyre, Deep-Sea Res. Pt. I, 56, 73–88, 2009.
Hansell, D. A. and Carlson, C. A.: Deep Ocean gradients in dis-solved organic carbon concentrations, Nature, 395, 263–266,1988.
Hansell, D. A. and Carlson, C. A.: Biogeochemistry of total organiccarbon and nitrogen in the Sagasso Sea: control by convectiveoverturn, Deep-Sea Res. Pt. II, 48, 1649–1667, 2001.
Hayward, T. L.: Spatial and temporal feeding patterns of copepodsfrom the North Pacific Central Gyre, Mar. Biol., 58, 295–309,1980.
He, Q., Zhan, H., Xu, J., and Cai, S.: Eddy-induced chlorophyllanomalies in the western South China Sea, J. Geophys. Res.-Oceans, 9487–9506, https://doi.org/10.1029/2019JC015371,2019.
Helmke, P., Neuer, S., Lomas, M. W., Conte, M., and Freudenthal,T.: Cross-basin difference in particulate organic carbon exportand flux attenuation in the subtropical North Atlantic gyre, Deep-Sea Res. Pt. I, 57, 213–223, 2010.
https://doi.org/10.5194/bg-18-5141-2021 Biogeosciences, 18, 5141–5162, 2021

5160 J.-J. Hung et al.: Active and passive fluxes of C, N, and P in the northern South China Sea
Hernández-León, S., Olivar, M. P., Fernández de Puelles, M. L.,Bode, A., Castellón, A., López-Pérez, C., Tuset, V. M., andGonzález-Gordillo, J. I.: Zooplankton and micronekton activeflux across the tropical and subtropical Atlantic Ocean, Front.Mar. Sci., 6, 535, https://doi.org/10.3389/fmars.2019.00535,2019.
Hernández-León, S., Koppelmann, R., Fraile-Nuez, E., Bode, A.,Mompeán, C., Irigoien, X., Olivar, M. P., Echevarría, F., Fernán-dez de Puelles, M. L., González-Gordillo, J. I., Cózar, A., Acuña,J. L., Agustí, and Duarte, C. M.: Large deep-sea zooplanktonbiomass mirrors primary production in the global ocean, Nat.Commun., 11, 6048, https://doi.org/10.1038/s41467-020-19875-7, 2020.
Hidaka, K., Kawaguchi, K., Murakami, M., and Takahashi, M.:Downward transport of organic carbon by diel migratory mi-cronekton in the western equatorial Pacific: its quantitative andqualitative importance, Deep-Sea Res. Pt. I, 48, 1923–1939,2001.
Ho, T.-Y., Chou, W.-C., Wei, C.-L., Lin, F.-J., Wong, G. T. F., andLin, H.-L.: Trace metal cycling in the surface water of the SouthChina Sea: Vertical fluxes, composition, and sources, Limnol.Oceanogr., 55, 1807–1820, 2010.
Honjo, S., Manganini, S. J., Krishfield, R. A., and Francois, R.:Particulate organic carbon fluxes to the ocean interior and fac-tors controlling the biological pump: a synthesis of global sed-iment trap programs since 1983, Prog. Oceanogr., 76, 217–285,https://doi.org/10.1016/j.pocean.2007.11.003, 2008.
Hu, J., Kawamura, H., Hong, H., and Qi, Y.: A review on the cur-rents in the South China Sea: Seasonal circulation, South ChinaSea warm current and Kuroshio intrusion, J. Oceanogr., 56, 607–624, 2000.
Hung, J. J., Lin, C. S., Hung, G. W., and Chung, Y. C.: Lateral trans-port of lithogenic particles from the continental margin of thesouthern East China Sea, Estuar. Coast. Shelf S., 49, 483–499,1999.
Hung, J.-J., Wang, S.-M., and Chen, Y.-L.: Biogeochemical controlson distributions and fluxes of dissolved and particulate organiccarbon in the Northern South China Sea, Deep-Sea Res. Pt. II,54, 1486–1503, 2007.
Hung, J.-J., Hung, C.-S., and Su, H.-M.: Biogeochemical responsesto the removal of maricultural structures from the eutrophic La-goon (Tapong Bay) in Taiwan, Mar. Environ. Res., 65, 1–17,2008.
Hung, J.-J., Wang, Y.-J., Tseng, C.-M., and Chen, Y.-L.:Controlling mechanisms and cross linkages of ecosystemmetabolism and atmospheric CO2 flux in the northernSouth China Sea, Deep-Sea Res. Pt. I, 157, 103205,https://doi.org/10.1016/j.dsr.2019.103205, 2020.
Hung, J.-J., Wang, Y.-H., Fu, K.-H., Tsai, S.-H., Lee, C.-Y., Lu,W.-Z., Shen, Y.-J., Lin, Y.-H., and Lee, I.-H.: Biogeochemicalresponses to internal-wave impacts in the continental margin offDongsha atoll in the northern South China Sea, Prog. Oceanogr.,submitted, 2021.
Karl, D. M., Christian, J. R., Dore, D. E., Hebel, D. V., Letlier,R. M., Tupas, L. M., and Winn, C. D.: Seasonal and interan-nual variability in primary production and particle flux at StationALOHA, Deep-Sea Res. Pt. II, 43, 539–568, 1996.
Knauer, G. A., Martin, J. H., and Bruland, K. W.: Fluxes of particu-late carbon, nitrogen, and phosphorus in the upper water columnof the northeast Pacific, Deep Sea Res. Pt. I, 26, 97–108, 1979.
Kobari, T., Kitamura, M., Minowa, M., Isami, H., Akamatsu, H.,Kawakami, H., Matsumoto, K., Wakita, M., and Honda, M.C.: Impacts of the wintertime mesozooplankton community todownward carbon flux in the subarctic and subtropical PacificOceans, Deep-Sea Res. Pt. I, 81, 78–88, 2013.
Le Borgne, R. and Rodier, M.: Net zooplankton and the biologicalpump: a comparison between the oligotrophic and mesotrophicequatorial Pacific, Deep-Sea Res. Pt. II, 44, 2003–2023, 1997.
Li, Q. and Farmer, D. M.: The generation and evolution of nonlinearinternal waves in the deep basin of South China Sea, J. Phys.Oceanogr., 41, 1345–1363, 2011.
Liu, K. K., Chao, S. Y., Shaw, P. T., Gong, G. C. and Chen, C.C.: Monsoon-forced chlorophyll distribution and primary pro-duction in the South China Sea: observations and a numericalstudy, Deep-Sea Res. Pt. I, 49, 1387–1412, 2002.
Liu, K. K., Atkinson, L., Quinones, R. A., and Talaue-Mcmanus, L.:Biogeochemistry of Continental Margins in a Global Contex, in:Carbon and Nutrient Fluxes in Continental Margins, edited by:Liu, K.-K., Atkinson, L., Quinones, R. A., and Talaue-McManus,L., Springer-Verlag, Berlin, 3–24, 2010.
Longhurst, A. R., Bedo, A. W., Harrison, W. G., Head, E. J. H.,Horne, E. P., Irwin, B., and Moralest, C.: NFLUX: a test of verti-cal nitrogen flux by diel migrant biota, Deep-Sea Res., 36, 705–1719, 1989.
Longhurst, A. R., Bedo, A. W., Harrison, W. G., Head, E. J. H., andSameoto, D. D.: Vertical flux of respiratory carbon by oceanicdiel migrant biota, Deep-Sea Res., 37, 685–694, 1990.
Monaco, A., Biscaye, P. E., Soyer, J., Pocklington, R., and Heuss-ner, S.: Particle fluxes and ecosystem response on a continen-tal margin: the 1985-1988 Mediterranean ECOMARGE experi-ment, Cont. Shelf Res., 10, 809–839, 1990.
Monterey, G. and Levitus, S.: Seasonal variability of mixed layerdepth for the worldocean, NOAA atlas NRSDIS 14, U.S. Gov.Printing Office, Washington, D.C., 1997.
Pace, M. L., Knauert, G. A., Karl, D. M., and Martin, J. H.: Pri-mary production, new production and vertical flux in the easternPacific Ocean, Nature, 325, 803–804, 1987.
Pai, S. C. Gong, G. C., and Liu, K. K.: Determination of dissolvedoxygen in seawater by direct spectrophotometry of total iodine,Mar. Chem., 41, 343–351, 1993.
Parekh, P., Dukiewicz, S., Follows, M. J., and Ito, T.: Atmosphericcarbon dioxide in a less dusty world, Geophy. Res. Lett., 33,L03610, https://doi.org/10.1029/2005GL025098, 2006.
Parsons, T. R., Takahashi, M., and Hargrave, B.: Biological oceano-graphic processes, 2nd Edn., Pergamon Press, Oxford, 332 pp.,1979.
Passow, U. and Carlson, C. A.: The biological pump in a high CO2world, Mar. Ecol.-Prog. Ser., 470, 249–271, 2012.
Pertola, S., Koski, M., and Viitasalo, M.: Stoichiometry of meso-zooplankton in N- and P-limited areas of the Baltic Sea, Mar.Biol., 140, 425–434, 2002.
Peters, R. S. and Downing, J. A.: Empirical analysis of zooplank-ton filtering and feeding rates, Limnol. Oceanogr., 29, 763–784,1984.
Biogeosciences, 18, 5141–5162, 2021 https://doi.org/10.5194/bg-18-5141-2021

J.-J. Hung et al.: Active and passive fluxes of C, N, and P in the northern South China Sea 5161
Pomeroy, L. R., Mathews, H. M., and Min, H. S.: Excretion of phos-phate and soluble organic phosphorus compounds by zooplank-ton, Limnol. Oceanogr., 8, 50–55, 1963.
Redfield, A. C.: The biological control of chemical factors in theenvironment, Am. Sci., 46, 205–221, 1958.
Reinthaler, T., van Aken, H., Veth, C., Aristegui, J., Robinson, C.,Williams, P. J., le, B., Lebaron, P., and Herndl, G. J.: Prokary-otic respiration and production in the meso- and bathypelagicrealm of the eastern and western North Atlantic basin, Limnol.Oceanogr., 51, 1262–1273, 2006.
Ridal, J. J. and Moore, R. M.: A re-examination of the measurementof dissolved organic phosphorus in seawater, Mar. Chem., 1990,29, 19–31, 1990.
Robinson, C., Steinberg, D. K., Koppelmann, R., Robison, B., An-derson, T. R., Arístegui J., Carlson, C. A., Frost, J. R., Ghiglione,J.-F., Hernández-León, S., Jackson, G., Queguiner, B., Rague-neau, O., Rassoulzadegan, F., Tamburini, C., Tanaka, T., Wish-ner, K. F., and Zhang, J.: Mesopelagic zone ecology and biogeo-chemistry – a synthesis, Deep-Sea Res. Pt. II, 57, 1504–1518,2010.
Sabine, C. L., Feely, R. A., Gruber, N., Key, R. M., Lee K., Bullister,J. L., Wanninkhof, R., Wong, C. S., Wallace, D. W. R., Tilbrook,B., Millero, F. J., Peng, T. H., Kozyr, A., Ono, T., and Rios, A. F.:The oceanic sink for anthropogenic CO2, Science, 305, 367–371,2004.
Sanders, R., Henson, S. A., Koski, M., De la Rocha, C. L., Painter,S. C., Poulton, A. J., Riley, J., Salihoglu, B., Visser, A., Yool, A.,Bellerby, R., and Martin, A. P.: The biological carbon pump inthe north Atlantic, Prog. Oceanogr., 129, 200–218, 2014.
Sarmiento, J. L. and Gruber, N.: Ocean Biogeochemical Dynamics,Princeton University Press, Princeton and Oxford, 2006.
Shaw, P. T. and Chao, S. Y.: Surface circulation in the South ChinaSea, Deep-Sea Res. Pt. I, 41, 1663–1683, 1994.
Shih, Y.-Y., Hung, C.-C., Gong, G.-C., Chung, W.-C., Wang,Y.-H., Lee, I-W., Chen, K.-S., and Ho, C.-Y.: Enhanced par-ticulate organic carbon export at eddy edges in the olig-otrophic Western North Pacific Ocean, Plos One, 10, e0131538,https://doi.org/10.1371/journal.pone.0131538, 2015.
Steinberg, D. K. and Landry, M. R.: Zooplankton and ocean carboncycle, Annu. Rev. Mar. Sci., 9, 413–444, 2017.
Steinberg, D. K., Caelson, C. A., Bates, N. R., Goldthwait, S. A.,Madin, L. P., and Michaels, A. F.: Zooplankton vertical migra-tion and the active transport of dissolved organic and inorganiccarbon in the Sargasso Sea, Deep-Sea Res. Pt. I, 47, 137–158,2000.
Steinberg, D. K., Benjamin A. S., Mooy, K., Buesseler, K. O., Boyd,P. W., Kobari, T., and Karl, D. M.: Bacterial vs. zooplankton con-trol of sinking particle flux in the ocean’s twilight zone, Limnol.Oceanogr., 53, 1327–1338, 2008.
Strickland, J. D. H. and Parsons, T. R.: A practical handbook ofseawater analysis, Bulletin Fisheries Research Board of Canada,Ottawa, 311 pp., 1972.
Stukel, M. R., Benitez-Nelson, C. R., Decima, M., Taulor, A. G.,Buchwald, C., and Landry, M. R.: The biological pump in theCosta Rica Dome: an open-ocean upwelling system with highnew production and low export, J. Plankton Res., 38, 348–365,2016.
Takahashi, K., Kuwata, A., Sugisaki, H., Uchikawa, K., and Saito,H.: Downward carbon transport by diel vertical migration of the
copepods Metridiapacifica and Metridiaokhotensis in the Oy-ashio region of the western subarctic Pacific Ocean, Deep-SeaRes. Pt. I, 56, 1777–1791, 2009.
Thomas, H., Bozec, Y., Elkalay, K., and De Baar, H.: Enhancedopen ocean storage of CO2 from shelf sea pumping, Science,304, 1005–1008, 2004.
Toggweiler, J. R., Gnanadesikan, A., Carson, S., Murnane, R., andSarmiento, J. L.: Representation of the carbon cycle in box mod-els and GCMs: 1. Solubility pump, Global Biogeochem. Cy., 17,1026, https://doi.org/10.1029/2001GB001401, 2003.
Tomson-Bulldis, A. and Karl, D.: Application of a novel methodfor phosphorus determinations in the oligotrophic North PacificOcean, Limnol. Oceanogr., 43, 1565–1577, 1998.
Tsai, L.-S.: Geochemistry of settling materials in the northern SouthChina Sea, MS thesis, National Sun Yat-sen University, Kaohsi-ung, Taiwan, 93 pp., 2007.
Turner, J. T.: Zooplankton fecal pellets, marine snow, phytodetritusand the ocean’s biological pump, Prog. Oceanogr., 130, 205–248,2015.
Valencia, B., Decima, M., and Landry, M. R.: Environmental ef-fects on mesozooplankton size structure and export flux at stationALOHA North Pacific subtropical gyre, Global Biogeochem.Cy., 32, 289–305, https://doi.org/10.1002/2017GB005785, 2018.
Vidal, J.: Physioecology of zooplankton. 1. Effects of phytoplank-ton concentration, temperature, and body size on the growth rateof Calanus pacificus and Pseudocalanus sp., Mar. Biol., 32, 99–110, 1980.
Walsh, J. J.: Importance of continental margins in the marine bio-geochemical cycling of carbon and nitrogen, Nature, 350, 53–55,1991.
Wang, X., Zhang, J., Zhao, X., Chen, Z., Ying, Y., Li, Z., Xu, D.,Liu, Z., and Zhou, M.: Vertical distribution and diel migration ofmesopelagic fishes on the northern slope of the South China Sea,Deep-Sea Res. Pt. II, 167, 128–141, 2019.
Wang, Y. H., Dai, C. F., and Chen, Y. Y.: Physical and ecolog-ical processes of internal waves on an isolated reef ecosys-tem in the South China Sea, Geophys. Res. Lett., 30, 2121,https://doi.org/10.1029/2003GL018532, 2007.
Wei, C.-L., Jen, K.-L., and Chu, K.: Sediment trap experimentsin the water column off southwestern Taiwan, J. Oceanogr., 50,403–414, 1994.
Wei, C.-L., Lin, S.-Y., Sheu, D. D.-D., Chou, W.-C., Yi, M.-C.,Santschi, P. H., and Wen, L.-S.: Particle-reactive radionuclides(234Th, 210Pb, 210Po) as tracers for the estimation of export pro-duction in the South China Sea, Biogeosciences, 8, 3793–3808,https://doi.org/10.5194/bg-8-3793-2011, 2011.
Welschmeyer, N. A.: Fluormetric analysis of chlorophyll a on thepresence of chlorophyll b and pheopigments, Limnol. Oceanogr.,39, 1985–1992, 1994.
Wong, G. T. F., Ku, T.-L., Mulholland, M., Tseng, C.-M., and Wang,D.-P.: The SouthEast Asian Time-series Study (SEATS) and thebiogeochemistry of the South China Sea–An overview, Deep-SeaRes. Pt. II, 54, 1434–1447, 2007.
Wyrtki, K.: Physical oceanography of the Southeast Asianwaters,Scientific results of marine investigations of the South China Seaand the Gulf of Thailand, Scripps Institute of Oceanography, LaJolla, California, NAGA report, vol. 2, 195 pp., 1961.
Xiu, P., Chai, F., Shi, L., Xue, H., and Chao, Y.: A census of eddyactivities in the South China Sea during 1993–2007, J. Geophys.
https://doi.org/10.5194/bg-18-5141-2021 Biogeosciences, 18, 5141–5162, 2021

5162 J.-J. Hung et al.: Active and passive fluxes of C, N, and P in the northern South China Sea
Res., 115, C03012, https://doi.org/10.1029/2009JC005657,2010.
Yebra, L., Almeida, C., and Hernández-León, S.: Vertical distribu-tion of zooplankton and active flux across an anticyclonic eddy inthe Canary Island waters, Deep Sea Res. Pt. I, 52, 69–83, 2005.
Yebra, L., Herrera, L., Mercado, J. M., Cortes, D., Gomez-Jakobsen,F., Alonso, A.,Sanchez, A., Salles, S., and Valcarcel-Perez, N.:Zooplankton production and carbon export in the western Albo-ran Sea gyre (SW Mediterranean), Prog. Oceanogr., 167, 64–77,2018.
Zhai, W. D., Dai, M. H., Cai, W. J., Wang, Y. C., and Hong, H. S.:The partial pressure of carbon dioxide and air–sea fluxes in thenorthern South China Sea in spring, summer and autumn, Mar.Chem., 96, 87–97, 2005.
Zhai, W.-D., Dai, M.-H., Chen, B.-S., Guo, X.-H., Li, Q.,Shang, S.-L., Zhang, C.-Y., Cai, W.-J., and Wang, D.-X.: Sea-sonal variations of sea–air CO2 fluxes in the largest trop-ical marginal sea (South China Sea) based on multiple-year underway measurements, Biogeosciences, 10, 7775–7791,https://doi.org/10.5194/bg-10-7775-2013, 2013.
Zhou, K., Dai, M., Xiu, P., Wang, L., Hu, J., and Benitez-Nelson: Transient enhancement and decoupling of carbon andopal export in cyclonic eddies, J. Geophys. Res.-Oceans, 125,e2020JC016372, https://doi.org/10.1029/2020JC016372, 2020.
Biogeosciences, 18, 5141–5162, 2021 https://doi.org/10.5194/bg-18-5141-2021