
Action of the anticancer drug cisplatin investigated by...
136
Action of the anticancer drug cisplatin investigated by molecular simulation Der Fakult¨ at f¨ ur Mathematik, Informatik und Naturwissenschaften der RWTH Aachen University vorgelegte Dissertation zur Erlangung des akademischen Grades eines Doktors der Naturwissenschaften von M.Sc. Trung Hai, Nguyen aus An Giang, Vietnam
Transcript of Action of the anticancer drug cisplatin investigated by...

Action of the anticancer drugcisplatin investigated by molecular
simulation
Der Fakultat fur Mathematik, Informatik und Naturwissenschaften derRWTH Aachen University vorgelegte Dissertation zur Erlangung des
akademischen Grades eines Doktors der Naturwissenschaften
von
M.Sc. Trung Hai, Nguyen
aus An Giang, Vietnam


Advisors:Prof. Dr. Paolo CarloniDr. Emiliano IppolitiDr. Giulia Rossetti
PhD committee:
Prof. Dr. Carsten Honerkamp (Chair)Prof. Dr. Paolo Carloni (Reporter)Prof. Dr. Evert Jan Meijer (Reporter)Prof. Dr. Jorg Fitter (Examiner)


I hereby affirm that I composed this work independently and used no other than thespecified sources and tools and that I marked all quotes as such.
Ich erklare hiermit, dass ich die vorliegende Arbeit selbstandig verfasst und keineanderen als die angegebenen Quellen und Hilfsmittel verwendet habe.
Aachen, September 24th, 2012
Trung Hai Nguyen

Bibliographic Information
Part of this thesis has been published at:
Nguyen, T. H.; Arnesano, F.; Scintilla, S.; Rossetti, G.; Ippoliti, E.; Carloni, P.;Natile, G. Structural Determinants of Cisplatin and Transplatin Binding to the Met-Rich Motif of Ctr1: A Computational Spectroscopy Approach. Journal of ChemicalTheory and Computation 2012, 8, 2912–2920.
Abstract
Cancer is one of the leading causes of death worldwide. Among various chemothera-peutic drugs currently used in cancer treatment, cisplatin is one of the most impor-tant and successful drugs. It is the best hope for patients with testicular, ovarian andmany other solid tumors. Cisplatin kills cancer cells by covalently binding to theirDNA and causing DNA damages (cisplatin-DNA adducts). Albeit very efficient,cisplatin’s clinical utility is limited due to its toxic side effects and resistance.
The mechanisms behind drug resistance are far from being completely understood.Experimental studies so far have suggested that binding of cisplatin to many cellularproteins is a key mechanism of drug resistance. In particular, the copper influxprotein Ctr1 has been shown to be responsible for the decrease of cellular uptakeof cisplatin, commonly found in resistant cells. Furthermore, even if cisplatin cansuccessfully reach and bind to the DNA, cancer cells may be able to repair thecisplatin-DNA adducts by employing a number of proteins involved in the so-calledNucleotide Excision Repair (NER) pathway.
This thesis has contributed to investigating processes, which are relevant to cisplatinresistance mechanism, using computational physics tools.
(i) First, we have studied binding of cisplatin and transplatin (a pharmacologi-cally inactive trans isomer of cisplatin) to a model peptide (called Mets7) thatmimics one of the methionine(Met)-rich motifs of Ctr1. We have used a setof computational tools including QM/MM simulations, force matching tech-nique, replica exchange MD simulations and computational spectroscopy topredict the structures of the adducts formed due to the binding of cisplatinand transplatin to Mets7. Comparison between calculated and experimentalspectroscopic data such as NMR, EXAFS and CD allows us to validate ourpredicted structures and to propose the most relevant species in water solu-tion. The structural models arising from our calculations may serve as themolecular basis for further attempts to understand cisplatin uptake mediatedby Ctr1.
(ii) Then, we have performed preliminary calculations on the interaction betweencisplatin-DNA adduct and the High Mobility Group Box 1 (HMGB1) pro-tein. HMGB1 (a DNA-binding protein) has been shown to be able to blockthe NER repair pathway by binding to the cisplatin-DNA adducts and shield-ing them from being repaired by NER proteins. Although experimental studieshave shown the structural determinants of the cisplatin-DNA-HMGB1 complexand also provided the binding affinity, the mechanism of molecular recognitionbetween cisplatin-DNA adduct and HMGB1 is still unknown. We aim at in-vestigating structural and energetic insights of the binding of HMGB1 to thecisplatin-DNA adduct by applying free energy calculations based on metady-namics method. This thesis presents necessary calculations towards this goal.


Acknowledgments
First of all, I would like to deeply thank my supervisor Prof. Dr. Paolo Carloni forhis support and guidance, which are essential to the completion of the thesis.
I would like to express my gratitude to Prof. Giovanni Natile and Dr. Fabio Arnesanoat Bari University, Italy for their great collaboration. My PhD project has beenbenefited greatly from the important scientific insights of Prof. Natile and Dr.Arnessano. I would like to acknowledge that the EXAFS measurements shown inchapter 4 were done by Prof. Giovanni Natile’s group.
Special thanks also go to Dr. Emiliano Ippoliti and Dr. Giulia Rossetti for theirpatient help and suggestions throughout my PhD years in the Computational Bio-physics Group.
I would like to extend my sincere thanks to all members of the ComputationalBiophysics Group for their help, discussions and for making me feel being at homeat work.
I would like to thank the PhD committee: Prof. Dr. Evert Jan Meijer, Prof. Dr.Jorg Fitter and Prof. Dr. Carsten Honerkamp for their valuable time in reviewingmy thesis work.
The financial support from German Research School for Simulation Sciences GmbHis sincerely acknowledged.
Finally, I would like to thank my family: Ba, Me, Anh Chi Hai, Hot Mit, Hot Duaand Nhan for their love, encouragement, patience, and trust in me.


Contents
1 Introduction 1
2 Biophysical background 5
2.1 Introduction . . . . . . . . . . . . . . . . . . . . . . . . . . . . . . . . 5
2.2 Mechanism of action . . . . . . . . . . . . . . . . . . . . . . . . . . . 6
2.2.1 Cisplatin-DNA adducts . . . . . . . . . . . . . . . . . . . . . . 7
2.2.2 Recognition of cisplatin-DNA adducts: HMGB1 protein . . . . 8
2.3 Mechanisms of Resistance . . . . . . . . . . . . . . . . . . . . . . . . 10
2.4 Copper transport proteins and their binding to cisplatin . . . . . . . 12
2.4.1 Ctr1 . . . . . . . . . . . . . . . . . . . . . . . . . . . . . . . . 12
2.4.2 ATP7A, ATP7B and Atox1 . . . . . . . . . . . . . . . . . . . 13
3 Methods 17
3.1 Molecular dynamics . . . . . . . . . . . . . . . . . . . . . . . . . . . . 17
3.1.1 Statistical mechanical basis of molecular dynamics . . . . . . . 17
3.1.2 Derivation of molecular dynamics equation . . . . . . . . . . . 18
3.1.3 Ab initio molecular dynamics . . . . . . . . . . . . . . . . . . 21
3.1.3.1 Ehrenfest MD . . . . . . . . . . . . . . . . . . . . . . 21
3.1.3.2 Born-Oppenheimer MD . . . . . . . . . . . . . . . . 22
3.1.3.3 Car-Parrinello MD . . . . . . . . . . . . . . . . . . . 23
3.1.3.4 Density Functional Theory . . . . . . . . . . . . . . 24
3.1.3.5 Basis set . . . . . . . . . . . . . . . . . . . . . . . . . 27
3.1.4 Force field-based molecular dynamics . . . . . . . . . . . . . . 29
3.1.5 Hybrid Car-Parrinello/molecular mechanics (QM/MM) molec-ular dynamics . . . . . . . . . . . . . . . . . . . . . . . . . . . 30
3.1.6 Force matching procedure . . . . . . . . . . . . . . . . . . . . 32

3.1.7 Ewald summation . . . . . . . . . . . . . . . . . . . . . . . . . 33
3.1.8 Molecular dynamics in NPT ensemble . . . . . . . . . . . . . . 34
3.1.8.1 Thermostats . . . . . . . . . . . . . . . . . . . . . . 35
3.1.8.2 Barostats . . . . . . . . . . . . . . . . . . . . . . . . 37
3.1.9 Replica exchange with solute tempering . . . . . . . . . . . . 39
3.2 Computational spectroscopy . . . . . . . . . . . . . . . . . . . . . . . 40
3.2.1 NMR chemical shifts . . . . . . . . . . . . . . . . . . . . . . . 41
3.2.2 Extended X-ray absorption fine structure (EXAFS) . . . . . . 43
3.2.3 Circular dichroism (CD) . . . . . . . . . . . . . . . . . . . . . 45
4 Structural determinants of cisplatin and transplatin binding to Ctr1’sMet-rich motif: a computational spectroscopy approach 49
4.1 Introduction . . . . . . . . . . . . . . . . . . . . . . . . . . . . . . . . 50
4.2 Computational protocol . . . . . . . . . . . . . . . . . . . . . . . . . 51
4.2.1 Molecular models . . . . . . . . . . . . . . . . . . . . . . . . . 51
4.2.2 QM/MM simulations . . . . . . . . . . . . . . . . . . . . . . . 53
4.2.3 Force matching procedure . . . . . . . . . . . . . . . . . . . . 54
4.2.4 Replica exchange with solute tempering (REST) simulations . 54
4.2.5 Computational spectroscopy . . . . . . . . . . . . . . . . . . . 55
4.2.5.1 CD . . . . . . . . . . . . . . . . . . . . . . . . . . . . 55
4.2.5.2 NMR . . . . . . . . . . . . . . . . . . . . . . . . . . 56
4.2.5.3 EXAFS . . . . . . . . . . . . . . . . . . . . . . . . . 57
4.3 EXAFS measurements . . . . . . . . . . . . . . . . . . . . . . . . . . 57
4.4 Results and discussion . . . . . . . . . . . . . . . . . . . . . . . . . . 58
4.4.1 Peptide conformation . . . . . . . . . . . . . . . . . . . . . . . 58
4.4.2 Platinum coordination . . . . . . . . . . . . . . . . . . . . . . 59
4.4.2.1 EXAFS spectra . . . . . . . . . . . . . . . . . . . . . 62
4.4.2.2 NMR chemical shifts . . . . . . . . . . . . . . . . . . 63
4.5 Conclusions . . . . . . . . . . . . . . . . . . . . . . . . . . . . . . . . 65

5 Binding of the platinated DNA to HMGB1 protein: preliminaryresults 69
5.1 Introduction . . . . . . . . . . . . . . . . . . . . . . . . . . . . . . . . 69
5.2 Derivation of force field parameters for the platinated moiety . . . . . 71
5.2.1 QM/MM simulation . . . . . . . . . . . . . . . . . . . . . . . 71
5.2.2 Force matching procedure . . . . . . . . . . . . . . . . . . . . 72
5.3 Force field based MD simulation . . . . . . . . . . . . . . . . . . . . . 73
5.4 Summary . . . . . . . . . . . . . . . . . . . . . . . . . . . . . . . . . 74
6 Summary and outlooks 81
A Appendix 83
A.1 DFT-based geometry optimization of the model compounds . . . . . 83
A.2 Conversion of NMR chemical shifts . . . . . . . . . . . . . . . . . . . 83
A.3 QM/MM simulations and 195Pt NMR chemical shielding calculationof the reference compound [PtCl6]2− . . . . . . . . . . . . . . . . . . 84
A.4 Sampling of the QM region by QM/MM simulations . . . . . . . . . . 84
A.5 Metadynamics method . . . . . . . . . . . . . . . . . . . . . . . . . . 85
A.6 Supporting tables and figures . . . . . . . . . . . . . . . . . . . . . . 87
Bibliography 95
List of Figures 116
List of Tables 120


1Introduction
The discovery of the pharmacological properties of cisplatin (Fig. 1.1a) has been anutmost important event in cancer research [1, 2, 3, 4, 5, 6]. The approval of cisplatinby U.S. Food and Drug Administration back in 1978 revolutionized anticancer ther-apy [7, 8]. Today, cisplatin is one of the most important anticancer drugs [1, 2]. Itis widely used in clinics to treat various types of cancers, such as testicular, ovarian,cervical, head and neck, esophageal, and small-cell lung cancers [1, 2, 4, 8]. Cisplatinis especially effective in the treatment of testicular cancer with the overall cure rateexceeding 90% [4, 7]. In contrast with cisplatin, its geometrical isomer, transplatin(Fig. 1.1b), is inactive against cancers.
Figure 1.1 Chemical structures of a) cisplatin (cis-diamminedichloroplatinum(II))and b) transplatin (trans-diamminedichloridoplatinum(II)).
DNA is believed to be the primary target of cisplatin [1, 2, 3, 4, 9]. Cisplatin killscancer cells by covalently binding to their DNA at adjacent guanine (G) bases andcausing the formation of intra-strand cross-links in the DNA (called cisplatin-DNAadducts) [9, 12, 20]. The cisplatin-DNA adducts in turn inhibit DNA replication[21, 22] and transcription [24, 25]. Since these are extremely important cellular
2 1. Introduction
processes, their inhibition causes tumor cells to undergo suicide via the so-calledapoptosis process (programmed cell death) [2, 28].
To reach its target, cisplatin takes a long journey, from the blood stream to thetumor cell’s nucleus, where the DNA is located. On that route, cisplatin binds to avariety of proteins (Fig. 1.2). This causes several major drawbacks. First, proteinbinding may lead to harmful side effects [9, 29, 143]. Hence, cisplatin is toxic.Second, binding to proteins is exploited by the tumor cells for the development ofdrug resistance [2, 4, 28, 30, 85, 86]. The latter is correlated to a decrease in the rateof drug influx and to an increase in the rate of drug efflux/deactivation, with respectto non-resistant cells [2, 30, 82]. It follows that only a small fraction of the druggiven to patients (about 1%) reaches DNA [30, 87]. Furthermore, drug-resistant cellsare able to repair cisplatin-induced DNA damages [2, 4, 28]. They use a numberof proteins involved in the so-called Nucleotide Excision Repair (NER) pathwayto remove platinated nucleotides from the DNA, allowing cancer cells to survive[2, 28, 86, 98]. Second generation platinum-based drugs currently used in clinics suchas oxaliplatin and carboplatin essentially suffers from the same problems [2, 4, 14, 24].Understanding and eventually counteracting drug toxicity and resistance require adetailed knowledge of the molecular events associated with cisplatin’s cellular uptakeand platinated DNA repair mechanisms [28, 29, 86, 110]. What we have knownso far originates exclusively from experimental studies and it is summarized here[29, 30, 31]:
(i) Cisplatin enters the cell by passive diffusion [30, 31] and by trans-membraneproteins, such as the copper transporter 1 (Ctr1) [29, 30, 110] (Fig. 1.2).
(ii) Once inside the cell, cisplatin can follow rather different fates (Fig. 1.2):
Deactivation: Cisplatin can be deactivated by binding to many proteins, in-cluding the thiol-rich metallothioneins (MTs), glutathione (GSH) [32] and thecopper chaperone Atox1 [33, 34].
Increase of efflux: The copper efflux proteins ATP7A and ATP7B in the se-cretory vesicle have been found to bind cisplatin and enhance its efflux [33].
Binding to DNA: Only a small fraction of cisplatin, which evades the inactiva-tion and efflux processes above, enters the nucleus by an as-yet undeterminedmechanism and interacts with DNA [30]. There, NER repair mechanism maytake place. Some proteins, such as the High Mobility Group Box 1 (HMGB1)protein [1, 24, 76, 78], have been found to inhibit the NER repair mechanismby binding specifically to the cisplatin-DNA adduct and shielding it from beingrepaired by NER proteins [72, 73, 74].
Structural information on the cisplatin-protein adducts involved in all of these pro-cesses is essential to improve our understanding of drug resistance mechanism andto design new drugs with reduced resistance and increased ability to bind to DNA.Unfortunately, such information is mostly lacking, with a notable exception of thecomplex between HMGB1 and platinated DNA [76].
Computational approaches are widely used to investigate cisplatin and other plat-inum drugs and their interactions with biomolecules [45]–[62], [155]–[165]. However,

3
Pt
Fluid phase endocytosis
Pt Passive diffusion
Pt
Pt Pt
Ctr1 Pt
Pt
OCT1-3
Pt
Pt Pt
Pt Pt
Pt
Pt
Pt
Pt
Repair Apoptosis
Pt Pt
Pt
ATP ADP
ATP ADP
Pt
GSH
H+
Pt GS-
ATP ADP
Pt GS-
ATP7A
ATP7B
[Cl-] = ~100 mM
[Cl-] = 4 – 50 mM
MRP1-5
MT
Figure 1.2 A simplified scheme of the mechanisms affecting cellular uptake, dis-tribution and efflux of cisplatin (adapted from [30]).
almost all of the computational studies so far have focused mainly on structuralproperties of adducts of cisplatin and other platinum drugs with DNA [45]–[62].The key issues of toxicity and resistance of cisplatin have been much less investi-gated computationally. This thesis is meant to provide one of the first contributionsin this field. It focuses on two aspects:
(i) Binding of cisplatin and its isomer transplatin to a copper transport proteincalled Ctr1. Ctr1 is a trans-membrane protein, located on the cell’s surface[111, 112, 113, 114, 115] (Fig. 1.2). It has been found to transport cisplatinacross the cell’s membrane [29, 30, 110] although the exact transport mecha-nism is still unknown. Here, using computational approaches, we have providedthe molecular structures of complexes of cisplatin and transplatin with a pep-tide (called Mets7) that mimics the extracellular binding domain of Ctr1 [63].Validation of our numerical results by biophysical experiments is fundamental.Therefore, the computational protocols presented in this thesis have been cho-sen to make comparison with available experimental data as direct as possible.Starting from molecular simulations we have computed NMR, EXAFS andCD spectra, which have been systematically compared with the correspond-ing experimental data. This approach represents a significant improvementwith respect to the computational studies published so far, dealing essentiallywith the comparison between computed and experimental structures [45]–[62],[155]–[165]. Indeed, the computation of spectroscopic data allows a more direct,hence, reliable comparison with experiment. The molecular structures arisingfrom our simulations can serve as the molecular basis for further attempts toelucidate the mechanism of cellular uptake of cisplatin.

4 1. Introduction
(ii) Investigation of the mechanism of molecular recognition between cisplatin-DNAadduct and HMGB1 protein. The free energy profile as a function of reactioncoordinates describing the association process of HMGB1 protein and cisplatin-DNA adduct is a key physical quantity to elucidate the molecular mechanism ofthe binding process. The free energy difference can be quantitatively correlatedwith the experimental binding affinity [283]. This thesis presents preliminarycalculations, which will serve as a basis to perform free energy calculationsusing metadynamics method [284, 285].

2Biophysical background
2.1 Introduction
The antitumor effect of cisplatin was discovered by chance by Barnett Rosenberg atMichigan State University in 1965 [5, 6, 8]. The drug was approved for clinical use bythe U.S. Food and Drug Administration (ADF) in 1978 [8]. Cisplatin is an inorganiccompound, in which a Pt(II) ion is coordinated by two ammine and two chloridoligands in cis square planar geometry (Fig. 1.1a). Its geometrical isomer, transplatinhas the same chemical composition, but the ligands are in trans arrangement (Fig.1.1b). While cisplatin is active against many tumors, transplatin is not [10].
Nowadays, cisplatin is routinely used in clinics either as a single agent or in combi-nation therapy to treat various types of cancers such as testicular, ovarian, small-celllung, head and neck, cervical, and colorectal cancers [1, 2, 11]. Cisplatin is particu-larly effective against testicular cancer, for which the overall cure rate exceeds 90%,or nearly 100% for early stage disease [7].
However, cisplatin suffers from two major shortcomings: toxic side effects and resis-tance [1, 4, 28, 13]. Treatment with cisplatin indeed causes severe side effects such asnephrotoxicity, nausea and vomiting, bone marrow damage and neurotoxicity [13].Moreover, many tumor cells displays intrinsic or acquired resistance to cisplatin,which further limits its clinical utility [2, 4]. These problems of cisplatin have gener-ated a large interest in developing new platinum-based drugs with a better clinicalprofile [2, 3, 14]. This has led to the discovery and approval of second generationof platinum drugs, including carboplatin and oxaliplatin. However, these drugs alsosuffer from resistance [1, 2, 14]. The efforts to overcome cisplatin resistance have beenproven very challenging and require a detailed knowledge of how cisplatin inducesits antitumor effect and, more importantly, how tumors are or become resistant.

6 2. Biophysical background
2.2 Mechanism of action
DNA binding is believed to be a key cellular event that triggers the anticancer ac-tivity of cisplatin [1, 2, 4, 9]. Studies over many years have provided convincingevidences in favor of this hypothesis [1]. Bacteria treated with cisplatin show phe-notypes that are characteristic of those evoked by DNA-damaging agents [15]. Inaddition, DNA-repair-deficient cells are indeed more sensitive to cisplatin [16, 17].There is a significant correlation between cisplatin-DNA adduct levels and sensitivityof cisplatin-treated cells [18, 19].
Cisplatin binds to DNA, preferentially at the N7 position of guanine bases [9, 20, 23],inhibiting replication [9, 21, 22] and transcription of the DNA [24, 25, 26, 27]. Theinhibition of these critical DNA-related processes triggers subsequent intracellularevents leading to apoptotic cell death [28]. However, before binding to the DNA,cisplatin has to survive a long journey from the blood stream to the tumor cell’snucleus where DNA is located. The current knowledge on the steps leading cisplatinfrom intravenous injection to nuclear DNA binding can be summarized as follows(Fig. 1.2) [29, 30, 31].
(i) Cisplatin diffuses in the blood stream and in the extracellular fluids, wherethe chloride (Cl−) concentration is relatively high (∼100mM) [29, 30]. Thehigh concentration of chloride prevents cisplatin from undergoing aquation re-actions, which transform cisplatin into activated monoaquated or diaquatedspecies (cis-[Pt(NH3)2H2OCl]+ and cis-[Pt(NH3)2(H2O)2]2+). Therefore, cis-platin can reach the cancer cells’ surface in the intact neutral form [31].
(ii) Cisplatin enters cells both by passive diffusion across the cell membrane andby active transport using the high-affinity copper transporter 1 Ctr1 and theorganic cation transporters OCT1–3 [30]. Pinocytosis, characterized by theformation of an endocytic vesicle incorporating a portion of external solutioncontaining all chemicals there present (including cisplatin), is another possibil-ity of drug uptake [132] (Fig. 1.2).
(iii) Once inside the cell, the lower concentration of chloride in the cytoplasm (4–50mM) facilitates the aquation process of cisplatin to form cis-[Pt(NH3)2H2OCl]+
and cis-[Pt(NH3)2(H2O)2]2+ [30, 31]. The aquated forms are more reactive to-wards cellular targets. Although DNA is the primary target of cisplatin, manyother nucleophilic components present in the cytosol can bind cisplatin. Theseinclude thiol-rich metallothioneins (MTs), glutathione (GSH) [32] and the cop-per chaperone Atox1 [33, 34]. All of these proteins sequester cisplatin, andeventually deactivate it. Cisplatin can also be exported out of the cell by thecopper pumps ATP7A and ATP7B in the secretory vesicles. These proteinscan bind and enhance cisplatin efflux [33]. Finally, only a small fraction ofcisplatin, which evades the inactivation and efflux processes above, enters thenucleus by an as-yet undetermined mechanism and bind to DNA, triggeringapoptotic cell death if the DNA lesion is not repaired [30, 31].

2.2. Mechanism of action 7
2.2.1 Cisplatin-DNA adducts
Cisplatin forms a spectrum of intra- and inter-strand DNA cross-links, which havebeen identified both in vitro and in vivo (Fig. 2.1) [1, 24, 35, 36, 37, 38]. The majoradduct, comprising ∼65% of the total products, is a cis-1,2-[Pt(NH3)2]2+-d(GpG)intra-strand cross-link (Fig. 2.1a) [1]. Other minor products include 1,2-d(ApG)(∼25%) and 1,3-d(GpNpG) (Fig. 2.1b) (5–10%) intra-strand adducts, as well asa smaller number of inter-strand cross-links (Fig. 2.1c) and monodentate adducts[1]. Transplatin, a clinically inactive isomer of cisplatin (Fig. 1.1b) is unable toform 1,2-intra-strand cross-links, due to stereo-chemical constraints [39, 40]. Thisimplies that intra-strand adducts are more likely to be responsible for the anticanceractivity of cisplatin [1]. There is no correlation between the frequency of inter-strandcross-links formation and cytotoxicity of cisplatin, which provides further evidencethat intra-strand cross-links are essential to tumor cell death [1, 39, 40].
Figure 2.1 Major cisplatin-DNA adducts: (a) 1,2-[Pt(NH3)2]2+-d(GpG) intra-strand cross-link; (b) 1,3-[Pt(NH3)2]2+-d(GpTpG) intra-strand cross-link; (c) inter-strand cross-link (adapted from [24]). DNA’s backboneis shown in ribbon; their nucleobases in bond representation; the plat-inum atom is represented as a sphere.
The X-ray structure of a platinated DNA dodecamer duplex containing the majorcis-1,2-[Pt(NH3)2]2+-d(GpG) intra-strand cross-link revealed that DNA platinationinduces a global bend in the DNA duplex by 35◦–40◦ and unwinds the double helixby ∼25◦ [1, 24, 41, 42] (Fig. 2.2a). The major groove is compacted and the minorgroove widened and flattened. The DNA takes on A-form properties to the 5’ anda B-form structure on the 3’ side of the 1,2-d(GpG) adduct. The roll angle be-tween platinated guanine bases is ∼26◦ [41]. NMR spectroscopic studies [1, 43, 44]revealed some differences between the solid state and solution structures. The so-lution structures (Fig. 2.2b) shows a bend angle of 60◦–70◦ and a large roll angleof ∼49◦ at the 1,2-[Pt(NH3)2]2+-d(GpG) intra-strand cross-link. In addition, theNMR structures contain exclusively B-form DNA. The 1,3-[Pt(NH3)2]2+-d(GpTpG)

8 2. Biophysical background
intra-strand cross-link on the duplex DNA (Fig. 2.1(b)) has also been solved byNMR spectroscopy [64, 65]. In this structure, the duplex is bent by ∼30◦ and thedouble helix displays local unwinding and widening of the minor groove, similarly tofeatures of the 1,2-[Pt(NH3)2]2+-d(GpG) intra-strand cross-link. However, the 1,3-[Pt(NH3)2]2+-d(GpTpG) adduct differs in that base pairing of the 5’ G*-C, wherethe “*” denotes the platinated site, is disrupted and the internal thymidine of theadduct is extruded from the minor groove [24].
(a) (b)
Figure 2.2 Structures of cisplatin-DNA adduct: (a) from X-ray [41] and (b) fromNMR [44]. Atoms in DNA are represented by lines while the cisplatinmoiety is shown in ball-stick model (platinum in gray, nitrogen in blue).
2.2.2 Recognition of cisplatin-DNA adducts: HMGB1 protein
Many proteins have been identified to bind to cisplatin-DNA adducts [1, 9, 24]. Theseinclude High Mobility Group Box (HMGB) proteins, repair proteins, transcriptionfactor proteins and others [1, 3, 24]. Among these proteins, the High MobilityGroup Box 1 (HMGB1) protein has been extensively studied, and for which mostinformation is available.
HMGB1 protein is one of the early proteins discovered to bind cisplatin-DNA adducts[66, 67]. HMGB1 is an abundant protein (∼106 copies per cell) [68]. It has beensuggested that HMGB1 play an important role in regulation of many cellular pro-cesses involving DNA, such as, chromatin remodeling, recombination, replication,and transcription [68, 69]. HMGB1 expression levels have been shown to correlatewith cisplatin sensitivity. In vitro repair essays revealed that HMGB1 can inhibitNucleotide Excision Repair (NER) of cisplatin-DNA adducts (see Sec. 2.3), presum-ably by binding to and shielding the damaged site from recognition by the repair

2.2. Mechanism of action 9
proteins [70, 71, 72, 73, 74]. An increased level of HMGB1 following hormone treat-ment sensitizes breast cancer cells to cisplatin by 2-fold (the number of cancer cellskilled by cisplatin increases twice when treated with the same amount of drug) [74].Moreover, additional expression of HMGB2, a protein over 85% identical to HMGB1,in human lung cancer cells enhanced cisplatin sensitivity more than 3-fold [75].
The structure of a complex between 16mer duplex DNA containing a 1,2-[Pt(NH3)2]2+-d(GpG) intra-strand cross-link and the domain A of HMGB1 was solved by X-raycrystallography (Fig 2.3) [76]. HMGB1 domain A contains three alpha helices form-ing an L-shape structure that facilitates DNA binding [77]. The concave surfaces ofHMGB1 domain A form hydrogen bonds as well as hydrophobic and water-bridgingcontacts with the minor groove of the platinated DNA. Phe37 intercalates into thehydrophobic cleft formed by the two platinated guanines bases G8 and G9 (Fig.2.3) [76]. The binding affinity between HMGB1 and cisplatin-DNA adduct was alsomeasured (Kd = 0.7± 0.1 nM ) (see Sec. 5.1 for the definition of Kd) [78].
Pt
PHE37 G9
G8 HMGB1
DNA
Figure 2.3 X-ray structure of the complex between HMGB1 domainA and cis-[Pt(II)(NH3)2]-d-(CCUCTCTG*G*ACCTTCC)-d(GGAGAGACCTGGAAGG) (PDB code 1CKT) [76]. The DNA’sbackbone is shown in blue ribbon; nucleobases in blue bonds; cisplatinmoiety in van der Waals balls. The HMGB1’s backbone is shown inred ribbon; its Phe37 amino acid, which inserts between two platinatedG8 and G9 bases, is shown in green ball-stick representation.

10 2. Biophysical background
2.3 Mechanisms of Resistance
The development of resistance is a common drawback of chemotherapy, and cisplatinis no exception [4, 79]. It is a major cause of treatment failure [4]. Resistanceimplies that tumor cells fail to undergo apoptosis (programmed cell death) at aclinically relevant drug concentration [28]. Some tumors, such as colorectal cancerand non-small-cell lung cancer are intrinsically resistant to cisplatin chemotherapy[80]. Other tumor types, such as head and neck cancer, testicular cancer, ovariancancer and small-cell lung cancer are predominantly sensitive to cisplatin treatment.However, most of these sensitive tumors develop acquired resistance after the initialtreatment [4]. The mechanisms by which tumor cells develop resistance to cisplatinare multifactorial, and not completely understood [3, 28, 30, 81, 85]. The generallyaccepted mechanisms [2, 28, 30, 85, 86] by which cancer cells acquire resistance tocisplatin are: (i) decreased accumulation of cisplatin, (ii) increased deactivation ofcisplatin by thiol-containing molecules and (iii) increased repair of DNA adducts.
Figure 2.4 Correlation between the fold-resistance (which is defined as the foldincrease in the number of survival cells when treated with the sameamount of drug) and the percent decrease in cisplatin accumulationwith respect to sensitive cells (adapted from [30]).
(i) Decreased accumulation of cisplatin: This is the most common and dis-tinctive feature of resistant cells [28, 30]. It has been observed repeatedly indifferent types of tumor cells that cisplatin accumulation in resistant cells isreduced significantly in comparison to that in sensitive cells [2, 30, 82]. Re-sistant cells have apparently altered the cellular transport machinery so as toreduce the amount of cisplatin to reach the target DNA. Over many years,several studies have been devoted to investigate the ability of cisplatin andother platinum drugs to accumulate in cancer cells. It has been consistently

2.3. Mechanisms of Resistance 11
demonstrated that accumulation of the drug is a determinant of cellular sensi-tivity to cisplatin [83, 84]. In most of human- and rodent- cell lines, which areresistant to cisplatin, its accumulation is reduced relative to the non-resistantcells [30, 87]. A strong correlation between cisplatin accumulation and relativecisplatin resistance were observed for a series of increasing resistant cell linesderived from the BEL7404 human hepatoma cell line (Fig. 2.4) [88]. More-over, Koga et al. examined seven primary bladder cancer cell lines derivedfrom untreated cancer of urinary bladder and found a positive correlation be-tween cisplatin accumulation and sensitivity among the intrinsically resistantcell lines [30, 89]. Diminished accumulation has been observed not only for cis-platin but also for carboplatin [90] and oxaliplatin [91]. Reduced intracellularaccumulation of cisplatin is due to either decreased uptake or increased effluxor both. It is, therefore, important to understand the molecular mechanismsof cellular uptake and efflux of cisplatin.
(ii) Increased deactivation of cisplatin by thiol-containing molecules: Thiol(SH)-containing molecules such as intracellular tripeptide glutathione (GSH)or metallothioneins (a class of low-molecular weight proteins) are able to bindand deactivate cisplatin [4, 28, 92]. GSH reacts with cisplatin and other elec-trophilic compounds to form deactivated conjugates that are readily excretedby a GS-conjugated export pump [93]. Early studies using eight human ovar-ian carcinoma cell lines showed a significant correlation between sensitivity tocisplatin, and levels of GSH [28, 94]. A study of two ovarian cancer cell linesthat were derived from the same patient before and after the onset of drugresistance showed 2.9-fold higher levels of GSH in the cells derived from thedrug-resistant tumor [95]. Over-expression of metallothioneins, that are in-volved in heavy-metal binding and detoxification, in either mouse cells [96] orin human ovarian cancer cells [97] led to 4-fold or 7-fold increase in cisplatinresistance, respectively.
(iii) Increased repair of DNA adducts: An important biochemical mechanismof resistance is the repair of cisplatin-DNA adducts [2, 4, 28, 86, 98]. Manycisplatin-resistant cell lines that are derived from various tumor types havebeen shown to have increased DNA-repair capacity in comparison to sensitivecounterparts [99]. Nucleotide Excision Repair (NER) is a major mechanism ofcisplatin-damaged DNA repair. Increased NER in cisplatin-resistant cell lineshas been shown to occur both for intra-strand as well as inter-strand cisplatin-DNA adducts [100, 101]. NER is an ATP-dependent multi-protein complexthat recognizes the kink induced on the DNA by 1,2-intrastrand cross-link andsubsequently excises the segment containing the kink. The gap is then filledby DNA polymerase [102]. Increased removal of DNA adducts by NER inresistant cell lines relative to sensitive parent cell lines has been consistentlyobserved in several models [9, 103]. Conversely, defective NER has been foundin cell lines with hypersensitivity to cisplatin [104].

12 2. Biophysical background
2.4 Copper transport proteins and their binding tocisplatin
Reduced cellular accumulation of cisplatin is a major mechanism of drug resistance[2, 30, 82]. Therefore, it is vitally important to understand how the cellular trans-port machinery of cisplatin works. For a long time, cisplatin was believed to entercells only by passive diffusion [105, 106, 107, 108, 109]. Although passive diffusionmechanism has been not fully ruled out, recently there has been a growing bodyof evidence indicating that cisplatin as well as other platinum drugs enter cells, aredistributed to various sub-cellular compartments, and exported from the cells viatransport proteins that evolved to manage copper homeostasis [29, 30, 110, 131, 132].In particular, the high-affinity copper transporter 1 (Ctr1) has been shown to beinvolved in the uptake of cisplatin and other platinum drugs across the cells’ mem-brane, whereas the ATPase copper pumps ATP7A and ATP7B are responsible forsequestration and efflux of cisplatin [30].
2.4.1 Ctr1
Ctr1 is an evolutionarily conserved copper uptake protein present in plants, yeastand mammals. It is the main copper importer in mammalian cells [111, 112, 113, 114,115]. Ctr1 in human is expressed in all tissues. It plays a key role in homeostatic reg-ulation of cellular copper levels. Recently, Ctr1 has been demonstrated to regulatethe cytotoxicity of cisplatin by affecting drug uptake [116, 117, 118, 119, 120, 121].The absence of Ctr1 expression causes yeast and mammalian cells resistant to cis-platin, carboplatin and oxaliplatin [116, 117, 118, 119, 122]. On the other hand,over-expression of Ctr1 was shown to sensitize cells to the toxic effects of cisplatin[118, 123]. These changes in sensitivity are accompanied by proportionate changesin the uptake of cisplatin and other platinum agents [110]. In vivo studies in ratsshowed that cisplatin cause atrophy in those cells in dorsal root ganglia that ex-pressed high levels of Ctr1 but not those with low-level expression [124]. It wasrecently demonstrated that knockout of Ctr1 completely eliminates responsivenessof tumors to cisplatin in vivo in a murine model [122].
Molecular aspects:
Ctr1 is a membrane protein having three trans-membrane domains. A homotrimerof Ctr1 forms a pore in the lipid bilayer (Fig. 2.5). The extracellular domain ofCtr1 caries several methionine-rich motifs, which have been identified as a putativecisplatin binding site [142].
To provide insights on interactions of Ctr1 with cisplatin, transplatin and otherplatinum complexes, Arnesano et al. chose one of the Met-rich motifs of yeast Ctr1(called Mets7) with slight modification [144] to make it more water-soluble andperformed the reaction with cisplatin, transplatin and other platinum complexes[142, 143]. The investigation was performed using mainly electrospray ionizationmass spectroscopy (ESI-MS), NMR and circular dichroism (CD).
CD measurements showed that Mets7 features a β-turn conformation after reactingwith cisplatin, whilst it is a random coil in the Apo form [142]. Transplatin was

2.4. Copper transport proteins and their binding to cisplatin 13
Figure 2.5 Cartoon representing the copper influx transporter Ctr1 (adapted from[145]). Left: Ctr1 is a symmetrical homotrimeric trans-membrane pro-tein. Nine trans-membrane helices form a pore in the lipid bilayer.Each subunit is represented by a different color. Right: One of thethree subunits is removed to reveal the interior of the pore.
shown to modify just slightly the random coil of Mets7. ESI-MS data showed thatcisplatin progressively loses all ammine and chlorido ligands and ultimately coordi-nates only to Mets7. This contrasts with transplatin, which keeps the two ammineligands [142, 143]. Consistently, 1H/13C heteronuclear single-quantum coherence(HSQC) spectra (Fig. 2.6) reveals a large downfield shift of the 1H and 13C nucleiof ε-CH3 and γ-CH2 of methionines and confirms coordination of Pt to the S atoms.Other groups also reported a similar binding mode of cisplatin to partial or full-length N-terminal domain of human Ctr1 [146, 147]. Hence, Mets7 is a good mimicof the whole N-terminal domain of Ctr1 in terms of reactivity against cisplatin. Thefull structural determinants of cisplatin- and transplatin-Mets7 adducts are so farlacking.
2.4.2 ATP7A, ATP7B and Atox1
ATP7A and ATP7B are functionally conserved P-type ATPases involved in the se-questration and extrusion of excess Cu ions [30, 113, 125, 126, 112]. The two proteinsare homologous in structure, sharing 8 trans-membrane domains and ∼65% aminoacid sequence identity. However, they are expressed in different tissues: ATP7Ain intestinal epithelium and ATP7B in liver and kidney. Enhanced expression ofATP7A and ATP7B has been linked to the degree of cisplatin resistance in tumorcell lines and clinical samples [128]. Over-expression of ATP7B is associated with

14 2. Biophysical background
a reduced capacity in cells to accumulate cisplatin and show a high rate of efflux[129]. A confocal microscopy study showed that an ECFP (enhanced cyan fluores-cent protein)-tagged ATP7B (ATP7B-ECFP) colocalized with a fluorescence labeledcisplatin (F-cisplatin) and that both of cisplatin and F-cisplatin caused trafficking ofthe ATP7B-ECFP containing vesicles toward the cell’s surface [130]. This is consis-tent with the role of ATP7B as an efflux transporter of cisplatin. On the other hand,the function of ATP7A appears to be different from that of ATP7B [132]. AlthoughATP7A over-expressing cells exhibit a significant degree of enhanced resistance tocisplatin, higher levels of cisplatin accumulation were observed [133]. This indicatesthat the function of ATP7A is likely to be in binding and sequestration of cisplatinrather than exporting it [132, 133]. This was confirmed in many observations includ-ing detection of significantly higher levels of cisplatin in the vesicular compartmentof the cells that over-express ATP7A [133]. Confocal microscopy demonstrated thatATP7A and F-cisplatin colocalized in the vesicular structures in ovarian carcinomacells 2008 [134]. Exposure to cisplatin did not cause trafficking of the ATP7A con-taining vesicles toward the cell surface [133].
Atox1 is a key metallochaperone that receives copper from the importer Ctr1 anddelivers it to the copper exporters ATP7A and ATP7B in the secretory compartment[135, 136, 137, 112]. It has 69 amino acids and is found in the cystosol and nucleus[135]. Loss of Atox1 in the fibroblast cells of mice has been found to reduce the influxof cisplatin and subsequent accumulation in vesicular compartment and DNA [138].The exact role of Atox1 in cellular transport and distribution of cisplatin is still notfully understood. However, it has been suggested that Atox1 regulates the influxof cisplatin by controlling the cisplatin-induced down regulation of Ctr1 throughubiquitination [110, 138]. Atox1 has been found to translocate to the nucleus inresponse to copper exposure [139, 140] and it has also recently been reported tobind cisplatin [141, 34]. This raises the question of whether it could be involved inthe delivery of cisplatin to DNA.
Molecular aspects:
Solution and in-cell NMR spectroscopy study [34] showed that cisplatin binds to theCxxC metal binding motif of Atox1 (Fig. 2.7a). Initially, a cis-[Pt(NH3)2]-Atox1adducts is formed. At longer reaction time the protein dimmerization accompaniedby loss of the two ammine ligands is observed [34]. This interaction mode is differentfrom that observed previously by Boal et al. using X-ray crystallography technique[141].
ATP7B features six soluble domains, each of which contains about 70 amino acids.Their structures have been solved by NMR spectroscopy [148, 149]. Interestingly,each domain has the similar fold as the Atox1 protein [150, 151]. All the domainsshare the same CxxC metal binding motif (Fig. 2.7b). A likely model of the adductsof cisplatin with ATP7B involves the binding of the cis-[Pt(NH3)2]2+ moiety to theCxxC motifs [152] as suggested by cysteine mutation experiments [153, 154].

2.4. Copper transport proteins and their binding to cisplatin 15
Figure 2.6 Overlay of 2D 1H,13C-edited HSQC spectra of Mets7 (red contours)and of mixtures (1:1) of Mest7 with a) cisplatin and b) transplatin.Spectral changes induced by cisplatin/transplatin are indicated witharrows. Figures adapted from [142].

16 2. Biophysical background
a) b)
Figure 2.7 The NMR structures of: (a) Atox1 [151] and (b): the soluble domain 4of the ATP7B protein [148]. The backbone is represented with ribbon.Different colors indicate different secondary-structure types: green isloop, yellow is beta sheet, and purple is alpha helix. Two cysteineamino acids are shown in bond representation.

3Methods
3.1 Molecular dynamics
3.1.1 Statistical mechanical basis of molecular dynamics
Molecular dynamics simulations generate information at the microscopic level (atomicpositions, velocities...) and the connection of this very detailed information to macro-scopic quantities (such as pressure, temperature, energy...) is provided by statisticalmechanics [255]. The set of atoms’ coordinates and momenta can be thought ascoordinates in a multidimensional space: the phase space. For a system of N atoms,this space has 6N dimensions. Let us denote a particular point in the phase spaceas Γ, and suppose that we can write the instantaneous value of some property A asa function of Γ, A(Γ). The experimentally observable value of A, Aobs is given bythe ensemble average. Here, an ensemble is regarded as a collection of points Γ inthe phase space. The points are distributed according to a probability distributionp(Γ). The ensemble average (or thermodynamic average) is written as
Aobs = 〈A〉ens =
∫A(Γ)p(Γ)dΓ, (3.1)
where dΓ = d~R1 · · · d~RN · d~P1 · · · d~PN . The probability distribution depends onmacroscopic parameters (NV E, NV T , NPT ...), which defines the experimentalconditions. In the case where N , V and T are kept fixed (canonical ensemble),the corresponding probability distribution is given by the Boltzmann distributionfunction
pNV T =exp [−H(Γ)/kBT ]
Z, (3.2)
where
Z =
∫dΓpNV T (Γ) =
∫dΓ exp [−H(Γ)/kBT ] (3.3)

18 3. Methods
is the canonical partition function, kB is the Boltzmann factor, H(Γ) is the classicalHamiltonian of the system which is given by
H(Γ) = H({
~RI
},{~PI
})=
N∑I=1
~P 2I
2MI
+ U({
~RI
}). (3.4)
~RI and ~PI are the coordinate and momentum of atom I, respectively. MI is the massof atom I. In order to calculate the ensemble average (Eq. (3.1)), it is necessary tocalculate the partition function (Eq. (3.3)), which is an extremely difficult task.
Molecular dynamics (MD) offers a strategy to calculate the ensemble average. Inthis approach, the motion of a single point Γ through the phase space is followed asa function of time. The time evolution of a single point Γ through the phase space isobtained by integrating the equation of motion, starting from an initial point Γ(0).The integration yields a trajectory that is a set of points Γ(t) describing the state ofthe system at any successive time t. The “dynamical average” of A can be calculatedby averaging over those points that have been visited
〈A〉τ =1
τ
τ∫0
A [Γ(t)] dt. (3.5)
The two averages (3.1) and (3.5) are connected by the “ergodic hypothesis”. Thesystem is at equilibrium and if it is allowed to evolve infinitely long in time, then itwill pass through all its possible states. A system which obeys the conditions aboveis said to be ergodic, and under these conditions the dynamical average is equal tothe ensemble average for an infinitely long trajectory
limτ→∞〈A(Γ)〉τ = 〈A(Γ)〉Γ . (3.6)
The fact that all the “real” molecular systems are assumed to be ergodic is thetheoretical justification for using MD simulations as a means to calculate ensembleaverages of molecular systems [255]. In practice, the application of MD simulationsto calculate thermodynamic averages assumes that the system under investigationis ergodic and that a finite simulation is a “good” approximation to the infinitetrajectory.
3.1.2 Derivation of molecular dynamics equation
The time-dependent behavior of molecular systems is best described by the time-dependent Schrodinger equation. However, this equation is extremely difficult tosolve for large systems. Therefore, classical mechanical description is often used toapproximate the motion of atoms. In most of computational studies of biomolecules,the Newtonian equations of motion of the classical mechanics are solved, ratherthan the quantum mechanical equations. In this section, the classical equations ofmolecular dynamics (Newton’s equations) will be derived from the time-dependentSchrodinger equation [257, 258, 259].
The time-dependent Schrodinger equation is written as
i~∂
∂tΨ({~ri}, {~RI}; t
)= HΨ
({~ri}, {~RI}; t
), (3.7)
3.1. Molecular dynamics 19
where H is the Hamiltonian of the system. For most of the biologically relevantsystems, the non-relativistic Hamiltonian is sufficient to get a reasonably accuratedescription
H = −∑I
~2
2MI
∇2I −
∑i
~2
2me
∇2i
+1
4πε0
∑i<j
e2
|~ri − ~rj|− 1
4πε0
∑I,i
e2ZI∣∣∣~RI − ~ri∣∣∣ +
1
4πε0
∑I<J
e2ZIZJ∣∣∣~RI − ~RJ
∣∣∣= −
∑I
~2
2MI
∇2I −
∑i
~2
2me
∇2i +
1
4πε0
∑i<j
e2
|~ri − ~rj|+ Vn−e
({~ri}, {~RI}
)= −
∑I
~2
2MI
∇2I +He
({~ri}, {~RI}
). (3.8)
{~ri} and {~RI} denote the coordinates of the electrons and nuclei, respectively. MI
and ZI are the mass and atomic number of the I-th nucleus. me and −e are the elec-
tron’s mass and charge, respectively. ε0 is the vacuum permittivity. Ψ({~ri}, {~RI}; t
)is the total wavefunction.
In the one-determinant approximation ansatz [257, 258, 259], Ψ({~ri}, {~RI}; t
)is
separated into the electronic and nuclear contributions
Ψ({~ri}, {~RI}; t
)= φ ({~ri}; t)χ
({~RI}; t
)exp
i~
t∫t0
Ee(t′)dt′
, (3.9)
where the nuclear and electronic wavefunctions are separately normalized to unityat every instant of time, i.e.∫
|φ ({~ri}; t)|2 d~r = 〈φ, t |φ, t〉 = 1, ∀t ∈ R, (3.10)
∫ ∣∣∣χ({~RI}; t)∣∣∣2 d~R = 〈χ, t |χ, t〉 = 1, ∀t ∈ R, (3.11)
where d~r = d~r1 · · · d~rn and d~R = d~R1 · · · d~RN . The phase factor then can be writtenas
Ee =
∫φ∗ ({~ri}; t)χ∗
({~Ri}; t
)Heφ ({~ri}; t)χ
({~Ri}; t
)d~rd~R. (3.12)
By inserting (3.9) and (3.12) into (3.7), multiplying from the left by φ∗χ∗, integrat-ing over all nuclear and electronic coordinates and imposing energy conservationcondition
d
dt
∫Ψ∗({~ri}, {~Ri}; t
)HΨ
({~ri}, {~Ri}; t
)d~rd~R = 0, (3.13)
we obtain
i~∂
∂tφ = −
∑i
~2
2me
∇2iφ+
{∫χ∗({~RI}; t
)Vn−e
({~ri}, {~RI}
)χ({~RI}; t
)d~R
}φ,
(3.14)
20 3. Methods
i~∂
∂tχ = −
∑I
~2
2MI
∇2Iχ+
{∫φ∗ ({~ri}; t)He
({~ri}, {~RI}
)φ ({~ri}; t) d~r
}χ, (3.15)
which is a set of coupled time-dependent Schrodinger equations. The electrons movein a time-dependent effective potential given by averaging over nuclear degrees offreedom and vice versa.
Now we want to approximate the quantum mechanical equation for the nuclei (Eq.(3.15)) as a classical mechanical equation. To this aim, we rewrite the nuclear
complex wavefunction χ({~RI}; t
)in a polar form
χ ({RI}; t) = A ({RI}; t) exp [iS ({RI}; t)/~] , (3.16)
where A is the amplitude and S is the phase. Substituting Eq. (3.16) into Eq. (3.15)and separating the real and imaginary parts yields
∂S
∂t+∑I
1
2MI
(∇IS)2 +
∫φ∗Heφd~r = ~2
∑I
1
2MI
∇2IA
A, (3.17)
∂A
∂t+∑I
1
MI
(∇IA)(∇IS) +∑I
1
2MI
A(∇2IS) = 0 (3.18)
Equation (3.18) for the amplitude A can be written as a continuity equation [257,260, 261] by multiplying from the left by 2A:
∂A2
∂t+∑I
1
MI
∇I(A2∇IS) = 0 (3.19)
Noting that the nuclear probability ρ = |χ|2 = A2 and the current density JI =A2(∇IS)MI
, Eq. (3.19) becomes
∂ρ
∂t+∑I
∇IJI = 0. (3.20)
The continuity equation (3.20) ensures the conservation of particle probability χ2 ofthe nuclei in the presence of a flux.
The expression of the phase S (Eq. (3.17)) contains one term that depends explicitlyon the Planck’s constant ~. This term vanishes in the classical limit ~→ 0, and Eq.(3.17) becomes
∂S
∂t+∑I
1
2MI
(∇IS)2 +
∫φ∗Heφd~r = 0. (3.21)
If we set ∇IS to be the momentum of nucleus I
~PI = ∇IS (3.22)
then Eq. (3.21) becomes
∂S
∂t+∑I
1
2MI
~P 2I +
∫φ∗Heφd~r = 0. (3.23)

3.1. Molecular dynamics 21
This equation is isomorphic to the equation of motion in the Hamiltonian-Jacobiformalism [257, 262] of classical mechanics
∂S
∂t+H
({~RI}, {~PI}
)= 0, (3.24)
in which
H({~RI}, {~PI}
)= T
({~PI}
)+ V
({~RI}
)=∑I
1
2MI
~P 2I +
∫d~rφ∗Heφ, (3.25)
is the classical Hamilton function of the coordinates ~RI and the conjugate momenta~PI . The corresponding Newtonian equation of motion is
d~PIdt
= −~∇I
∫d~rφ∗Heφ = −~∇IVe
({~RI}
), (3.26)
or
MI~RI = −~∇I
∫d~rφ∗Heφ. (3.27)
Therefore, in the classical limit (~→ 0), the nuclei move as classical particles in aneffective potential Ve, which is obtained by averaging over the electronic degrees offreedom at a given instantaneous nuclear positions ~RI(t).
To calculate Ve we need to solve Eq. (3.14), which still contains the full quantum-mechanical nuclear wavefunction. Therefore, we need to apply the classical limit
by replacing the nuclear density∣∣∣χ{~RI}
∣∣∣2 in Eq. (3.14) by a product of delta func-
tions∏I
δ[~RI − ~RI(t)
]centered at the instantaneous nuclear positions RI(t). The
expectation value of the position operator becomes∫d~Rχ∗
({~RI}; t
)~RIχ
({~RI}; t
)→ ~RI(t). (3.28)
This leads to a time-dependent wave equation for the electrons
i~∂φ
∂t= −
∑i
~2
2me
∇2iφ+ Vn−e
({~ri}; {~RI(t)}
)φ
= He
({~ri}; {~RI(t)}
)φ({~ri}; {~RI}; t
), (3.29)
which evolve self-consistently as the classical nuclei are propagated according to Eq.(3.27).
3.1.3 Ab initio molecular dynamics
3.1.3.1 Ehrenfest MD
In this ab initio MD scheme, the Newton’s equations for the nuclei (Eq. (3.27))are solved simultaneously with the time-dependent Schrodinger equation for the

22 3. Methods
electrons (Eq. (3.29)). The time-dependent Schrodinger equation of the electrons issolved “on-the-fly” as the nuclei are moving according to classical mechanics. Thisis the so-called Ehrenfest MD scheme. The total electronic wavefunction φ in Eq.(3.29) can be expanded in a basis of the electronic states ψl
φ({~ri}; {~RI}; t
)=∞∑l=0
cl(t)ψl
({~ri}; {~RI}
), (3.30)
where cl(t) are complex time-dependent coefficients, satisfying∑l|cl(t)|2 = 1. (3.31)
The basis functions ψl can be chosen as the instantaneous eigenstates of the time-independent electronic Schrodinger equation
He
({~ri}; {~RI}
)ψl
({~ri}; {~RI}
)= El
({~RI}
)ψl
({~ri}; {~RI}
), (3.32)
where ~RI are the instantaneous nuclear positions at time t which are determinedaccording to Eq. (3.27). With this choice of basis wavefunctions, the equations ofmotion (3.27) and (3.29) become
MI~RI(t) = −∇I
∑k
|ck(t)|2Ek
= −∑k
|ck(t)|2∇IEk +∑k,l
c∗kcl (Ek − El) ~dklI , (3.33)
i~ck(t) = ck(t)Ek − i~∑l
cl(t)Dkl, (3.34)
where
Dkl =
∫ψ∗k
∂
∂tψld~r =
∑I
~RI
∫ψ∗k∇Iψld~r =
∑I
~RI~dklI . (3.35)
The restriction to one electronic state (in most cases the ground state ψ0) in Eq.(3.30) leads the equations of motion (3.27) and (3.29) to
MI~RI = −~∇I
∫d~rψ∗0Heψ0, (3.36)
i~∂ψ0
∂t= Heψ0. (3.37)
The propagation of the wavefunction in Eq. (3.37) is unitary. This implies thatthe wavefunction preserves its norm and the set of orbitals used to build up thewavefunction will stay orthonormal [257].
3.1.3.2 Born-Oppenheimer MD
Another approach to ab initio MD is to solve the time-independent Schrodingerequation for fixed instantaneous nuclear positions at each molecular dynamics step.

3.1. Molecular dynamics 23
In this case, the intrinsic dynamics of the electrons is lost. The time-dependenceof the electronic structure is imposed by the parametric dependence of He on theclassical dynamics of the nuclei. The equations of motion of this so-called “Born-Oppenheimer” molecular dynamics are given by
MI~RI(t) = −∇I min
ψ0
〈ψ0|He |ψ0〉 , (3.38)
Heψ0 = E0ψ0. (3.39)
A drawback of the Born-Oppenheimer scheme is that the electronic wavefunction ψ0
need to be obtained by minimizing 〈He〉 at every time step.
3.1.3.3 Car-Parrinello MD
In Ehrenfest MD method, the integration time step of the equations of motion isdictated by the intrinsic dynamics of the electrons, which is much faster than nucleardynamics. Therefore, one has to use very short time step to integrate properly theequations of motion. In contrast, Born-Oppenheimer MD has no electronic dynam-ics. The electronic problem is treated through the time-independent Schrodingerequation. Only the time scale given by nuclear motion is relevant. This allows usto use a larger MD time step to integrate the equation of motion. However, Born-Oppenheimer MD requires that the electronic structure problem has to be solved atevery MD step. This makes the method very expensive.
In 1985, Car and Parrinello [167] developed an ab initio MD scheme which com-bines advantages of both Ehrenfest and Born-Oppenheimer MD. This so-called Car-Parrinello MD allows the electronic wavefunction to be automatically minimizedwhen the nuclei are propagated like in the Ehrenfest dynamics, but with an increasedtime step. Therefore, an explicit electronic minimization at each time step like inBorn-Oppenheimer MD is avoided. The Car-Parrinello MD is based on the ideathat fast electronic and slow nuclear motions can be adiabatically separated. Carand Parrinello introduced an extended Lagrangian which includes both electronicand nuclear degrees of freedom [167]. Each electronic degree of freedom (orbital)is considered as a “fictitious” particle with a fictitious mass µ. Given a sufficientlysmall value of the fictitious mass of the “electrons”, the total electronic wavefunctioncan follow the nuclear motion adiabatically.
The Car-Parrinello Lagrangian is given by
LCP =∑I
1
2MI
~R2I +
∑i
1
2µ 〈ϕi |ϕi 〉 − 〈ψ0|He |ψ0〉+ constraints. (3.40)
The first term is the nuclear kinetic energy, the second term is the kinetic energyof the fictitious electrons. µ is the fictitious mass. {ϕi} is a set of orbitals usedto expand the total electronic wavefunction ψ0. 〈ψ0|He |ψ0〉 is the potential energy.The last term enforces the orthogonality of the orbitals ϕi, which is not conserved asin the case of the Ehrenfest scheme and therefore an orthonormalization is requiredat each step of the Car-Parrinello MD. The corresponding equations of motion forboth nuclei and electrons are obtained from the Euler-Lagrange equations
d
dt
∂LCP
∂ ~RI
=∂LCP
∂ ~RI
, (3.41)

24 3. Methods
d
dt
δLCPδϕ∗i
=δLCPδϕ∗i
, (3.42)
which give, respectively,
MI~RI(t) = − ∂
∂ ~RI
〈ψ0|He |ψ0〉+∂
∂ ~RI
{constraints} , (3.43)
µϕi(t) = − δ
δϕ∗i〈ψ0|He |ψ0〉+
δ
δϕ∗i{constraints} . (3.44)
The nuclei move at the physical temperature ∼∑I
MI~R2I whereas the electrons
move at a “fictitious temperature”∼∑i
µ 〈ϕi |ϕi 〉. µ is the key parameter to control
the adiabatic separation between the nuclei and the electrons. The smaller µ isthe closer the instantaneous minimum energy 〈ψ0|He |ψ0〉 is to the exact Born-Oppenheimer energy surface and vice versa. On the other hand, small µ meanssmall integration step. Therefore, in practice, a compromise between accuracy andefficiency determines the choice of µ.
3.1.3.4 Density Functional Theory
Any electronic structure method such as density functional theory (DFT), Hartree-Fock (HF), second-order many-body perturbation theory (MP2), or full configura-tion interaction (FCI) can, in principle, be used in combination with the ab initiomolecular dynamics scheme. Here we focus only on the Hohenberg-Kohn-Sham den-sity functional theory because the work in this thesis made extensive use of theDFT-based Car-Parrinello molecular dynamics.
DFT is founded on the two Hohenberg-Kohn (H-K) theorems. Consider a system ofelectrons moving under the influence of an external potential vn−e.
(i) The first H-K theorem states that the external potential vn−e is a unique func-tional of the ground-state electron density ρ(~r). Because vn−e in turn deter-mines the Hamiltonian He, full many-electron ground state is a unique func-tional of ρ(~r). The total ground-state energy E0 can be written as a functionalof ρ(~r)
E0 [ρ (~r)] = T [ρ (~r)] + Ee−e [ρ (~r)] + En−e [ρ (~r)]
= FH−K [ρ (~r)] +
∫ρ(~r)vn−e(~r)d~r, (3.45)
where
vn−e(~r) = − e
4πε0
∑I
ZI∣∣∣~RI − ~r∣∣∣ +
e2
4πε0
∑I<J
ZIZJ∣∣∣~RI − ~RJ
∣∣∣ . (3.46)
FH−K [ρ (~r)] is called the Hohenberg-Kohn functional. It is universal in thesense that it does not depend on the external potential vn−e.

3.1. Molecular dynamics 25
(ii) The second H-K theorem states that for a trial electron density ρ (~r), we alwayshave
E0 ≤ E0 [ρ(~r)] . (3.47)
Therefore, if we want to find E0, we need to search for the minimum of E0 [ρ(~r)].
Kohn-Sham approach
In order to find an explicit form for the functional FH−K [ρ (~r)], Kohn and Shamassume that there is a reference system of non-interacting electrons (Kohn-Shamelectrons described by the orbitals ϕi) that feels an effective potential (Kohn-Shampotential vks) such that its ground-state charge density is idential to that of theinteracting system that we are dealing with.
The advantage of this auxiliary system is that for the non-interacting electrons, weknow the exact solution to the equations of motion in terms of ϕi, which is theSlater determinant ‖ϕi‖. The H-K functional FH−K is then written in terms of thenon-interacting system as
FH−K [ρ(~r)] =−~2
2me
∑i
∫d~rϕ∗i (~r)∇2ϕi(~r)
+e2
4πε0
∫d~rd~r′ρ(~r)
1
|~r − ~r′|ρ(~r′) + Exc [ρ(~r)] , (3.48)
whereρ =
∑i
|ϕi|2. (3.49)
The total electronic energy is given by
EKS [ρ(~r)] = FH−K [ρ(~r)] +
∫d~rρ(~r)vn−e(~r)
= − ~2
2me
∑i
∫d~rϕ∗i (~r)∇2ϕi(~r) +
e2
4πε0
∫d~rd~r′ρ(~r)
1
|~r − ~r′|ρ(~r′)
+
∫d~rρ(~r)vn−e(~r) + Exc [ρ(~r)] , (3.50)
Exc [ρ (~r)] is called the exchange-correlation term, which is to be approximated. Byapplying the variational principle to (3.50) with the condition (3.49), we can derivea set of Kohn-Sham equations for the Kohn-Sham orbitals {ϕi}[
− ~2
2me
∇2 + vks (ρ)
]ϕi (~r) = εiϕi (~r) , (3.51)
where vks(ρ) is the Kohn-Sham potential
vks(ρ) = vn−e(~r) +1
4πε0
∫ρ (~r′)
|~r − ~r′|d~r′ + vxc(ρ), (3.52)
and vxc(ρ) is the exchange-correlation potential, which is defined as the functionalderivative of Exc with respect to ρ(~r)
vxc [ρ(~r)] =δExc [ρ(~r)]
δρ(~r). (3.53)

26 3. Methods
In terms of Kohn-Sham DFT, the Car-Parrinello Lagrangian is written as
LCP =∑I
1
2MI
~R2I +
∑i
1
2µ
∫d~rϕ∗i (~r)ϕi(~r)
− EKS [ρ(~r)] +∑i,j
Λij
[∫d~rϕ∗i (~r)ϕi(~r)− δij
], (3.54)
where Λij are Lagrange multipliers.
Exchange-correlation functional
The exchange-correlation functional Exc [ρ(~r)] is unknown in the Kohn-Sham ap-proach. Finding an approximation to this functional is critical to any application ofDFT. The very first approximation to Exc is the so-called “local density approxima-tion” (LDA), which was introduced by Kohn and Sham [243, 244] and widely usedin physics. In this approximation, the exchange-correlation energy at each point isassumed to be the same as that in a homogeneous electron gas with the same density
ELDAxc [ρ(~r)] =
∫d~rρ(~r)εhom
xc [ρ(~r)]
=
∫d~rρ(~r)
{εhom
x [ρ(~r)] + εhomc [ρ(~r)]
}. (3.55)
For the homogeneous electron gas, the exchange part is known exactly [245, 246]
εx [ρ(~r)] = −3
4
(3ρ(~r)
π
) 13
. (3.56)
No analytical expression is known for the correlation part εc. Based on highly accu-rate numerical quantum Monte-Carlo calculations of Cepperly et al. in 1980, manydifferent analytical expressions of εc have been presented based on sophisticated in-terpolation schemes. The most widely used forms of εc are the one developed byVosko, Wilk and Nusair [247] as well as the one given by Perdew and Wang [248].
For chemical applications, LDA is usually insufficient. This has led to the develop-ment of generalized-gradient approximations (GGAs), in which also the density gra-
dient ~∇ρ(~r) is taken into account in the expression of Exc. In GGAs, the exchange-correlation functional is written as
EGGAxc [ρ(~r)] =
∫d~rρ(~r)εxc
[ρ(~r),
∣∣∣~∇ρ(~r)∣∣∣]
= EGGAx [ρ(~r)] + EGGA
c [ρ(~r)] (3.57)
A very popular GGA functional is given by a combination of the Becke exchangefunctional and the Lee-Yang-Parr correlation functional (BLYP) [195, 196]. TheBecke exchange functional is given by
EGGAx [ρ] = ELDA
x [ρ]− β∫ρ(~r)4/3 x3
1 + 6β sinh−1 xd~r, (3.58)
where
x =
∣∣∣~∇ρ(~r)∣∣∣
ρ(~r)4/3(3.59)

3.1. Molecular dynamics 27
The parameter β is determined by a fit on the exact HF data and was fixed by Becketo be 0.0042 au.
The Lee, Yang and Parr correlation function was derived from the Colle-Salvettiformula to calculate the correlation energies from HF second order density matrix
EGGAc [ρ] = −a
∫1
1 + ρ1/3
(ρ+ bρ−2/3
[CFρ
5/3 − 2tW +
(1
9tW +
1
18∇2ρ
)]e−ρ
1/3
)d~r,
(3.60)where
CF =3
10
(3π2)2/3
, (3.61)
tW =1
8
|∇ρ|2
ρ− 1
8∇2ρ, (3.62)
and a = 0.04918, b = 0.132.
3.1.3.5 Basis set
In practical implementations for solving the Kohn-Sham equations (3.51), the Kohn-Sham orbitals {ϕi(~r)} are expanded as a linear combination of basis functions withwell-known behaviors and with which it is possible to perform mathematical opera-tions very fast on a computer
ϕi(~r) =∑l
cilfl
(~r;{~RI
}). (3.63)
Localized basis sets
In quantum chemistry, the two most frequently used basis functions are the Slater-type basis functions
fSl = NSl r
mxx rmyy rmzz exp [−ζm |~r|] , (3.64)
and the Gaussian-type basis functions
fGl = NGl r
mxx rmyy rmzz exp
[−αmr2
], (3.65)
where Nm, ζm and αm are constants and kept fixed during an electronic structurecalculation, and only the coefficients cil need to be optimized.
Plane wave basis set and pseudopotentials
In periodic systems, it is more convenient to use plane waves as a basis set. Planewave functions are defined as
fPWG =1√Vei~G~r, (3.66)
where V is the volume of the periodic cell, ~G is the reciprocal lattice vector.
According to Bloch’s theorem, the eigenfunctions of periodic systems can be writtenas
ϕi,~k(~r) = ei~k~rui,~k(~r), (3.67)

28 3. Methods
where ~k is a wave vector in the first Brillouin zone of the reciprocal lattice. ui,~k(~r)is a cell-periodic function
ui,~k(~r + ~R) = ui,~k(~r), (3.68)
which can be expanded as a Fourier series
ui,~k(~r) =1√V
∑~G
Ci,~k(~G)ei
~G~r. (3.69)
Eq. (3.67) then becomes
ϕi,~k(~r) =1√V
∑~G
ci,~k(~G)ei(
~G+~k)~r. (3.70)
A further approximation can be introduced to minimize the size of the plane wavebasis set: the so-called pseudopotential approximation [249, 250, 251]. This approxi-mation is based on the observation that core electrons, i.e. the electrons close to thenuclei that are not involved in the chemical reactions, are somewhat unaffected bythe chemical environment. Therefore, it is sufficient to consider just the valence elec-trons, whereas the core ones are replaced by pseudopotentials to take into accounttheir effect in the motion of the valence electron. The valence electron wavefunctioncan then be replaced by pseudo wavefunction |ψps〉, which now varies smoothly inthe core region (Fig. 3.1). As a consequence, the number of plane waves needed toexpand the wavefunctions is greatly reduced.
The pseudo valence states can be found by solving the all-electron Schrodinger equa-tion for an atom [
H + Vnl
]|ψps〉 = E |ψps〉 , (3.71)
where H is all-electron Hamiltonian of an atom, Vnl is an energy-dependent non-localpotential
Vnl =∑i∈core
(E − Ei) |χi〉 〈χi.| (3.72)
|χi〉 and Ei are eigenstates and eigenvalues of the core-electron states, respectively.Since the additional potential Vnl is repulsive, sum of Vnl with the strongly attractiveCoulomb potential VCou results in a much weaker pseudopotential [251, 252]
V PS = VCou +∑i∈core
(E − Ei) |χi〉 〈χi.|. (3.73)
Pseudopotentials are constructed from ab initio calculations for isolated atoms, e.g.,by solving the Kohn-Sham equations. For atoms, due to the spherical symmetry, thewavefunctions can be written as a product of a radial function and a spherical har-monic. The Kohn-Sham equations then reduce to one-dimensional differential equa-tions for the radial function. Serveral schemes for generating pseudopotentials havebeen proposed. In this thesis, we have used the “Norm-conserving” pseudopotentialsderived from the Martins-Troullier (MT) scheme [197], in which the pseudopotentialshave to satisfy the following conditions:
(i) The lowest pseudo wavefunction should not contain any node.

3.1. Molecular dynamics 29
(ii) The eigenvalues of both real and pseudo wavefunctions must be the same
(iii) The radial pseudo wavefunction with an angular momentum l should be equalto the radial all-electron wavefunction outside a cut-off radius rc.
(iv) The integrated charge inside rc must be the same for both wavefunctions.
Figure 3.1 Schematic diagram of the relationship between all-electron and pseu-dopotentials and wavefunctions as well as real and pseudopotentials,adapted from [253].
3.1.4 Force field-based molecular dynamics
Due to a large number of atoms (thousands of atoms) in a typical biomolecularsystems, full ab initio molecular dynamics is not feasible. Therefore, force fieldsare usually used to approximate the interatomic potential energy. In this approach,the potential energy of the atoms is approximated by a simple analytical function(force field) of the atomic coordinates. In this way, the need to solve the quantumelectronic problem can be avoided.
Force fields contain a set of adjustable parameters, which have to be fitted to dataobtained from experiments or high-level quantum mechanical calculations. There arevarious types of force fields used in biomolecular simulations with different functionalforms and parameter sets, such as AMBER [173], GROMOS [189], CHARMM [254],etc.

30 3. Methods
The AMBER force field [173] which has been used in this work has the followingfunctional form
UFF =∑bonds
KR (R−Req)2 +∑
angles
Kθ (θ − θeq)2 +∑
dihedrals
Vn2
[1 + cos(nφ− γ)]
+∑I<J
qIqJεRIJ
+∑I<J
σIJ
[(Rmin I,J
RIJ
)12
− 2
(Rmin I,J
RIJ
)6]. (3.74)
KR, Kθ and Vn are bond, angle and dihedral force constants, respectively. R and Req
are bond length and its equilibrium value, respectively. θ and θeq are the angle andits equilibrium value, respectively. n, φ and γ are the number of barriers, dihedralangle and phase, respectively. RIJ is the distance between atom I and atom J . qIis the partial charge of atom I. ε is the dielectric constant. Rmin I,J and σIJ are theequilibrium distance and the well depth of the van der Waals interaction potential,respectively.
3.1.5 Hybrid Car-Parrinello/molecular mechanics (QM/MM) molec-ular dynamics
QM/MM MD is the method of choice for studies of chemical reactions and foraccurate descriptions of metallic complexes in large biomolecular systems [172, 170,171]. In this approach, the system of interest is partitioned into two parts: one istreated at quantum mechanical level (QM part), and the other one treated with themolecular mechanics force fields (the MM part).
The Car-Parrinello MD scheme (Eq. 3.54) can also be extended to deal withQM/MM approach. The corresponding extended Lagrangian is [169]
LQM/MM = LCP − EMM − EQM/MM
=1
2
∑I
MI~R2I +
1
2µ∑i
∫d~rϕ∗i (~r)ϕi(~r)− EKS [ρ(~r)]
+∑ij
Λij
[∫d~rϕ∗i (~r)ϕi(~r)− δij
]− EMM − EQM/MM, (3.75)
where EMM is the force field-based energy function describing the MM part, EQM/MM
is the coupling term between QM and MM parts.
In our work, EMM is given by the AMBER force field in Eq. (3.74)
EMM = UFF (3.76)
The QM/MM coupling term EQM/MM can be expanded in three terms:
EQM/MM = EeleQM/MM + Evdw
QM/MM + EbondedQM/MM. (3.77)
The first term in the right-hand side is the electrostatic coupling between the quan-tum charge distribution and the classical point charges. The second and third termsdescribe the van der Waals and bonded interactions between QM and MM atoms,

3.1. Molecular dynamics 31
respectively. Covalent bonds cut by the QM/MM boundary are saturated by cap-ping hydrogen atoms. The bonded interactions between QM and MM regions, i.e.bond stretching, angle bending and dihedral torsions are described by the force field.The same holds for van der Waals interaction between QM and MM atoms.
The electrostatic coupling term EeleQM/MM reads
EeleQM/MM =
∑i∈MM
qi
∫d~rρ(~r)vi (|~r − ~ri|) (3.78)
where qi are the partial charges at ~ri and vi (|~r − ~ri|) is a modified Coulomb potential.This potential is modified at short range to avoid the so-called electron spill-outphenomenon, i.e. the unphysical accumulation of charge density at the boundaryof the QM box due to the presence of classical positive charges of the nearby MMregion [169]
vi(~r) =rnci − rn
rn+1ci − rn+1
. (3.79)
In Eq. (3.79), n is usually fixed to 4 and rci is the covalent radius of atoms. vi(r)is chosen such that it saturates to 1/r at large distance and goes smoothly to aconstant value for small r (see Fig. 3.2).
0
1
2
3
0 2 4 6 8 10
Coulombmodified Coulomb
Figure 3.2 Schematic representation of Coulomb and modified Coulomb poten-tials.
The influence of rc’s on the pair correlation function between QM and MM atomswas probed by performing a QM/MM simulations of a quantum water moleculein a box of classical water [169]. It was shown that the QM/MM pair correlationfunction were consistent with the full quantum calculation when rci is chosen closeto the covalent radius (i.e. ∼ 0.4 A for hydrogen and ∼ 0.7 A for oxygen).
Because the calculation of the integrals in Eq. (3.78) is computationally expensive,they are calculated only for the MM atoms within a cut-off radius (∼ 5 A) from

32 3. Methods
the interface. Beyond this first shell and within a second cut-off radius (∼ 10 A),the electrostatic interactions are calculated using D-RESP (Dynamically GeneratedPotential Derived Charge) charge scheme [168]. In this approach, a set or pointcharges for QM atoms are fitted “on the fly” in each step of QM/MM simulations soas to reproduce the electrostatic potential evaluated at the positions of MM atomsclose to the QM region. These point charges then interact with the point chargesof MM atoms within the second shell. Finally, the electrostatic interactions arecalculated between a multipolar expansion of the QM charge density and the MMclassical point charges contained in the outer most region (> 10 A) [169].
3.1.6 Force matching procedure
Although QM/MM method can provide very accurate description of metal coor-dination structures in large biomolecules, the typical time scales are rather short(≤ 100 ps) with respect to the time scales of relevant biological phenomena. Tostudy global conformational changes of large systems, extensive classical MD simu-lations are, therefore, mandatory. This issue can be addressed by developing a setof force field parameters for the metal moieties in the biomolecules. Then, long timeclassical MD simulations can be performed based on these newly derived parameters.
The force matching procedure [174, 175] based on QM/MM trajectories offers anaccurate and elegant method for the force field parameterization. In this approach,a QM/MM simulation is performed for a given system, which is divided into twoparts: one treated at the quantum mechanical level (the QM part) and the other atthe force field level (the MM part). The fragment that needs to be parameterized isincluded in the QM part. A set of snapshots is selected along the QM/MM trajectory.This set is used as reference structures for the force matching procedure. The abinitio forces acting on the QM atoms together with the electrostatic potential andfield at positions of the nearby MM atoms are stored for each selected conformation.
First a set of point charges {qI} for the atoms in the QM region is derived. This setis fitted to reproduce both the electrostatic potential and the electrostatic field thatthe QM part exerts on the surrounding MM atoms. The following target functionis minimized to obtain {qI}
χ2 =L∑l
( ∑J∈NN
wv(V MMJl − V ρ
Jl)2 +
∑J∈NN
wE∥∥∥ ~EMM
Jl − ~EρJl
∥∥∥2
+∑I∈QM
wH(qI − qHIl )2
)
+ wQ
(Qtot −
∑I∈QM
qI
)2
. (3.80)
The index l runs over L conformations. The index J runs over all MM atoms thatinteract explicitly with the quantum electron density in the QM/MM calculations
(here called NN atoms). The index I runs over all QM atoms. V ρJl and ~Eρ
Jl are theelectrostatic potential and the electrostatic field, respectively, due to the presenceof the QM charge density, and felt by classical atom J in configuration l. V MM
Jl
and ~EMMJl are the potential and field generated by the {qI} set. Restraining the
{qI} set so as to reproduce both the electrostatic potential and the electrostatic fieldhas been shown to provide better results than reproducing only the electrostatic

3.1. Molecular dynamics 33
potential [174]. The third term restrains the set of charges {qI} to the Hirshfeldcharge values qHIl [272]. The last term restrains the total charge of the {qI} set tothe correct value Qtot.
Then, the {qI} and the van der Waals parameters (taken from a standard force fieldsuch as AMBER [173]) are used to calculate the total non-bonded forces acting onthe QM atoms. These forces are subtracted from the total force, yielding a set ofbonded forces
~FQMbonded = ~FQM − ~FMMnon−bonded . (3.81)
Finally, the force field bonded parameters, including bonds, angles, and torsions forthe atoms in the QM region are obtained through a least squares fit to the bondedab initio forces.
σ2 =L∑l=1
∑I∈QM
∥∥∥~FMMbondedlI − ~FQMbonded
lI
∥∥∥2
. (3.82)
The parameters are fitted to obtain the smallest average error over all the referenceframes, extracted from QM/MM simulations at finite temperature.
3.1.7 Ewald summation
In molecular dynamics simulations of biomolecules, the computation of non-bondedinteractions, e.g., the fourth and fifth terms in Eq. (3.74) is the most expensivebecause the sums are over all the pairs of atoms. Furthermore, under the periodicboundary conditions, these sums extend over an infinite number of periodic images.The simplest way to avoid summing over all the atom pairs is to truncate the poten-tial at a cut-off distance Rc. In such a case, one can show that [256] the contributionfrom the tail of the potential U(R) can be estimated (in 3D) using
U tail =Nn
2
∞∫Rc
4πR2U(R)dR, (3.83)
where n is the average number density. The equation above implies that the tailcontribution to the potential energy diverges, unless the potential energy U(R) de-cays faster than R−3. Therefore, we can safely apply the truncation method for thevan der Waals term (the fifth term in Eq. (3.74)) which decays as R−6, but not forthe Coulombic term (the fourth term in Eq. (3.74)) which decays as R−1.
The Ewald summation method offers a fast way to compute the long-range Coulom-bic interaction in periodic systems as the fourth term in Eq. (3.74). Let us supposethat the system consists of N charged particles in a cubic box of size L, subject toperiodic boundary conditions. The total Coulomb energy of the system is
U =1
2
∑′
~n
∑IJ
qIqJ∣∣∣~RIJ + ~n∣∣∣ , (3.84)
where qI is the charge of particle I. The prime on the summation indicates the sumis over all periodic images ~n and over all particles I, J , except I = J if ~n = 0.The above sum extends over an infinite number of periodic images. Moreover, it

34 3. Methods
is conditionally convergent, which means that the result depends on the order ofsummation [255]. Therefore, it cannot be used to compute electrostatic energy inmolecular dynamics simulations.
In the Ewald summation method [263, 264], the charge distribution ρ(~R) of thesystem is represented by an infinite set of point charges qI , which can be written interms of delta function as
ρI
(~R)
= qIδ(~R− ~RI
). (3.85)
At each point charge, an isotropic Gaussian charge distribution of equal magnitudebut opposite sign:
ρGI
(~R)
= qI
(2√π
)3
e−α2|~R−~RI|2 (3.86)
is then added. This smeared charge screens the interaction between the pointcharges, so that the interaction of the screened charge distribution
ρSI
(~R)
= ρI
(~R)
+ ρGI
(~R)
(3.87)
becomes short range:
US =1
2
∑~n
∑IJ
qIqJ∣∣∣~RIJ + ~n∣∣∣erfc
(α∣∣∣~RIJ + ~n
∣∣∣), (3.88)
where
erfc(x) =2√π
∞∫0
e−y2
dy, (3.89)
is the complementary error function. Therefore, US can be approximated by trun-cation.
Finally, a Gaussian charge distribution of opposite sign −ρGI(~R)
must be added
to recover the original charge distribution ρI
(~R)
. The interaction energy of this
Gaussian distribution can be expressed as a lattice sum in the reciprocal space minusa self term:
Um =1
2πV
∑IJ
qIqJ∑~k 6=0
1
k2
(e−
k2
4α2 ei~k ~RIJ
)− α√
π
∑I
q2I , (3.90)
where~k = 2πL−1 (lx, ly, lz) , (3.91)
and lx, ly and lz are integers. Due to the presence of the exponential factor thelattice sum can be well approximated by a finite one.
3.1.8 Molecular dynamics in NPT ensemble
The trajectory generated by integrating the Newton’s second equation (3.27) cor-responds to a sampling on an NVE ensemble. However, most experiments are per-formed at constant pressure and constant temperature conditions. Therefore, it isessential to be able to perform simulations under the same NPT condition. Thisrequires introducing thermostat and barostat algorithms to control the temperatureand pressure, respectively.

3.1. Molecular dynamics 35
3.1.8.1 Thermostats
Berendsen thermostat
Berendsen thermostat [265] is a weak coupling method, in which the temperature ofthe system is kept close to a target by the equation
dT
dt=
1
τT[T0 − T (t)] , (3.92)
where T is the instantaneous value of the temperature and τT is the coupling time.The instantaneous temperature T of the system with 3N degrees of freedom is relatedto the kinetic energy through the equation
Ekin =∑I
MI~R2I(t) =
3
2NkBT (t). (3.93)
Therefore, to change the temperature by an amount δT at each finite time step δtwe have to change kinetic energy by an amount
δEkin =3
2NkBδT =
3
2NkB
1
τT[T − T (t)] δt. (3.94)
This change in kinetic energy can be achieved by rescaling the velocities by a factorλ, which is related to δEkin as
δEkin =∑I
MI
(λ2 − 1
)~R2I(t). (3.95)
From Eqs. (3.93), (3.94) and (3.95) we obtain
λ =
√1 +
δt
τT
(T0
T− 1
). (3.96)
The factor λ is used to scale the velocities at each integration step to relax thetemperature towards the target value T0. The relaxation rate is controlled by thecoupling constant τT .
Nose-Hoove thermostat The approach of Nose [199] is based on the use of ex-tended Lagrangian. Nose introduce an extra degree of freedom S to the Lagrangianof the classical N -body system
LNose =1
2
N∑I=1
MIS2 ~R2
I − U({
~RI
})+Q
2S2 − L
βlnS, (3.97)
where L is a constant, Q is an effective mass associated with S. The conjugatemomenta of ~RI and S are given by
~PI ≡∂LNose
∂ ~RI
= MIS2 ~RI (3.98)
~PS ≡∂LNose
∂S= QS (3.99)

36 3. Methods
Hence, the Hamiltonian of the extended system of N particles and the additionaldegree of freedom S is
HNose =∑I
~P 2I
2MIS2+ U
({~RI
})+P 2S
2Q+ L
lnS
β. (3.100)
The corresponding partition function of the microcanonical (NVE) ensemble is
ZNose =1
N !
∫dPSdSd~Pd~Rδ (E −HNose). (3.101)
Let us define the scaled momenta
~P ′ =~P
S. (3.102)
ZNose becomes
ZNose = C1
N !
∫d~P ′d~R exp
[−β 3N + 1
LH(~P ′, ~R
)], (3.103)
where
H(~P ′, ~R
)=∑I
~P ′2
I
2MI
+ U({
~RI
}). (3.104)
If we choose L = 3N + 1, then ZNose corresponds to the partition function of the
canonical (NVT) ensemble of the system with the degrees of freedom{~P ′I
},{~RI
}.
Therefore, we can interpret ~P ′ as the physical momenta while ~P as the virtualmomenta. If we denote all the physical variables as primed and virtual momenta asunprimed, we have the following relations
~R′ = ~R,
~P ′ =~P
S,
S ′ = S,
∆t′ =∆t
S. (3.105)
From the Hamiltonian (3.100), one can derive the equations of motion for the virtualvariables
d~RI
dt=∂HNose
∂ ~PI=
~PIMIS2
, (3.106)
d~PIdt
= −∂HNose
∂ ~RI
= −∂U({
~RI
})∂ ~RI
, (3.107)
dS
dt=∂HNose
∂PS=PSQ, (3.108)
dPSdt
= −∂HNose
∂S=
(∑I
~P 2I
MIS2− L
β
)/S, (3.109)

3.1. Molecular dynamics 37
or for the physical variables, these equations of motion become
d~R′Idt′
=~P ′IMI
, (3.110)
d~P ′Idt′
= −∂U({
~R′I
})∂ ~R′I
−(S ′P ′SQ
)~P ′I , (3.111)
1
S
dS ′
dt′=S ′P ′SQ
, (3.112)
d(S′P ′SQ
)dt′
=
(∑I
~P ′2
I
MI
− L
β
)/Q. (3.113)
Hoover [200] further simplified these equations by introducing the thermodynamicfriction coefficient
ξ =S ′P ′SQ
. (3.114)
The equations of motions (3.110)–(3.113) become, after dropping the primes
~RI =~PIMI
, (3.115)
~PI =∂U({
~RI
})∂ ~RI
− ξ ~PI , (3.116)
S
S=d lnS
dt= ξ. (3.117)
ξ =
(∑I
~P 2I
MI
− L
β
)/Q, (3.118)
3.1.8.2 Barostats
In a molecular dynamics simulation of a periodic system in a box, the isotropicpressure p is defined as the trace of the pressure tensor p
p =1
3Tr (p) . (3.119)
p is calculated by the Clausius virial theorem
p =2
V(EKin − Ξ) , (3.120)
where V is the box volume, EKin is the kinetic energy and Ξ is the inner virial tensor
Ξ = −1
2
∑I<J
~RIJ~FIJ . (3.121)

38 3. Methods
Pressure control during a simulation can be achieved through a change in the innervirial tensor by rescaling the inter-particle distances RIJ .
In the Andersen barostat approach [266], the coordinates{~RI
}are replaced by
scaled coordinates{~R′I
}defined as
~R′I =~RI
V 1/3. (3.122)
Consider a new Lagrangian, in which the volume V appears as an additional dy-namical variable
LAn =1
2V 2/3
∑I
MI~R′2I −
∑I<J
U(V 1/3R′IJ
)+
1
2µV 2 − p0V. (3.123)
The first two terms on the right hand side are the Lagrangian of the unscaled system,the third term is the kinetic energy for the motion of V , and the fourth term repre-sents a potential energy associated with V . p0 and µ are constants, whose physicalmeaning is represented by the target pressure and the pressure coupling constant,respectively.
From the Lagrangian (3.123), the corresponding Hamiltonian and hence the equa-tions of motion for the scaled variables can be derived. Finally, mapping back to the
unscaled variables{~RI
}, we get
d~RI
dt=
~PIMI
+1
3~RId lnV
dt, (3.124)
d~PIdt
= −∑I<J
~RIJU′ (RIJ)− 1
3~PId lnV
dt, (3.125)
µd2V
dt2= p0 +
[2
3
∑I
~P 2I
2MI
− 1
3
∑I<J
~RIJU′ (RIJ)
]/V. (3.126)
Parrinello and Rahman [202] in 1981 extended the Andersen barostat to allow thesimulation box to change its shape. The cell can have an arbitrary shape and itsvolume is completely determined by three vectors ~a, ~b and ~c
V = det h = ~a ·(~b× ~c
), (3.127)
where h is a 3 matrix, whose columns are the three vectors ~a, ~b and ~c.
The position ~RI of a particle can be written in terms of h and a column vector ~SIwith components ξI , ηI and ζI as
~RI = h~SI = ξI~a+ ηI~b+ ζI~c, (3.128)
with 0 ≤ ξI , ηI , ζI ≤ 1. The squared distance between particle I and J is given by
R2IJ = STI GSJ , (3.129)

3.1. Molecular dynamics 39
where G is the metric tensorG = hTh. (3.130)
Using notations above, the Lagrangian can then be written as
LPR =1
2
∑I
MI STI GSI −
∑I<J
U (RIJ) +1
2µTr
(hT h
)− p0V. (3.131)
The corresponding equations of motion can be derived similarly to the isotropic casefrom Andersen.
3.1.9 Replica exchange with solute tempering
Replica exchange molecular dynamics method (Usually it is called REM) [267, 268,269] has been widely used to accelerate conformational sampling of complex systems,such as biomolecules. However, the number of replicas increases with the square rootof the number of degrees of freedom [268, 270], which limits its applications for largesystems. To overcome this problem, Liu et al. [176] proposed a so-called “replicaexchange with solute tempering” (REST) variant of REM, which is able to reducesignificantly the number of replicas.
This scheme is based on the observation that the simulation box of most biomolecularsystems consists of relatively small solute molecules (proteins, DNA...) and a largenumber of solvent molecules. However, the main interest is usually in the soluteconformations. Therefore, REST aims at enhancing only the dynamics of the solutemolecules.
In a standard REM simulation, multiple replicas of the same system are prepared.Each replica has different temperature and/or Hamiltonian and is sampled indepen-dently with the canonical ensemble MD simulations for some time. Then, with acertain frequency, exchange between neighboring replicas is attempted with someprobabilities. These exchange probabilities are determined so that the ensemble ofeach replica obeys the Boltzmann distribution.
In case the replicas differ only in the Hamiltonian, the Boltzmann distribution foreach replica is given by
Pi(Xi) = Z−1i exp [−βEi(Xi)] , (3.132)
where Ei is the energy and Zi is the partition function of replica i. The exchangeprobability W (i→ j) between replica i and j is determined from the detailed bal-ance condition
Pi(Xi)Pj(Xj)W (i→ j) = Pi(Xj)Pj(Xi)W (j → i), (3.133)
which gives the ratio of the transition probabilities
W (i→ j)
W (j → i)= exp(−∆), (3.134)
with∆ = β [Ei(Xj) + Ej(Xi)− Ei(Xi)− Ej(Xj)] . (3.135)

40 3. Methods
If the Metropolis criterion is applied, the acceptance probability is chosen as
W (i→ j) =
{1 if∆ ≤ 0
exp(−∆) if∆ > 0.(3.136)
In the REST variant proposed by Liu et al. [176], the system of interest (e.g. proteinsolvated in water) is therefore divided into two parts: the protein molecule (denotedby p) and water molecules (denoted by w). The potential energy of each replica usedto enhance sampling is scaled such that the protein molecule in different replicas hasdifferent effective temperature while the solvent’s effective temperature is the samein all replicas. The potential energy can be divided into three terms
V = Vpp + Vpw + Vww, (3.137)
where the first term represents the energy of the protein, the second one the in-teraction energy between the protein and water, and the third, the interaction ofwater molecules with each other. The system of interest is usually chosen to be thelowest replica, i.e. the protein solution at the inverse temperature β0 = 1
kBT0with
the energy potential given by Eq. (3.137). The energy potential for the highesttemperature replica is given by
VH =βHβ0
Vpp +
√βHβ0
Vpw + Vww, (3.138)
where βH is the inverse of the highest effective protein temperature. The energypotentials for the intermediate replicas are defined as the linear combination of thetwo-end potentials defined above
Vi = (1− λi)V + λiVH
=
[(1− λi) +
βHβ0
λi
]Vpp +
[(1− λi) +
√βHβ0
λi
]Vpw + Vww, (3.139)
where λi is related to the effective inverse temperature βi of replica i through theformula
λi =βi − β0
βH − β0
. (3.140)
The energy potentials of all the replicas are now completely defined by equations(3.137)-(3.139). One can directly use the Hamiltonian replica exchange routine ofGROMACS program [203], which is based on the λ–dynamics to perform RESTsimulations. The number of replicas and values of effective temperature can beestimated using the approach of ref. [271], in which only the number of protein’satoms is taken into account. The relation (3.140) is then used to determine thevalues of the coupling constants λi.
3.2 Computational spectroscopy
In this thesis, extensive comparison with experimental spectroscopic properties ismade. Here, we present the theoretical framework of the spectroscopy calculationscarried out in this work.

3.2. Computational spectroscopy 41
3.2.1 NMR chemical shifts
In NMR experiments of a solute in aqueous solution, the sample is exposed toan external magnetic field ~Bext. This magnetic field induces an electronic current~j(~r). It, in turn, produces an additional inhomogeneous magnetic field ~Bind at thepositions of sample’s nuclei. The latter field is sensitive to the electronic densityand thus different for different nuclei depending on their chemical environment.Therefore, it determines the resonance frequencies of the nuclear spins measured inan NMR experiment [273] by irradiating the sample with an electromagnetic pulse.
The chemical shielding tensor↔σ is defined as the proportionality tensor factor be-
tween the induced and the external magnetic field at the positions of the nuclei
↔σ (~r) =
∂ ~Bind (~r)
∂ ~Bext. (3.141)
NMR experiments of biomolecules in solution measure isotropic shieldings. This canbe calculated as the trace of the shielding tensor
↔σ
σ =1
3Tr(↔σ). (3.142)
The shielding tensor is sensitive to the local electronic density and thus to thechemical bonding environment. The resonance condition is given by
∆E = hν = gHµH (1− σ) ~Bext. (3.143)
∆E is the resonance energy; ν is the corresponding frequency, h is Planck’s constant.gH and µH are the nuclear g-factor and the nuclear magneton, respectively. Thechemical shift δ of a given sample is defined with respect to a reference frequency
δ =vsample − vreference
vreference
× 106 [ppm] , (3.144)
where νsample is the frequency of a nucleus in the sample, and νreference is that of thereference system.
From this discussion it is clear that the key quantity for NMR chemical shift calcu-lations is the local magnetic field ~Bind that is induced by the total electronic current~j(~r). It reads
~Bind (~r) =µ0
4π
∫d3~r′
~r′ − ~r|~r′ − ~r|2
×~j (~r′), (3.145)
where µ0 is the permeability in vacuum. The total electronic current ~j(~r) can becalculated using first principles density functional perturbation theory [208]. TheKohn-Sham orbitals are expanded in powers of the external magnetic field
φi = φ(0)i +Bextφ
(1)i +
(Bext
)2φ
(2)i + ... (3.146)
They minimize the total density functional
EtotKS = EKS
[φ
(0)i +Bextφ
(1)i + ...
]+ εpert
[φ
(0)i +Bextφ
(1)i + ...
], (3.147)

42 3. Methods
where EKS is the unperturbed Kohn-Sham density functional in Eq. (3.50). Thecorresponding unperturbed effective Kohn-Sham Hamiltonian is
HKS = − ~2
2me
∇2 + vks(ρ), (3.148)
where vks is the Kohn-Sham potential given by Eq. (3.52).
The external magnetic field can be written as
~Bext = ~∇× ~A (~r) , (3.149)
where ~A(~r) is the vector potential. The vector potential is not uniquely defined since
the gradient of any scalar function can be added without changing ~Bext. In the caseof a homogeneous magnetic field (as in the case of NMR experiments), ~A can beconveniently chosen as [273]
~A (~r) = −1
2
(~r − ~Rgo
)× ~Bext, (3.150)
where ~Rgo is the gauge origin of the vector potential ~A(~r), i.e. the center of thevector potential. This is an arbitrary parameter.
The main point in defining ~A(~r) is that the introduction of the external magnetic field~Bext is equivalent to replacing the momentum operator ~p = −i~~∇ in the unperturbedKohn-Sham Hamiltonian (3.148) by ~p − e
c~A (~r), where c is the speed of light. This
leads to a perturbation term in the Hamiltonian at the first order in the field strength(paramagnetic term), − e
mec~p · ~A (~r) and one at the second order (diamagnetic term),
e2
2mec2~A (~r) · ~A (~r):
HtotKS = HKS +Hpert, (3.151)
with
Hpert = − e
mec~p · ~A (~r) +
e2
2mec2~A (~r) · ~A (~r) . (3.152)
Then, the perturbation functional energy εpert reads
εpert =∑i
⟨φi∣∣Hpert
∣∣φi⟩ =∑i
e2
2mec2
⟨φ
(0)i
∣∣∣ ~A (~r) · ~A (~r)∣∣∣φ(0)
i
⟩− e
mec
(⟨φ
(1)i
∣∣∣~p · ~A (~r)∣∣∣φ(0)
i
⟩+⟨φ
(0)i
∣∣∣~p · ~A (~r)∣∣∣φ(1)
i
⟩), (3.153)
in which φ(0)i are the ground state Kohn-Sham orbitals and φ
(1)i are the first order
corrections.
The first order perturbation gives rise to a correction φ(1) to the electronic groundstate in Eq. (3.146). This correction is responsible for the induced current, whichis obtained from the functional Eq. (3.153) as a sum of a dia- and a paramagneticterm [208, 209]:
~j (~r) =e2
me
~A (~r)∑i
∣∣∣φ(0)i (~r)
∣∣∣2− e
me
∑i
[⟨φ
(1)i |~p|φ
(0)i
⟩−⟨φ
(0)i |~p|φ
(1)i
⟩]. (3.154)

3.2. Computational spectroscopy 43
Both contributions depend individually on the choice of the gauge. To address theimplications resulting from the ambiguity in such choice, several approaches havebeen developed, see e.g. [273]. Here, we use the so-called “~Rgo = ~r” variant of the“Continuous Set of Gauge Transformations” (CSGT) method [274], which is mostappropriate for plane-wave based calculations. For each point in space ~r, the currentdensity (Eq. 3.154) is calculated by setting ~Rgo equal to ~r.
For heavy atoms such as Pt, it is essential to take into account relativistic effects be-cause the core electrons (close to the nucleus) in these atoms move at a considerablefraction of the speed of light. In this thesis, we have used the Zero Order Regular Ap-poximation (ZORA) appoach to include the relativistic correction in the calculationsof Pt NMR shielding constants. In the ZORA approach, the effective one-electronKohn-Sham Hamiltonian (3.148) is replaced by the relativistic Hamiltonian for anelectron:
HZORAKS = vks + ~p
c2
2c2 − vks
~p+c2
2c2 − vks
↔σ(~∇vks × ~p
), (3.155)
where vKS is the effective one-electron Kohn-Sham potential given in Eq. (3.52),↔σ
is the Pauli matrix, c is the speed of light. The magnetic field can be then includedin the same way, i.e., by means of the substitution
~p→ ~p− e
c~A (~r) . (3.156)
3.2.2 Extended X-ray absorption fine structure (EXAFS)
EXAFS spectroscopy probes the local environment of metal ions in biological systems[275, 220]. It provides detailed local structural information such as interatomicdistances and coordination numbers. In an EXAFS experiment, an absorbed X-rayphoton liberates an electron from a core level resulting in an absorption edge in thespectrum. The energies of the edges are unique to the type of atom. Well abovethe absorption edge (≥ 30 ev), oscillatory wiggles arise from higher order multiplescattering. In fact, the ejected photoelectron wave function scatters from the atomssurrounding the absorbing atom, thereby creating interferences between the outgoingand scattered waves. Thus, the signal is sensitive to the short-range order in thesystem under investigation. These quantum interferences cause an energy-dependentvariation of the X-ray absorption coefficient µ, a measurable quantity. The EXAFSfunction χ of a specific atom is then defined as the normalized, oscillatory part ofthe X-ray absorption above the absorption edge of that atom
χ (E) =µ (E)− µ0 (E)
µ0 (E), (3.157)
where E is the energy of the photoelectron, defined with reference to a core level Eifrom which the electron is liberated
E = ~ω + Ei. (3.158)
~ω is the energy of X-ray photon. µ0(E) is the absorption coefficient of the isolatedatom. Eq. (3.157) is the theoretical definition for the EXAFS, in which µ0(E) can be

44 3. Methods
calculated theoretically [276] but it is not accessible experimentally. In experiments,the EXAFS is instead calculated from data reduction using the expression [275]
χ (E) =µexp (E)− µb (E)
∆µexp
, (3.159)
where µexp(E) is the experimentally measured absorption, ∆µexp an estimate of theedge step, and µb(E) is a smooth background curve that is fit to the experimentaldata.
µ (E) in Eq. (3.157) is proportional to the transition rate as given by Fermi’s goldenrule within the dipole approximation [220]
µ (E) ∝∑f
|〈ψf |ε · ~r|ψi〉|2 δ (E − Ef ), (3.160)
where |ψi〉 is the initial deep core state with energy Ei and |ψf〉 is the final statewith energy Ef , which is initially unoccupied. ε is the photon’s electric polarizationvector. In this work, the calculations of EXAFS spectra have been done usingmultiple scattering approach [219, 225, 220]. In the Green’s function formulation,µ(E) can be rewritten in terms of the imaginary part of the one-particle Green’sfunction G (~r, ~r′, E) describing all of the possible ways for a photoelectron to interactwith the surrounding atoms
µ (E) ∝ −1
πIm 〈ψi |ε∗ · ~rG (~r, ~r′, E) ε · ~r′|ψi〉Θ (E − EF ) , (3.161)
where Θ(E − EF ) is the broadened step function at the Fermi’s energy level EF .
The Green’s function can be expanded in a multiple scattering series in which eachterm contains a successive product of free propagators between geometric sites andscattering matrices at each site. The scattering potential seen by the photoelec-tron is approximated by the muffin-tin potential in which the atomic potentials areapproximated as spherically symmetric out to a finite radius, and the interstitialpotential between the atomic sphere is approximated as a constant.
Instead of representing χ as a function of energy, the wave vector, k =√
2meE/~2
is used. χ (k) is then expressed as a function of the contributions from each of thescattering paths [225, 220]
χ (k) =∑
Γ
χΓ (k)
=∑
Γ
S20 |FΓ (k)|kR2
Γ
sin (2kRΓ + ΦΓ (k) + 2δc (k)) e−2σ2Γk
2
e−2RΓ/λ(k), (3.162)
where Γ runs over all possible multiple scattering paths Γ within a cluster of atoms.|FΓ (k)| is the effective scattering amplitude for path Γ [220]. S2
0 is an amplitudereduction factor to account for intrinsic losses and interference. RΓ is the lengthof the path Γ. ΦΓ(k) is the net scattering phase shift, and δc(k) is the final-statephase shift at the absorbing atom. σ2
Γ = 〈(δRΓ)〉 is the mean square variation inRΓ, and e−2σ2
Γk2
is the path Debye-Waller factor, which accounts for the fluctuationsof the path length due to structural and thermal disorder. λ (k) is the mean free
3.2. Computational spectroscopy 45
path of the photoelectron and hence, e−RΓ/λ(k) accounts for the finite life-time of thephotoelectron.
The computation of EXAFS spectra using Eq. (3.162) has been implemented in theFEFF code developed by Rehr et al. [218, 219]. First, we calculate the electronicstructure of the isolated atoms by solving the Dirac-Fock equation [Za02, Bu10]. Theatomic charge densities are then superimposed in the desired geometry, and averagedto create the muffin-tin potential. Hedin-Lundqvist self-energy terms are added toaccount for inelastic losses. Then, λ (k) is calculated from the imaginary part ofthe photoelectron self-energy and the core-hole lifetime [220]. δc (k) are calculatedby integration within the atomic potential outward to the radius, and matching theboundary conditions to free spherical waves between the atoms [220].
To calculate the set of the scattering amplitudes FΓ (k) as a function of k, a multiplescattering expansion is done. FEFF uses the scattering matrix formalism of Rehrand Albers [220] in which the effective scattering amplitude for each path is givenby
FΓ = TrM · FN · · · F 2F 1, (3.163)
where M is the termination matrix for the final state at the absorption site. F i isthe scattering matrix at site i. A huge number of paths enter into the calculation,but many of them are (nearly) equivalent to each other and their calculation can beomitted. A path filter is implemented in FEFF to estimate the importance of eachpath, defined as the integral over the full k range of |χΓ (k)| dk. Any path with avalue of the integral larger than a few percent of the largest path will be used in thecalculation of χ(k).
To calculate the Debye-Waller factor as defined above, FEFF uses the correlatedDebye model [277], in which the mean-square displacement is
σ2Γ (T ) =
~M
ωmax∫0
dω
ωρΓ (ω) coth
(β~ω
2
), (3.164)
where T is the temperature, M is the atomic mass, ω is the vibrational frequency,β = 1/kBT , and ρΓ is the projected density of vibrational states. In this model, ρΓ
is given by [220]
ρΓ (ω) =3ω2
ω2D
[1− sin (ωRΓ/c)
ωRΓ/c
]. (3.165)
ωD = kBθD/~ is the Debye frequency, θD is the Debye temperature, c = ωD/kD isthe Debye approximation for the speed of sound, kD = 6π2N/V , and N/V is theatomic density number.
3.2.3 Circular dichroism (CD)
Circular dichroism (CD) spectra can be used to analyze the secondary structureof proteins. As all chiral groups, protein backbone units absorb left- and right-circularly polarized light in a different manner. Hence, the extinction coefficients ofthe absorption of left- (εL) and right (εR)-circularly polarized light differ: εL 6= εR.

46 3. Methods
The CD function ∆ε(λ) is the difference in the absorption of left- and right-circularlypolarized light, plotted as a function of the wavelength λ of the polarized light
∆ε (λ) = εL (λ)− εR (λ) . (3.166)
The integral of ∆ε(λ) over a wavelength range associated with a particular transitionfrom the ground state 0 to an excited state k is the rotational strength of thattransition (R0k). The latter can be calculated using the Rosenfeld equation [278]
R0k = Im(⟨ψ0 |~µ|ψk
⟩ ⟨ψk |~m|ψ0
⟩), (3.167)
where, ~µ is the electric, and ~m the magnetic transition dipole moment operator. ψ0
and ψk are the wave functions of the ground state and the excited state, respectively.
For proteins, which have a very large number of atoms and electrons, approxima-tions are needed to calculate ψ0 and ψk. In the matrix method [279], the protein isdivided into M chromophores with a certain number of local excitations at each chro-mophore. The approach is based on coupled-oscillator and exciton models, wherethe Hamiltonian is described by energies and interactions between the transitions onthe chromophores. For protein CD spectroscopy, the most important chromophoresare the amide groups. The relevant excitations are π → π∗ and n → π∗ transitionsof the amide carbonyl groups.
In the matrix method, the total wave function of the protein is expressed as a linearsuperposition of basis functions Φia. Each basis function is a product of M monomerwave functions. Electronic excitations may occur within a group but not betweengroups. The basis function is further restricted to allow only one group to be excited[206, 280, 281, 207]. Thus:
Φia = ϕ10 · · · · · ϕia · · · · · ϕM0, (3.168)
where ϕia represents the wave function of chromophores i, which has undergone anelectronic excitation ϕi0 → ϕia. The excited state wave function of the protein isthen given by
ψk =M∑i
ni∑a
ckiaΦia. (3.169)
The sum above is over M chromophores and ni excitations on each chromophore.ckia’s are expansion coefficients to be determined by solving the Schrodinger equationfor the excited state k of the protein [280, 281]
Hψk = Ekψk. (3.170)
The total Hamiltonian H for the protein consisting of M chromophores reads
H =M∑i=1
Hi +M−1∑i=1
M∑j=i+1
Vij, (3.171)
where Hi is the Hamiltonian of chromophore i and Vij is the interaction potentialbetween chromophores.
The Hamiltonian (3.171) can be written in matrix form, in which the diagonal el-ements are the transition energies for each transition of each chromophore, and

3.2. Computational spectroscopy 47
the off-diagonal elements are the interaction energies between different transitions.These interactions are the cause of the dependency of protein CD on secondarystructure.
The diagonal elements of the Hamiltonian matrix are calculated as
Hia = Eia = 〈Φia|Hi |Φia〉 . (3.172)
The off-diagonal elements of the Hamiltonian matrix are calculated as
Via,jb = 〈Φia|Vij |Φjb〉 , (3.173)
e.g. for the interaction between the transition 0 → a on chromophore i and thetransition 0→ b on chromophore j, it reads
Vi0→a;j0→b =
∫ ∫ϕi0ϕiaVijϕj0ϕjbdτidτj. (3.174)
This interaction can be regarded as an electrostatic interaction between charge den-sities ρ. In this case Eq. (3.174) becomes
Vi0→a;j0→b =
∫ri
∫rj
ρi0a (ri) ρj0b (rj)
4πε0rijdτidτj, (3.175)
where ρi0a (ri) and ρj0b (rj) denote the transition electron densities on chromophoresi and j, respectively, ε0 is the vacuum permittivity and rij is the distance betweenthe chromophores.
In the “monopole-monopole” approximation, used here, the charge and transitiondensities are approximated by point charges and the matrix element Vi0→a;j0→b isre-cast as a sum of Coulomb interactions
Vi0→a;j0→b =Ns∑s=1
Nt∑t=1
qsqtrst
, (3.176)
where qs and qt are point charges on chromophores i and j. Ns and Nt are the numberof these charges on the chromophores. Thus the magnitude and the location of thesemonopoles reflect the magnitude and the orientation of the transition moments.They are critical for determining the inter-chromophore interactions.
The computation of CD spectra requires atomic coordinates and the position of thechromophores as input. Each chromophore is parameterized by a set of monopoles,which are superposed on the chromophoric groups in the protein, and describe theirelectrostatic potential. There are commonly used parameter sets for the matrixmethod: NMAabinit [207] that has been derived entirely from ab initio calculationsand NMAsemi [282] that has been derived from a combination of semiempiricalcalculations and experimental data. By calculating the interaction between all thedifferent electronic excitations, the Hamiltonian matrix is constructed. Diagonaliza-tion of the Hamiltonian matrix yields the energies (the eigenvalues) for all states kand the corresponding wave functions ψk.
Rotational strengths of the transitions R0k, i.e. their spectral intensities, are cal-culated by using Eq. (3.167). This yields a line spectrum. In an experimental

48 3. Methods
spectrum the transitions are broadened by various mechanisms, e.g. by lifetimebroadening, vibronic coupling or interactions with the environment. Therefore, theCD spectrum can be constructed from the rotational strengths by convoluting themwith normalized band shape functions such as a Gaussian or Lorentzian line shapefunction. For Gaussian band shape functions, which typically provide better resultsthan Lorentzian functions, the CD spectrum reads [280]
∆ε (λ) ∝∑k
R0k
Γkexp
[−(λ− λk
Γk
)2], (3.177)
where Γk is the half-width of the Gaussian.

4Structural determinants of cisplatinand transplatin binding to Ctr1’sMet-rich motif: a computationalspectroscopy approach
This chapter is reproduced from Ref. [63]
Abstract
The cellular uptake of cisplatin and of other platinum-based drugs is mediated bythe high-affinity copper transporter Ctr1. The 8-residue long peptide called Mets7(which has the amino acid sequence MTGMKGMS) mimics one of Ctr1’s extra-cellular methionine(Met)-rich motifs. It is an excellent model for investigating theinteraction of platinum drugs with Ctr1 in in vitro and in vivo conditions. Arne-sano et al. have shown that: (i) Cisplatin loses all of its ligands upon reactionwith Mets7 and the metal ion binds to the three Met residues and completes itscoordination shell with a fourth ligand which can be a chloride or a water/hydroxyloxygen. (ii) Transplatin loses only the chlorido ligands, which are replaced by Metresidues. Here, we provide information on the structural determinants of cisplatin-Mets7 and transplatin-Mets7 adducts by computational methods. The predictionsare validated against EXAFS, NMR, and CD spectra. While EXAFS gives informa-tion restricted to the metal coordination shell, NMR provides information extendedto residue atoms around the coordination shell and, finally, CD provides informa-tion about the overall conformation of the peptide. This allows us to elucidate thedifferent reaction modes of cisplatin and transplatin towards the peptide, as wellas to propose the platinated peptides [Pt2+X]-(M*TGM*KGM*S) (X = Cl−, OH−)and trans[Pt(NH3)2]2+-( M*TGM*KGMS) as the most relevant species occurring inwater solution.

504. Structural determinants of cisplatin and transplatin binding to Ctr1’s Met-rich
motif: a computational spectroscopy approach
4.1 Introduction
Cisplatin [cis-diamminedichloridoplatinum(II)] is one of the most widely used anti-cancer drugs. It is active against many types of cancer, such as testicular, ovarian,cervical, and colorectal cancers and relapsed lymphoma [87, 2]. Unfortunately, thedrug suffers from several drawbacks, such as side effects and intrinsic or acquiredresistance, which severely limit the efficacy of the drug [87, 3, 1]. The cellularmechanisms behind the resistance of cisplatin and other platinum-based drugs aremultifactorial and not completely understood [30, 2, 3]. The generally acceptedmechanism involves an increased cisplatin detoxification, an improved repair of theDNA lesions, and a decreased accumulation of the drug [30, 28]. Among these fac-tors, the reduced drug accumulation is a common and distinctive feature of resistantcells [30, 131, 2]. It is, therefore, important to characterize the molecular mecha-nisms of cisplatin’s efflux and cellular uptake. The first involves the copper pumpsATP7A and ATP7B in the secretory vesicles [153, 30, 132] and the cytosolic copperchaperone Atox1 [110, 34]. All of these proteins can bind cisplatin and enhance its ef-flux/sequestration [30, 132, 110, 34]. Cisplatin may be also ensnared in melanosomesthat are subsequently exported from the cells [177]. The cellular uptake is governed,at least in part, by the homotrimeric copper transporter Ctr1 [30, 178, 110]. Ctr1forms a channel-like pore in the membrane [179], featuring intra- and extracellulardomains. Flow of the active platinum substrate through the channel-like pore ofthe Ctr1 trimer has been proposed [180, 181]. Alternatively, cisplatin could formcoordination bonds with the protein [142, 143]. The extracellular N-terminal domaincontains methionine(Met)-rich motifs, which are able to bind copper [182]. Met’ssulfur is indeed a good donor atom for platinum [183]. Hence, some cisplatin couldbind to the extracelular Met-rich motifs of Ctr1 and an endocytic vesicle might beformed. In this way the vescicle could incorporate cisplatin present in the extra-cellular solution while protecting the drug from deactivation and transporting it tosubcellular compartments [142, 143].
To provide insights on Ctr1–cisplatin interactions, Arnesano et al. have carriedout in vitro studies on reactions of cisplatin, the inactive isomer transplatin [trans-diamminedichloridoplatinum(II)], and other platinum complexes with the MTGMKGMSpeptide (Mets7) [142, 143]. The peptide mimics the seventh Met-rich motif of yeastCtr1. Circular dichroism (CD) measurements showed that Mets7 features a β-turnconformation after reacting with cisplatin, whilst it is a random coil in the Apo form[142]. Furthermore, electrospray mass spectrometry (ESI-MS) data showed that cis-platin progressively loses all ammine and chlorido ligands and ultimately coordinatesonly to Mets7. This contrasts with transplatin, which keeps the two ammine lig-ands. Consistently, 1H and 13C nuclei of ε-CH3 and γ-CH2 of methionines featurea large downfield shift in NMR spectra upon platinum coordination [142]. Othergroups also reported a similar binding mode of cisplatin to partial or full-lengthN-terminal domain of human Ctr1 [146, 147]. Hence, Mets7 is a good mimic of thewhole N-terminal domain of Ctr1 in terms of reactivity against cisplatin.
The structural basis of cisplatin and transplatin binding to Mets7 is still lacking.Herein, we have addressed this issue by using computational tools. Computationalapproaches are indeed widely used to investigate cisplatin and its interactions withbiomolecules [45]–[62], [155]–[165]. Specifically, we have used hybrid Car-Parrinellodensity functional theory-based QM/MM simulations [166, 167, 168, 169, 170, 171,

4.2. Computational protocol 51
172] on models of platinated Mets7, extracted from available experimental informa-tion [142, 143]. These models contain the platinum moieties ([PtCl]+, [Pt(H2O)]2+,[Pt(OH)]+ and trans-[Pt(NH3)2]2+). The QM/MM simulations, albeit rather accu-rate, can cover only rather short time scales (0.1 ns or less). Whilst these are likely tobe enough to provide valuable information on the local platinum coordination, globalconformational properties of the peptide are out of reach. To extend the time-scale ofthe simulations, we have developed AMBER-type [173] force field parameters of theplatinum moieties based on the QM/MM simulations via the so-called “force match-ing” procedure [174]. The parameters are derived so as to reproduce the QM/MMforces, the electrostatic potential, and the electric field obtained by QM/MM sim-ulations. This procedure was already applied successfully to platinated DNA [175].Finally, 0.2µs-long replica exchange simulations [176] based on these force field pa-rameters are performed for the platinated peptides. The accuracy of the predictedmodels is established by a comparison with the NMR and CD data already reportedin the literature [142, 143], as well as EXAFS spectra measured expressly for thisstudy.
4.2 Computational protocol
4.2.1 Molecular models
We have considered in total seven models: one free Mets7 peptide (called Apo here-after), three cisplatn-Mets7 (C1–C3) and three transplatin-Mets7 (T1–T3) adducts(Fig. 4.1).
The cisplatn-Mets7 adducts include [Pt2+X]-(M*TGM*KGM*S), in which X = Cl−
(C1); H2O (C2); OH− (C3).
The transplatin-Mets7 adducts are trans-[Pt(NH3)2]2+-( M*TGM*KGMS) (T1); trans-[Pt(NH3)2]2+-( M*TGMKGM*S) (T2); trans-[Pt(NH3)2]2+-(MTGM*KGM*S) (T3)(“*” indicates the donated methionine).
Apo was built as a linear chain by using the Leap package [185].
In the cisplatin-Mets7 adducts (C1–C3, Fig. 4.1), the platinum coordination wastaken from DFT-based optimized model compounds (see Appendix A.1). The plat-inum coordination’s donor atoms are the Mets7’s three methionine sulfurs and eithera chloride (C1), or a water oxygen (C2), or a hydroxyl oxygen (C3).
In the transplatin-Mets7 adducts (T1–T3, Fig. 4.1), the donor atoms are two am-mine nitrogens and two sulfur atoms of either Met1 and Met4 (T1), or Met1 andMet7 (T2), or Met4 and Met7 (T3). The six systems, along with Apo, were insertedin boxes containing water molecules and chloride counterions (Tab 4.1).
The platinated (C1–C3, T1–T3) and Apo peptides were subjected to 0.4 µs ofpreparatory AMBER-based molecular dynamics (MD) simulations using the NAMDprogram [186]. The AMBER parm99 force field [173] with the ”Stony Brook” mod-ification for the backbone torsions [190], the TIP3P water model [192] and theSmith&Dang force field [193] were used for the peptide, water molecules, and coun-terions, respectively. The bond distances and angles were constrained using the

524. Structural determinants of cisplatin and transplatin binding to Ctr1’s Met-rich
motif: a computational spectroscopy approach
SD CE CG
CB
Pt Cl
C1 Met1
Met4
Met7
C2 Met1
Met4
Met7
CB CG
CE SD Pt H2O
CE
CG CB
SD
Pt OH
Met1
Met4
Met7
C3
CE
CG
CB
SD
Am1
Met1
Met4
T1
Pt Am2
CE CG CB
SD
Pt Am1
T2 Met1
Met7
Am2 CE CG
CB
SD
Pt Am1
Met4
Met7
T3
Am2
SD CE
CG
CB
Apo Met1
Met4
Met7
Figure 4.1 Structural models of platinated and Apo peptides emerging from RESTand QM/MM simulations. The backbone conformations of the lastQM/MM snapshot (in red ribbons) and a representative REST snap-shot (in blue ribbons) are superimposed. The QM atoms are shown instick-and-balls (CB=Cβ, CG=Cγ, CE=Cε). Water is shown in lines.Counterions are not shown for the sake of clarity.
SHAKE algorithm [235] to the values taken from [Pt(SH2)3Cl]+, [Pt(SH2)3(H2O)]2+,[Pt(SH2)3(OH)]+ and trans-[Pt(SH2)2(NH3)2]2+ gas-phase-optimized structures (Tab.A.1 in Appendix). Long-range electrostatic interactions were evaluated using theParticle Mesh Ewald (PME) method [236] The cutoff for the real part of the PMEand for the van der Waals interaction was set to 10 A. An integration time step of2fs was used. Constant temperature (300 K) and pressure (1 atm) conditions wereachieved by using Langevin dynamics with a coupling coefficient of 5 ps and theNose-Hoover Langevin piston algorithm [237] with an oscillation period of 200 fsand the damping timescale of 100 fs. A cluster analysis [187] allowed us to identifyrepresentative structures of the most populated clusters. It turned out that only onecluster was sufficient to comprise 70% or more of the conformational space exploredby the MD trajectories. Hence, we considered only the representatives of the mostpopulated clusters.

4.2. Computational protocol 53
Table 4.1 Selected features of the simulated models
4.2.2 QM/MM simulations
The six representative structures of C1–C3 and T1–T3 underwent hybrid Car-Parrinello QM/MM simulations [167, 168, 169, 170, 171]. We used the CPMDprogram [188] combined with the classical MD GROMOS96 code [189], throughthe interface developed by Rothlisberger et al. [168, 169]. The MM regions com-prised the peptide frame, the solvent, and the counterions (Fig. 4.1). These weredescribed with the AMBER parm99SB force field [173] with the “Stony Brook”modification for the backbone torsions [190], the TIP3P model for the solvent [192]and the Smith&Dang force field for the counterions [193]. The QM part concernsthe platinum coordination polyhedron (Fig. 4.1) and was treated by density func-tional theory (DFT), with the BLYP recipe for the exchange-correlation functional[195, 196]. The wavefunction was expanded in a plane-wave basis set up to anenergy cutoff of 70 Ry. Only the valence electrons were treated explicitly (in thecase of Pt, electrons in the n=5 shell are also included in the valence). The coreelectrons were described using norm-conserving pseudopotentials of the Martins-Troullier type [197]. Isolated system conditions were applied [198]. The β carbon(CB) atoms linked to the MM part by covalent bonds were saturated by “capping”hydrogen atoms[170]. The electrostatic interactions between QM and MM atomswere calculated using a fully Hamiltonian hierarchical scheme [169]. In particular,the short range electrostatic interactions between QM and MM part were takenexplicitly into account within a radius of 5.3 A around every QM atom using anappropriate modified Coulomb potential to prevent electron spill-out [169]. Beyondthis first shell and within 10.6 A, the electrostatic interactions are calculated usingthe D-RESP charge scheme [168]. In the outermost region, a multipole expansionscheme is used [168]. A time step of 0.097 fs was used. A fictitious electronic massof 400 a.u. for the Car-Parrinello dynamics was employed. Constant temperatureconditions were achieved using the Nose-Hoover chain thermostat[199, 200, 201].Nonbonded interactions were evaluated as in the previous MD simulations. 2000steps of simulated annealing were performed to relax the representative snapshots ofthe previous MD simulations. Then, the systems were slowly heated up to 300 K by

544. Structural determinants of cisplatin and transplatin binding to Ctr1’s Met-rich
motif: a computational spectroscopy approach
gradually increasing the target temperature (30 K after every 1000 steps). Finally,25 ps-long QM/MM simulations were carried out.
4.2.3 Force matching procedure
AMBER-type force field parameters of the QM regions were obtained by applyingthe force matching procedure of Refs. [174, 175] and described in section 3.1.6 to300 QM/MM conformations, selected at every 0.08 ps. The atomic partial charges(Tables. A.2–A.3 in Appendix) were obtained through a fit to the electrostaticpotential and the electric field. These, along with van der Waals parameters takenfrom AMBER parm99SB force field [173, 190], were subtracted from the total forcesacting on the QM atoms to yield the bonded forces. A least-squares fit of thelatter allowed to obtain the AMBER-type bond, angle, and dihedral angle forcefield parameters (Tables. A.4–A.6 in Appendix). Equilibrium bond lengths andbond angles were taken from the QM/MM averaged values. The parameters forMet, water, and OH turned out to differ only by 30 to 40% relative to the originalAMBER parameters.
4.2.4 Replica exchange with solute tempering (REST) simula-tions
Apo, C1–C3, and T1–T3 underwent, respectively, 0.5, 0.2, and 0.2 µs replica ex-change with solute tempering (REST) simulations [176] in the NPT ensemble (seeSec. 3.1.9, for more details). The initial structures of the platinated peptides werethe last QM/MM snapshots, whilst for Apo, the initial linear structure inserted inwater was used. Eight replicas covered a temperature range from 300 K to 600 Kfor each system (Fig. 4.2). The force field was the same as that of the previous MDsimulations, except that the platinated moieties were described by the parametersobtained via the force matching procedure.
First, each replica was prepared independently by 5-ns-long MD simulations, thenthe REST simulations were performed with the replica exchange being attemptedafter every 5 ps. The acceptance ratios were between 15 and 25%. The integrationstep of 2 fs was used. In each replica, the temperature was controlled by Nose-Hoover chain thermostat [199, 200, 201], whereas the pressure was controlled byParrinello-Rahman barostat [202]. The REST simulations were carried out with theGromacs 4.5.3 program [203]. The DSSP approach [204, 205] was used to assign thesecondary structures to the conformations along each of the REST trajectories. Thepercentage of each secondary structure type was then estimated from the frequencyof its occurrence during the REST simulations.
Next, 25 ps-long QM/MM simulations were carried out for Apo starting from therepresentative structures obtained from REST simulation. The QM part of the Apomodel includes 3 Met residues (Fig. 4.1). The MM part consists of the peptideframe, the solvent, and the counterions. Exactly the same procedure as the onecarried out for the platinated peptides (see Sec. 4.2.2) was employed. Finally, the
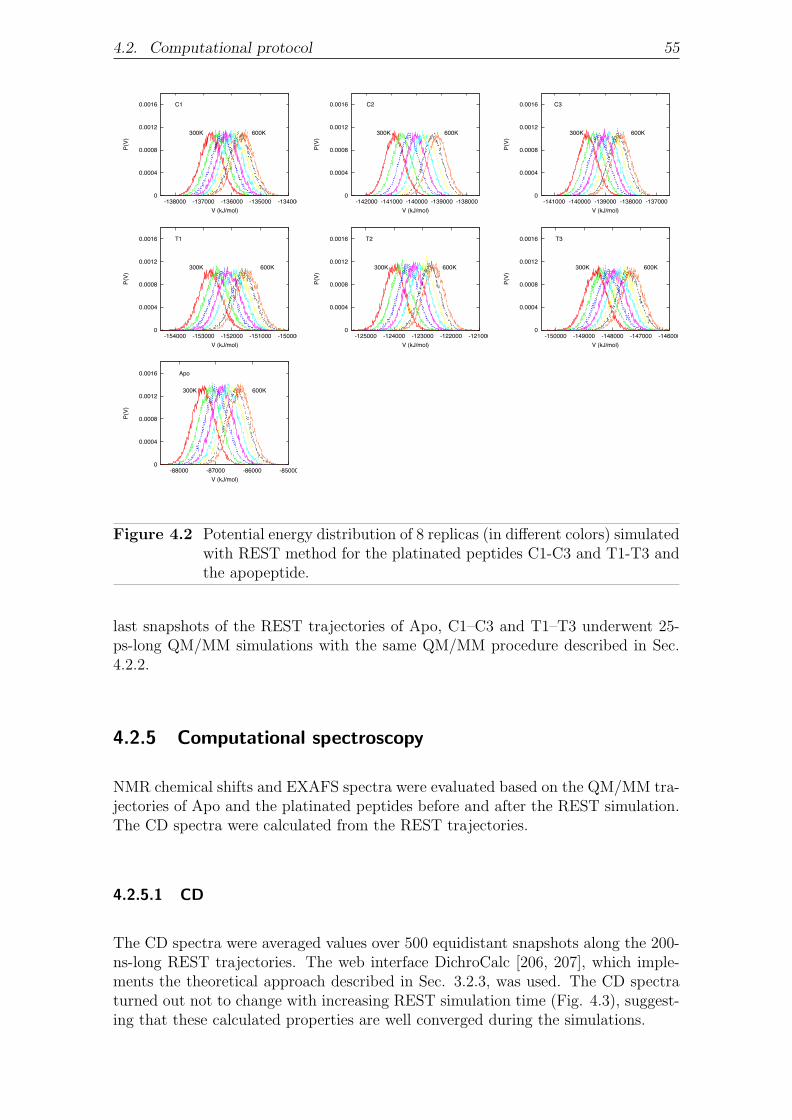
4.2. Computational protocol 55
0
0.0004
0.0008
0.0012
0.0016
-138000 -137000 -136000 -135000 -134000
P(V)
V (kJ/mol)
300K 600K
C1
0
0.0004
0.0008
0.0012
0.0016
-142000 -141000 -140000 -139000 -138000
P(V)
V (kJ/mol)
300K 600K
C2
0
0.0004
0.0008
0.0012
0.0016
-141000 -140000 -139000 -138000 -137000
P(V)
V (kJ/mol)
300K 600K
C3
0
0.0004
0.0008
0.0012
0.0016
-154000 -153000 -152000 -151000 -150000
P(V)
V (kJ/mol)
300K 600K
T1
0
0.0004
0.0008
0.0012
0.0016
-125000 -124000 -123000 -122000 -121000
P(V)
V (kJ/mol)
300K 600K
T2
0
0.0004
0.0008
0.0012
0.0016
-150000 -149000 -148000 -147000 -146000
P(V)
V (kJ/mol)
300K 600K
T3
0
0.0004
0.0008
0.0012
0.0016
-88000 -87000 -86000 -85000
P(V)
V (kJ/mol)
300K 600K
Apo
Figure 4.2 Potential energy distribution of 8 replicas (in different colors) simulatedwith REST method for the platinated peptides C1-C3 and T1-T3 andthe apopeptide.
last snapshots of the REST trajectories of Apo, C1–C3 and T1–T3 underwent 25-ps-long QM/MM simulations with the same QM/MM procedure described in Sec.4.2.2.
4.2.5 Computational spectroscopy
NMR chemical shifts and EXAFS spectra were evaluated based on the QM/MM tra-jectories of Apo and the platinated peptides before and after the REST simulation.The CD spectra were calculated from the REST trajectories.
4.2.5.1 CD
The CD spectra were averaged values over 500 equidistant snapshots along the 200-ns-long REST trajectories. The web interface DichroCalc [206, 207], which imple-ments the theoretical approach described in Sec. 3.2.3, was used. The CD spectraturned out not to change with increasing REST simulation time (Fig. 4.3), suggest-ing that these calculated properties are well converged during the simulations.

564. Structural determinants of cisplatin and transplatin binding to Ctr1’s Met-rich
motif: a computational spectroscopy approach
-15
-10
-5
0
5
10
15
20
190 200 210 220 230 240 250
[] x
10-3
(deg
cm
2 dm
ol-1
)
(nm)
C150ns
100ns150ns200ns
-15
-10
-5
0
5
10
15
20
190 200 210 220 230 240 250
[] x
10-3
(deg
cm
2 dm
ol-1
)
(nm)
C250ns
100ns150ns200ns
-15
-10
-5
0
5
10
15
20
190 200 210 220 230 240 250
[] x
10-3
(deg
cm
2 dm
ol-1
)
(nm)
C350ns
100ns150ns200ns
-15
-10
-5
0
5
10
15
20
190 200 210 220 230 240 250[
] x 1
0-3 (d
eg c
m2 d
mol
-1)
(nm)
T150ns
100ns150ns200ns
-15
-10
-5
0
5
10
15
20
190 200 210 220 230 240 250
[] x
10-3
(deg
cm
2 dm
ol-1
)
(nm)
T250ns
100ns150ns200ns
-15
-10
-5
0
5
10
15
20
190 200 210 220 230 240 250
[] x
10-3
(deg
cm
2 dm
ol-1
)
(nm)
T350ns
100ns150ns200ns
Figure 4.3 Running averages of CD spectra calculated from the REST trajectoriesfor cisplatn-Mets7 (C1-C3) and transplatin-Mets7 (T1-T3).
4.2.5.2 NMR
1H, 13C, and 195Pt NMR shielding constants were calculated as averages over the50 equidistant QM/MM snapshots. For the first two nuclei (1H and 13C), we usedthe approach in Refs. [208] and [209] for the QM parts of C1–C3, T1–T3, andApo. Because the QM/MM boundary cuts through the CA-CB bonds, the CB andHB atoms are very close to the MM part. They are expected to be overpolarizedby the nearby MM charges. Hence, the calculation of shielding constants was notcarried out for them. The shielding constants were converted to the NMR chemicalshifts using the shielding constant of tetramethylsilane (TMS). See Appendix A.2for details on conversion of the shielding constant to the chemical shifts.
For 195Pt NMR shielding constants we used the ADF code [211, 212, 213] on the QMparts of C1–C3 and of T1–T3. The quadruple-quadruply polarized basis set (QZ4P)for the Pt and the triple-singly polarized basis set (TZP) for the other atoms were

4.3. EXAFS measurements 57
used. The calculations were carried out at the DFT-PBE level [214]. This choiceof basis sets and functional was shown to give reliable results for the calculation of195Pt chemical shifts [215]. Scalar relativistic effects were taken into account with thezero order regular approximation (ZORA) approach [216, 217]. The MM atoms wereincluded as point charges. The chemical shift was referenced to that of [PtCl6]2− inwater at room temperature, as obtained by an additional QM/MM simulation (seeAppendix A.3).
4.2.5.3 EXAFS
The EXAFS spectra were calculated at the Pt edge. The FEFF6L code [218, 219,220] was applied over 500 equidistant QM/MM snapshots (See Sec. 3.2.2 for thetheoretical approach). The FEFF calculation of EXAFS spectra are cheaper thanthat of NMR chemical shifts. Therefore, a larger number of QM/MM snapshots wereused for EXAFS calculations. For each snapshot, a cluster of atoms within 5 A fromthe platinum atom was extracted, taking into account the periodic boundary condi-tions, and input into the FEFF6L program to generate the EXAFS spectrum. Thek3-weighted EXAFS spectra were Fourier-transformed using the IFEFFIT program[221] to obtain the real-space representation.
4.3 EXAFS measurements
EXAFS measurements were done by Arnesano, F.; Scintilla, S. and Natile, G. [63].
The samples were prepared as follows. 3.0 mM aqueous solutions of Apo containing100 mM NaCl, were treated with one mol equivalent of either cisplatin or transplatinand the mixtures were kept for 24 h at 310 K before recording the XAS spectra. Theadduct formation between Mets7 and the selected platinum complex was checked byESI-MS as previously described [142]. The samples were loaded in Teflon cells withKapton windows, mounted in a two-stage Displex cryostat, and kept at 20 K duringthe data collection. XAS spectra were recorded at beamline D2 of the EuropeanMolecular Biology Laboratory (EMBL) outstation at Deutsches Elektronen Syn-chrotron (DESY, Hamburg, Germany). The DORIS storage ring operated at 4.5GeV with the positron beam current ranging from 150 to 95 mA. Ionization cham-bers in front and behind the sample were used to monitor the beam intensity. ASi(111) double-crystal monochromator scanned X-ray energies around the platinumL3-edge (11564 eV). The X-ray absorption spectra were recorded as platinum L3 flu-orescence spectra with a Canberra 13-element germanium solid-state detector. Forboth samples, 10 scans were collected and averaged to ensure comparable statistics.Data reduction, such as background removal, normalization, and extraction of thefine structure, was performed with KEMP [222]. The extracted platinum L3-edgeextended X-ray absorption fine structure (EXAFS) data were converted to photo-electron wave vector k-space and weighted by k3. The full, k3 weighted, EXAFSspectra (30-1000 eV above E0) and their Fourier transforms (FT) calculated overthe range 2.0-16.0 A−1 were compared with theoretical simulations.

584. Structural determinants of cisplatin and transplatin binding to Ctr1’s Met-rich
motif: a computational spectroscopy approach
Table 4.2 The averaged RMSD of the REST structures with respect to the corre-sponding last QM/MM structures.
4.4 Results and discussion
In the cisplatin-Mets7 adducts (C1–C3, Fig. 4.1), the three methionine sulfurs actas donor atom to the Pt(II) ion, while the remaining fourth position may be oc-cupied by chloride (C1), or water molecule (C2), or hydroxyl group (C3). In thetransplatin-Mets7 adducts (T1–T3), the two ammine ligands remain bound to Pt intrans arrangement. The other two ligands come from the two methionine sulfurs ofeither Met1,4 (T1), Met1,7 (T2) or Met4,7 (T3). We used QM/MM simulations andreplica exchange with solute tempering (REST) method to investigate the Pt(II) ioncoordination and the conformational properties of these platinated peptides, alongwith the conformational feature of the unbound peptide (Apo, Fig. 4.1). The directcomparison between the calculated and experimental spectroscopic data (EXAFSfrom this work, along with NMR and CD from Ref. [142]) established the accuracyof our structural predictions.
4.4.1 Peptide conformation
During the QM/MM simulations, the peptides’ conformations do not change sig-nificantly (RMSD between the first and the last snapshot < 0.6 A). In addition,the structures obtained from REST simulations are not too dissimilar to those fromQM/MM simulations (Fig. 4.1): The averaged RMSD of REST structures withrespect to the last QM/MM snapshots ranges from 1.1 to 2.2 A (Tab. 4.2). TheC1–C3 models are less flexible than the T1–T3 ones, as indicated by an analysis ofthe RMSF values. These are less than 1 A for the first and between 1.1 and 1.5 Afor the latter (Tab. 4.3).
The content of the secondary structure (ss) during the REST simulations is givenin Tab. 4.4. In the case of cisplatin-Mets7 adducts, C2 and C3 contain more β-turn(>47%) than coil (<38%). In contrast, C1 contains more coil (50%) than β-turn(30%), and a small content of α-helix (8%). In the case of transplatin-Mets7, T1contains mostly coil (59%) and only 26% of β-turn. Instead, both T2 and T3 havemore β-turn than coil. Bends are found in all cases with rather small content (<16%). In the models with large β-turn contents, the latter is more likely to be foundbetween the platinated methionines. The large content of turn appears to correlatewith the emerging β-turn-type band in the calculated CD spectrum (Fig. 4.4).
The calculated CD spectrum of C3 is in good agreement with the experimental one(Fig. 4.4). It has a positive peak at 200 nm, which features the β-turn conformation[223]. The CD spectrum of C2 model has a similar shape but its intensity is slightlylarger than that of the experimental spectrum. In contrast, in the spectrum of C1,the positive peak is shifted towards a lower wavelength ( 190 nm) compared to the

4.4. Results and discussion 59
Table 4.3 The root mean square fluctuations (RMSF), which is defined as thestandard deviation of the backbone RMSD. The smaller the value ofRMSF, the more rigid the conformation, and vice versa.
Table 4.4 DSSP secondary structure assignment for the ensembles of conforma-tions generated by REST simulations.
experimental peak. In addition, it features a weak negative band at 210 nm. Hence,C2 and C3 reproduce better the β-turn feature of the experimental CD spectrumthan C1. Since the only difference between C2 and C3 is the state of deprotonationof the coordinated solvent molecule (Fig. 4.1), an equilibrium between the twospecies may be present. The calculated CD spectrum of T1 reproduces fairly wellthe experimental one (Fig. 4.4). Those of T2 and T3 have a very large positiveband at about 200 nm, which features their β-turn conformation. This contrastswith the experimental observation that the binding of transplatin to Mets7 onlyslightly modifies the random coil structure of the free peptide [142]. This mightimply that only T1 gives an important contribution to the total CD spectrum of thetransplatin-Mets7 adduct, while T2 and T3 are almost irrelevant.
The calculated CD spectrum of Apo has a positive band at 195 nm and a negativeband at ∼210nm, which suggest some content of beta sheet structure. However,the experimental spectrum is characteristic of a random coil conformation [142].The reason behind the discrepancy between experiment and theory might be dueto sampling issues and to limitation of the force field. In particular, simulationsbased on the AMBER force field[173, 190], which has been used here, might biasrandom coiled structures towards the formation of secondary structure elements[226, 227, 228, 229]. In this respect, we stress here that the main focus of the paperis to reproduce the structural determinants of the platinated peptides, for which ourcomputational procedure appears to be relatively accurate.
4.4.2 Platinum coordination
In the QM/MM simulations, the Pt geometry deviates only slightly from the idealsquare-planar geometry, e.g. the difference from a square angle is less than 10%(Tab. 4.5). The Pt-S bond lengths range from 2.3 to 2.4 A (Tab. 4.5). These

604. Structural determinants of cisplatin and transplatin binding to Ctr1’s Met-rich
motif: a computational spectroscopy approach
-5
0
5
10
190 200 210 220 230 240 250
[] x
10-3
(deg
cm
2 dm
ol-1
)
(nm)
CisPt-Mets7, experimentC1, calculationC2, calculationC3, calculation
-5
0
5
10
190 200 210 220 230 240 250
[] x
10-3
(deg
cm
2 dm
ol-1
)
(nm)
TransPt-Mets7, experimentT1, calculationT2, calculationT3, calculation
(a) (b)
Figure 4.4 Calculated and experimentally measured [142] CD spectra of cisplatin-Mets7 (a) and transplatin-Mets7 (b) adducts.
values are very similar to those of corresponding model compounds ([Pt(SH2)3Cl]+,[Pt(SH2)3H2O]2+, [Pt(SH2)3OH]+ and trans-[Pt(SH2)2(NH3)2]2+) optimized in thegas phase (Tab. A.1 in Appendix). Oxygen atoms from water molecules and/or thepeptide terminus occupy the axial positions of the platinum complex, at a distancefrom the metal ranging from 2.6 to 2.8 A (Fig. 4.5). In the REST simulations,the bond lengths and angles are very similar to those of QM/MM simulations (Tab.4.5).
0
1
2
3
4
0 2 4 6 8 10
g Pt
O(r)
r (angstrom)
C1C2C3
0
1
2
3
4
0 1 2 3 4 5 6 7 8 9 10
g Pt-O
(r)
r (angstrom)
T1T2T3
Figure 4.5 Pt-O radial pair distribution functions calculated from the QM/MMtrajectories. Left: cisplatin-Mets7, right: transplatin-Mets7.
From the QM/MM calculations, local spectral properties can also be obtained. De-spite the short time scale, the QM/MM calculations can provide rather accuratespectroscopic properties of the Pt site. This is because the overall conformations ofthe peptides, and in particular of the Pt site, in the QM/MM simulations are nottoo dissimilar to those obtained by the subsequent sampling-enhanced REST simu-lations. Furthermore, the QM region is relatively well sampled within the QM/MMtime scale (see Sec. Appendix A.4). Here, we present EXAFS and NMR resultsfrom QM/MM simulations. The results of NMR obtained from QM/MM simula-tions after the REST simulations are reported here, whereas these berfore the RESTsimulations are reported in the Appendix.

4.4. Results and discussion 61
Table 4.5 Structural parameters calculated from QM/MM and REST simulationsfor cisplatin-Mets7 (C1-C3) and transplatin-Mets7 (T1-T3) adducts.Standard deviations are shown in parentheses. Bond lengths are inangstrom and angles in degree.

624. Structural determinants of cisplatin and transplatin binding to Ctr1’s Met-rich
motif: a computational spectroscopy approach
4.4.2.1 EXAFS spectra
The calculated k3-weighted EXAFS spectra at the Pt edge of C1–C3 and T1–T3reproduce well the experimental data (Fig 4.6 a-b). Also the corresponding Fouriertransforms (FT’s) of the calculated EXAFS spectra are in fair agreement with thoseof the experiments (Fig. 4.6 c-d).
6
4
2
0
2
4
6
8
10
12
0 2 4 6 8 10 12 14 16
(k)k
3
k(Å 1)
ExperimentC1C2C3
6
4
2
0
2
4
6
8
10
12
0 2 4 6 8 10 12 14 16
(k)k
3
k(Å 1)
ExperimentT1T2T3
(a) (b)
0
2
4
6
8
10
12
14
16
0 1 2 3 4 5
FT[
(k)k
3 ]
R (Å)
ExperimentC1C2C3
0
2
4
6
8
10
0 1 2 3 4 5
FT[
(k)k
3 ]
R (Å)
ExperimentT1T2T3
(c) (d)
Figure 4.6 Calculated and experimental EXAFS spectra at the Pt edge ofcisplatin-Mets7 (a) and transplatin-Mets7 (b) adducts. The experi-mental spectrum has been measured in this work. Fourier Transformsof the spectra in (a) and (b) are given in (c) and (d), respectively. Theyare plotted as a function of the scattering path length of the photoelec-tron R. Note that R does not correspond to a real interatomic distancesince the peak positions are shifted inward, with respect to the bonddistances; due to the phase shifts of the photoelectron (i.e. increase inits kinetic energy caused by the electronic potentials of both the scat-tering and the absorbing atoms) [225]. The shift, therefore, dependson both the absorbing and scattering atom types, and in our cases isapproximately 0.4 A (Tab. 4.5.
The FEFF approach of EXAFS calculation is based on the multiple-scattering the-ory, in which the total EXAFS are the sum over all possible scattering paths of thephotoelectron [220]. It is, therefore, possible to separate contributions due to eachtype of ligand’s atoms and to assign peaks of EXFAS to the corresponding atoms.In Fig. 4.7, EXAFS is calculated separately for each type of donor atoms in orderto distinguish between peaks due to different atoms.
For the cisplatin-Mets7 adducts (Fig. 4.6 c) the three FT’s feature a large peak,mainly caused by the back-scattering from the three Pt-bound sulfur atoms and achloride (C1) or a water oxygen (C2); a small side peak on the left which appears

4.4. Results and discussion 63
clearly only in C3 is due to the hydroxyl oxygen (Fig. 4.6 c). Oxygen atoms atthe axial position are found to give small contribution to the EXAFS signals ofall models. The main contributions from each type of ligand’s atoms to the totalEXAFS spectra are shown in (Fig. 4.7). The peak heights of C2 and C3 are lowerthan the experimental one. On the contrary, the peak height of C1 is greater. Wenote that the EXAFS spectra were taken at high chloride concentration (100 mM,see Methods), while the CD spectra were taken at low chloride concentration [142].Therefore model C1, which did not appear to give significant contribution to the CDspectrum, could give a significant contribution to the EXAFS spectrum.
For the transplatin-Mets7 adducts (Fig. 4.6 d), the FT’s feature two large distinctpeaks in the first coordination shell. The first peak is due to the ammine nitrogenatoms and the second peak is due to the Met sulfur atoms (Fig. 4.7). The largedifference in length between Pt-S and Pt-N bonds (Tab. 4.5) causes such a splitting.Again, oxygen atoms at the axial position are found to give small contribution tothe EXAFS signals of all models The magnitude of FT’s of T1–T3 is slightly smallerthan those obtained by experiment.
4.4.2.2 NMR chemical shifts
The calculated 13C and 1H NMR chemical shifts of the platinated and Apo peptidesreproduce the experimental values within the indicated standard deviations (Tab.4.6). In particular, as observed for the experimental data, the values of 1H and 13Cchemical shifts at the γ-CH2 and ε-CH3 residues of the platinated peptides (C1–C3and T1–T3) are larger than those of the Apo (Tab. 4.6). This is consistent with theexperimental observation that the binding of cisplatin and transplatin to the Mets7peptide causes a large downfield shift in the NMR signals for the γ-CH2 and εCH3
atoms of all three methionines [142]. The downfield shift of γ-CH2 and ε-CH3 atomsof all three methionines, also in the case of the transplatin-Mets7 adducts whereonly two methionines are coordinated to platinum, indicates that the three modelsare in fast exchange even if they can contribute differently to the overall spectrum.
The calculated 195Pt chemical shifts of C1 and C3 reproduce quite well the exper-imental data (Tab. 4.7). That of C2 deviates significantly from the experimentalvalue. This might imply that the C2 model is less relevant than C1 and C3. Asalready pointed out in the discussion of the EXAFS spectra, also the NMR spectrawere taken at a rather high chloride concentration (3.0 mM). Under these conditionsmodel C1 could gain relevance and contribute to the overall NMR spectra. The 195PtNMR chemical shifts of T1–T3 do not differ very much. The difference betweencisplatin-Mets7 and transplatin-Mets7 (∼1000 ppm) is fairly well reproduced by ourcalculations.
The use of the REST trajectories for calculating the CD spectra, whereas theQM/MM trajectories have been used to calculate the NMR and EXAFS spectra,deserve an additional comment. The CD spectrum is obviously sensitive to theglobal conformations of the peptides’ backbone. Therefore, we used for its calcula-tion a sampling-enhanced technique, such as REST [176], that samples extensivelythe conformational space. On the other hand, the NMR chemical shifts of the Ptligands and the EXAFS spectra at the Pt edge are expected to be sensitive to thelocal geometry (bond lengths and bond angles) of the plati-num coordination shell.

644. Structural determinants of cisplatin and transplatin binding to Ctr1’s Met-rich
motif: a computational spectroscopy approach
Table 4.6 13C (top) and 1H (bottom) NMR chemical shifts (in ppm) of the Pt-coordinated Met residues of cisplatin-Mets7 (C1–C3) and transplatin-Mets7 (T1–T3) adducts after REST simulations. The correspondingvalues before REST are reported in Tables. A.8–A.10 in Appendix.Standard deviations are shown in parentheses. See Fig. 4.1 for atomname conventions.
Table 4.7 195Pt NMR chemical shifts (in ppm) of the cisplatin-Mets7 (C1–C3) andtransplatin-Mets7 (T1–T3) adducts after REST simulations. The cor-responding values before REST are reported in Tab. A.11 in Appendix.Standard deviations are shown in parentheses.
4.5. Conclusions 65
QM/MM describes accurately the metal ion coordination polyhedra in metal-basedbiomolecules [170]. Therefore, we can expect accurate results based on the QM/MMtrajectories. However, in this case sampling is obviously much more limited thanin the case of the REST simulations. To address this issue, we compare the resultsfrom two sets of QM/MM calculations, before (Tables A.8–A.11, in Appendix) andafter (Tables 4.6–4.7) the REST simulations. It turns out that the results are essen-tially the same, in spite of the fact that the conformations of the peptide frame atthe end of the REST trajectories are rather different from those at the beginning.Based on these findings, we suggest that the EXAFS and NMR shifts do not dependsignificantly on the peptides’ global conformations but rather they depend on thelocal environment. This feature has been found also in several other bioinorganicsystems [230, 231, 232].
4.5 Conclusions
The cellular uptake of cisplatin is mediated by the high-affinity copper transporterCtr1 [30, 178]. The 8-residue long peptide (Mets7) is able to mimic the extracel-lular Met-rich N-terminal motifs of yeast Ctr1 [29]. The reaction of cisplatin andtransplatin with Mets7 was characterized experimentally by Arnesano F. et al. [29].Here, the structural and spectroscopic properties of cisplatin and transplatin adductswith Mets7 (models C1–C3 and T1–T3, respectively, see Fig. 4.1) have been investi-gated, for the first time, by hybrid Car-Parrinello QM/MM simulations. Informationabout the overall conformation of the peptide could be deduced from CD spectra.To this end, 200 ns-long REST simulations were carried out for the adduct models.The simulations were based on the force field parameters obtained by force match-ing procedure [174] for the platinated moieties. The configurationally averaged CDspectra were calculated for each of the models.
It turns out that the CD spectra of different simulated species show rather differ-ent patterns. As for the CD spectrum of the cisplatin-Met7 adduct, we notice thatthe band wavelengths of the spectra of C2 and C3 models, characteristic of a β-turn structure, is in a good accord with the experimental one. The spectrum of C3matches the intensity of the experimental one better than that of C2. In contrast,the C1 model shows much worse correspondence, particularly in terms of band wave-lengths. We conclude that (i) the spectrum of the C3 model, in which the ligands ofthe Pt(II) ion are three Met residues and a hydroxyl group, gives the most importantcontribution to the total CD. In addition (ii), in the experimental conditions of Ref.[29], the coordinated water molecule is deprotonated so as to reduce the net positivecharge of the complex. In the case of the transplatin-Mets7 CD spectrum, the bandintensities and wavelengths of the T1 model show good agreement with the experi-mental ones. Those of the T2 and T3 models are instead significantly different fromthe experimental ones and show a strong signal characteristic of a β-turn structure.We conclude that the T1 model (coordination to platinum of Met1 and Met4, Fig.4.1) is likely to give a much greater contribution to the total CD than those of theother two models.
Concerning the Pt coordination, since experimental data for the bond lengths andangles are not available, the consistency between the Pt-coordination geometry of

664. Structural determinants of cisplatin and transplatin binding to Ctr1’s Met-rich
motif: a computational spectroscopy approach
the simulated models and the real ones has been checked by comparing the calculatedPt EXAFS spectra of C1–C3 and T1–T3 with the experimental ones reported herefor the first time. The calculated EXAFS spectra of the three models show goodagreement with the experimental spectra. Differently from the CD spectra, theEXAFS spectra were taken at considerably higher chloride concentration. Hence,model C1 (chloro species), which did not contribute appreciably to the CD spectra,can instead give a significant contribution to the EXAFS spectra. Calculations showthat, indeed, this is the case.
The calculated 1H and 13C NMR chemical shifts are in rather good agreement withthe experimental chemical shifts. The differences in the calculated 1H and 13C NMRchemical shifts between Apo and platinated peptides confirm that platinum bindingcauses a downfield shift of the NMR signals belonging to the Met residues thatare bound to platinum as observed experimentally. The calculations also confirm acontribution of models T2 and T3 to the overall spectra to account for the downfieldshift observed for γ-CH2 and ε-CH3 of all methionines of Mets7. The calculated195Pt chemical shifts also show that model C1 can give a relevant contribution tothe experimental spectrum taken at a rather high chloride concentration. In contrast,model C2, whose computed spectrum significantly deviates from the experimentalone, contributes much less.
The calculated 1H and 13C NMR chemical shifts are in rather good agreement withthe experimental chemical shifts. The differences in the calculated 1H and 13C NMRchemical shifts between Apo and platinated peptides confirm that platinum bindingcauses a downfield shift of the NMR signals belonging to the Met residues thatare bound to platinum as observed experimentally. The calculations also confirm acontribution of models T2 and T3 to the overall spectra to account for the downfieldshift observed for γ-CH2 and ε-CH3 of all methionines of Mets7. The calculated195Pt chemical shifts also show that model C1 can give a relevant contribution tothe experimental spectrum taken at a rather high chloride concentration. In contrast,model C2, whose computed spectrum significantly deviates from the experimentalone, contributes much less.
Different spectroscopies, combined with quantum chemical calculations, providevaluable complementary insights in bioinorganic systems [233]. Here, we have cal-culated a variety of spectroscopic data (CD, EXAFS, and NMR), which are readilycompared with experiments. The exhaustive comparison of the calculated spectro-scopic data with the experimental ones has been proved useful. It allows us to makestructural prediction of platinated Mets7 species in aqueous solution.

4.5. Conclusions 67
0
2
4
6
8
10
12
14
16
0 1 2 3 4 5
FT[
(k)k
3 ]
R (Å)
C1
total EXAFSSulfur
ChlorideAxial Oxygen
0
2
4
6
8
10
12
14
16
0 1 2 3 4 5
FT[
(k)k
3 ]
R (Å)
C2
total EXAFSSulfur
Bound waterAxial Oxygen
0
2
4
6
8
10
12
14
16
0 1 2 3 4 5
FT[
(k)k
3 ]
R (Å)
C3
total EXAFSSulfur
Bound OHAxial Oxygen
0
2
4
6
8
10
0 1 2 3 4 5
FT[
(k)k
3 ]
R (Å)
T1
total EXAFSSulfur
NitrogenAxial Oxygen
0
2
4
6
8
10
0 1 2 3 4 5
FT[
(k)k
3 ]
R (Å)
T2
total EXAFSSulfur
NitrogenAxial Oxygen
0
2
4
6
8
10
0 1 2 3 4 5
FT[
(k)k
3 ]
R (Å)
T3
total EXAFSSulfur
NitrogenAxial Oxygen
Figure 4.7 Contributions from different types of scattering atoms to the total EX-AFS spectra, calculated from the QM/MM trajectories.

684. Structural determinants of cisplatin and transplatin binding to Ctr1’s Met-rich
motif: a computational spectroscopy approach

5Binding of the platinated DNA toHMGB1 protein: preliminary results
5.1 Introduction
DNA is the primary target of cisplatin [1, 2, 4]. It binds preferentially to two adjacentguanine bases within a strand of DNA [1, 2, 4]. Cisplatin binding causes damages inDNA (cisplatin-DNA adducts) which, in turn, inhibit DNA replication [21, 22] andtranscription [24, 25]. The inhibition of these vitally important cellular processesleads to apoptotic death of tumor cells.
Cisplatin-DNA adducts are recognized by many DNA-binding proteins [1, 3]. Themost characterized among these proteins is the High Mobility Group Box 1 protein(HMGB1) [1, 24, 76, 78]. Interestingly, HMGB1 has been found to inhibit NucleotideExcision Repair (NER) of cisplatin-damaged DNA by binding to cisplatin-DNAadducts and shielding them from being repaired by NER proteins [72, 73, 74, 78](see Sec. 2.2.2 for more details).
X-ray studies of cisplatin-d(CCUCTCTG*G*ACCTTCC)-d(GGAGAGACCTGGAAGG)in complex with the HMGB1 domain A (G* is the platinated base) have shownthe molecular 3-D structure of the cisplatin-DNA-HMGB1 complex (Fig. 5.2) [76].HMGB1 consists of two DNA-binding domains (A and B), each containing threealpha helices forming an L-shape structure that facilitates DNA binding [77] (Fig.5.1). The concave surfaces of HMGB1 domain A form hydrogen bonds as well ashydrophobic and water-bridging contacts with the minor groove of cisplatin-DNAadduct. The binding affinity of HMGB1 to cisplatin-DNA adduct at is high Kd
1 =0.7 ± 0.1 nM [78].
1Kd is given by
Kd =[P][D][P ·D]
, (5.1)

70 5. Binding of the platinated DNA to HMGB1 protein: preliminary results
HMGB1
DNA
Pt
Figure 5.1 The X-ray structure of cisplatin-DNA-HMGB1. The DNA is shownwith bond representation, HMGB1 with Connolly surface representa-tion and cisplatin moiety in van der Waals balls. Hydrogen atomsmissing in the X-ray structure were added using the Leap program[185].
Molecular recognition of cisplatin-DNA adducts by HMGB1 protein is a key cellularevent in inducing the antitumor effect of cisplatin [1, 3]. Therefore, determining themolecular mechanism of HMGB1 binding to cisplatin-DNA adduct would be a nextfundamental step towards better understanding of the molecular basis of action aswell as resistance mechanism of cisplatin.
The free energy as a function of the collective variables (CVs) describing the associ-ation process of HMGB1 and the platinated DNA is a key physical quantity of thebinding process. Metadynamics method and its variants have emerged as a powerfultechnique to calculate such quantity [284, 285] (see Appendix A.5). It is based ona dimensional reduction and on a suitable history-dependent potential. First, it re-
where [P], [D] and [P·D] are concentrations of protein, DNA and protein-DNA complex, respec-tively. Since Kd is an equilibrium constant, it is related to the Gibbs free energy difference ∆G via
Kd ∝ exp[− ∆G
kBT
], (5.2)
where kB is the Boltzmann constant and T is the temperature.

5.2. Derivation of force field parameters for the platinated moiety 71
quires identifying a set of CVs, which can properly describe the activated process ofinterest. The dynamics in the space of CVs is biased by a time-dependent potential,defined as a sum of Gaussians centered along the trajectory followed by the CVs[284]. This potential in time fills minima in the free energy surface. At the end, sumof the Gaussians provides the negative value of the free energy [284]. Metadynamics,as a variety of other free energy methods including thermodynamic integration andumbrella sampling, forces the biomolecules to explore their conformational spacequite rapidly. This issue depends crucially on the choice of CVs, which must pro-vide a satisfactory description of the reaction coordinates of the process we wish toinvestigate. If an important CV is not included, then the simulation will suffer fromserious artifacts [284, 285]. This problem might be overcome by combining well-tempered metadynamics (a variant of metadynamics) with parallel tempering (PT)[286, 287, 288]. The strengths of both approaches are combined: Well-temperedmetadynamics ensures the convergence of the free energy profile to a correct value,whereas PT exploits temperature to accelerate the sampling of all degrees of freedomincluding the CVs, which are not explicitly included in the metadynamics simula-tion. Therefore, large hysteresis, which is very commonly encountered in standardmetadynamics when important CVs are neglected, can be avoided [287]. We planto use this combined scheme to explore the free energy landscape of the cisplatin-DNA-HMGB1 complex.
Here, we have performed a variety of calculations to derive force field parameters forthe platinated moiety of DNA. We have considered the functional form of AMBERforce field [173] in the parameterization procedure and we will use this for all thesubsequent calculations. The AMBER force field is one of the most widely used forcefield for simulations of nucleic acids [289, 290]. Our calculations include a hybridCar-Parrinello/molecular mechanics (QM/MM) simulation [167, 168, 169, 170, 171],force matching procedure [174, 175] and a 200-ns-long classical MD simulation.
In the next sections, we will present results from these calculations
5.2 Derivation of force field parameters for the plati-nated moiety
5.2.1 QM/MM simulation
The QM/MM simulation was based on the X-ray structure of cisplatin-d(CCUCTCT-G*G*ACCTTCC) -d(GGAGAGACCTGGAAGG) in complex wih HMGB1 domainA (PDB code 1CKT) (Fig. 5.2) [76]. The complex were immersed in a box of water,Na+ ions were added to neutralize the total charge (See Tab. 5.1 for details of thesimulation setup). The whole system underwent 5ns-long preliminary classical MDsimulation, in which the cisplatin moiety was kept fixed with SHAKE algorithm[235]. The Amber99SB-ILDN force field [173, 190, 191] was used for the protein andDNA. TIP3P model was used for waters [192] whereas Joung&Cheatham force field[194] was used for ions. The NAMD program [186] was used to carry out the MDsimulation. The last snapshot was selected for the subsequent QM/MM simulation.
The CPMD program [188] combined with the classical MD Gromos96 code [189],through the interface developed by Rothlisberger et al. [168, 169] was used for the

72 5. Binding of the platinated DNA to HMGB1 protein: preliminary results
Table 5.1 Selected features of the qmmm simulation box.
Table 5.2 Comparison of the selected structural features of QM/MM, classical MDmodels with those of the X-ray structure. See Fig. 5.5 for the atom typeconvention.
QM/MM simulation. The QM part includes two guanine bases G8 and G9, thePt2+ metal and two ammine (NH3) group. The MM part consist of the rest of thesimulation box (see Tab. 5.1 for more details). The QM/MM procedure is the sameas that of the platinated Mets7 in chapter 4.
Figure 5.3 shows the backbone RMSD of the QM/MM trajectory. There is no signif-icant structural change during the 20-ps-long QM/MM simulation (RMSD betweenthe first and the last snapshot ∼ 1.0 A). The structural parameters of DNA such ashelix bend, torsional angles were calculated by using the Web server Curves+ [292].Table 5.2 shows comparison of the selected structural features of Pt-coordination andDNA between QM/MM and X-ray structures. The results obtained from QM/MMsimulation do not differ significantly from the X-ray structure.
5.2.2 Force matching procedure
Next, the force matching technique of Refs. [174, 175] was applied to 200 conforma-tions selected from the QM/MM trajectory to obtain the AMBER-type [173] force

5.3. Force field based MD simulation 73
HMGB1
DNA platinated guanines
Figure 5.2 Complex of platinated DNA-HMGB1. The backbone conformationsof X-ray structure (red), the QM/MM structure (blue) and the classi-cal MD structure (green) are superimposed. Platinated guanines areshown in ball-and-stick.
field parameters for the plaitaned moiety. The procedure is essentially the same asthat used for the platinated Mets7 in chapter 4.
Partial charges are reported in Tab. 5.3. To minimize changes in original AM-BER bonded parameters, only bonded parameters involved cisplatin moiety wereparameterized. These parameters are reported in Tabs. 5.4–5.5.
5.3 Force field based MD simulation
The newly derived parameters together with the Amber99SB-ILDN force field [173,190, 191] and the Barcelona modification [291] has be used to carry out a 200ns-longclassical MD simulation for the cisplatin-DNA-HMGB1 complex. The backboneRMSD is reported in Fig. 5.6 and some structural features in Tab. 5.2. The classi-cal model reproduces well the Pt coordination geometry of the QM/MM simulation.Furthermore, during this 200ns-long classical MD simulation, the system is verystable (Fig. 5.6) and does not deviate significantly from the X-ray structure (theaveraged RMSD with respect to the X-ray structure is ∼ 3A). Most of the impor-tant contacts between the platinated DNA and HMGB1 in the X-ray structure arepreserved during the classical MD simulation (Fig. 5.7–5.8).

74 5. Binding of the platinated DNA to HMGB1 protein: preliminary results
0
0.2
0.4
0.6
0.8
1
1.2
1.4
0 5 10 15 20
RM
SD (Å
)
time (ps)
Figure 5.3 The backbone RMSD of QM/MM trajectory.
5.4 Summary
In summary, the AMBER-type force field parameters for the platinated site in thecisplatin-DNA-HMGB1 complex has been derived using the force matching proce-dure [174, 175] for the QM/MM trajectory. Then the system has been equilibratedfor 200ns with classical MD simulation based on the newly derived force field param-eters for the platinated moiety and the Amber99SB-ILDN force field [173, 190, 191]with the Barcelona modification [291] for the rest of the complex. This equilibratedstructure will be used for the subsequent metadynamics simulations.

5.4. Summary 75
Table 5.3 Partial charges (in fraction of electronic charge) derived from the forcematching procedure for the cisplatin-DNA-HMGB1 complex. See Fig.5.4 for the atom name convention.

76 5. Binding of the platinated DNA to HMGB1 protein: preliminary results
Table 5.4 The harmonic force constant Kr (kcal/mol A−2), Kθ (kcal/mol rad−2)of bond stretching and angle bending, respectively, derived from theforce matching procedure for the cisplatin-DNA-HMGB1 complex. req(A) and θeq (degree) are equilibrium bond lengths and bond angles,respectively. See Fig. 5.5 for the atom type convention.
Table 5.5 Force constant of dihedral angles (kcal/mol) obtained from the forcematching procedure. See Fig. 5.5 for the atom type convention.

5.4. Summary 77
Pt
C5’
H5’ O5’
OP
P
O3’
C3’ H3’
C4’ C5’
O4’
C2’ H2’
C1’ H1’
N9 C8 H8
N7 C5 C4
N3
C2 N1
H1
N2 H2
C6
O6
NF HF NE HE
G9
G8
Figure 5.4 Atom name convention used for parameterization of partial charges.
N6 N7
Pt
H7
H6
N5 N4
CK
H5
CB
C
CB
CK
H5
CB C
CB G9 G8
Figure 5.5 Atom type convention used for parameterization of bonded parameters.

78 5. Binding of the platinated DNA to HMGB1 protein: preliminary results
0
1
2
3
4
5
0 50 100 150 200
RM
SD (Å
)
time (ns)
Figure 5.6 The backbone RMSD of classical MD trajectory.
0
2
4
6
8
10
12
0 50 100 150 200
No.
H-b
onds
time (ns)
Figure 5.7 Number of hydrogen bonds between the platinated DNA and HMGB1

5.4. Summary 79
20 40 60 80 100
20
40
60
80
100
Res
idue
Inde
x
Residue Index
Mean smallest distance
0 Distance (nm) 1
20 40 60 80 100
20
40
60
80
100R
esid
ue In
dex
Residue Index
Mean smallest distance
0 Distance (nm) 1
(a) (b) protein-protein protein-protein
protein-DNA protein-DNA
Figure 5.8 The contact map, which is defined as matrix of the smallest distancesbetween pairs of residues, of the X-ray structure (a) and the classicalMD trajectory (b).

80 5. Binding of the platinated DNA to HMGB1 protein: preliminary results

6Summary and outlooks
Cisplatin is one of the most potent drugs against testicular, ovarian, cervical, headand neck, esophageal, and small-cell lung cancers [1, 2, 4, 8]. Its beneficial effectarises from its binding to DNA [1, 2, 3, 4, 9]. Unfortunately, cisplatin suffers fromseveral drawbacks, including drug resistance, which severely limits its efficacy, sinceonly a small fraction of the drug reaches the target DNA [87, 30]. In addition,cisplatin-DNA adducts can be removed by Nucleotide Excision Repair (NER) pro-teins [2, 28, 86, 98]. Understanding and eventually overcoming these severe problemsrequire a detailed knowledge of how cisplatin interacts with a variety of proteins inthe cell. Whilst experiments are providing a great amount of knowledge on the molec-ular basis of resistance, computational biophysical studies on cisplatin resistance arebasically lacking. This thesis has contributed to two aspects of cisplatin/proteininteractions, which are relevant to the toxicity and the limited uptake of the drug,using computational physics tools.
(i) We have studied the binding of cisplatin and its isomer transplatin to a modelpeptide (named Mets7), that mimics one of the metal binding motifs found atthe extracellular domain of Ctr1. Mets7 has been shown to be an excellentmodel for investigating interactions of platinum drugs with Ctr1 in vitro andin-cell conditions. In order to characterize the structural and spectroscopicproperties of the adducts of cisplatin/transplatin with Mets7, we have usedan arsenal of computational tools, based on hybrid Car-Parrinello/molecularmechanics (QM/MM) simulations, force matching technique, replica exchangeMD simulations and computational spectroscopy approaches. Our calculatedspectroscopic properties such as NMR, EXAFS and CD have been comparedwith the corresponding experimental data to validate our predictions. Thisallows us to elucidate the different reaction modes of cisplatin and transplatintowards Ctr1 and to propose the most relevant species. The molecular mod-els arising from our calculations can serve as the molecular basis for furtherattempts to understand mechanism of cisplatin uptake mediated by Ctr1.

82 6. Summary and outlooks
Other copper transport proteins such as the copper chaperone Atox1 and cop-per pumps ATP7A/ATP7B have been found to bind cisplatin in vitro and invivo. However, the structural information of these cisplatin-protein adducts ismostly lacking. Therefore, the computational strategies which have been em-ployed here for structural prediction cisplatin/transplatin-Mets7 adducts canbe extended to these systems. Recently, a project focusing on the adducts ofAtox1 and ATP7B with cisplatin, based on the same computational protocolfor Ctr1, has been approved by Deutsche Forschungsgemeinschaft (DFG).
(ii) We have carried out preliminary calculations of platinated DNA binding tothe HMGB1 protein. Resistance to cisplatin is also linked to the ability of theresistant cells to repair DNA damages induced by cisplatin via the NER repairpathway. Fortunately, HMGB1 protein may be able to prevent NER by bindingto the cisplatin-DNA adduct and shielding it from being repaired by NERenzymes. Understanding the binding mechanism of platinated DNA to HMGB1protein is, therefore, a fundamental step towards understanding molecular basisof cisplatin resistance mechanisms. Here we address this issue by investigatingstructural and energetic properties of cisplatin-DNA adduct binding to HMGB1protein using free energy calculations based on metadynamics. In this thesis,we have performed a QM/MM simulation and force matching procedure toparameterize the force field for the platinated moiety. Then the system hasbeen equilibrated in aqueous solution for 200ns. These preliminary calculationsare used to prepare the system for the more expensive free energy calculations.
From the preliminary results obtained in (ii) we plan to combine well-temperedmetadynamics with parallel tempering to calculate the free energy profile of thebinding of cisplatin-DNA adduct to HMGB1 protein. The combined schemeprovides an efficient way to explore very complex free energy landscapes andallows large free energy barrier to be easily overcome. Therefore, it allowsstudies of very complex processes such as molecular recognition, which requiresextensive sampling of the association/disassociation processes. However, thisapproach is very computationally demanding. Therefore, we have requestedcomputing resource from PRACE [293] and our proposal is under evaluation.

AAppendix
A.1 DFT-based geometry optimization of the modelcompounds
The model compounds are [Pt(SH2)3Cl]+, [Pt(SH2)3H2O]2+, [Pt(SH2)3OH]+ andtrans-[Pt(SH2)2(NH3)2]2+ (Fig. A.1) which were energy-minimized at the DFT levelusing the CPMD program [188]. Exchange and correlation functional were thoseof Becke [195] and of Lee, Yang and Parr [196] (BLYP), respectively. Kohn-Shamorbitals were expanded in plane waves up to 70 Ry. The core electrons were describedusing norm-conserving pseudopotentials of the Martins-Troullier type [197]. Isolatedsystem conditions have been applied [198]. GDIIS method [234] was used to optimizethe structures of the model compounds with a convergence criterion of 10−6 for thelargest component of the energy gradient. The results of structural parameters arereported in Tab. A.1.
A.2 Conversion of NMR chemical shifts
For 1H, the NMR chemical shift was calculated as:
δH(X) = σH(TMS)− σH(X), (A.1)
where σH(TMS) is the 1H shielding constant calculated for an isolated TMS moleculeusing the same DFT level [210]. Vibration and rotation can contribute significantlyto the calculated 13C NMR shielding constant of TMS [210]. It is, therefore, im-portant to use the shielding constant of a simpler molecule (such as CH4 or C2H6)as a computational reference. In this case, the chemical shielding constants werereferenced indirectly to TMS via the calculated 13C shielding constant and the ex-perimental chemical shift of C2H6 [210]. Namely, this is achieved via the identity:
δC(X) = σC(TMS)− σC(X) = δCexp (C2H6) +[σC(C2H6)− σC(X)
]calc
. (A.2)

84 A. Appendix
The value for δCexp(C2H6) was taken from ref. [238]. Due to the use of pseudopoten-tials to describe the interactions between valence and core electrons, the calculated13C chemical shielding constants do not account for the effect of the core electrons[239]. Such a constant is effectively canceled out by the equation A.2.
A.3 QM/MM simulations and 195Pt NMR chemicalshielding calculation of the reference compound[PtCl6]2−
The molecule [PtCl6]2− was built as a new AMBER residue using Antechamberpackage [240]. The Gaussian 09 program [241] was used to optimize the structureof [PtCl6]2− and to calculate the RESP charges [242]. The system was inserted ina box of 1000 water molecules. 2 Na+ ions were added to neutralize the system.The 5 ns-long classical MD simulation was performed with the same setup as that ofthe preliminary simulations of the platinated peptides (see Sec. 4.2.1). During theMD simulation, the structure of [PtCl6]2− was kept fixed. Then 10ps-long QM/MMsimulation was carried out based on the last MD snapshot. QM part is the moleculeand the MM part is the solvent and counterions. The QM/MM simulation procedurewas the same as that of the platinated peptides (see Sec. 4.2.2). 50 equidistant snap-shots were extracted from the QM/MM simulation for the 195Pt chemical shieldingcalculation. The 195Pt chemical shielding calculation procedure was the same as thatfor the platinated peptides (See Sec. 4.2.5.2).
A.4 Sampling of the QM region by QM/MM simula-tions
As shown in (Fig. A.3), the RMSD of the QM parts show that the local geometryaround the platinum ion is stable during the QM/MM simulations. The RMSDof the T1 model shows a small increase near the end (at ∼20 ps) of the 25 ps-long trajectory (Fig. A.3). We compared the structures at the beginning of thesimulation, after few ps and at the end of the simulation. The increase in RMSD isbasically due to the change in the orientation of the two ammine groups. Indeed, thetwo ammine groups rotate around the S(Met1)-S(Met4) axis by approximately 15◦.The rest of the T1 model essentially fluctuates around an average position. Thismovement does not affect the calculated values of NMR shifts reported in Tab. A.9and A.11.
The sampling of the QM region was further checked by performing the principalcomponent analysis and calculating the cosine contents of the first few principalcomponents [224]. The cosine contents for all six systems are small and do not showany sign of poor sampling (Tab. A.7). It should be noted that the cosine contentused here is a good indicator for bad sampling. If the cosine content has a largevalue (close to 1), then the sampling is surely not sufficient. However, the reverseis not necessarily true. A small value of the cosine content is a necessary but notsufficient condition for a good sampling.

A.5. Metadynamics method 85
A.5 Metadynamics method
The free energy as a function of d collective variables (Cvs)
S({
~RI
})={S1
({~RI
}), . . . , Sd
({~RI
})}(A.3)
is given by [284, 285]
F (S) = −kBT ln
∫d~Rd~P exp
−H(~R, ~P
)kBT
δ(S − S
(~R)). (A.4)
The CVs should be chosen so as to distinguish between the initial and final state,describe all the relevant intermediates and include the slow modes, which cannotbe satisfactorily sampled in the time scale of a standard MD simulation. Thereare several methods for evaluating F (S). Among these, metadynamics adds anexternal history-dependent bias potential function of the CVs S and time t to theHamiltonian:
HMetaD = H(~R, ~P
)+ V (S, t) . (A.5)
V (S, t) is written as a sum of Gaussians of widths σi(i = 1, . . . , d) and height ω
deposited along the system trajectory in the S({
~RI
})space to discourage the
system from revisiting configurations that have already been sampled. V (S, t) maybe applied continuously during a MD simulation on the coordinates of the system:
V (S, t) = ω
t∫0
dt′ exp
−1
2
d∑i=1
Si({~RI}
)− Si
({~RI(t
′)})
σi
2. (A.6)
Hence, metadynamics pushes the system away from local free energy minima, al-lowing it to explore reaction pathways since the system tends to escape the minimapassing through the lowest free-energy saddle point.
Eventually, V (S, t) provides the underlying free energy:
F (S) = −V (S, t→∞) + C, (A.7)
where C is an irrelevant additive constant. Hence, metadynamics does not requirea priori knowledge of the landscape. However, −V (S, t) does not converge moduloa constant to the free energy, but oscillates around it. Hence, it is not trivial todecide when to stop a simulation. A solution to this problem has been provided bythe well-tempered metadynamics [286]. Here the bias deposition rate decreases oversimulation time, thus the dynamics becomes closer and closer to thermodynamicequilibrium as the simulation proceeds. The bias potential is given by
V (S, t) = kB∆T ln
(1 +
W
τ
N(S, t)
kB∆T
), (A.8)
where N(S, t) is the histogram of the S variables collected during the simulation,∆T and W are two input parameters with the dimension of a temperature and an

86 A. Appendix
energy, respectively, and τ is he time interval between two consecutive Gaussiandepositions. Here, the bias potential converges in a single run. The probabilitydistribution of the CVs can be shown to be proportional to:
P (S, t→∞) ∝ exp
[− F (S)
kB (T + ∆T )
]. (A.9)
For ∆T → 0 and ∆T → ∞ we have standard MD and standard metadynamics,respectively. The free energy in well-tempered metadynamics can be shown to con-verge to:
F (S) = −T + ∆T
∆TV (S, t→∞) + C. (A.10)
To decrease the effect of neglecting slow degrees of freedom in the choice of the CVs,one can use a combination of metadynamics with parallel tempering (PT). In thiscombined scheme, M copies (replicas) of the same system undergo metadynamics atdifferent temperatures T1 < T2 < . . . < TM . The exchange of configurations betweentwo adjacent replicas (at Ti and Ti+1) is attempted with the probability
p (i→ i+ 1) = min {1,∆i,i+1} ; i = 2, . . . ,M, (A.11)
where
∆i,i+1 = exp
[(1
kBTi− 1
kBTi+1
)(U
({~RI
}i)− U
({~RI
}i+1))
+
V i
(S
({~RI
}i))− V i
(S
({~RI
}i+1))
kBTi
+
V i+1
(S
({~RI
}i))− V i+1
(S
({~RI
}i+1))
kBTi+1
(A.12)

A.6. Supporting tables and figures 87
A.6 Supporting tables and figures
[Pt(SH2)3Cl]+! [Pt(SH2)3H2O]2+!
[Pt(SH2)3OH]+! trans[Pt(SH2)2(NH3)2]2+!
Figure A.1 DFT optimized model compounds

88 A. Appendix
Table A.1 Structural parameters of the model compounds optimized at the DFTlevel in gas phase. Scis and Strans are sulphur atoms cis and trans tothe fourth ligand (chloride, water molecule, or OH− group).
Table A.2 Charges (in fraction of electronic charge) derived from the force match-ing procedure for the cisplatin-Mets7 adduct models. See Fig. A.2 forthe atom name convention.

A.6. Supporting tables and figures 89
Table A.3 Charges (in fraction of electronic charge) derived from the force match-ing procedure for the transplatin-Mets7 adduct models. See Fig. A.2for the atom name convention.
Table A.4 The harmonic force constant Kr of bond stretching (kcal/mol A−2)and equilibrium bond lengths req (A) obtained from the force matchingprocedure. See Fig. A.2 for the atom type convention.

90 A. Appendix
Table A.5 The harmonic force constant of angle bending (kcal/mol rad−2) andequilibrium bond angles (degree) obtained from the force matching pro-cedure. See Fig. A.2 for the atom type convention.

A.6. Supporting tables and figures 91
Table A.6 Force constant of dihedral angles (kcal/mol) obtained from the forcematching procedure. See Fig. A.2 for the atom type convention.
Table A.7 The cosine content of the first four principal components of the QMregion in the QM/MM simulations.
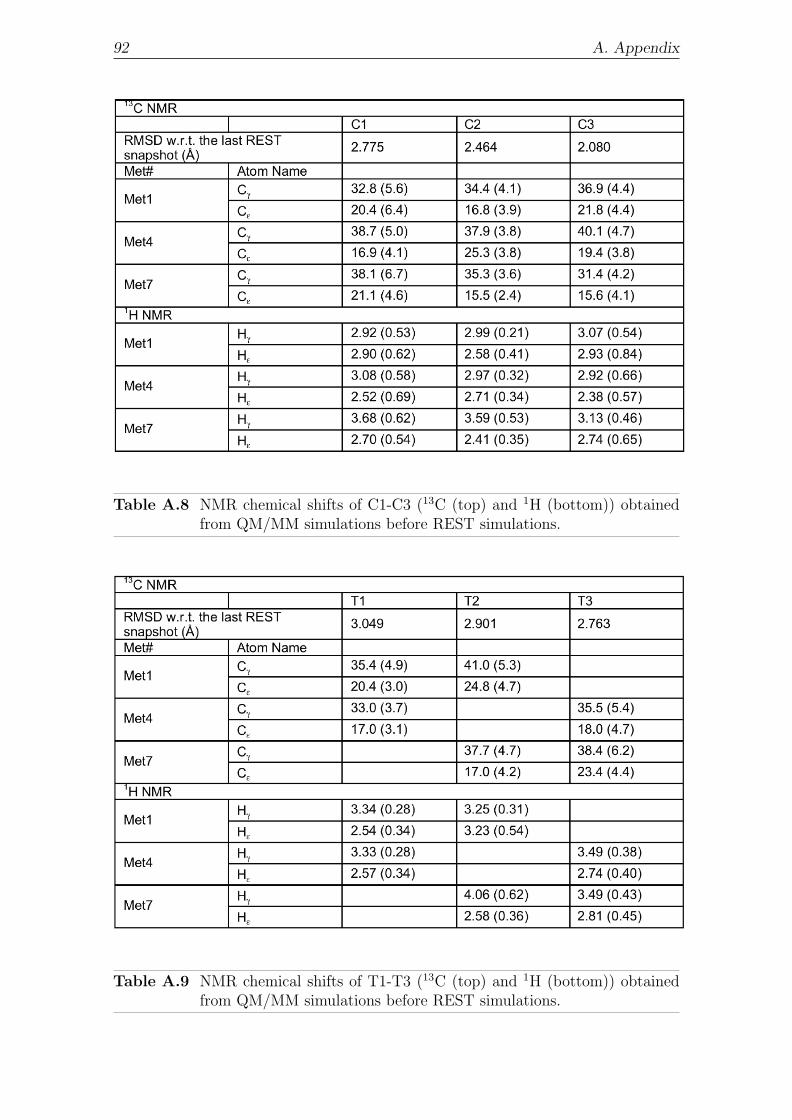
92 A. Appendix
Table A.8 NMR chemical shifts of C1-C3 (13C (top) and 1H (bottom)) obtainedfrom QM/MM simulations before REST simulations.
Table A.9 NMR chemical shifts of T1-T3 (13C (top) and 1H (bottom)) obtainedfrom QM/MM simulations before REST simulations.

A.6. Supporting tables and figures 93
Table A.10 NMR chemical shifts of Apo (13C (top) and 1H (bottom)) obtainedfrom QM/MM simulations for the representative snapshot of theREST trajectory. The RMSD of this representative snapshot relativeto the last REST one is 3.3 A.
Table A.11 195Pt NMR chemical shifts obtained from QM/MM simulations beforeREST simulations.

94 A. Appendix
Figure A.2 Atom name and atom type convention for the QM atoms. The atomnames are in bold and atom types in italics. Hydrogen atoms are notshown for the sake of clarity
0
0.2
0.4
0.6
0.8
1
0 5 10 15 20 25
RM
SD (Å
)
time (ps)
C1C2C3
0
0.2
0.4
0.6
0.8
1
0 5 10 15 20 25
RM
SD (Å
)
time (ps)
T1T2T3
Figure A.3 RMSD of the QM region during the Car-Parrinello QM/MM simula-tions. Left: cisplatin-Mets7, right: transplatin-Mets7.

Bibliography
[1] Jung, Y.; Lippard, S. J. Direct cellular responses to platinum-induced DNAdamage. Chem Rev. 2007, 107, 1387–1407.
[2] Kelland, L. The resurgence of platinum-based cancer chemotherapy. Nat. Rev.Cancer 2007, 7, 573–584.
[3] Wang, D.; Lippard, S. J. Cellular processing of platinum anticancer drugs. NatRev Drug Discov. 2005, 4, 307–320.
[4] Fuertes, M. A.; Alonso, C.; Perez, J. M. Biochemical modulation of Cisplatinmechanisms of action: enhancement of antitumor activity and circumventionof drug resistance. Chem. Rev. 2003, 103, 645–662.
[5] Rosenberg, B.; van Camp, L.; Krigas, T. INHIBITION OF CELL DIVI-SION IN ESCHERICHIA COLI BY ELECTROLYSIS PRODUCTS FROMA PLATINUM ELECTRODE. Nature, 1965, 205, 698–699.
[6] Rosenberg, B.; van Camp, L.; Trosko, J. E.; Mansour, V. H. Platinum com-pounds: a new class of potent antitumour agents. Nature 1969, 222, 385–386.
[7] Bosl, G. J.; Bajorin, D. F.; Sheinfeld, J.; Motzer, R. J.; Chaganti, R. S. K.;in Cancer: Principles & Practice of Oncology, ed. V. T. DeVita, V. T. Jr.;Hellman, S.; Rosenberg S. A., Lippincott Williams & Wilkins, Philadelphia,6th ed, 2001, pp. 1491–1518.
[8] Lippert, B. (Ed.) Cisplatin: Chemistry and Biochemistry of a Leading Anti-cancer Drug, Wiley-VCH, Verlag Helvetica Chimica Acta, Postfach, CH8042Zurich, Switzerland, 1999.
[9] Jamieson, E. R.; Lippard, S. J. Structure, Recognition, and Processing ofCisplatin-DNA Adducts. Chem. Rev. 1999, 99, 2467–2498
[10] Pascoe, J. M.; Roberts, J. J. Interactions between mammalian cell DNA andinorganic platinum compounds. II. Interstrand cross-linking of isolated andcellular DNA by platinum(IV) compounds. Biochem. Pharmacol. 1974, 23,1345–1357.
[11] Boulikas, T.; Vougiouka, M. Recent clinical trials using cisplatin, carboplatinand their combination chemotherapy drugs (review). Oncol. Rep. 2004, 11,559–595.
[12] Bosl, G. J.; Motzer, R. J. Testicular germ-cell cancer. N. Engl. J. Med. 1997,337, 242–253.

96 Bibliography
[13] Pil, P.; Lippard, S. J. Encyclopedia of Cancer, Vol. 1 Ed.: Bertino, J. R.,Academic Press: San Diego, CA, 1997.
[14] Wheate, N. J.; Walker, S.; Craig, G. E.; Oun, R. The status of platinumanticancer drugs in the clinic and in clinical trials. Dalton Trans. 2010, 39,8113–8127.
[15] Reslova, S. The induction of lysogenic strains of Escherichia coli by cis-dichloro-diammineplatinum (II). Chem. Biol. Interact. 1971, 4, 66–70.
[16] Brouwer, J.; Van De Putte, P.; Fichtinger-Schepman, A. M. J.; Reedijk, J.Base-pair substitution hotspots in GAG and GCG nucleotide sequences in Es-cherichia coli K-12 induced by cis-diamminedichloroplatinum (II). Proc. Natl.Acad. Sci. USA 1981, 78, 7010–7014.
[17] Popoff, S. C.; Beck, D. J.; Rupp, W. D. Repair of plasmid DNA damagedin vitro with cis- or trans-diamminedichloroplatinum(II) in Escherichia coli.Mutat. Res. 1987, 183, 129–137.
[18] Boffetta, P.; Fichtinger-Schepman, A. M. J.; Weiderpass, E.; van Dijk-Knijnenburg, H. C. M.; Stoter, G.; van Oosterom, A. T.; Keizer, H. J.; Fossa,S. D.; Kaldor, J.; Roy, P. Cisplatin-DNA adducts and protein-bound platinumin blood of testicular cancer patients. Anticancer Drugs 1998, 9, 125–129.
[19] Welters, M. J. P.; Fichtinger-Schepman, A. M. J.; Baan, R. A.; Jacobs-Bergmans, A. J.; Kegel, A.; van der Vijgh, W. J. F.; Braakhuis, B. J. M.Pharmacodynamics of cisplatin in human head and neck cancer: correlationbetween platinum content, DNA adduct levels and drug sensitivity in vitroand in vivo. Br. J. Cancer 1999, 79, 82–88.
[20] Cohen, G. L.; Ledner, J. A.; Bauer, W. R.; Ushay, H. M.; Caravana, C.; Lip-pard, S. J. Sequence dependent binding of cis-dichlorodiammineplatinum(II)to DNA. J. Am. Chem. Soc. 1980, 102, 2487-2488.
[21] Shimizu, M.; Rosenberg, B. A similar action to UV-irradiation and a preferen-tial inhibition of DNA synthesis in E. coli by antitumor platinum compounds.J. Antibiot. 1973, 26, 243–245.
[22] Harder, H. C.; Smith, R. G.; Leroy, A. F. Template primer inactivation by cis-and trans-dichlorodiammine platinum for human DNA polymerase alpha, beta,and Rauscher murine leukemia virus reverse transcriptase, as a mechanism ofcytotoxicity. Cancer Res. 1976, 36, 3821–3829.
[23] Davies, M. S.; Berners-Price, S. J.; Hambley, T. W. Rates of platination of-AG- and -GA- containing double-stranded oligonucleotides: effect of chlorideconcentration. J. Inorg. Biochem. 2000, 79, 167–172.
[24] Todd, R. C.; Lippard, S. J. Inhibition of transcription by platinum antitumorcompounds. Metallomics 2009, 1, 280–291.
[25] Mymryk, J. S.; Zaniewski, E.; Archer, T. K. Cisplatin inhibits chromatinremodeling, transcription factor binding, and transcription from the mousemammary tumor virus promoter in vivo. Proc. Natl. Acad. Sci. USA 1995,92, 2076–2080.

Bibliography 97
[26] Corda, Y.; Job, C.; Anin, M. F.; Leng, M.; Job, D. Spectrum of DNA–platinumadduct recognition by prokaryotic and eukaryotic DNA-dependent RNA poly-merases. Biochemistry 1993, 32, 8582–8588.
[27] Mello, J. A.; Lippard, S. J.; Essigmann, J. M. DNA adducts of cis-diamminedichloroplatinum(II) and its trans isomer inhibit RNA polymeraseII differentially in vivo. Biochemistry 1995, 34, 14783–14791.
[28] Siddik, Z. H. Cisplatin: mode of cytotoxic action and molecular basis of resis-tance. Oncogene 2003, 22, 7265–7279.
[29] Arnesano, F.; Natile, G. Mechanistic insight into the cellular uptake and pro-cessing of cisplatin 30 years after its approval by FDA. Coord. Chem. Rev.2009, 253, 2070–2081.
[30] Hall, M. D.; Okabe, M.; Shen, D. W.; Liang, X. J.; Gottesman, M. M.The role of cellular accumulation in determining sensitivity to platinum-basedchemotherapy. Annu. Rev. Pharmacol. Toxicol. 2008, 48, 495–535.
[31] Lippard, S. J.; Berg, J. M. Principles of Bioinorganic Chemistry, UniversityScience Books: Mill Valley, CA, 1994.
[32] Kasherman, Y.; Sturup, S.; Gibson, D. Is glutathione the major cellular targetof cisplatin? A study of the interactions of cisplatin with cancer cell extracts.Med. Chem. 2009, 52, 4319–4328.
[33] Blair, B. G.; Larson, C. A.; Safaei, R.; Howell, S. B. Copper transporter 2 reg-ulates the cellular accumulation and cytotoxicity of Cisplatin and Carboplatin.Clin. Cancer Res. 2009, 15, 4312–4321.
[34] Arnesano, F.; Banci, L.; Bertini, I.; Felli, I. C.; Losacco, M.; Natile, G. Probingthe interaction of cisplatin with the human copper chaperone Atox1 by solutionand in-cell NMR spectroscopy. J. Am. Chem. Soc. 2011, 133, 18361–18369.
[35] Caradonna, J. P.; Lippard, S. J.; Gait, M. J.; Singh, M. J. The antitumor drugcis-dichlorodiammineplatinum forms an intrastrand d(GpG) crosslink uponreaction with [d(ApGpGpCpCpT)]2. Am. Chem. Soc. 1982, 104, 5793–5795.
[36] Fichtinger-Schepman, A. M. J.; van der Veer, J. L.; den Hartog, J. H.J.; Lohman, P. H. M.; Reedijk, J. Adducts of the antitumor drug cis-diamminedichloroplatinum(II) with DNA: formation, identification, and quan-titation. Biochemistry 1985, 24, 707–713.
[37] Eastman A. Reevaluation of interaction of cis-dichloro(ethylenediamine)platinum(II) with DNA. Biochemistry 1986,25, 3912–3915.
[38] Terheggen, P. M. A. B.; Floot, B. G. J.; Scherer, E.; Begg, A. C.; Fichtinger-Schepman, A. M. J.; den Engelse, L. Immunocytochemical detection of in-teraction products of cis-diamminedichloroplatinum(II) and cis-diammine(1,1-cyclobutanedicarboxylato)platinum(II) with DNA in rodent tissue sections.Cancer Res. 1987, 47, 6719–6725.

98 Bibliography
[39] Lepre, C. A.; Strothkamp, K. G.; Lippard, S. J. Synthesis and 1HNMR spectroscopic characterization of trans-[Pt(NH3)2[d(ApGpGpCpCpT)-N7-A(1),N7-G(3)]]. Biochemistry 1987, 26, 5651–5657.
[40] Eastman, A,; Jennerwein M. M.; Nagel, D. L. Characterization of bifunctionaladducts produced in DNA by trans-diamminedichloroplatinum(II). Chem.Biol. Interact. 1988, 67, 71–80.
[41] Takahara, P. M.; Rosenzweig, A. C.; Frederick C. A.; Lippard, S.J. Characterization of bifunctional adducts produced in DNA by trans-diamminedichloroplatinum(II). Nature 1995, 377, 649–652.
[42] Takahara, P. M.; Frederick, C. A.; Lippard, S. J. Single d(GpG)/cis-diammineplatinum(II) adduct-induced inhibition of DNA polymerization. J.Am. Chem. Soc. 1996, 118, 12309–12321.
[43] Yang, D.; van Boom, S. S. G. E.; Reedijk, J.; van Boom, J. H.; Wang, A. H.-J.Structure and isomerization of an intrastrand cisplatin-cross-linked octamerDNA duplex by NMR analysis. Biochemistry 1995, 34, 12912–12920.
[44] Gelasco, A.; Lippard, S. J. NMR solution structure of a DNA dodecamerduplex containing a cis-diammineplatinum(II) d(GpG) intrastrand cross-link,the major adduct of the anticancer drug cisplatin. Biochemistry 1998, 37,9230–9239.
[45] Magistrato, A.; Ruggerone, P.; Spiegel, K.; Carloni, P.; Reedijk, J. Binding ofnovel azole-bridged dinuclear platinum(II) anticancer drugs to DNA: insightsfrom hybrid QM/MM molecular dynamics simulations. J. Phys. Chem. B.2006, 110, 3604–3613.
[46] Spiegel, K.; Magistrato, A.; Carloni, P.; Reedijk, J.; Klein, M. L. Azole-bridgeddiplatinum anticancer compounds. Modulating DNA flexibility to escape repairmechanism and avoid cross resistance. J. Phys. Chem. B. 2007, 111, 11873–11876.
[47] Spiegel, K.; Rothlisberger, U.; Carloni, P. Cisplatin Binding to DNA Oligomersfrom Hybrid Car-Parrinello/Molecular Dynamics Simulations. J. Phys. Chem.B 2004, 108, 2699–2707.
[48] Robertazzi, A.; Platts, J. A. A QM/MM study of cisplatin-DNA oligonu-cleotides: from simple models to realistic systems. Chemistry 2006, 12, 5747–5756.
[49] Burda, J. V.; Leszczynski, J. How Strong Can the Bend Be on a DNA Helixfrom Cisplatin? DFT and MP2 Quantum Chemical Calculations of Cisplatin-Bridged DNA Purine Bases. Inorg. Chem. 2003, 42, 7162–7172.
[50] Pavelka, M.; Burda, J. V. Pt-bridges in various single-strand and double-helix DNA sequences. DFT and MP2 study of the cisplatin coordination withguanine, adenine, and cytosine. J. Mol. Model. 2007, 13, 367–379.

Bibliography 99
[51] Robertazzi, A.; Platts, J. A. Hydrogen bonding and covalent effects in bindingof cisplatin to purine bases: ab initio and atoms in molecules studies. Inorg.Chem. 2005, 44, 267–274.
[52] Gkionis, K.; Platts, J. A. QM/MM studies of cisplatin complexes with DNAdimer and octamer. Comput. Theor. Chem. 2012, 993, 60–65.
[53] Spiegel, K.; Magistrato, A. Modeling anticancer drug-DNA interactions viamixed QM/MM molecular dynamics simulations. Org. Biomol. Chem. 2006,4, 2507–2517.
[54] Tai, H. C.; Brodbeck, R.; Kasparkova, J.; Farrer, N. J.; Brabec, V.; Sadler, P.J.; Deeth, R. J. Combined theoretical and computational study of interstrandDNA guanine-guanine cross-linking by trans-[Pt(pyridine)2] derived from thephotoactivated prodrug trans,trans,trans-[Pt(N3)2(OH)2(pyridine)2]. Inorg.Chem. 2012, 51, 6830-6841.
[55] Suchankova, T.; Kubı¿ek, K.; Ka¿parkova, J.; Brabec, V.; Kozelka, J.Platinum-DNA interstrand crosslinks: molecular determinants of bending andunwinding of the double helix. J. Inorg. Biochem. 2012, 108, 69–79.
[56] Bhattacharyya, D.; Ramachandran, S.; Sharma, S.; Pathmasiri, W.; King,C. L.; Baskerville-Abraham, I.;Boysen, G.; Swenberg, J. A.; Campbell, S. L.;Dokholyan, N. V.; Chaney, S. G. Flanking bases influence the nature of DNAdistortion by platinum 1,2-intrastrand (GG) cross-links. PLoS One. 2011, 6,e23582.
[57] Sharma, S.; Gong, P.; Temple, B.; Bhattacharyya, D.; Dokholyan, N. V.;Chaney, S. G. Molecular dynamic simulations of cisplatin- and oxaliplatin-d(GG) intrastand cross-links reveal differences in their conformational dynam-ics. J. Mol. Biol. 2007, 373, 1123–1140.
[58] Teletchea, S.; Skauge, T.; Sletten, E.; Kozelka, J. Cisplatin adducts on a GGGsequence within a DNA duplex studied by NMR spectroscopy and moleculardynamics simulations. Chemistry 2009, 15, 12320–12337.
[59] Scheeff, E. D.; Briggs, J. M.; Howell, S. B. Molecular modeling of the in-trastrand guanine-guanine DNA adducts produced by cisplatin and oxaliplatin.Mol. Pharmacol. 1999, 56, 633–643.
[60] Baik, M. H.; Friesner, R. A.; Lippard, S. J. Theoretical study on the stabilityof N-glycosyl bonds: why does N7-platination not promote depurination? J.Am. Chem. Soc. 2002, 124, 4495–4503.
[61] Matsui, T.; Shigeta, Y.; Hirao, K. Multiple proton-transfer reactions in DNAbase pairs by coordination of pt complex. J. Phys. Chem. B. 2007, 111, 1176–1181.
[62] Monjardet-Bas, V.; Elizondo-Riojas, M. A.; Chottard, J. C.; Kozelka, J. Acombined effect of molecular electrostatic potential and N7 accessibility ex-plains sequence-dependent binding of cis-[Pt(NH3)2(H2O)2]2+ to DNA du-plexes. Angew. Chem., Int. Ed. Engl. 2002, 41, 2998–3001.

100 Bibliography
[63] Nguyen, T. H.; Arnesano, F.; Scintilla, S.; Rossetti, G.; Ippoliti, E.; Carloni,P.; Natile, G. Structural Determinants of Cisplatin and Transplatin Bindingto the Met-Rich Motif of Ctr1: A Computational Spectroscopy Approach. J.Chem. Theory Comput. 2012, 8, 2912–2920.
[64] Van Garderen, C. J.; Van Houte, L. P. A. The solution structure of a DNAduplex containing the cis-Pt(NH3)2[d(-GTG-)-N7(G),N7(G)] adduct, as de-termined with high-field NMR and molecular mechanics/dynamics. Eur. J.Biochem. 1994, 225, 1169–1179.
[65] Teuben, J.-M.; Bauer, C.; Wang, A. H.-J.; Reedijk, J. Solution structure of aDNA duplex containing a cis-diammineplatinum(II) 1,3-d(GTG) intrastrandcross-link, a major adduct in cells treated with the anticancer drug carboplatin.Biochemistry 1999, 38, 12305–12312.
[66] Hughes, E. N.; Engelsberg, B. N.; Billings, P. C. Purification of nuclear pro-teins that bind to cisplatin-damaged DNA. Identity with high mobility groupproteins 1 and 2. J. Biol. Chem. 1992, 267, 13520–13527.
[67] Pil, P. M.; Lippard, S. J. Specific binding of chromosomal protein HMG1 toDNA damaged by the anticancer drug cisplatin. Science 1992, 256, 234–247.
[68] Baxevanis, A. D.; Landsman, D. The HMG-1 box protein family: classificationand functional relationships. Nucleic Acids Res. 1995, 23, 1604–1613.
[69] Thomas, J. O.; Travers, A. A. HMG1 and 2, and related ’architectural’ DNA-binding proteins. Trends Biochem. Sci. 2001, 26, 167–174.
[70] Huang, J.-C.; Zamble, D. B.; Reardon, J. T.; Lippard, S. J.; Sancar, A. HMG-domain proteins specifically inhibit the repair of the major DNA adduct of theanticancer drug cisplatin by human excision nuclease. Proc. Natl. Acad. Sci.USA 1994, 91, 10394–10398.
[71] Zamble, D. B.; Mu, D.; Reardon, J. T.; Sancar, A.; Lippard, S. J. Repairof cisplatin–DNA adducts by the mammalian excision nuclease. Biochemistry1996, 35, 10004–10013.
[72] Ugrinova, I.; Zlateva, S.; Pashev, I. G.; Pasheva, E. A. Native HMGB1 proteininhibits repair of cisplatin-damaged nucleosomes in vitro. Int. J. Biochem. CellBiol. 2009, 41, 1556–1562.
[73] Mitkova, E.; Ugrinova, I.; Pashev, I. G.; Pasheva, E. A. The inhibitory effectof HMGB-1 protein on the repair of cisplatin-damaged DNA is accomplishedthrough the acidic domain. Biochemistry 2005, 44, 5893–5898.
[74] He, Q.; Liang, C. H.; Lippard, S. J. Steroid hormones induce HMG1 overex-pression and sensitize breast cancer cells to cisplatin and carboplatin. Proc.Natl. Acad. Sci. USA 2000, 97, 5768–5772.
[75] Arioka, H.; Nishio, K.; Ishida, T.; Fukumoto, H.; Fukuoka, K.; Nomoto, T.;Kurokawa, H.; Yokote, H.; Abe, S.; Saijo, N. Enhancement of cisplatin sen-sitivity in high mobility group 2 cDNA-transfected human lung cancer cells.Jpn. J. Cancer Res. 1999, 90, 108–115.

Bibliography 101
[76] Ohndorf, U. M.; Rould, M. A.; He, Q.; Pabo, C. O.; Lippard, S. J. Basis forrecognition of cisplatin-modified DNA by high-mobility-group proteins. Nature1999, 399, 708–712.
[77] Hardman, C. H.; Broadhurst, R. W.; Raine, A. R. C.; Grasser, K. D.; Thomas,J. O.; Laue, E. D. Structure of the A-domain of HMG1 and its interactionwith DNA as studied by heteronuclear three- and four-dimensional NMR spec-troscopy. Biochemistry 1995, 34, 16596–16607.
[78] Park, S.; Lippard, S. J. Redox state-dependent interaction of HMGB1 andcisplatin-modified DNA. Biochemistry 2011, 50, 2567–2574.
[79] Perez, R. P. Cellular and molecular determinants of cisplatin resistance. Eur.J. Cancer 1998, 34, 1535–1542.
[80] Muggia, F. M.; Los, G. Platinum resistance: laboratory findings and clinicalimplications. Stem Cells 1993, 11, 182–193.
[81] Wernyj, R. P; Morin, P. J. Molecular mechanisms of platinum resistance: stillsearching for the Achilles’ heel. Drug Resist. Updates 2004, 7, 227–232.
[82] Kuo, M. T.; Chen, H. H.; Song, I. S.; Savaraj, N.; Ishikawa, T. The roles ofcopper transporters in cisplatin resistance. Cancer Metastasis Rev. 2007, 26,71–83.
[83] Gately, D. P.; Howell, S. B. Cellular accumulation of the anticancer agentcisplatin: a review. Br. J. Cancer 1993, 67, 1171–1176.
[84] Suzuki, T.; Nishio, K.; Tanabe, S. The MRP family and anticancer drugmetabolism. Curr. Drug Metab. 2001, 2, 367–377.
[85] Stewart, D. J. Mechanisms of resistance to cisplatin and carboplatin. Crit.Rev. Oncol. Hematol. 2007, 63, 12–31.
[86] Kartalou, M.; Essigmann, J. M. Mechanisms of resistance to cisplatin. MutatRes. 2001, 478, 23–43.
[87] Andrews, P. A.; Howell, S. B. Cellular pharmacology of cisplatin: perspectiveson mechanisms of acquired resistance. Cancer Cells 1990, 2, 35–43.
[88] Johnson S. W.; Shen D-W.; Pastan, I.; Gottesman, M. M.; Hamilton, T. C.Cross-resistance, cisplatin accumulation, and platinum-DNA adduct formationand removal in cisplatin-sensitive and -resistant human hepatoma cell lines.Exp. Cell Res. 1996, 226, 133–139.
[89] Koga, H.; Kotoh, S.; Nakashima, M.; Yokomizo, A.; Tanaka, M.; Naito, S.Accumulation of intracellular platinum is correlated with intrinsic cisplatinresistance in human bladder cancer cell lines. Int. J. Oncol. 2000, 16, 1003–1007.
[90] Shen D-W.; Goldenberg, S.; Pastan, I.; Gottesman, M. M. Decreased accu-mulation of [14C]carboplatin in human cisplatin-resistant cells results fromreduced energy-dependent uptake. J. Cell Physiol. 2000, 183, 108–116.

102 Bibliography
[91] Hector, S.; Bolanowska-Higdon, W.; Zdanowicz, J.; Hitt, S.; Pendyala, L. Invitro studies on the mechanisms of oxaliplatin resistance. Cancer Chemother.Pharmacol. 2001, 48, 398–406.
[92] Fuertes, M. A.; Castilla, J.; Alonso, C.; Pe rez, J. M. Novel concepts in the de-velopment of platinum antitumor drugs. Curr. Med. Chem. Anticancer Agents2002, 2, 539–552.
[93] Ishikawa, T. The ATP-dependent glutathione S-conjugate export pump.Trends Biochem. Sci. 1992, 17, 463–468.
[94] Mistry, P.; Kelland, L. R.; Abel, G.; Sidhar, S.; Harrap, K. R. The relationshipsbetween glutathione, glutathione-S-transferase and cytotoxicity of platinumdrugs and melphalan in eight human ovarian carcinoma cell lines. Br. J. Cancer1991, 64, 215–220.
[95] Lewis, A. D.; Hayes, J. D.; Wolf, C. R. Glutathione and glutathione-dependentenzymes in ovarian adenocarcinoma cell lines derived from a patient before andafter the onset of drug resistance: intrinsic differences and cell cycle effects.Carcinogenesis 1988, 9, 1283–1287.
[96] Kelley, S. L.; Basu, A.; Teicher, B. A.; Hacker, M. P.; Hamer, D. H.; Lazo,J. S. Overexpression of metallothionein confers resistance to anticancer drugs.Science 1988, 241, 1813–1815.
[97] Holford, J.; Beale, P. J.; Boxall, F. E.; Sharp, S. Y.; Kelland, L. R. Mechanismsof drug resistance to the platinum complex ZD0473 in ovarian cancer cell lines.Eur. J. Cancer 2000, 36, 1984–1990.
[98] Brabec, V.; Kasparkova, J. Modifications of DNA by platinum complexes.Relation to resistance of tumors to platinum antitumor drugs. Drug Resist.Updat. 2005, 8, 131–146.
[99] Johnson, S. W.; Swiggard, P. A.; Handel, L. M.; Brennan, J. M.; Godwin,A. K.; Ozols, R. F.; Hamilton, T. C. Relationship between platinum-DNAadduct formation and removal and cisplatin cytotoxicity in cisplatin-sensitiveand -resistant human ovarian cancer cells. Cancer Res. 1994, 54, 5911–5916.
[100] Gonzalez, V. M.; Fuertes, M. A.; Alonso, C.; Perez, J. M. Is cisplatin-inducedcell death always produced by apoptosis? Mol. Pharmacol. 2001, 59, 657–663.
[101] Reardon, J. T.; Vaisman, A.; Chaney, S. G.; Sancar, A. Efficient nu-cleotide excision repair of cisplatin, oxaliplatin, and Bis-aceto-ammine-dichloro-cyclohexylamine-platinum(IV) (JM216) platinum intrastrand DNAdiadducts. Cancer Res. 1999, 59, 3968–3971.
[102] Chaney, S. G.; Sancar, A. DNA repair: enzymatic mechanisms and relevanceto drug response. J. Natl. Cancer. Inst. 1996, 88, 1346–1360.
[103] Kelland, L. R.; Mistry, P.; Abel, G.; Friedlos, F.; Loh, S. Y.; Roberts, J.J.; Harrap, K. R. Establishment and characterization of an in vitro model ofacquired resistance to cisplatin in a human testicular nonseminomatous germcell line. Cancer Res. 1992, 52, 1710–1716.

Bibliography 103
[104] Zamble, D. B.; Mikata,Y.; Eng, C. H.; Sandman, K. E.; Lippard, S. J. Testis-specific HMG-domain protein alters the responses of cells to cisplatin. J. Inorg.Biochem. 2002, 91, 451–462.
[105] Andrews, P. A.; Velury, S.; Mann, S. C.; Howell, S. B. cis-Diamminedichloroplatinum(II) accumulation in sensitive and resistant humanovarian carcinoma cells. Cancer Res. 1988, 48, 68–73.
[106] Eichholtz-Wirth, H.; Hietel, B. The relationship between cisplatin sensitivityand drug uptake into mammalian cells in vitro. Br. J. Cancer 1986, 54, 239–243.
[107] Gale, G. R.; Morris, C. R.; Atkins, L. M.; Smith, A. B. Binding of an antitumorplatinum compound to cells as influenced by physical factors and pharmaco-logically active agents. Cancer Res. 1973, 33, 813–818.
[108] Hecquet, B.; Leroy, A.; Lefebvre, J. L.; Peyrat, J. P.; Adenis, L. Uptake ofplatinum compounds in human tumors. In vitro study. Bull. Cancer 1986, 73,535–541.
[109] Hromas, R. A.; North, J. A.; Burns, C. P. Decreased cisplatin uptake byresistant L1210 leukemia cells. Cancer Lett. 1987, 36, 197–201.
[110] Howell, S. B.; Safaei, R.; Larson, C. A.; Sailor, M. J. Copper transportersand the cellular pharmacology of the platinum-containing cancer drugs. MolPharmacol. 2010, 77, 887–894.
[111] Gupta, A.; Lutsenko, S. Human copper transporters: mechanism, role in hu-man diseases and therapeutic potential. Future Med Chem. 2009, 1, 1125–1142.
[112] Prohaska, J. R.; Gybina, A. A. Intracellular copper transport in mammals. J.Nutr. 2004, 134, 1003–1006.
[113] Prohaska, J. R. Role of copper transporters in copper homeostasis. Am. J.Clin. Nutr. 2008, 88, 826S–829S.
[114] Sharp, P. A. Ctr1 and its role in body copper homeostasis. Int. J. Biochem.Cell. Biol. 2003, 35, 288–291.
[115] Wessling-Resnick, M. Understanding copper uptake at the molecular level.Nutr. Rev. 2002, 60, 177–179.
[116] Lin, X.; Okuda, T.; Holzer, A.; Howell, S. B. The copper transporter CTR1regulates cisplatin uptake in Saccharomyces cerevisiae. Mol. Pharmacol. 2002,62, 1154–1159.
[117] Holzer, A. K.; Katano, K.; Klomp, L. W.; Howell, S. B. Cisplatin rapidlydown-regulates its own influx transporter hCTR1 in cultured human ovariancarcinoma cells. Clin. Cancer Res. 2004, 10, 6744–6749.
104 Bibliography
[118] Holzer, A. K.; Samimi, G.; Katano, K.; Naerdemann, W.; Lin, X.; Safaei, R.;Howell, S. B. The copper influx transporter human copper transport protein1 regulates the uptake of cisplatin in human ovarian carcinoma cells. Mol.Pharmacol. 2004, 66, 817–823.
[119] Holzer, A. K.; Manorek, G. H.; Howell, S. B. Contribution of the major copperinflux transporter CTR1 to the cellular accumulation of cisplatin, carboplatin,and oxaliplatin. Mol. Pharmacol. 2006, 70, 1390–1394.
[120] Holzer, A. K.; Varki, N. M.; Le, Q. T.; Gibson, M. A.; Naredi, P.; Howell, S. B.Expression of the human copper influx transporter 1 in normal and malignanthuman tissues. J. Histochem. Cytochem. 2006, 54, 1041–1049.
[121] Holzer, A. K.; Howell, S. B. The internalization and degradation of human cop-per transporter 1 following cisplatin exposure. Cancer Res. 2006, 66, 10944–10952.
[122] Larson, C. A.; Blair, B. G.; Safaei, R.; Howell, S. B. The role of the mammaliancopper transporter 1 in the cellular accumulation of platinum-based drugs.Mol. Pharmacol. 2009, 75, 324–330.
[123] Noordhuis, P.; Laan, A. C.; van de Born, K.; Losekoot, N.; Kathmann, I.;Peters, G. J. Oxaliplatin activity in selected and unselected human ovarianand colorectal cancer cell lines. Biochem. Pharmacol. 2008, 76, 53–61.
[124] Liu, J. J.; Jamieson, S. M.; Subramaniam, J. Ip V.; Jong, N. N.; Mercer, J.F.; McKeage, M. J. Neuronal expression of copper transporter 1 in rat dor-sal root ganglia: association with platinum neurotoxicity. Cancer Chemother.Pharmacol. 2009, 64, 847–856.
[125] Linz, R.; Lutsenko, S. Copper-transporting ATPases ATP7A and ATP7B:cousins, not twins. J. Bioenerg. Biomembr. 2007, 39, 403–407.
[126] Lutsenko, S.; Barnes, N. L.; Bartee, M. Y.; Dmitriev, O. Y. Function andregulation of human copper-transporting ATPases. Physiol. Rev. 2007, 87,1011–1046.
[127] Luk, E.; Jensen, L. T.; Culotta, V. C. The many highways for intracellulartrafficking of metals. J. Biol. Inorg. Chem. 2003, 8, 803–809.
[128] Safaei, R.; Holzer, A. K.; Katano, K.; Samimi, G.; Howell, S. B. The role ofcopper transporters in the development of resistance to Pt drugs. J. Inorg.Biochem. 2004, 98, 1607–1613.
[129] Katano, K.; Safaei, R.; Samimi, G.; Holzer, A.; Rochdi, M.; Howell, S. B. Thecopper export pump ATP7B modulates the cellular pharmacology of carbo-platin in ovarian carcinoma cells. Mol. Pharmacol. 2003, 64, 466–473.
[130] Katano, K.; Safaei, R.; Samimi, G.; Holzer, A.; Tomioka, M.; Goodman, M.;Howell, S. B. Confocal microscopic analysis of the interaction between cisplatinand the copper transporter ATP7B in human ovarian carcinoma cells. Clin.Cancer Res. 2004, 10, 4578–4588.

Bibliography 105
[131] Safaei, R.; Howell, S. B. Copper transporters regulate the cellular pharmacol-ogy and sensitivity to Pt drugs. Crit. Rev. Oncol. Hematol. 2005, 53, 13–23.
[132] Safaei, R. Role of copper transporters in the uptake and efflux of platinumcontaining drugs. Cancer Lett. 2006, 234, 34–39.
[133] Samimi, G.; Katano, K.; Holzer, A. K.; Safaei, R.; Howell, S. B. Modulation ofthe cellular pharmacology of cisplatin and its analogs by the copper exportersATP7A and ATP7B. Mol. Pharmacol. 2004, 66, 25–32.
[134] Safaei, R.; Katano, K.; Larson, B. J.; Samimi, G.; Holzer, A. K.; Naerdemann,W.; Tomioka, M.; Goodman, M.; Howell, S. B. Intracellular localization andtrafficking of fluorescein-labeled cisplatin in human ovarian carcinoma cells.Clin. Cancer Res. 2005, 11, 756–767.
[135] Klomp, L. W.; Lin, S. J.; Yuan, D. S.; Klausner, R. D.; Culotta, V. C.; Gitlin,J. D. Identification and functional expression of HAH1, a novel human geneinvolved in copper homeostasis. J. Biol. Chem. 1997, 272, 9221–9226.
[136] Hamza, I.; Schaefer, M.; Klomp, L. W.; Gitlin, J. D. Interaction of the cop-per chaperone HAH1 with the Wilson disease protein is essential for copperhomeostasis. Proc. Natl. Acad. Sci. USA 1999, 96, 13363–13368.
[137] Hamza, I.; Prohaska, J.; Gitlin, J. D. Essential role for Atox1 in the copper-mediated intracellular trafficking of the Menkes ATPase. Proc. Natl. Acad. Sci.USA 2003, 100, 1215–1220.
[138] Safaei, R.; Maktabi, M. H.; Blair, B. G.; Larson, C. A.; Howell, S. B. Effects ofthe loss of Atox1 on the cellular pharmacology of cisplatin. J. Inorg. Biochem.2009, 103, 333–341.
[139] Itoh, S.; Kim, H. W.; Nakagawa, O.; Ozumi, K.; Lessner, S. M.; Aoki,H.; Akram, K.; McKinney, R. D.; Ushio-Fukai, M.; Fukai, T. Novel role ofantioxidant-1 (Atox1) as a copper-dependent transcription factor involved incell proliferation. J. Biol. Chem. 2008, 283, 9157–9167.
[140] Muller, P. A.; Klomp, L. W. ATOX1: a novel copper-responsive transcriptionfactor in mammals? Int. J. Biochem. Cell Biol. 2009, 41, 1233–1236.
[141] Boal, A. K.; Rosenzweig, A.C. Crystal structures of cisplatin bound to a humancopper chaperone. J. Am. Chem. Soc. 2009, 131, 14196–14197.
[142] Arnesano, F.; Scintilla, S.; Natile, G. Interaction between platinum complexesand a methionine motif found in copper transport proteins. Angew. Chem. Int.Ed. Engl. 2007, 46, 9062–9064.
[143] Arnesano, F.; Natile, G. ”Platinum on the road”: Interactions of antitumoralcisplatin with proteins. Pure Appl. Chem. 2008, 80, 2715–2725.
[144] Jiang, J.; Nadas, I. A.; Kim, M. A.; Franz, K. J. A Mets motif peptide foundin copper transport proteins selectively binds Cu(I) with methionine-only co-ordination. Inorg. Chem. 2005, 44, 9787–9787.

106 Bibliography
[145] Nose, Y.; Rees, E. M.; Thiele, D. J. Structure of the Ctr1 coppertrans’PORE’ter reveals novel architecture. Trends Biochem. Sci. 2006, 31,604–607.
[146] Wu, Z.; Liu, Q.; Liang, X.; Yang, X.; Wang, N.; Wang, X.; Sun, H.; Lu,Y.; Guo, Z. J. Reactivity of platinum-based antitumor drugs towards a Met-and His-rich 20mer peptide corresponding to the N-terminal domain of humancopper transporter 1. Biol. Inorg. Chem. 2009, 14, 1313–1323.
[147] Crider, S. E.; Holbrook, R. J.; Franz, K. J. Coordination of platinum therapeu-tic agents to met-rich motifs of human copper transport protein1. Metallomics2010, 2, 74–83.
[148] Banci, L.; Bertini, I.; Cantini, F.; Rosenzweig, A. C.; Yatsunyk, L. A. Metalbinding domains 3 and 4 of the Wilson disease protein: solution structureand interaction with the copper(I) chaperone HAH1. Biochemistry 2008, 47,7423–7429.
[149] Achila, D.; Banci, L.; Bertini, I.; Bunce, J.; Ciofi-Baffoni, S.; Huffman, D. L.Structure of human Wilson protein domains 5 and 6 and their interplay withdomain 4 and the copper chaperone HAH1 in copper uptake. Proc. Natl. Acad.Sci. USA 2006, 103, 5729–5734.
[150] Wernimont, A. K.; Huffman, D. L.; Lamb, A. L.; OHalloran, T. V.; Rosen-zweig, A. C. Structural basis for copper transfer by the metallochaperone forthe Menkes/Wilson disease proteins. Nat. Struct. Biol. 2000, 7, 766–771.
[151] Anastassopoulou, I.; Banci, L.; Bertini, I.; Cantini, F.; Katsari, E.; Rosato, A.Solution structure of the apo and copper(I)-loaded human metallochaperoneHAH1. Biochemistry 2004, 43, 13046–13053.
[152] Dmitriev, O. Y. Mechanism of tumor resistance to cisplatin mediated by thecopper transporter ATP7B. Biochem Cell Biol. 2011, 89, 138–147.
[153] Dolgova, N. V.; Olson, D.; Lutsenko, S.; Dmitriev, O. Y. The soluble metal-binding domain of the copper transporter ATP7B binds and detoxifies cis-platin. Biochem J. 2009, 419, 51–56.
[154] Leonhardt, K.; Gebhardt, R.; Mossner, J.; Lutsenko, S.; Huster, D. Functionalinteractions of Cu-ATPase ATP7B with cisplatin and the role of ATP7B inthe resistance of cells to the drug. J. Biol. Chem. 2009, 284, 7793–7802.
[155] Lopes, J. F.; Rocha, W. R.; Dos Santos, H. F.; De Almeida, W. B. Theoreticalstudy of the potential energy surface for the interaction of cisplatin and theiraquated species with water. J. Chem. Phys. 2008, 128, 165103–165116.
[156] Sutter, K.; Truflandier, L. A.; Autschbach, J. NMR J-coupling constantsin cisplatin derivatives studied by molecular dynamics and relativistic DFT.ChemPhysChem 2011, 12, 1448–1455.
[157] Truflandier, L. A.; Sutter, K.; Autschbach, J. Solvent effects and dynamicaveraging of 195Pt NMR shielding in cisplatin derivatives. Inorg. Chem. 2011,50, 1723–1732.

Bibliography 107
[158] Lau, J. K.; Ensing, B. Hydrolysis of cisplatin–a first-principles metadynamicsstudy. Phys. Chem. Chem. Phys. 2010, 12, 10348–10355.
[159] Fu, C. F.; Tian, S. X. Molecular dynamics study of solvation differences be-tween cis- and transplatin molecules in water. J. Chem. Phys. 2010, 132,174507–174513.
[160] Springer, A.; Burgel, C.; Bohrsch, V.; Mitric, R.; Bonacic-Koutecky, V.;Linscheid, M. W. The gas-phase chemistry of cis-diammineplatinum(II) com-plexes: a joint experimental and theoretical study. ChemPhysChem 2006, 7,1779–1785.
[161] Dans, P. D.; Coitino, E. L. Density functional theory characterization anddescriptive analysis of cisplatin and related compounds. J. Chem. Inf. Model.2009, 49, 1407–1419.
[162] Zimmermann, T.; Chval, Z.; Burda, J. V. Cisplatin interaction with cysteineand methionine in aqueous solution: computational DFT/PCM study. J. Phys.Chem. B 2009, 113, 3139–3150.
[163] Zhang, Y.; Guo, Z.; You, X. Z. Hydrolysis theory for cisplatin and its analoguesbased on density functional studies. J. Am. Chem. Soc. 2001, 123, 9378–9387.
[164] Zimmermann, T.; Zeizinger, M.; Burda, J. V. Cisplatin interaction with cys-teine and methionine, a theoretical DFT study. J. Inorg. Biochem. 2005, 99,2184–2196.
[165] Carloni, P.; Sprik, M.; Andreoni, W. Key Steps of the cis-Platin-DNA Inter-action: Density Functional Theory-Based Molecular Dynamics Simulations. J.Phys. Chem. B 2000, 104, 823–835.
[166] Warshel, A.; Levitt, M. Theoretical studies of enzymic reactions: dielectric,electrostatic and steric stabilization of the carbonium ion in the reaction oflysozyme. J. Mol. Biol. 1976, 103, 227–249.
[167] Car, R.; Parrinello, M. Unified approach for molecular dynamics and density-functional theory. Phys. Rev. Lett. 1985, 55, 2471–2474.
[168] Laio, A.; VandeVondele, J.; Rothlisberger, U. D-RESP: Dynamically Gen-erated Electrostatic Potential Derived Charges from Quantum Mechanics/-Molecular Mechanics Simulations. J. Phys. Chem. B 2002, 106, 7300–7307.
[169] Laio, A.; VandeVondele, J.; Rothlisberger, U. A Hamiltonian electrostaticcoupling scheme for hybrid Car-Parrinello molecular dynamics simulations. J.Chem. Phys. 2002, 116, 6941–6947.
[170] Rothlisberger, U,; Carloni P. Simulations of enzymatic systems: Perspectivesfrom Car-Parrinello Molecular dynamics simulations; in Erikson L. A. Theoret-ical and computational chemistry, Politzer, P.; Maksic, Z. B., Eds.; Elservier:Amsterdam 2001, Vol. 9, 215–251.
[171] Dal Peraro, M.; Ruggerone, P.; Raugei, S.; Gervasio, F. L.; Carloni, P. In-vestigating biological systems using first principles Car-Parrinello moleculardynamics simulations. Curr. Opin. Struct. Biol. 2007, 17, 149–156.

108 Bibliography
[172] Senn, H. M.; Thiel, W. QM/MM methods for biomolecular systems. Angew.Chem., Int. Ed. Engl. 2009, 48, 1198–1229.
[173] Wang J.; Cieplak P.; Kollman P. A. Geometrical and electronic structure vari-ability of the sugar-phosphate backbone in nucleic acids. J. Comput. Chem.2000, 21, 1049–1074.
[174] Maurer, P.; Laio, A.; Hugosson, H. W.; Colombo, M. C.; Rothlisberger, U.Automated Parametrization of Biomolecular Force Fields from Quantum Me-chanics/Molecular Mechanics (QM/MM) Simulations through Force Matching.J. Chem. Theory Comput. 2007, 3, 628–639.
[175] Spiegel, K.; Magistrato, A.; Maurer, P.; Ruggerone, P.; Rothlisberger, U.;Carloni, P.; Reedijk, J.; Klein, M. L. Parameterization of azole-bridged dinu-clear platinum anticancer drugs via a QM/MM force matching procedure. J.Comput. Chem. 2008, 29, 38–49.
[176] Liu, P.; Kim, B.; Friesner, R. A.; Berne, B. J. Replica exchange with solutetempering: a method for sampling biological systems in explicit water. Proc.Natl. Acad. Sci. USA 2005, 102, 13749–13754.
[177] Chen, K. G.; Valencia, J. C.; Lai, B.; Zhang, G.; Paterson, J. K.; Rouzaud,F.; Berens, W.; Wincovitch, S. M.; Garfield, S. H.; Leapman, R. D.; Hearing,V. J.; Gottesman, M. M. Melanosomal sequestration of cytotoxic drugs con-tributes to the intractability of malignant melanomas. Proc. Natl. Acad. Sci.USA 2006, 103, 9903–9907.
[178] Ishida, S.; Lee, J.; Thiele, D. J.; Herskowitz, I. Uptake of the anticancer drugcisplatin mediated by the copper transporter Ctr1 in yeast and mammals.Proc. Natl. Acad. Sci. USA 2002, 99, 14298–14302.
[179] Aller, S. G.; Unger, V. M. Projection structure of the human copper trans-porter CTR1 at 6-A resolution reveals a compact trimer with a novel channel-like architecture. Proc. Natl. Acad. Sci. USA 2006, 103, 3627–3632.
[180] Larson, C. A.; Adams, P. L.; Jandial, D. D.; Blair, B. G.; Safaei, R.; Howell,S. B. The role of the N-terminus of mammalian copper transporter 1 in thecellular accumulation of cisplatin. Biochem. Pharmacol. 2010, 80, 448–454.
[181] Wang, X.; Du, X.; Li, H.; Chan, D. S.; Sun, H. The effect of the extracellulardomain of human copper transporter (hCTR1) on cisplatin activation. Angew.Chem., Int. Ed. Engl. 2011, 50, 2706–2711.
[182] Puig, S.; Lee, J.; Lau, M.; Thiele, D. J. Biochemical and genetic analyses ofyeast and human high affinity copper transporters suggest a conserved mech-anism for copper uptake. J. Biol. Chem. 2002, 277, 26021–26030.
[183] Wang, X.; Guo, Z. The role of sulfur in platinum anticancer chemotherapy.Anticancer Agents Med. Chem. 2007, 7, 19–34.
[184] Brabec, V. DNA modifications by antitumor platinum and ruthenium com-pounds: their recognition and repair. Prog. Nucleic Acid Res. Mol. Biol. 2002,71, 1–68.

Bibliography 109
[185] Zhang, W.; Hou, T.; Schafmeister, C.; Ross, W. S.; Case, D. A. LEaP andgleap, AmberTools User’s Manual, Ver. 1.5, 2011.
[186] Phillips, J. C.; Braun, R.; Wang, W.; Gumbart, J.; Tajkhorshid, E.; Villa, E.;Chipot, C.; Skeel, R. D.; Kale, L.; Schulten, K. Scalable molecular dynamicswith NAMD. J. Comput. Chem. 2005, 26, 1781–1802.
[187] Micheletti, C.; Seno, F.; Maritan, A. Recurrent oligomers in proteins: an opti-mal scheme reconciling accurate and concise backbone representations in au-tomated folding and design studies. Proteins: Structure, Function, and Bioin-formatics 2000, 40, 662–674.
[188] CPMD, version 3.15.1; IBM Corp. 1990-2008, MPI fur FestkorperforschungStuttgart 1997-2001, 2011; http://www. cpmd.org.
[189] van Gunsteren, W. F. Biomolecular Simulation: The GROMOS96 Manual andUser Guide; Hochschulverlag AG der ETH Zurich: Zurich, 1996.
[190] Hornak, V.; Abel, R.; Okur, A.; Strockbine, B.; Roitberg, A.; Simmerling,C. Comparison of multiple Amber force fields and development of improvedprotein backbone parameters. Proteins 2006, 65, 712–725.
[191] Lindorff-Larsen, K.; Piana, S.; Palmo, K.; Maragakis, P.; Klepeis, J. L.; Dror,R. O.; Shaw, D. E. Improved side-chain torsion potentials for the Amber ff99SBprotein force field. Proteins 2010, 78, 1950–1958.
[192] Jorgensen, W. L.; Chandrasekhar, J.; Madura, J. D.; Impey, R. W.; Klein,M. L. Comparison of simple potential functions for simulating liquid water. J.Chem. Phys. 1983, 79, 926–935.
[193] Smith, D. E.; Dang, L. X. Computer simulations of NaCl association in polar-izable water. J. Chem. Phys. 1994, 100, 3757–3766.
[194] Joung, I. S.; Cheatham,III, T. E. Determination of alkali and halide monova-lent ion parameters for use in explicitly solvated biomolecular simulations. J.Phys. Chem. B 2008, 112, 9020–9041.
[195] Becke, A. D. Density-functional exchange-energy approximation with correctasymptotic behavior. Phys. Rev. A 1988, 38, 3098–3100.
[196] Lee, C.; Yang, W.; Parr, R. G. Development of the Colle-Salvetti correlation-energy formula into a functional of the electron density. Phys. Rev. B 1988,37, 785–789.
[197] Troullier, N.; Martins, J. L. Efficient pseudopotentials for plane-wave calcula-tions. Phys. Rev. B 1991, 43, 1993–2006.
[198] Martyna, G. J.; Tuckerman, M. E. A reciprocal space based method for treat-ing long range interactions in ab initio and force-field-based calculations inclusters. J. Chem. Phys. 1999, 110, 2810–2821.
[199] Nose, S. A unified formulation of the constant temperature molecular dynamicsmethods. J. Chem. Phys. 1984, 81, 511–519.

110 Bibliography
[200] Hoover, W. G. Canonical dynamics: Equilibrium phase-space distributions.Phys Rev A 1985, 31, 1695–1697.
[201] Martyna, G. J.; Klein, M. L.; Tuckerman, M. Nose-Hoover chains: The canon-ical ensemble via continuous dynamics. J. Chem. Phys. 1992, 97, 2635–2633.
[202] Parrinello, M.; Rahman, A. Crystal Structure and Pair Potentials: AMolecular-Dynamics Study. Phys. Rev. Lett. 1980, 45, 1196–1199.
[203] Hess, B.; Kutzner, C.; van der Spoel, D.; Lindahl, E. GROMACS 4: Algo-rithms for Highly Efficient, Load-Balanced, and Scalable Molecular Simula-tion. J. Chem. Theory Comput. 2008, 4, 435–447.
[204] Kabsch, W.; Sander, C. Dictionary of protein secondary structure: patternrecognition of hydrogen-bonded and geometrical features. Biopolymers 1983,22, 2577–2637.
[205] Joosten, R. P.; Te Beek T. A. H.; Krieger, E.; Hekkelman, M. L.; Hooft, R. W.W.; Schneider, R.; Sander, C.; Vriend, G. A series of PDB related databasesfor everyday needs. Nucleic Acids Res. 2011, 39, D411–D419.
[206] Bulheller, B. M.; Hirst, J. D. DichroCalc–circular and linear dichroism online.Bioinformatics 2009, 25, 539–540.
[207] Besley, N. A.; Hirst, J. D. Theoretical Studies toward Quantitative ProteinCircular Dichroism Calculations. J. Am. Chem. Soc. 1999, 121, 9636–9644.
[208] Putrino, A. ; Sebastiani, D. ; Parrinello, M. Generalized variational densityfunctional perturbation theory. J. Chem. Phys. 2000, 113, 7102–7109.
[209] Sebastiani, D.; Parrinello, M. A New ab-Initio Approach for NMR ChemicalShifts in Periodic Systems. J. Phys. Chem. A 2001, 105, 1951–1958.
[210] Rohrig. U. F.; Sebastiani, D. NMR Chemical Shifts of the Rhodopsin Chro-mophore in the Dark State and in Bathorhodopsin: A Hybrid QM/MM Molec-ular Dynamics Study. J. Phys. Chem. B 2008, 112, 1267–1274.
[211] te Velde. G.; Bickelhaupt, F. M.; Baerends, E. J.; Fonseca Guerra, C.; van Gis-bergen, S. J. A.; Snijders, J. G.; Ziegler, T. Chemistry with ADF. J. Comput.Chem. 2001, 22, 931–967.
[212] Fonseca Guerra, C.; Snijders, J. G.; te Velde, G.; Baerends, E. J. Towards anorder-N DFT method. Theor. Chem. Acc. 1998, 99, 391–403.
[213] ADF2010, SCM, Theoretical Chemistry, Vrije Universiteit, Amsterdam, TheNetherlands, http://www.scm.com.
[214] Hammer, B.; Hansen, L. B.; Norskov, J. K. Improved adsorption energeticswithin density-functional theory using revised Perdew-Burke-Ernzerhof func-tionals. Phys. Rev. B 1999, 59, 7413–7421.
[215] Sterzel, M.; Autschbach, J. Toward an accurate determination of 195Pt chem-ical shifts by density functional computations: the importance of unspecificsolvent effects and the dependence of Pt magnetic shielding constants on struc-tural parameters. Inorg. Chem. 2006, 45, 3316–3324.

Bibliography 111
[216] van Lenthe, E.; Baerends, E. J.; Snijders, J. G. Relativistic regular two-component Hamiltonians. J. Chem. Phys. 1993, 99, 4597–4610.
[217] Wolff, S. K.; Ziegler, T.; van Lenthe, E.; Baerends, E. J. Density functional cal-culations of nuclear magnetic shieldings using the zeroth-order regular approx-imation (ZORA) for relativistic effects: ZORA nuclear magnetic resonance. J.Chem. Phys. 1999, 110, 7689–7698.
[218] Rehr, J. J.; Mustre de Leon, J.; Zabinsky, S. I.; Albers, R. C. Theoretical x-rayabsorption fine structure standards. J. Am. Chem. Soc. 1991, 113, 5135–5140.
[219] Rehr, J. J.; Albers, R. C.; Zabinsky, S. I. High-order multiple-scattering cal-culations of x-ray-absorption fine structure. Phys. Rev. Lett. 1992, 69, 3397–3400.
[220] Rehr, J. J. ; Albers, R. C. Theoretical approaches to x-ray absorption finestructure. Rev. Mod. Phys. 2000, 72, 621–654.
[221] Newville, M.; Ravel, B.; Haskel, D.; Rehr, J. J.; Stern, E. A.; Yacoby, Y.Analysis of multiple-scattering XAFS data using theoretical standards. PhysicaB 1995, 208, 154–156.
[222] Korbas, M.; Marsa, D. F.; Meyer-Klaucke, W. KEMP: A program script forautomated biological x-ray absorption spectroscopy data reduction. Rev. Sci.Instrum. 2006, 77, 063105–063109.
[223] Perczel, A.; Hollosi, M.; Foxman, B. M.; Fasman, G. D. Conformational analy-sis of pseudocyclic hexapeptides based on quantitative circular dichroism (CD),NOE, and x-ray data. The pure CD spectra of type I and type II .beta.-turns.J. Am. Chem. Soc. 1991, 113, 9772–9784.
[224] Hess, B. Convergence of sampling in protein simulations. Phys. Rev. E 2002,65, 031910–031919.
[225] Zabinsky, S. I.; Rehr, J. J.; Ankudinov, A.; Albers, R. C.; Eller, M. J. Multiple-scattering calculations of x-ray-absorption spectra. Phys. Rev. B 1995, 52,2995–3009.
[226] Best, R. B.; Buchete, N.-V.; Hummer, G. Are current molecular dynamicsforce fields too helical? Biophys. J. 2008, 95, L07–L09.
[227] Thompson, E. J.; DePaul, A. J.; Patel, S. S.; Sorin, E. J. Evaluating molecularmechanical potentials for helical peptides and proteins. PLoS One. 2010, 5,e10056.
[228] Best, R. B.; Hummer, G. Optimized molecular dynamics force fields applied tothe helix-coil transition of polypeptides. J. Phys. Chem. B 2009, 113, 9004–9015.
[229] Best, R. B.; Mittal, J. Balance between alpha and beta structures in ab initioprotein folding. J. Phys. Chem. B 2010, 114, 8790–8798.

112 Bibliography
[230] Machonkin, T. E.; Westler, W. M.; Markley, J. L. Paramagnetic NMR spec-troscopy and density functional calculations in the analysis of the geometricand electronic structures of iron-sulfur proteins. Inorg. Chem. 2005, 44, 779–797.
[231] Liptak, M. D.; Wen, X.; Bren, K. L. NMR and DFT investigation of hemeruffling: functional implications for cytochrome c. J. Am. Chem. Soc. 2010,132, 9753–9763.
[232] Chan, J.; Merrifield, M. E.; Soldatov, A. V.; Stillman, M. J. XAFS spectralanalysis of the cadmium coordination geometry in cadmium thiolate clustersin metallothionein. Inorg. Chem. 2005, 44, 4923–4933.
[233] Solomon, E. I. Spectroscopic methods in bioinorganic chemistry: blue to greento red copper sites. Inorg. Chem. 2006, 45, 8012–8025.
[234] Csaszar, P.; Pulay, P. Geometry Optimization by DIIS. J. Mol. Struct.,THEOCHEM 1984, 114, 31–34.
[235] Ryckaert, J. P.; Ciccotti, G.; Berendsen H. J. C. Numerical Integration ofthe Cartesian Equations of Motion of a System with Constraints: MolecularDynamics of n-Alkanes. J. Comput. Phys. 1977, 23, 327–341.
[236] Cheatham, T. E. III; Miller, J. L.; Fox, T.; Darden, T. A.; Kollman, P. A.Molecular Dynamics Simulations on Solvated Biomolecular Systems: The Par-ticle Mesh Ewald Method Leads to Stable Trajectories of DNA, RNA, andProtein. J. Am. Chem. Soc. 1995, 117, 4193–4194.
[237] Feller, S. E.; Zhang, Y.; Pastor, R. W.; Brooks, B. R. Constant pressuremolecular dynamics simulation: The Langevin piston method. J. Chem. Phys.1995, 103, 4613–4621.
[238] Jameson, A. K.; Jameson, C. J. Gas phase 13C chemical shifts in the zero-pressure limit: Refinements to the absolute shielding scale for 13C. Chem.Phys, Lett. 1987, 134, 461–466.
[239] Gregor, T.; Mauri, F.; Car, R. A comparison of methods for the calculation ofNMR chemical shifts. J. Chem. Phys. 1999, 111, 1815–1822.
[240] Macke T. J., et al., AmberTools User’s Manual, Ver. 1.3, 2010.
[241] Frisch, M. J.; Head-Gordon, M.; Trucks, G. W.; Foresman, J. B.;Raghavachari, K.; Schlegel, H. B.; Robb, M.; Binkley, J. S.; Gonzalez, C.;Defrees, D. J.; Fox, D. J. R.; Whiteside, A.; Seeger, Melius, C. F.; Baker, J.;Kahn, L. R.; Stewart, J. J. P.; Fluder, E. M.; Topiol, S.; and Pople, J. A.Gaussian 90 (Gaussian, Inc., Pittsburgh, PA, 1990).
[242] Bayly, C. I.; Cieplak, P.; Cornell, W. D.; Kollman, P. A. A well-behavedelectrostatic potential based method using charge restraints for deriving atomiccharges: the RESP model. J. Phys. Chem. 1993, 97, 10269–10280.
[243] Kohn, W.; Sham, L. J. Self-Consistent Equations Including Exchange andCorrelation Effects. Phys. Rev. 1965, 140, A1133–A1138.

Bibliography 113
[244] Parr, R. G.; Yang, W. Density-functional theory of atoms and molecules. Ox-ford University Press, US, 1989.
[245] Hohenberg, P.; Kohm, W. Inhomogeneous Electron Gas. Phys. Rev. 1964,136, B864–B871.
[246] Koch, W.; Holthausen, M. C. A chemist’s guide to Density Functional Theory.2nd Ed., Wiley-VCH: Germany, 2001
[247] Vosko, S. H.; Wilk, L.; Nusair, M. Accurate spin-dependent electron liquidcorrelation energies for local spin density calculations: a critical analysis. Can.J. Phys. 1980, 58, 1200–1211.
[248] Perdew, J. P.; Wang, Y. Accurate and simple analytic representation of theelectron-gas correlation energy. Phys. Rev. B 1992, 45, 13244–13249.
[249] Heine, V. The concept of Pseudopotentials. Solid state physics 1970, 24, 1–36.
[250] Ihm, J. Total energy calculations in solid state physics. Rep. Prog. Phys. 1988,51, 105–142.
[251] Pickett, W. E. Pseudopotential methods in condensed matter applications.Comp. Phys. Rep. 1989, 9, 115–197.
[252] Phillips, J. C.; Kleinman, L. New Method for Calculating Wave Functions inCrystals and Molecules. Phys. Rev. 1959, 116, 287–294.
[253] http://www.tcm.phy.cam.ac.uk/ pdh1001/thesis/node19.html#sec:pseudo
[254] Mackerell, A. D. All-Atom Empirical Potential for Molecular Modeling andDynamics Studies of Proteins. et al. J. Chem. B 1998, 102, 3586–3616.
[255] Allen, M. P.; Tildesley, D. J. Computer simulation of liquids. Oxford UniversityPress, USA, 1989.
[256] Frenkel, D.; Smit, B. Understanding Molecular Simulation: From Algorithmsto Applications. Academic Press, USA, 2001.
[257] Marx, D.; Jurg, H. Ab initio molecular dynamics: Basic Theory and advancedmethods. Cambridge University Press, UK, 2009.
[258] Tully, J. C. Molecular dynamics with electronic transitions. J. Chem. Phys.1990, 93, 1061–1071.
[259] Tully, J. C. Mixed quantum-classical dynamics: Mean-field and surface-hoppin. In Berne, B. J.; Ciccotti, G.; Coker, D. F. Eds. Classical and quantumdynamics in condensed phase simulations. World Scientific, Singapore, 1998.
[260] Dirac, P. A. M. The principles of Quantum mechanics. Oxford UniversityPress, UK, 1947.
[261] Sambe, H.; Felton, R. H. A new computational approach to Slater’s SCF-Xαequation. J. Chem. Phys. 1975, 62, 1122–1126.

114 Bibliography
[262] Goldstein, H.; Poole, C. P.; Safko, J. L. Classical mechanics. Addison-Wesley,USA, 2002.
[263] Ewald, P. Die Berechnung optischer und elektrostatischer Gitterpotentiale.Ann. Phys. 1921, 369, 253–287.
[264] van Gunsteren, W. F.; Berendsen, H. J. C. Computer Simulation of MolecularDynamics: Methodology, Applications and Perspectives in Chemistry. Angew.Chem. Int. Ed. Engl. 1990, 29, 992–1023.
[265] Berendsen, H. J. C.; Postma, J. P. M.; van Gunsteren, W. F.; DiNola, A.;Haak, J. R. Molecular dynamics with coupling to an external bath. J. Chem.Phys. 1984, 81, 3684–3690.
[266] Andersen, H. C. Molecular dynamics simulations at constant pressure and/ortemperature. J. Chem. Phys. 1980, 72, 2384–2393.
[267] Swenden, R. H.; Wang, J.-S. Replica Monte Carlo Simulation of Spin-Glasses.Phys. Rev. Lett. 1986, 57, 2607–2609.
[268] Hukushima, K.; Nemoto, K. Exchange Monte Carlo Method and Applicationto Spin Glass Simulations. J. Phys. Soc. Jpn. 1996, 65, 1604–1608.
[269] Sugita, Y.; Okamoto, Y. Replica-exchange molecular dynamics method forprotein folding. Chem. Phys. Lett. 1999, 314, 141–151.
[270] Fukunishi, H.; Watanabe, O.; Takada, S. On the Hamiltonian replica exchangemethod for efficient sampling of biomolecular systems: Application to proteinstructure prediction. J. Chem. Phys. 2002, 116, 9058–9067.
[271] Patriksson, A.; van der Spoel, D. A temperature predictor for parallel temper-ing simulations. Phys. Chem. Chem. Phys. 2008, 10, 2073–2077.
[272] Hirshfeld, F. L. Bonded-atom fragments for describing molecular charge den-sities. Theor. Chim. Acta. 1977, 44, 129–138.
[273] Helgaker, T.; Jaszunski, M.; Ruud, K. Ab Initio Methods for the Calculationof NMR Shielding and Indirect Spin-Spin Coupling Constants. Chem. Rev.1999, 99, 293–352.
[274] Keith, T. A.; Bader, R. F. W. Chem. Phys. Lett. 1993, 210, 223–231.
[275] Bunker, G. Introduction to XAFS: A practical guide to X-ray Absorption finestructure Spectroscopy. Cambridge University Press, UK (2010).
[276] Rehr, J. J.; Booth, C. H.; Bridges, F.; Zabinsky, S. I. X-ray-absorption finestructure in embedded atoms. Phys. Rev. B 1994, 49, 12347–12350.
[277] Beni, G.; Platzman, P. M. Temperature and polarization dependence of ex-tended x-ray absorption fine-structure spectra. Phys. Rev. B 1976, 14, 1514–1518.
[278] Rosenfeld, L. Z. Phys. 1928, 52, 161–174.

Bibliography 115
[279] Bayley, P. M.; Nielsen, E. B.; Schellman, J. A. Rotatory properties of moleculescontaining two peptide groups: theory. J. Phys. Chem. 1969, 73, 228–243.
[280] Bulheller, B. M.; Rodger, A.; Hirst, J. D. Circular and linear dichroism ofproteins. Phys. Chem. Chem. Phys. 2007, 9, 2020–2035.
[281] Wallace, B. A.; Janes, R. W. Modern Techniques for Circular Dichroism andSynchrotron Radiation Circular Dichroism Spectroscopy. IOS Press, Nether-lands, (2009).
[282] Woody, R. W.; Sreerama, N. Comment on “Improving protein circular dichro-ism calculations in the far-ultraviolet through reparametrizing the amide chro-mophore” [J. Chem. Phys. 109, 782 (1998)]. J. Chem. Phys. 1999, 111, 2844–2845.
[283] Atkins, P.; de Paula, J. Physical Chemistry. 9th Ed., W. H. Freeman, 2009.
[284] Laio, A.; Parrinello, M. Escaping free-energy minima. Proc. Natl. Acad. Sci.USA 2002, 99, 12562–12566.
[285] Laio, A.; Gervasio, F. L. Metadynamics: a method to simulate rare events andreconstruct the free energy in biophysics, chemistry and material science. Rep.Prog. Phys. 2008, 71, 126601–126622.
[286] Barducci, A.; Bussi, G.; Parrinello, M. Well-Tempered Metadynamics: ASmoothly Converging and Tunable Free-Energy Method. Phys. Rev. Lett.2008, 100, 020603–020606.
[287] Bussi, G.; Gervasio, F. L.; Laio, A.; Parrinello, M. Free-energy landscape forbeta hairpin folding from combined parallel tempering and metadynamics. J.Am. Chem. Soc. 2006, 128, 13435–13441.
[288] Bonomi, M.; Parrinello, M. Enhanced Sampling in the Well-Tempered Ensem-ble. Phys. Rev. Lett. 2010, 104, 190601–190604.
[289] Cheatham, T. E. III Simulation and modeling of nucleic acid structure, dy-namics and interactions. Curr. Opin. Struct. Biol. 2004, 14, 360–367.
[290] Rohs, R.; West, S. M.; Liu, P.; Honig, B. Nuance in the double-helix and itsrole in protein-DNA recognition. Curr. Opin. Struct. Biol. 2009, 19, 171–177.
[291] Perez, A.; Marchan, I.; Svozil, D.; Sponer, J.; Cheatham, T. E. III; Laughton,C. A.; Orozco, M. Refinement of the AMBER force field for nucleic acids:improving the description of alpha/gamma conformers. Biophys J. 2007, 92,3817–3829.
[292] Lavery, R.; Moakher, M.; Maddocks, J. H.; Petkeviciute, D.; Zakrzewska, K.Conformational analysis of nucleic acids revisited: Curves+. Nucleic AcidsRes. 2009 37, 5917–5929.
[293] http://www.prace-project.eu/

116 Bibliography

List of Figures
1.1 Chemical structures of a) cisplatin (cis-diamminedichloroplatinum(II))and b) transplatin (trans-diamminedichloridoplatinum(II)). . . . . . . 1
1.2 A simplified scheme of the mechanisms affecting cellular uptake, dis-tribution and efflux of cisplatin (adapted from [30]). . . . . . . . . . . 3
2.1 Major cisplatin-DNA adducts: (a) 1,2-[Pt(NH3)2]2+-d(GpG) intra-strand cross-link; (b) 1,3-[Pt(NH3)2]2+-d(GpTpG) intra-strand cross-link; (c) inter-strand cross-link (adapted from [24]). DNA’s backboneis shown in ribbon; their nucleobases in bond representation; the plat-inum atom is represented as a sphere. . . . . . . . . . . . . . . . . . . 7
2.2 Structures of cisplatin-DNA adduct: (a) from X-ray [41] and (b) fromNMR [44]. Atoms in DNA are represented by lines while the cisplatinmoiety is shown in ball-stick model (platinum in gray, nitrogen in blue). 8
2.3 X-ray structure of the complex between HMGB1 domain A and cis-[Pt(II)(NH3)2]-d-(CCUCTCTG*G*ACCTTCC)-d(GGAGAGACCTGGAAGG)(PDB code 1CKT) [76]. The DNA’s backbone is shown in blue rib-bon; nucleobases in blue bonds; cisplatin moiety in van der Waalsballs. The HMGB1’s backbone is shown in red ribbon; its Phe37amino acid, which inserts between two platinated G8 and G9 bases,is shown in green ball-stick representation. . . . . . . . . . . . . . . . 9
2.4 Correlation between the fold-resistance (which is defined as the foldincrease in the number of survival cells when treated with the sameamount of drug) and the percent decrease in cisplatin accumulationwith respect to sensitive cells (adapted from [30]). . . . . . . . . . . . 10
2.5 Cartoon representing the copper influx transporter Ctr1 (adaptedfrom [145]). Left: Ctr1 is a symmetrical homotrimeric trans-membraneprotein. Nine trans-membrane helices form a pore in the lipid bilayer.Each subunit is represented by a different color. Right: One of thethree subunits is removed to reveal the interior of the pore. . . . . . . 13
2.6 Overlay of 2D 1H,13C-edited HSQC spectra of Mets7 (red contours)and of mixtures (1:1) of Mest7 with a) cisplatin and b) transplatin.Spectral changes induced by cisplatin/transplatin are indicated witharrows. Figures adapted from [142]. . . . . . . . . . . . . . . . . . . . 15

118 List of Figures
2.7 The NMR structures of: (a) Atox1 [151] and (b): the soluble domain 4of the ATP7B protein [148]. The backbone is represented with ribbon.Different colors indicate different secondary-structure types: green isloop, yellow is beta sheet, and purple is alpha helix. Two cysteineamino acids are shown in bond representation. . . . . . . . . . . . . . 16
3.1 Schematic diagram of the relationship between all-electron and pseu-dopotentials and wavefunctions as well as real and pseudopotentials,adapted from [253]. . . . . . . . . . . . . . . . . . . . . . . . . . . . . 29
3.2 Schematic representation of Coulomb and modified Coulomb potentials. 31
4.1 Structural models of platinated and Apo peptides emerging fromREST and QM/MM simulations. The backbone conformations of thelast QM/MM snapshot (in red ribbons) and a representative RESTsnapshot (in blue ribbons) are superimposed. The QM atoms areshown in stick-and-balls (CB=Cβ, CG=Cγ, CE=Cε). Water is shownin lines. Counterions are not shown for the sake of clarity. . . . . . . 52
4.2 Potential energy distribution of 8 replicas (in different colors) sim-ulated with REST method for the platinated peptides C1-C3 andT1-T3 and the apopeptide. . . . . . . . . . . . . . . . . . . . . . . . . 55
4.3 Running averages of CD spectra calculated from the REST trajecto-ries for cisplatn-Mets7 (C1-C3) and transplatin-Mets7 (T1-T3). . . . 56
4.4 Calculated and experimentally measured [142] CD spectra of cisplatin-Mets7 (a) and transplatin-Mets7 (b) adducts. . . . . . . . . . . . . . 60
4.5 Pt-O radial pair distribution functions calculated from the QM/MMtrajectories. Left: cisplatin-Mets7, right: transplatin-Mets7. . . . . . . 60
4.6 Calculated and experimental EXAFS spectra at the Pt edge of cisplatin-Mets7 (a) and transplatin-Mets7 (b) adducts. The experimental spec-trum has been measured in this work. Fourier Transforms of thespectra in (a) and (b) are given in (c) and (d), respectively. Theyare plotted as a function of the scattering path length of the photo-electron R. Note that R does not correspond to a real interatomicdistance since the peak positions are shifted inward, with respect tothe bond distances; due to the phase shifts of the photoelectron (i.e.increase in its kinetic energy caused by the electronic potentials ofboth the scattering and the absorbing atoms) [225]. The shift, there-fore, depends on both the absorbing and scattering atom types, andin our cases is approximately 0.4 A (Tab. 4.5. . . . . . . . . . . . . . 62
4.7 Contributions from different types of scattering atoms to the totalEXAFS spectra, calculated from the QM/MM trajectories. . . . . . . 67
5.1 The X-ray structure of cisplatin-DNA-HMGB1. The DNA is shownwith bond representation, HMGB1 with Connolly surface represen-tation and cisplatin moiety in van der Waals balls. Hydrogen atomsmissing in the X-ray structure were added using the Leap program[185]. . . . . . . . . . . . . . . . . . . . . . . . . . . . . . . . . . . . . 70

List of Figures 119
5.2 Complex of platinated DNA-HMGB1. The backbone conformationsof X-ray structure (red), the QM/MM structure (blue) and the classi-cal MD structure (green) are superimposed. Platinated guanines areshown in ball-and-stick. . . . . . . . . . . . . . . . . . . . . . . . . . . 73
5.3 The backbone RMSD of QM/MM trajectory. . . . . . . . . . . . . . . 74
5.4 Atom name convention used for parameterization of partial charges. . 77
5.5 Atom type convention used for parameterization of bonded parameters. 77
5.6 The backbone RMSD of classical MD trajectory. . . . . . . . . . . . . 78
5.7 Number of hydrogen bonds between the platinated DNA and HMGB1 78
5.8 The contact map, which is defined as matrix of the smallest distancesbetween pairs of residues, of the X-ray structure (a) and the classicalMD trajectory (b). . . . . . . . . . . . . . . . . . . . . . . . . . . . . 79
A.1 DFT optimized model compounds . . . . . . . . . . . . . . . . . . . . 87
A.2 Atom name and atom type convention for the QM atoms. The atomnames are in bold and atom types in italics. Hydrogen atoms are notshown for the sake of clarity . . . . . . . . . . . . . . . . . . . . . . . 94
A.3 RMSD of the QM region during the Car-Parrinello QM/MM simula-tions. Left: cisplatin-Mets7, right: transplatin-Mets7. . . . . . . . . . 94

120 List of Figures

List of Tables
4.1 Selected features of the simulated models . . . . . . . . . . . . . . . . 53
4.2 The averaged RMSD of the REST structures with respect to the cor-responding last QM/MM structures. . . . . . . . . . . . . . . . . . . 58
4.3 The root mean square fluctuations (RMSF), which is defined as thestandard deviation of the backbone RMSD. The smaller the value ofRMSF, the more rigid the conformation, and vice versa. . . . . . . . 59
4.4 DSSP secondary structure assignment for the ensembles of conforma-tions generated by REST simulations. . . . . . . . . . . . . . . . . . . 59
4.5 Structural parameters calculated from QM/MM and REST simu-lations for cisplatin-Mets7 (C1-C3) and transplatin-Mets7 (T1-T3)adducts. Standard deviations are shown in parentheses. Bond lengthsare in angstrom and angles in degree. . . . . . . . . . . . . . . . . . . 61
4.6 13C (top) and 1H (bottom) NMR chemical shifts (in ppm) of the Pt-coordinated Met residues of cisplatin-Mets7 (C1–C3) and transplatin-Mets7 (T1–T3) adducts after REST simulations. The correspondingvalues before REST are reported in Tables. A.8–A.10 in Appendix.Standard deviations are shown in parentheses. See Fig. 4.1 for atomname conventions. . . . . . . . . . . . . . . . . . . . . . . . . . . . . . 64
4.7 195Pt NMR chemical shifts (in ppm) of the cisplatin-Mets7 (C1–C3)and transplatin-Mets7 (T1–T3) adducts after REST simulations. Thecorresponding values before REST are reported in Tab. A.11 in Ap-pendix. Standard deviations are shown in parentheses. . . . . . . . . 64
5.1 Selected features of the qmmm simulation box. . . . . . . . . . . . . . 72
5.2 Comparison of the selected structural features of QM/MM, classicalMD models with those of the X-ray structure. See Fig. 5.5 for theatom type convention. . . . . . . . . . . . . . . . . . . . . . . . . . . 72
5.3 Partial charges (in fraction of electronic charge) derived from the forcematching procedure for the cisplatin-DNA-HMGB1 complex. See Fig.5.4 for the atom name convention. . . . . . . . . . . . . . . . . . . . . 75
5.4 The harmonic force constant Kr (kcal/mol A−2), Kθ (kcal/mol rad−2)of bond stretching and angle bending, respectively, derived from theforce matching procedure for the cisplatin-DNA-HMGB1 complex. req(A) and θeq (degree) are equilibrium bond lengths and bond angles,respectively. See Fig. 5.5 for the atom type convention. . . . . . . . . 76

122 List of Tables
5.5 Force constant of dihedral angles (kcal/mol) obtained from the forcematching procedure. See Fig. 5.5 for the atom type convention. . . . 76
A.1 Structural parameters of the model compounds optimized at the DFTlevel in gas phase. Scis and Strans are sulphur atoms cis and trans tothe fourth ligand (chloride, water molecule, or OH− group). . . . . . 88
A.2 Charges (in fraction of electronic charge) derived from the force match-ing procedure for the cisplatin-Mets7 adduct models. See Fig. A.2for the atom name convention. . . . . . . . . . . . . . . . . . . . . . . 88
A.3 Charges (in fraction of electronic charge) derived from the force match-ing procedure for the transplatin-Mets7 adduct models. See Fig. A.2for the atom name convention. . . . . . . . . . . . . . . . . . . . . . . 89
A.4 The harmonic force constant Kr of bond stretching (kcal/mol A−2)and equilibrium bond lengths req (A) obtained from the force matchingprocedure. See Fig. A.2 for the atom type convention. . . . . . . . . 89
A.5 The harmonic force constant of angle bending (kcal/mol rad−2) andequilibrium bond angles (degree) obtained from the force matchingprocedure. See Fig. A.2 for the atom type convention. . . . . . . . . 90
A.6 Force constant of dihedral angles (kcal/mol) obtained from the forcematching procedure. See Fig. A.2 for the atom type convention. . . . 91
A.7 The cosine content of the first four principal components of the QMregion in the QM/MM simulations. . . . . . . . . . . . . . . . . . . . 91
A.8 NMR chemical shifts of C1-C3 (13C (top) and 1H (bottom)) obtainedfrom QM/MM simulations before REST simulations. . . . . . . . . . 92
A.9 NMR chemical shifts of T1-T3 (13C (top) and 1H (bottom)) obtainedfrom QM/MM simulations before REST simulations. . . . . . . . . . 92
A.10 NMR chemical shifts of Apo (13C (top) and 1H (bottom)) obtainedfrom QM/MM simulations for the representative snapshot of the RESTtrajectory. The RMSD of this representative snapshot relative to thelast REST one is 3.3 A. . . . . . . . . . . . . . . . . . . . . . . . . . 93
A.11 195Pt NMR chemical shifts obtained from QM/MM simulations beforeREST simulations. . . . . . . . . . . . . . . . . . . . . . . . . . . . . 93