Actinomycin D and Telmisartan Combination Therapy Targets ...
122
University of South Florida University of South Florida Scholar Commons Scholar Commons Graduate Theses and Dissertations Graduate School November 2018 Actinomycin D and Telmisartan Combination Therapy Targets Actinomycin D and Telmisartan Combination Therapy Targets Lung Cancer Stem Cells Lung Cancer Stem Cells Ryan Green University of South Florida, [email protected] Follow this and additional works at: https://scholarcommons.usf.edu/etd Part of the Cell Biology Commons, Molecular Biology Commons, and the Oncology Commons Scholar Commons Citation Scholar Commons Citation Green, Ryan, "Actinomycin D and Telmisartan Combination Therapy Targets Lung Cancer Stem Cells" (2018). Graduate Theses and Dissertations. https://scholarcommons.usf.edu/etd/8115 This Dissertation is brought to you for free and open access by the Graduate School at Scholar Commons. It has been accepted for inclusion in Graduate Theses and Dissertations by an authorized administrator of Scholar Commons. For more information, please contact [email protected].
Transcript of Actinomycin D and Telmisartan Combination Therapy Targets ...

University of South Florida University of South Florida
Scholar Commons Scholar Commons
Graduate Theses and Dissertations Graduate School
November 2018
Actinomycin D and Telmisartan Combination Therapy Targets Actinomycin D and Telmisartan Combination Therapy Targets
Lung Cancer Stem Cells Lung Cancer Stem Cells
Ryan Green University of South Florida, [email protected]
Follow this and additional works at: https://scholarcommons.usf.edu/etd
Part of the Cell Biology Commons, Molecular Biology Commons, and the Oncology Commons
Scholar Commons Citation Scholar Commons Citation Green, Ryan, "Actinomycin D and Telmisartan Combination Therapy Targets Lung Cancer Stem Cells" (2018). Graduate Theses and Dissertations. https://scholarcommons.usf.edu/etd/8115
This Dissertation is brought to you for free and open access by the Graduate School at Scholar Commons. It has been accepted for inclusion in Graduate Theses and Dissertations by an authorized administrator of Scholar Commons. For more information, please contact [email protected].
Actinomycin D and Telmisartan Combination Therapy Targets
Lung Cancer Stem Cells
by
Ryan Green
A dissertation submitted in partial fulfillment of the requirements for the degree of
Doctor of Philosophy Department of Molecular Medicine
College of Medicine University of South Florida
Major Professor: Subhra Mohapatra, Ph.D. Co-Major Professor: Srinivas Bharadwaj, Ph.D.
Andreas Seyfang, PhD Bala Chandran, PhD Vrushank Davé, PhD
Date of Approval: November 9, 2018
Keywords: Chemotherapy, 3D culture, Drug Synergy
Copyright © 2018 Ryan Green

Acknowledgments
This dissertation represents the hard work and patient mentorship of many others
besides myself. I would like to acknowledge the efforts of my major professor Dr.
Subhra Mohapatra. Without her meticulous critique and invaluable scientific guidance
this work would not be possible. I could not imagine a better mentor than Dr. Subhra
and I certainly would not have achieved what I have today without her years of
dedicated direction and supervision. I would also like to acknowledge Dr. Shyam
Mohapatra who has not only provided vigilant review of my work at every lab meeting
but also constant advice and encouragement with a positive outlook that has motivated
everyone in the lab to improve the quality and efficiency of their research.
This work would also not have been possible without guidance and review from the
members of my dissertation committee. I would like to thank Dr. Srinivas Bharadwaj for
always being available to answer my flow cytometry questions, Dr. Andreas Seyfang for
his many helpful ideas to improve my experiments and his many kind words of support,
Dr. Vrushank Davé for his careful review of my manuscripts and drafts as well as his
scientific input, and Dr. Bala Chandran who, despite being a recent addition to the
committee, has also provided key experimental input and oversight.
In addition to my committee, there have been many others who have helped me to
learn the techniques and methods necessary for this work. I would like to thank Dr.
Charles Szekeres at the USF flow cytometry core and Mrs. Jodi Kroeger at the Moffitt

flow cytometry core as well as Ms. Alison Nelson for teaching me the valuable
technique of flow cytometry. I would like to thank Dr. Amanda Garces and Dr. Jake Cha
at the USF microscopy core for their help with electron and confocal microscopy; and
Dr. Jaya Mallela as well as Mrs. Margaret Baldwin and all of the staff at USF
comparative medicine for their help with animal experiments. Additionally, the many
members, volunteers, and technicians in the Mohapatra lab have helped me discussing
and performing experiments including Mr. Mark Howell, Dr. Michael Chueng, Dr.
Viviana Sampayo, Mr. Jit Banerjee, Ms. Elspheth Foran, and Mrs. Bhanu Katiri.
Finally, I would like to thank the many members of USF Health faculty and staff who
have made the day to day operations of this project possible including the Prof., Chair &
Assoc. Dean of the College of Medicine Molecular Medicine Dr. Robert Deschenes, the
associate dean of Ph.D. and postdoctoral programs Dr. Michael Teng, and the Director
of the signature program in allergy, immunology, and infectious disease Dr. Burt
Anderson.

i
Table of Contents
List of Figures……………………………………………………………....…………...………iv
List of Tables…………………………………………………………………...……………....vii
Abbreviations…………………………………………………………………………..………viii
Abstract……………………………………………………………………..…………….…….xii
Chapter 1: Introduction……………………………………………………………...………….1
1.1 Objective………………………………………………………...……………….….1
1.2 Motivation…………………………………………………………………...……….1
1.3 Scope…………………………………………………………………...……………1
1.4 Overview of Chapters……………………………………………………...……….2
Chapter 2: Background………………………………..……………………..………….......…3
2.1 Clinical Significance of Lung Cancer and Unmet Need for
Treatment…......................................................................................................3
2.2 Definition and History of Cancer Stem Cells……………………………….........5
2.3 Cancer Stem Cells Clinical Relevance……………………....……………..…....9
2.4 Properties and Identification of Cancer Stem Cells……….……...….……........9
2.5 Drugs Targeting Cancer Stem Cells………………………………….…...…....11
2.6 Concluding Remarks……………………………………………………….…..…12
Chapter 3: Methods………..…………..…………...……….……………………….………..13

ii
In vitro studies:
3.1 Assay of Reactive Oxygen Species………………………….……….…………13
3.2 Beta Catenin Activity Assay…………………………………………….….…….13
3.3 Cell Culture……………………………………………………….………….…….14
3.4 CRISPR/Cas9………………….………………………………………………….15
3.5 CXCR4 Promotor Activity Assay……………….………………………………..15
3.6 Flow Cytometry…………………………………………………………………....15
3.7 IC50 Assay……………………………………………………………………….....16
3.8 Immunofluorescence……………………………………………………………...17
3.9 Magnetic Cell Separation………………………………………………………...17
3.10 qPCR Array……………………………………………………………………....17
3.11 Quantitative Reverse Transcriptase PCR………………………….………….18
3.12 RNA-Seq: Transcriptome Profiling Using RNA Quantification ......... Sequencing.....................................................................................................18
3.13 Sphere Formation Assay………………………………………………………..20
3.14 Western Immunoassay…………………………………….……………..……..20
3.15 Wnt Pathway Phospho-Antibody Array………………………………………..21
In vivo studies:
3.16 Animal Experiments………………………………………………….………….21
General Statistics:
3.17 Statistics…………………………………………………………………………..22
Chapter 4: Culturing Lung Cancer Cells on the 3D Scaffold Increases Their Stemness……..….……………………………....………….............................….24
4.1 Introduction………………………………………………………………………...24
4.2 Results……………………………………………………………………………...32
4.3 Discussion………………………………………………………………………….43
Chapter 5: Novel Mechanisms Regulating CSC Expansion (Natriuretic Peptide Receptor A)…………………….....................…………..………………………………..46
5.1 Introduction………………………………………………………………………...46

iii
5.2 Results………………………………………………………………………….…..50
5.3 Discussion………………………………………………………………………….58
Chapter 6: Actinomycin D and Telmisartan Combination Treatment Targets CSC and Reduces Tumor Burden……….…...…...........………...…..................…….60
6.1 Introduction………………….…………………………………………….….……60
6.2 Results………………………………….………………………………….....……63
6.3 Discussion……………………………………….….…….……………………….72
Chapter 7: Actinomycin D and Telmisartan Combination Treatment Reduces Stemness Lung Cancer CSC through Modulation of the Wnt/β-catenin Signaling Pathway………..…………………………………………………………....................….74
7.1 Introduction………………………………………………………………..……….74
7.2 Results…………………………………………………………….…..……………77
7.3 Discussion………………………………………………………….……………...85
Chapter 8: Conclusion……………………………………………………………………..….89
References…………………………………………………………………………………......93
Appendicies..................................................................................................................103
Appendix A: IACUC Approvals..........................................................................104

iv
List of Figures
Figure 1. Role of CSC in the Tumor Microenvironment………………..................…..5
Figure 2. Proliferation and Differentiation of CSC Create a Hierarchy of Lineages Within Tumors…….…………........………………....……………...8
Figure 3. Model of CSC Enrichment by 3D Tumoroid Culture……………............…31
Figure 4. Lung Cancer Cell Lines Cultured on 3D Scaffold form Tumoroids…........33
Figure 5. Expression of CSC Marker Genes is Increased in Lung Tumoroid Culture…………………........…………………………………………....…….34
Figure 6. Expression of CSC Transcription Factors is Increased in LLC1 Biopsy Derived Tumoroids……..….......................…........................……..35
Figure 7. Expression of the CSC Marker (CD44+/24-) is Increased in A549 Biopsy Derived Tumoroids……....…….........…..…………………….36
Figure 8. Expression of the CSC Marker (CD44+/24-) is Increased in H460 Tumoroids………………………………….…….................…………………37
Figure 9. Aldehyde Dehydrogenase Activity is Increased by Tumoroid Culture…...................................................................................................38
Figure 10. Sphere Formation Efficiency is Increased by Tumoroid Culture and ALDH Activity……………………....................………..……………..…39
Figure 11. CSC Populations Enriched by Tumoroid Culture have Enhanced Tumor Initiation Ability……..…….…………........………...…….40
Figure 12. Expression of CSC Marker Genes Changes Over Time During Tumoroid Culture……….…..............…………………...….………..41
Figure 13. Expression of CSC Marker Genes is Enhanced by Tumoroid Culture in Multiple Cell Lines…….…........……..……..............……………42
Figure 14. The Functions of ANP/NPRA Signaling…..………….....………….….……46

v
Figure 15. Increased ALDH Activity Coincides with Increased NPRA and CXCR4 Expression in Tumoroids…......….……………….......…………….50
Figure 16. Increased CD44+/24- Population Coincides with Increased NPRA and CXCR4 Expression in Tumoroids….…..…………….……..…..51
Figure 17. Drug Resistance is Correlated with Increased NPRA Expression….…....52
Figure 18. NPRA Inhibition Reduces CXCR4 and CD44+/24- Expression…..…..…..53
Figure 19. NPRA Inhibition Reduces ALDH Activity and Activity of the CXCR4 Promoter………………......…………………………….………....…54
Figure 20. Use of CRISPR/Cas9 to Create an NPRA Knockout Cell Line…...………55
Figure 21. NPRA Knockout Reduced Sphere Formation Ability…………………..…..56
Figure 22. NPRA Knockout in Tumor or Stroma Reduces Tumor Growth………..….57
Figure 23. Actinomycin D Reduces Viability in both Monolayer and Tumoroid……... Cultures of Lung Cancer Cell Lines………………………………………….64
Figure 24. Actinomycin D Reduces Sphere Formation Ability and ALDH Activity in.LLC1 Tumoroids………………………..….......…………….……65
Figure 25. Actinomycin D Acts Synergistically with Telmisartan in Lung Cancer Tumoroids……………………..……………........…..……………….66
Figure 26. Prediction of Mechanisms of Synergy Between Actinomycin D and Telmisartan…….……………………..………………...................……..67
Figure 27. Combination of Actinomycin D and Telmisartan Further Reduces ALDH. Activity and Causes Tumoroids to Undergo Apoptosis..................................................................................................69
Figure 28. Combination of Actinomycin D and Telmisartan Reduces Expression of CSC Genes in Tumoroids………….……..………………….70
Figure 29. Combination of Actinomycin D and Telmisartan Reduces Tumor Growth and Stem-ness In Vivo……………………..………….........……….72
Figure 30. Mechanisms of Canonical vs. Non-Canonical Wnt Signaling.…..…....…..75
Figure 31. RNA-Seq Reveals Gene Expression Changes that Result from…...……... Actinomycin D and Telmisartan Combination Treatment In Vivo…...…….78

vi
Figure 32. Actinomycin D and Telmisartan Combination Treatment Reduces Tumor Growth, Migration, and STAT1/3 Signaling In Vivo……...….……..79
Figure 33. β-catenin Activity is Increased in Tumoroid Cultures and Reduced by…. Actinomycin D and Telmisartan Combination Treatment…….......….…….80
Figure 34. Activation of Canonical Wnt Signaling is Reduced by Actinomycin D. and Telmisartan Combination Treatment…………....…...…………..……..82
Figure 35. Expression and Activation of the Wnt Co-Receptor LRP6 is Reduced by. Actinomycin D and Telmisartan Combination Treatment..................................................................................................83
Figure 36. Actinomycin D and Telmisartan Combination Synergistically Increases Production of Reactive Oxygen Species….……….......……….84
Figure 37. Summary of changes to the Wnt pathway as a result of AD+TS…………..
Treatment………………………...…….………………………………………90

vii
List of Tables
Table 1. Primer Sequences used for Quantitative Real Time PCR……….….........23
Table 2. Table of Cell Lines Used and Their Mutation Status in Key Tumor Promotor/suppressor Genes…………………………………………...…….30
Table 3. Drug Screening with the NCI Diversity Set in the H460 Cell Line...…......61

viii
Abbreviations
2D Two dimensional
3D Three dimensional
ABCG2 ATP biding cassette sub family G member 2
AD Actinomycin D
ALDH Aldehyde Dehydrogenase Activity
ALK Anaplastic lymphoma kinase
AML Acute myeloid leukemia
ANP Atrial natriuretic peptide
APC Adenomatous polyposis coli
APC-Cy7 Allophycocyanin-Cyanine7
ATCC American Type Culture Collection
ATP Adenosine Tri-phosphate
BD Becton Dickenson
Casp-3 Caspase-3
CD133 Cluster of Differentiation 133 (prominin-1)
CD24 Cluster of Differentiation 24
CD26 Cluster of Differentiation 26 (dipeptidyl-peptidase-4)
CD44 Cluster of Differentiation 44 (phagocytic glycoprotein-1)
cGMP Cyclic guanine monophosphate
CK1α Casein kinase 1α
CM-H2DCFDA Chloro-methyl- 2',7'-dichlorodihydrofluorescein diacetate
CRISPR Clustered regularly interspaced short palindromic repeats
CSC Cancer stem cell
CXCL12 C-X-C motif chemokine 12
ix
CXCR4 C-X-C chemokine receptor type 4
DEAB N,N-diethylaminobenzaldehyde
DKK Dickkopf-related protein
DMEM Dulbecco's modified Eagle's medium
DMSO Dimethylsulfoxide
DNA Deoxyribonucleic acid
Dvl Dishevelled
EC Endothelial cell
ECM Extra-cellular matrix
EGF Epidermal growth factor
EGFR Epidermal growth factor receptor
EMT Epithelial to mesenchymal transition
FACS Fluorescent activated cell sorting
FBS Fetal bovine serum
FDA Food and Drug Administration
FGF Fibroblast derived growth factor
FITC Fluorescein-isothiocyanate
FZD Frizzled
GFP Green fluorescent protein
gLuc Gaussia luciferase
GpC Cytosine-guanine
GSK3 Glycogen synthase kinase 3
GTP Guanosine triphosphate
IPA Ingenuity Pathway Analysis
JAK/STAT Janus kinase/Signal transducer and activator of transcription
KO Knock out
LDL Low density lipoprotein
Lgr5 Leucine-rich repeat-containing G-protein coupled receptor 5

x
LLC1 Lewis Lung Carcinoma
LRP6 Low-density lipoprotein receptor-related protein 6
MACS Magnetic activated cell sorting
MAPK mitogen-activated protein kinase
mPEG Methoxy-polyethylene glycol
MSC Mesenchymal stem cell
NFAT Nuclear factor of activated T-cell
NOD SCIID Non-obese diabetic severe combined immunodeficiency
Nos Nitric oxide synthase
NPRA Natriuretic peptide receptor A
NSCLC Non-small cell lung cancer
NSG NOD SCIID gamma
Oct-4 (octamer-binding transcription factor 4
PARP Poly (ADP-ribose) polymerase
PBS Phosphate buffered saline
PKC Protein kinase C
PLA Poly lactic acid
PLAT Plasminogen Activator, Tissue Type
PLGA Poly lactic co-glycolic acid
PPARγ Peroxisome proliferator-activated receptor gamma
qPCR Quantitative reverse transcriptase polymerase chain reaction
RIPA Radioimmunoprecipitation assay
ROR2 Receptor Tyrosine Kinase Like Orphan Receptor 2
ROS Reactive oxygen species
RPMI Roswell Park Memorial Institute medium
SCLC Small Cell Lung Cancer
Sox2 SRY (sex determining region Y)-box 2
Src Proto-oncogene tyrosine-protein kinase Src

xi
STAT3 Signal transducer and activator of transcription 3
TCF Transcription factor (TCF/LEF family)
TGFβ Transforming growth factor β
TME Tumor Micro-environment
TS Telmisartan
U.S. United States
UV Ultraviolet
Wnt Wingless/Integrated
WT Wild Type

xii
Abstract
The failure of lung cancer treatments has been attributed partly to the development of
drug resistance, however the underlying cellular and molecular mechanisms are poorly
understood. It has been suggested that a very small group of specific cells within the
heterogeneous tumors, cancer initiating stem cells (CSC), develop resistance to
treatment, survive and later initiate the growth of new tumors. Due to their pivotal role in
maintenance and relapse of tumors following the acquisition of drug resistance, we
reasoned that novel drugs targeting cancer cells and CSC might provide the most
effective treatments, if not a cure. To this end, we reported a polymeric nanofiber
scaffold on which tumor cells develop into tumor organoids termed “tumoroids” that
resemble in vivo tumors. Herein we report that lung cancer cells grown on the scaffold
acquire CSC properties (aldehyde dehydrogenase (ALDH) activity, sphere formation,
and tumor initiation). We have identified two key pathways that regulate this expansion
namely Natriuretic Peptide Receptor A signaling (NPRA) and Wnt/β-catenin signaling.
Screening of an NCI Diversity set identified a lead candidate drug targeting CSC,
namely Actinomycin D (AD). AD is a well-studied anti-cancer drug, however it is known
to have several drawbacks including high clinical toxicity and the development of
resistance. In order to overcome these drawbacks, we tested AD treatment in
combination with the angiotensin receptor antagonist, Telmisartan (TS) because it has
been reported to reduce fibrosis in tumors allowing them to be more permeable to
drugs. We have found that this novel combination treatment is effective in blocking CSC
xiii
enrichment in the polymeric nanofiber scaffold model. Furthermore, we demonstrate the
effectiveness and synergistic action of the combination treatment in both an in vivo
syngeneic mouse model and xenograft model revealing its ability to reduce tumor
burden. We also provide evidence that β-catenin activation is at least partially
responsible for the increase in CSC seen in scaffold culture and that the combination
treatment reduces tumor burden in part by inhibiting Wnt/β-catenin pathway. This work
establishes the utility of the scaffold-inspired tumoroids as a model system capable of
enriching CSC in vitro or ex vivo for targeted drug screening and personalized medicine.
It also identifies a promising novel treatment targeting CSC that, with further study, may
be useful to improve therapeutic outcomes for lung cancer.

1
Chapter 1
Introduction
1.1 Objective
The objective of this dissertation is to characterize the expansion of lung cancer
stem cells (CSCs) in a novel 3D cell culture environment and explore the molecular
mechanisms by which 1) The 3D cell culture environment contributes to the expansion
of CSCs and 2) A novel combination therapy is able to target and eradicate lung CSCs.
1.2 Motivation
The motivation for this work is to create an in vitro model to expand the rare CSC
population in solid tumors, thus facilitating study of their properties and the screening of
compounds for the ability to inhibit their growth. Using our model we have identified a
combination therapy that is able to inhibit the growth of CSCs and reduce tumor burden.
The work presented herein will describe how this treatment modulates the Wnt/β-
catenin signaling pathway in cancer cells to decrease their self-renewal and proliferation
ability, ultimately resulting in cell death by apoptosis.
1.3 Scope The scope of this project is to achieve a better understanding of the
growth of CSCs in the tumor microenvironment and to identify therapeutic interventions
to stop their growth through the use of a novel 3D in vitro model. These results will be
2
confirmed using in vivo models in order to validate the in vitro findings and confirm the
utility of the novel model system. Lung cancer is currently the world’s deadliest cancer
and new treatments are desperately needed to improve patient care. In the future, the
findings presented herein may be further developed into such a treatment by revealing
mechanisms to target and eradicate tumor initiating CSCs.
1.4 Overview
Chapter 2 will introduce background information on CSCs describing their discovery,
role in the tumor microenvironment, identifying biomarkers, models currently used to
study them, and efforts to target CSCs in the clinic. Chapter 3 will describe in detail, all
experimental designs and methods used. Chapter 4 will explain how a novel 3D cell
culture environment was used to promote stem-ness in lung cancer cell lines in vitro.
Chapter 5 will explain how this in vitro model can be used to study signaling pathways
influencing the growth of CSCs, with a focus on the natriuretic peptide receptor A
pathway. Chapter 6 will introduce a novel combination treatment and characterize its
effects in the in vitro 3D CSC model as well as in vivo mouse models. Chapter 7 will
describe the molecular mechanisms responsible for the treatment’s effects, focusing on
the Wnt/β-catenin pathway. Finally, chapter 8 will summarize all results of this study and
comment on its contributions to the field of CSC research and its implications for
development of more effective cancer treatments.

3
CHAPTER 2
BACKGROUND
2.1 Clinical Significance of Lung Cancer and Unmet Need for Treatment
Lung cancer is currently the second most common type of cancer in men and women
(following only prostate cancer in men and breast cancer in women) [1]. However, lung
cancer is by far the deadliest type of cancer in both men and women causing over
154,000 deaths in 2018 in the U.S. alone [2]. This represents approximately 25% of all
cancer deaths. The five-year survival rate for patients with lung cancer is one of the
lowest of any cancer at 18.6%,, while the overall five-year survival for cancer patients is
66.9% [3]. Lung cancer is typically divided into two main morphological categories;
small cell (SCLC) and non-small cell (NSCLC). Non-small cell is by far the most
common type accounting for 80% - 85% of all lung cancer cases, therefore this project
will focus on models of NSCLC with possible future application to SCLC and other
cancer types. NSCLC is further divided into three main sub-types, adenocarcinoma
(currently 40% of cases), squamous cell carcinoma (30%), and large cell carcinoma
(15%) with the remaining 15% made up of many rare sub-types[4]. While smoking is the
largest risk factor for both small cell and non-small cell lung cancer, age should also be
considered as the majority of diagnoses are made in patients over 65 and very rarely in
patients younger than 45.

4
Standard of care treatments for lung cancer vary depending on sub-type and stage
at the time of diagnosis. There are many options available including surgery, radiation,
chemotherapy, targeted therapies, immunotherapies, and combinations of the above.
Despite this, over half of lung cancer patients die within one year of diagnosis. This high
mortality rate is largely due to the development of drug and radio-resistance within
tumors during treatment. For example, in recent years many drugs targeting common
driver mutations in lung cancer such as those in the epidermal growth factor receptor
(EGFR), anaplastic lymphoma kinase (ALK), MET proto-oncogene receptor tyrosine
kinase (MET), and B-Raf proto-oncogene serine/threonine kinase (BRAF) genes have
been FDA approved and used as personalized second line (after chemo) therapies in
patients harboring these specific mutations. Despite this advancement, the use of these
drugs has only been associated with a 1.5 year average increase in survival [5].
This is because no drug has thus far been found that is immune to the
development of resistance. Due to cancer’s genetic instability and composition of a
heterogeneous population of cells, new mutations are able to arise in response to
treatments allowing cells containing them to continue to grow and expand [6]. One
specific cell population in the heterogeneous tumor has increasingly come into focus as
the cells responsible for drug resistance and tumor recurrence in patients following
treatment; the cancer stem cells (CSC). CSCs possess unique properties derived from
their genetic and epi-genetic make-up that allow them to both escape treatment and
initiate tumors. There is a great unmet need to develop novel treatments specifically
targeting CSCs in order to overcome drug resistance and prevent patient relapse.

5
2.2 Definition and History of CSCs
CSCs have been characterized, ultimately, as a type of cell with the ability to initiate the
growth of a tumor. They were originally discovered in acute myeloid leukemia (AML)
patients via this tumor initiation property in 1994 by Lapidot et al. and tumor initiation
ability remains the “gold standard” for verification of putative CSC populations to the
present day. They are further defined as having two key attributes; self-renewal, and
differentiation (Figure 1). This means that they can both divide symmetrically to produce
more CSCs as well as asymmetrically to produce the non-stem cells that make up the
bulk of the tumor. As shown in Figure 1, this mechanism allows CSCs that survive
treatment to re-populate tumors with differentiated non-CSCs.
Figure 1. Role of CSC in the Tumor Microenvironment Model of the mechanism by which CSC can mediate the re-growth of tumors following treatment through their self-renewal and differentiation properties.

6
These properties were also identified by the initial studies in AML as only cells
possessing certain markers (CD34+ CD38-) were found to be able to self-renew and
thereby establish cancer in mice [7]. When these populations were later isolated from
the mice and examined they were found to contain a mixture of CD34+CD38- and
CD34+ CD38+ revealing the CSC’s ability to differentiate. These studies also
highlighted the rarity of CSCs within the total population of cancer cells. They were
found to represent about 1 in every 250,000 cells in patient samples. Although this
description of CSCs in AML was groundbreaking, it was not altogether unbelievable
since AML is a cancer arising in hematopoietic stem cells, so it follows that some
cellular mechanisms for self-renewal and pluripotency could be dysregulated or re-
activated in this cancer.
On the other hand, the case for the role of CSCs in solid tumors, especially those of
epithelial origin was not so easily made. First, simply finding stem-like cells within
tumors does not equate to finding CSCs since it is known that mesenchymal stem cells
(MSCs) hone to tumors and play an important role in the microenvironment by
supporting tumor growth [8, 9]. Tumor infiltrating MSCs were implicated in supporting
the growth of CSCs as well [10, 11]. Unlike CSCs, MSCs do not have the ability to
initiate tumors on their own. Secondly, the lack of any universal marker for CSCs
caused much debate among researchers as to whether specific cells isolated by any
one group were truly CSCs. This challenge was compounded by the fact that many
different models were used which sometimes gave inconsistent results. Doubt was even
cast on the “gold standard” of CSC verification, tumor initiation in mouse models, due to
the fact that experimental factors such as enzymatic digestion protocols, growth factor

7
stimulation, and differences in genetic background of mice strains made results difficult
to replicate between groups [12, 13].
Over the years, however, evidence has continued to accumulate for the tumor-
initiating role of cancer cells with stem like properties within many solid tumors. One key
piece of evidence is the use of lineage tracing experiments to overcome the limitations
inherent to xenograft tumor initiation models, thus revealing how single cells possessing
a functional marker such as leucine-rich repeat-containing G-protein coupled receptor
(Lgr5) can expand to create a large proportion of the resulting tumor [14]. Genetic
lineage tracing also allows for the observation of expansion of cell populations in situ
without disturbance by linking recombinase-reporter constructs to a marker gene of
interest such that all daughter cells arising from a single parent will express the same
reporter. While xenograft tumor initiation experiments had previously revealed that
CSCs were more likely to be found in sub-populations expressing certain markers,
lineage tracing has allowed researchers to pinpoint specific CSC cells and observe their
clonal expansion as they grow within tumors [14-16].
These experiments have added convincing support for the role CSCs play in the
growth of solid tumors, but they are also currently revealing new insights into CSC
plasticity and the dynamics of cell populations within tumors. They have found that
clonal expansion of cancer cells varies depending on cancer type, stage, and treatment.
Showing that in some cases dominant clones arise that out compete others to
eventually compose the bulk of the tumor in a steep hierarchy where small numbers of
dividing CSCs feeds the bulk differentiated tumor (Figure 2). In other cases (such as
melanoma) many cells within the tumor have the self-renewing property needed to

8
proliferate resulting in a tumor with less hierarchy and much more genetic diversity
(Figure 2) [14, 17, 18]. Evidence for CSC plasticity arises from studies of targeted
destruction of cells with CSC markers (Lgr5) and the observation that cells previously
thought to be differentiated were able to re-gain expression of CSC markers and the
ability to self-renew [15, 19, 20]. Wnt/β-catenin signaling has been implicated in this
process but much work remains to be done [21].
Figure 2. Proliferation and Differentiation of CSCs Create a Hierarchy of Lineages Within Tumors
Application of the CSC model reveals differences in hierarchical organization of tumor cell populations which can vary depending on cancer type.

9
2.3 CSCs Clinical Relevance
CSCs have shown to be resistant to drug treatments and cause patients to relapse by
initiating the growth of new tumors, so an understanding of CSC development and
expansion is critical to understanding drug resistance and metastasis. For these
reasons, treatments targeting CSCs remain a highly sought after yet elusive goal. CSC
populations have thus far been characterized in patient tumors of nearly all cancer
types, each with their own sets of identifying biomarkers. These include lung, breast,
liver, colon, prostate, bladder, glioma, leukemia, and melanoma among others [22-24].
Examples of markers that have been used to identify CSCs directly in patient samples
include aldehyde dehydrogenase (ALDH)+ and CD133+ cells in NSCLC, CD44+/24-
and ALDH+ cells in breast cancer, CD34+/38- in AML, and CD26+ and Lgr5+ cells in
colon cancer [20, 25-29].
In the current clinical environment where treatments to target CSCs are still in
development, these CSC markers have been successfully used as prognostic markers
to evaluate a patient’s disease and their response to treatment [26, 29, 30]. The
success of these molecules as prognostic markers further highlights the need for CSC
targeted therapies. Clinicians have found, independent of the underlying CSC
hypothesis, that patient’s whose tumors contain more CSC markers tend to have poor
outcomes and when CSC markers are lower patients have better outcomes.
2.4 Properties and Identification of CSCs
In recent years, evidence has been steadily accumulating in support of the roles
CSCs play in tumor growth, metastasis, epithelial to mesenchymal transition (EMT), and
10
drug resistance [23, 31-35]. CSCs have been found to be resistant to drug treatment
either by reduced metabolic activity/entry into a non-dividing quiescent state which
confers resistance to genotoxic chemotherapy or by increased activity of drug efflux and
breakdown pathways [34, 36, 37]. In addition, CSCs have frequently been associated
with EMT that occurs as a precursor to metastasis leading them to also be found as
circulating tumor cells [26, 31, 36, 38, 39]. A common marker for CSCs with a role in
metastasis is C-X-C chemokine receptor type 4 (CXCR4). Its expression allows cells to
migrate toward its ligand, CXCL-12, which is produced by bone marrow stromal cells
among others and is commonly associated with metastasis to bone [40-42].
A universal biomarker for CSCs has yet to be discovered, however several cell
surface markers, as well as functional assays, have been accepted as biomarkers for
CSCs both in vitro and in vivo. For example, CD133 expression and the activity of the
drug efflux pump ABCG2, as determined by side population assay, have become
popular CSC markers in lung cancer, CD44+/CD24- cells are generally accepted as
CSCs in breast cancer [28, 31, 43-46]. In addition, enrichment of CSCs can be shown
by an increase in the expression of classical stem cell related transcription factors
(Sox2, Oct4, and Nanog) conferring self-renewal and pluripotency [40, 47-49]. Activity of
the ALDH enzyme, which is also active in normal adult stem cells, has been used to
identify CSCs in multiple cancer types including breast, lung, and melanoma [25, 50-
53]. Despite the identification of these markers, the study of CSCs has been limited by
their rare occurrence in tumors, which can be as little as 0.05-1.5% [54, 55].
Because no universal marker exists, the “gold standard” for identification of CSC
enrichment currently remains their ability to initiate xenograft tumors in mice at very low

11
dilutions [23, 56]. Even this assay is not without its limitations, as tumor initiation ability
has been shown to vary with the genetic background of the mouse used, in addition to
the fact that most models using human tumor explants lack the immune component of
the tumor stroma. Nevertheless, in vivo tumor initiation is ultimately able to identify the
presence of CSCs in a given cell population through their ability to form a tumor where
non-CSCs are not able to do so.
2.5 Drugs Targeting CSCs
Many strategies have been used to try and target CSCs. Some such examples are
targeting developmental pathways (Wnt, Notch, hedgehog) that are re-activated in
CSCs with novel chemical inhibitors, targeting the oxidative/glycolytic metabolism that
CSCs use for energy generation, and targeting stromal components that stimulate CSC
growth such as cancer associated fibroblasts’ release of TGFβ or tumor associated
macrophages [23, 57-59]. However, none of these strategies have been translated into
a successful clinical treatment, although they are still being actively pursued.
Despite numerous clinical trials, many of the novel agents targeting
developmental pathways fail as drugs because they are toxic to the normal adult stem
cells that rely on these pathways and that are required for basic bodily functions [60]. In
addition, because these pathways often contain complex regulatory mechanisms and
redundancies it is unlikely that any single agent will ultimately be effective in targeting
CSCs. Cancer cells will continue to develop new mutations and gene expression
patterns to route around the particular signaling molecule that is inhibited. Therefore,
interest is shifting towards combination therapies.

12
Through their ability to target multiple pathways or multiple elements of the same
pathway simultaneously, combination therapies may prevent any single new mutation
that arises from conferring drug resistance. This leads to the present challenge of
finding drug combinations that are effective in targeting CSCs without being overly toxic
to healthy cells. While work remains ongoing, the development of improved in vitro and
in vivo models (such as the 3D scaffold presented herein) to facilitate drug screening
will be vital in the search for effective combination therapies.
2.6 Concluding Remarks
In conclusion, sufficient evidence has accumulated not only for the existence of
CSCs in solid tumors but also their critical roles in tumor growth, drug resistance, and
metastasis. Therefore, the development of novel therapies to target CSCs holds great
promise to improve patient outcomes. To efficiently study CSCs, novel in vitro models
are desperately needed to overcome the fact that CSCs make up a very small fraction
of cancer cells. Furthermore, the molecular mechanisms driving their expansion remain
incompletely understood. We hypothesize that a fibrous scaffold 3D culture environment
will promote CSC expansion through enhanced cell-cell and cell-matrix interactions
creating a more representative model of CSC growth by eliminating artificially
introduced reprogramming factors and growth factors. We further hypothesize that drug
treatments targeting CSCs can be identified using this in vitro model. They will also be
more effective in reducing tumor burden than traditional chemotherapies and targeted
therapies through elimination of the self-renewing cell population that drives tumor
growth and the development of drug resistance.

13
CHAPTER 3
GENERAL METHODS
This section presents the general molecular biology techniques used during the study.
In vitro Studies:
3.1 Assay for Reactive Oxygen Species
To assay for the production of reactive oxygen species (ROS) Cells were plated in
monolayer culture 24hr prior to treatment. LLC1 cells were treated with 0.4nM
Actinomycin D, 1µM Telmisartan, or the combination for 48hr prior to staining. The dye
CM-H2DCFDA was used according to manufacturer’s instructions. Briefly, cells were
stained in PBS containing 5µM CM-H2DCFDA at 37°C for 20 minutes. Following
staining cells were washed in PBS. Staining was assayed immediately using
fluorescence microscopy with a GFP filter. Bright field images were also acquired for
reference. Staining was also assayed by flow cytometry (BD FACS Canto/Diva).
3.2 Beta Catenin Activity Assay
Active β-catenin was assayed in monolayer and 3D cultures using a Cignal TCF/
Luciferase reporter system (Qiagen). Cells were transfected with the control or reporter
plasmid using Lipofectamine 3000 reagent on day 3 of 3D culture (Thermo Scientific)
and treated with drugs at stated concentrations 48 hours after transfection. Luciferase

14
activity (firefly reporter and renilla transfection normalization control) was assayed using
the Dual Glo luciferase assay (Promega) in a BioTek Synergy H4 plate reader after 48
hours of treatment.
3.3 Cell culture
Polymeric nanofiber scaffold was prepared as previously described [61]. Briefly, a
chloroform/dichloromethane solution containing mPEG-PLA and PLGA polymers was
electrospun using a spraybase instrument at 20kV at a flow rate of 0.5mL per hour to
create the sheet of randomly aligned fibers. Scaffolds were sterilized in ethanol, washed
three times with PBS, additionally sterilized under UV light for 45 minutes, and then
washed in cell culture media. Cells were seeded onto scaffolds in appropriate culture
media (DMEM or RPMI containing 10%FBS and 1% penicillin/streptomycin) in standard
cell culture well plates. Cell lines were obtained from the American type culture
collection (ATCC). Drug tolerant H1975 were created by continuous exposure to
Lapatinib in culture at a concentration of 7.5µM for 20 days. IC50 values for Lapatinib of
parental H1975 and drug tolerant H1975 were compared to verify drug tolerance using
the CellTiter-Glo. Cells were cultured in a humidified incubator at 37⁰C in a 5% CO2
atmosphere (Thermo Fisher). 3D Tumoroid formation was assessed using fluorescent
microscopy (Olympus BX51) after nuclear staining with Nuc Blue dye (Thermo
Scientific).

15
3.4 CRISPR/Cas9
Plasmids containing CRRISPR/Cas9 constructs as well as scrambled control were
purchased from Genecoepia. Cells were transfected using Lipofectamine 3000
according to manufactuer’s instructions. Transfected cells were selected using 5µg/mL
puromycin and plated at a concentration of 100 cells/mL to obtain colonies composed of
individual clones. These colonies were expanded in culture for downstream
experiments.
3.5 CXCR4 Promotor Activity Assay
LLC1 cells were transfected using lipofectamine with a CXCR4 promoter reporter
plasmid (MPRM14968-PG04, Genecopia) (1391 bp) containing a luciferase gene as
reporter for CXCR4 activity and a secreted alkaline phosphatase gene as a control for
transfection. Luciferase activity was assayed in the presence or absence of NPRA
inhibitor using a luciferase based promotor reporter assay (Gluc-ON). Results were
normalized for transfection efficiency using secreted alkaline phosphatase control and
the Secrete-Pair assay kit (Genecoepia) Cells were stimulated with 1μg/mL
lipopolysaccharide (LPS) and treated with 40μM Anantin.
3.6 Flow cytometry
All flow cytometry experiments were performed using a Becton Dickenson (BD) FACS
Canto II system at the University of South Florida COM Fred Wright Jr Flow Cytometry
Core. Cell sorting was performed on a BD FACS Aria system at the Flow Cytometry

16
Core at the H. Lee Moffitt Cancer Center & Research Institute. ALDH assays were
performed using the ALDEFlour kit (Stem Cell Technologies) according to manufactures
instructions. Controls Treated with Diethylaminobenzaldehyde (DAEB) were used to
distinguish ALDH positive cells from background fluorescence. Antibody staining to
determine CD44 and CD24 expression was performed using FITC or APC-Cy7
conjugated anti-CD44 and Alexa 647 conjugated anti-CD24 from BD. Cells were
stained on ice for 25 minutes in FACS buffer consisting of PBS containing 5% FBS and
1mM EDTA. Dead cells were identified and excluded using 4′,6-diamidino-2-
phenylindole (DAPI) staining. Analysis was done in BD FACS Diva software.
3.7 IC50 Assay
IC50 of drug treatments in 3D or monolayer culture was determined by Cell Titer Glo
Assay (Promega) Culture media was changed to media containing drug dilutions on day
4 of culture and viability assay was performed after 48 hours on day 6 of culture. Cell
Titer Glo reagent was added and incubated according to manufacturers’ instructions
and luminescence was measured in a white well-plate in a Bio-Tek Synergy H4 plate
reader. Actinomycin D was obtained from Acros Organics and Telmisartan was
obtained from Selleckchem. Dose response curves were plotted and IC50 values were
estimated using Graph Pad Prism software.

17
3.8 Immunofluorescence Staining
Immunocytochemistry for Nos2 (Cell Signaling #D6B6S) was performed on LLC1
tumoroids cultured for 6 days on scaffold. Tumoroids were fixed and permeablized on
scaffold prior to staining.
3.9 Magnetic Cell Separation
CD24 expressing cells were depleted from A549 cell cultures using magnetic cell
separation columns and CD24 antibody conjugated magnetic beads (Miltenyi Biotech)
according to manufactures’ instructions. Depletion was verified using flow cytometry as
stated above.
3.10 qPCR Array
Gene expression analysis was performed on LLC1 3D cultures using the cancer stem
cell RT2 PCR profiler array (Qiagen). RNA was isolated as stated above and processed
according to manufactures’’ instructions. Array plates were read in a Bio Rad CFX-384
thermocycler and analysis was performed using the Qiagen Gene Globe Data Analysis
Center web application.
3.11 Quantitative Reverse Transcriptase PCR
Total RNA was isolated from tissues or cell pellets using RNeasy columns (Qiagen)
cDNA synthesis was performed using the Maxima cDNA synthesis kit (Thermo
Scientific) according to manufacturer protocol. Real time analysis was performed using

18
a SYBR Green assay (Genecoepia) in a Bio Rad CFX-384 thermocycler using primers
obtained from Integrated DNA Technologies. (See Table 1 for primer sequences). Data
analysis was performed in Bio Rad CFX Maestro software with a significance threshold
of p≤0.05.
3.12 Transcriptome Profiling Using RNA Quantification Sequencing
Transcriptome Profiling by RNA-Seq was performed by our collaborator Dr.
Manoj Bhasin. RNA derived from LLC1 tumors was subjected to next-generation
sequencing (NGS) to generate deep coverage RNASeq data. For each treatment group,
sequencing was performed on 2 biological replicates. Sequencing libraries of Poly A
selected mRNA were generated from the double-stranded cDNA using the Illumina
TruSeq kit according to the manufacturer's protocol. Library quality control was checked
using the Agilent DNA High Sensitivity Chip and qRT-PCR. High quality libraries were
sequenced on an Illumina HiSeq 2000. To achieve comprehensive coverage for each
sample, we generated ~20-25 million paired end reads for each sample.
RNASEQ data analysis:
The Raw sequencing data was processed to remove any adaptor, PCR primers
and low quality transcripts using FASTQC and fastx/cutadapt. These provide a very
comprehensive estimate of sample quality on the basis of read quality, read length, GC
content, uncalled based, ratio of bases called, sequence duplication, adaptor and PCR
primer contamination. These high quality, clean reads were aligned against human
genome using hisat2. We used GRch38 human genome assembly as reference

19
genome for alignment. Gene expression measurement was performed from aligned
reads by counting the unique reads using featureCounts algorithm. The read count
based gene expression data was normalized on the basis of library complexity and
gene variation. The normalized count data was compared among groups in paired
manner using limma models to identify differentially expressed genes. The differentially
expressed genes were identified on the basis of raw P value and fold change. Genes
were considered significantly differentially expressed if the multiple text corrected p-
value was <.05 and absolute fold change >2.
Functions, Pathway and regulatory network analysis
Ingenuity Pathway Analysis (IPA, Qiagen) was used to identify the pathways that are
significantly affected by significantly differentially expressed genes. The knowledge
base of this software consists of functions, pathways and network models derived by
systematically exploring the peer reviewed scientific literature. A detailed description of
IPA analysis is available at the Ingenuity Systems’ web site (http//www.ingenuity.com).
It calculates a p-value for each pathway according to the fit of users’ data to the IPA
database using one-tailed Fisher exact test. The pathways with p-values <0.05 were
considered significantly affected. Further systems biology analysis was performed using
upstream regulators enrichment approach to identify upstream transcriptional regulators
that can explain observed transcriptome changes. Regulatory analysis help in
identifying significantly activated or inhibited transcriptional regulators on the basis of
upregulation or downregulation of its target genes.The significance of transcriptional
regulators activation/inhibition was determined using one-tailed Fisher‘s Exact test. The

20
regulators with a P value <.01 and absolute Z-score 2 were considered statistically
significant.
3.13 Sphere Formation Assay
Sphere efficiency was determined using sphere formation assays. Sphere media was
prepared as previously described [62]. Cells were plated at a density of 2 cells per µL in
sphere media in low attachment plates (Corning). Drugs were added 24 hours after cell
plating and spheres were imaged using bright field microscopy after 6 days of culture.
Sphere size and diameter was measured using ImageJ software statistical analysis was
performed in Graph Pad Prism software. Sphere efficiency is represented as the
percentage of cells seeded that were able to proliferate under low attachment conditions
and defined as the number of spheres counted at endpoint divided by the number of
cells seeded times 100.
3.14 Western immunoassay
Immunoassays for relative protein abundance were performed using Wes according to
manufacture instructions (Protein Simple) Total protein was isolated using RIPA buffer
and protein concentration was determined by Bradford assay. Caspase3 (Cell Signaling
#9662p) PARP (Cell Signaling #9542) β-actin (Sigma #A2228).

21
3.15 Wnt Pathway Phospho-Antibody Array
LLC1 subcutaneous flank tumors were treated and collected as described above.
Tumors from each treatment group were snap frozen on dry ice and stored at -80C.
Protein was isolated using an antibody array assay kit (Full Moon Biosystems) and
loaded onto Wnt phospho explorer array slides (Full Moon Biosystems) per
manufactures’ instructions.
In Vivo Studies:
3.16 Animal Experiments
C57/Bl6 mice were purchased from Envigo and NSG immunocompromised mice
(NOD.Cg-Prkdcscid Il2rgtm1Wjl/SzJ) were purchased from Jackson Laboratory.
Subcutaneous tumors were grown in the flanks of mice by injecting one million LLC1
monolayer cells, 100,000 LLC1 3D cultured cells, or 5 million A549 cells. Tumors were
allowed to grow and treatment was started when they became palpable (2-3mm
diameter). Drugs were injected intratumorally once every 3 days at the concentrations
treated with 50µg/kg Actinomycin D (AD), 1mg/kg telmisartan (TS), or combination.
Drug solutions were made in PBS with 1%DMSO and this solution was used as vehicle
control. Tumors were collected when controls reached 10mm in diameter. To obtain
single cell suspensions of tumors the tissue was digested using a mouse tumor
digestion kit and Gentle MACS instrument (Miltenyi Biotech) according to manufacturer
instructions. Animals were housed in the University of South Florida comparative

22
medicine facility at the Morsani College of Medicine and all protocols were reviewed and
approved by the USF institutional animal care and use committee.
General Statistics:
3.17 Statistics
Experiments have been repeated at least twice. Statistical significance for each
experiment was determined using Analysis of variance (ANOVA) and the Tukey post
hoc test, p<0.05. Calculations were performed and graphs plotted using Prism 6.0
software (Graphpad Software, San Diego, CA, USA). Graphs of results show the mean
and error bars depict the average, +/- standard deviation.

23
Table 1. Primer Sequences used for Quantitative Real Time PCR

24
CHAPTER 4
Culturing Cancer Cells on the 3D Scaffold Increases Their Stemness
4.1 Introduction
Metastatic and drug resistant cancers are responsible for the vast majority of cancer-
associated morbidity and mortality[24, 63]. Therefore, novel strategies to target these
aggressive forms of the disease are desperately needed. CSCs, which comprise a
minority (<1%) of the population of cells within tumors, possess self-renewal and multi
lineage differentiation potential and are thought to be responsible for drug resistance in
cancers. CSCs can be identified using several methods including the use of surface
markers, expression of transcription factors, and functional assays. However, the
populations identified by these methods can vary greatly among the types of
experimental model used and may or may not represent distinct cell phenotypes[64-70].
It has been suggested that the tumor microenvironment (TME) plays a pivotal role in
CSC proliferation, differentiation, and contributes to development of drug resistance.
However, the precise cellular and molecular mechanisms responsible remain to be
elucidated and the development of an adequate in vitro model for such analyses
remains a critical unmet need. To this end, the broad long-term goal of this project is to
develop an in vitro model replicating in vivo tumor matrix and cell-cell interaction that
promotes proliferation of the CSC population. Then to use this model first, to investigate
the molecular mechanisms responsible for the expansion of drug resistant and

25
metastatic CSCs, and secondly to identify a novel therapeutic combination treatment to
target CSC.
This work is based on past developments in our lab. A 3D polymeric nanofiber
scaffold as a substrate for cell growth was developed, which provides structural support
to the cells partially replicating the function of extracellular matrix [61]. The scaffold
developed in our lab is an electrospun mat of fibers consisting of a mixture of two
polymers; methoxy-polyethylene-glycol(poly lactic acid) copolymer and polylactic-co-
glycolic-acid. Previous studies from our Lab indicate that cells cultured on the scaffold
exhibit some altered phenotype compared to cells grown as a monolayer resulting in
increased resistance to anti-cancer drugs as well as increased expression of EMT
markers; two important traits of CSCs [61]. This scaffold functions to increase cell-cell
and cell-matrix interactions compared to 2D culture, thus resulting in the growth of 3D
tumor organoids referred to as “tumoroids”. The availability of this system has led to the
following hypotheses: (i) When cells are cultured on the scaffold their expression of
genes and proteins are expected to be altered to a profile more similar to that found
within primary tumors where CSCs develop. Profiling of the molecular changes that take
place when cells are cultured on scaffold could lead to insight into the mechanism by
which CSCs develop in vivo and identify new chemotherapy targets for CSCs. (ii) This
3D culture system may serve as a platform to enrich rare CSC population for
downstream mechanistic studies of the factors influencing CSC development and for
drug screening. Therefore, this 3D tumoroid model will be used to study and further
define the mechanisms by which CSC proliferate and their population expands. We are
proposing to expand the CSC population in culture and identify the molecular

26
mechanisms responsible for this expansion. To accomplish this, we will determine
changes in cell phenotype that are caused by culture on 3D scaffold and whether these
changes represent an enrichment of CSCs. Mouse and human lung cancer cell lines
will be tested for changes in multiple markers and functional assays, including
expression of transcription factors and stem cell surface markers. We will determine
whether these changes represent an enrichment of CSCs by testing for known CSC
cellular functions and confirm these results in a mouse model where putative CSCs will
be tested for enhanced tumor initiation.
3D cultures provide significant advantages over 2D to study CSCs. The
significance of the role of CSC populations in disease progression is becoming
increasingly recognized by researchers. However, the characteristics of CSCs remain
poorly defined [11-14]. CSCs identified by different methods have been found to
behave in different ways and conflicting reports have been published claiming that the
various identification methods do or do not identify a common population [1, 4, 15].
Many of these studies have been carried out in a 2D culture environment or in
suspension culture where no extracellular matrix or other stromal environment is
present [15-18]. Cells grown in these types of culture environments will adapt to the
foreign conditions by altering their gene expression, therefore becoming less
representative of in vivo tumors and less relevant models of disease [19, 20]. The fact
that CSCs can make up as little as a fraction of one percent of the total cells grown in
2D cultures means they are difficult to isolate and even more difficult to maintain in
culture once isolated. In order to more effectively study CSC populations, a culture
environment that supports their growth and development is needed. To overcome the

27
fact that CSCs are such a small percentage of the tumor population, methods have
been developed to expand CSCs in culture so they can be studied without interference
from the differentiated cells that make up the bulk of tumors. These include artificial
manipulations such as transforming cells with classical stem cell transcription factors
(Sox2, Oct-4, c-Myc) or by exposing them to growth factors known to induce EMT
(Wnt5a, TGFβ), as well as by changes to the structure of the culture environment such
as hanging drop, suspension culture, or growth on hydrogels with or without
extracellular matrix components [39, 71-74].
Of these, the most commonly used is suspension culture where anoikis resistant
cells are grown into floating “tumorspheres” in the presence of the growth factors
epidermal growth factor (EGF) and fibroblast growth factor (FGF) [62, 75, 76]. This has
been shown to increase CSC marker expression and traits in functional assays. The
ability for cells to survive in the absence of attachment is an indicator of the latent CSC
potential within a given parental population. However, this technique has
disadvantages, including the low CSC number obtained and re-differentiation once cells
are removed from the growth factor containing tumorsphere media [22].
Synthetic culture substrates such as microspheres or fibers made from poly-
caprolactone or poly-lactic co-glycolic acid have been used although much less
frequently [61, 74]. These have the advantages of large surface area for cell growth as
well as porosity to oxygen and nutrients, which have shown (by our lab as well as other
groups) the ability to induce EMT and increase expression of stem cell transcription
factors. Finally, CSCs have been directly isolated from in vivo tumors (either patient or
mouse model) through methods such as fluorescent or magnetic cell separation based

28
on CSC marker molecules, but these methods have a high cost and result in low
numbers of CSCs obtained [22]. It is these advantages and published results that have
motivated the present work developing, studying, and validating a synthetic 3D scaffold
model for CSC expansion and CSC targeted drug screening.
The majority of work in the 3D cell culture field is currently focused on hydrogels
or matrigel [11-15]. While these are important and useful advances, this type of material
does have some drawbacks that we aim to overcome through the development of a
fibrous scaffold environment. Gels are relatively permeable to solutes, but fibrous
scaffolds are inherently more permeable allowing for better diffusion of nutrients and
growth factors. Many gels have components of biological origin which can induce batch
variation and create a complex environment that is not strictly defined [16]. Gels are
also uniform in structure, whereas fibrous scaffolds can be designed with different pore
sizes and fiber diameters to create micro structures for cells to interact with. The
contribution of a 3D fibrous scaffold culture environment is significant because it will
provide an in vitro platform to study CSC origin, development, and cell-cell interactions.
It will also reveal the mechanisms by which the structure of the extracellular
environment can influence CSC proliferation.
CSCs have been identified in most types of cancer including breast, prostate,
renal, colon, pancreas, and lung [77-80]. However, they have only been extensively
studied in breast cancer models and even within that narrow field controversy still exists
regarding the optimal method to identify the population and whether the diverse
methods available identify a common population [64, 81]. The work presented here is
innovative, because we aim to generate a novel 3D culture system for CSC enrichment

29
and use it to determine the factors and signals that contribute to CSC proliferation. This
work will allow CSC populations isolated by different methods to be cultured and studied
more easily, thus leading to better characterizations and refinement of in vitro cancer
models, as well as identification of drug targets to limit CSC development in vivo.
In lung cancer, the five year survival rate is less than 10-20% for NSCLC and 5%
for SCLC [82]. This is due to the high rates of metastasis and drug resistance [83, 84].
The CSC population in lung cancer, which is likely responsible for these traits, has not
yet been definitively characterized. A 3D fibrous scaffold material has been chosen to
study this population because of the advantages it offers over traditional monolayer
culture and mouse models [85]. Because monolayer cultures lack the 3D structure of
the ECM, cell behavior is altered and therefore results generated do not reliably
translate to the clinic [86, 87]. Humanized mouse models do a better job of
recapitulating in vivo human cell behavior but they are very expensive and can be more
difficult to work with. For example, removing a single cell type from tumors or creating
cell type specific knockouts is very time consuming and technically challenging [86, 88].
The scaffold culture model will be easier to manipulate in a controlled in vitro
environment while still providing the 3D structural complexity to replicate the in vivo
environment. When cells are cultured on the scaffold they grow as “tumoroids”. We
have also found that cancer cells cultured on the scaffold exhibit enhanced resistance to
multiple anti-cancer drugs and increased expression of some CSC markers.[85].
However, the extent of these phenotypic changes is unknown.
We hypothesize that expansion of the CSC population plays a central role in drug
resistance and metastasis. We further hypothesize that culture on the scaffold will lead

30
to an enrichment of CSCs with enhanced proliferative and metastatic properties. The
enriched CSCs within cell lines will be identified by increased expression of CSC
markers, as well as increased tumor initiation ability in vivo. These hypotheses will be
tested using the 3D platform developed in our lab that has the potential to enrich the
populations of metastatic and drug resistant CSCs in lung cancer cell lines. The first
step towards identification of a true population of lung CSCs is to determine what
molecular changes take place when cells are cultured on the scaffold. We aim to more
fully characterize the phenotypic changes that occur when human lung cancer cells and
biopsies of subcutaneous murine tumors are cultured on the scaffold. Lung cancer cell
lines containing mutations in their epidermal growth factor receptor (H1975 and H460)
and also KRAS (H460) will be used in addition to EGFR wild type cell lines
human(A549) and mouse (Lewis lung carcinoma 1 (LLC1)) to represent a range of
NSCLCs with differing growth characteristics and tendencies to develop drug
resistance. Mutation status of the cell lines used is summarized in Table 2.
Table 2. Table of Cell Lines Used and Their Mutation Status in Key Tumor Promotor/suppressor Genes

31
It is expected that culture of lung cancer cells on scaffold will cause significant
changes to cell morphology and phenotype compared to monolayer culture. The study
of altered gene expression seen in scaffold culture is expected to help identify key
signaling cues that support CSC proliferation. This will provide new insights into the
mechanism by which CSCs develop in vivo, as well as a platform for future studies on
isolated or enriched CSCs. Our lab is uniquely positioned to carry out this research
because we have previously developed the 3D fibrous scaffold that we will use for cell
culture. We also have expertise working with the required experimental protocols and
tools, support from the USF flow cytometry core, and extensive experience working with
mouse models of lung and prostate cancer. Upon completion of this project, we will
achieve a better understanding of the similarities and differences in CSC composition
Figure 3. Model of CSC Enrichment by 3D Tumoroid Culture

32
and behavior in different cell lines, as well as tumor biopsies. We will gain new insight
into the signals that influence CSC propagation, which may be useful in identification of
drug targets. We will have created and validated a novel culture environment that
promotes the growth of CSCs to be used in future studies.
4.2 Results
To establish the tumoroid model of cancer cell growth on our 3D scaffold material we
began by ensuring that mouse and human lung cancer cell lines would form tumoroids
when cultured on the scaffold. First, the properties of the 3D material (fiber diameter,
porosity, uniformity of fibers) was confirmed to be consistent with batches used in
previous work by scanning electron microscopy. (Figure 4A) Once the production of
uniform material was confirmed, mouse (LLC1) and human (H1975, A549, H460, and
H1299) cell lines were seeded onto the scaffold in cell culture media and imaged using
fluorescent microscopy after 6 days of culture to assess tumoroid formation. (Figure 4B-
F)
In figure 4B, LLC1 were stained with the cell membrane stain, Calcein AM (green),
and in figure 4 C-F human cell lines were stained with the nuclear stain, NucBlue (blue).
In all cell lines, 3D tumoroids in scaffold cultures were roughly 50-200µm in diameter on
day 6 of culture. To determine whether cells cultured as 3D tumoroids acquired CSC
properties we collected tumoroids from LLC1 and A549 cultures on day 6 and assayed
their expression of CSC related genes compared to monolayer culture using
quantitative real time PCR. (Figure 5) In LLC1 tumoroids we found the stemness
transcription factors Sox2, Oct4, and Nanog to be elevated along with the aldehyde

33
dehydrogenase gene, aldh1a1. In A549 tumoroids we also found expression of Sox2
and Nanog to be elevated along with the CSC surface marker CD44, although only the
increase in CD44 was statistically significant.
Figure 4. Lung Cancer Cell Lines Cultured on 3D Scaffold form Tumoroids
A. Scanning electron micrograph depicting fibrous structure of the 3D scaffold. B. LLC1 cells grown as tumoroids on the 3D scaffold for 6 days stained with the membrane stain calcein AM (green) C-F. Human NSCLC cell lines grown as tumoroids on the 3D scaffold for 6 days stained with the nuclear stain NucBlue.

34
In addition to cell line derived tumoroids we have previously described the utility
of the 3D scaffold to culture biopsy derived tumoroids [61]. This method has the
advantage of including stromal cells such as cancer associated fibroblasts and myeloid
derived suppressor cells in the tumoroids, which is a more accurate representation of
the in vivo tumor/stroma microenvironment. Using the mouse LLC1 cell line, which is
syngeneic to the C57 BL/6 mouse strain, facilitates the collection of biopsies from
subcutaneous tumors. Fine needle aspirate biopsies were collected from LLC1 tumors
Figure 5. Expression of CSC Marker Genes is Increased in Lung Tumoroid Culture
LLC1 or A549 cells were cultured as monolayer or on scaffold for 6 days. RNA was isolated using affinity column (Qiagen), and cancer stem cell marker gene expression in monolayer vs scaffold cultures was assayed by qPCR. N=3 *p≤0.05.

35
when they reached 7mm in diameter. Cells obtained from LLC1 biopsies were then
cultured on monolayer or scaffold for six days. These cultures were subsequently fixed,
permeabilized, and immuno-stained for their expression of Oct4 or Sox2 transcription
factors (Figure 6). In agreement with the qPCR data in figure 6, LLC1 biopsy tumoroids
stained more intensely for both Oct4 and Sox2 than LLC1 biopsy monolayer cells.
Due to the fact that we had observed increased CD44 expression in A549
tumoroids by qPCR and that the CD44+/24- population is known to possess CSC
properties in some cancers, we next assayed both A549 biopsy tumoroids and H460
tumoroids for their expression of CD44 and CD24 by flow cytometry. A549 biopsies
Figure 6.Expression of CSC Transcription Factors is Increased in LLC Biopsy Derived Tumoroids
Immunostaining LLC1 biopsies for stem cell transcription factors. Cells were cultured for 7 days either as a monolayer (A and C) or on 3D scaffold (B and D). Cells were stained red for Oct4 (A and B) and green for Sox2 (C and D). DAPI (blue) was used as a nuclear stain. Scale bar = 100μm

36
were obtained by subcutaneous growth of tumors initiated using the A549 cell line in
NOD SCIID gamma immunocompromised mice. A549 form a much more solid tumor
than LLC, so needle biopsies were not practical. So, whole A549 tumors were collected
when they reached 7mm in diameter and digested as described in the methods to
obtain single cell suspensions. CD44 and CD24 expression was compared on freshly
digested tumor cells and tumor cells cultured as tumoroids for 6 days. (Figure 7) The
freshly digested tumor had a CD44+/24- population of approximately 10%, with the
majority of cells CD44-/24-. After tumoroid culture the CD44+/24- population increased
to almost 30% accompanied by a large increase in overall CD44 and CD24 expression,
with the majority of cells CD44+/24+ in addition to the CD44+/24- population.
CD44+/24- analysis was subsequently performed on H460 tumoroids compared to
H460 monolayer with similar results. H460 monolayer was found to contain
Figure 7. Expression of the CSC Marker (CD44+/24-) is Increased in A549 Biopsy Derived Tumoroids
CD44+/24- population as assayed by flow cytometry in cells collected directly from sub-cutaneous A549 tumors vs cells collected from A549 tumors and cultured as tumoroids for 6 days.

37
approximately 9% CD44+/24- cells, with the majority of cells being CD44+/24+ (Figure
8). Tumoroid culture increased the CD44+/24- population to 33% seemingly through a
reduction in CD24 expression. (Figure 9)
Since we observed an increase in aldh1a1 expression in LLC1 tumoroids, we
aimed to confirm this result through assays of ALDH activity in mouse and human
tumoroids compared to monolayer culture. Figure 10A depicts ALDH activity in the
H1975 cell line as measured by flow cytometry using the ALDEFluor kit (StemCell
Technologies) with the ALDH inhibitor N,N-diethylaminobenzaldehyde (DEAB) provided
as a negative control for background auto fluorescence. We observed a 5.2% increase
in ALDH activity in H1975 tumoroids. We also assayed ALDH activity in LLC1 tumoroids
and found a larger 34.5% increase compared to LLC1 monolayer (Figure 9B). We
continued to culture the LLC1 tumoroids, dissociating and re-plating the cells on fresh
scaffolds every 6 days for three generations. By the end of the 3rd generation ALDH
Figure 8. Expression of the CSC Marker (CD44+/24-) is Increased in H460 Tumoroids
H460 cells were cultured as monolayer or tumoroids for 6 days. Cells were collected and CD44+/24- population was assayed by flow cytometry.
38
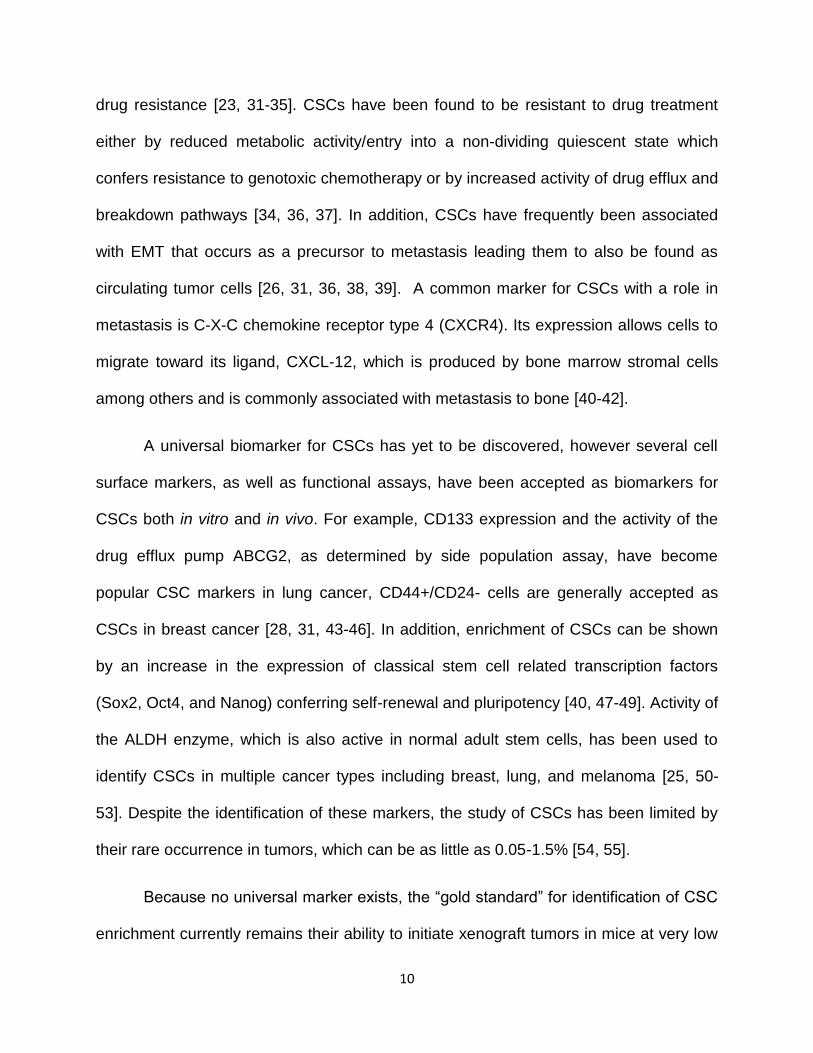
activity had increased such that nearly 90% of cells in the tumoroids had higher activity
than LLC1 monolayer. (Figure 9B) This effect represents a statistically significant
increase in ALDH activity. (Figure 9C)
Figure 9. Aldehyde Dehydrogenase Activity is Increased by Tumoroid Culture A. The ALDH+ population was assayed by flow cytometry using the ALDEFluor kit in H1975 cells cultured as monolayer or tumoroids. B. The ALDH+ population was assayed by flow cytometry using the ALDEFluor kit in LLC1 cells cultured as monolayer or tumoroids for multiple 6 day generations. C. Percent increase in ALDH+ cells in LLC1 tumoroids vs LLC1 monolayer. N=3 *p≤0.05

39
CSC markers have been shown to be increased in tumoroid culture, so we aimed to
confirm the development of CSC properties in tumoroids using the functional assays of
sphere formation and tumor initiation. As discussed in chapter 2, these functional
assays are important to ensure that the CSC markers used in this model are truly
identifying cells that can self-renew and are able to form tumors. When LLC1 tumoroids
were dissociated and tested for their ability to form spheres under low attachment
conditions they were found to have an increased sphere forming ability (2.8%)
compared to cells taken from LLC1 monolayer (2.3%). (Figure 10A-B) Not all cells
within 1st generation tumoroids were ALDH+, so the ALDH+ cells were isolated from
tumoroid culture using FACS. The sphere efficiency of the ALDH+ population was found
to be more than double that of monolayer culture at 4.8%. (Figure 10A-B) The sphere
growth properties were observed to be slightly different between groups as depicted by
Figure 10. Sphere Formation Efficiency is Increased by Tumoroid Culture and ALDH Activity
A. Sphere efficiency of LLC1 cells derived from monolayer (M), scaffold (S), or ALDH+ population obtained by FACS. Sphere efficiency = cells plated/ # of spheres observed. N=3 *p≤0.05 B. Box plot showing size distribution and sphere efficiency % of spheres from (A).

40
changes to the size distribution of spheres (Figure 10B), with tumoroid cells growing a
large number of small spheres while monolayer and ALDH+ cells grew a larger range of
sphere sizes. This is most likely an indication of differences in the ability to proliferate
but the specific mechanism causing this requires further investigation.
To investigate the tumor initiation ability of the ALDH+ LLC1 and CD44+/24-
A549 populations, these populations were isolated from tumoroids by FACS or MACS,
respectively and used to initiate subcutaneous flank tumors in C57 BL/6 or NOD SCIID
gamma mice. The LLC1 ALDH+ were able to initiate tumors much more efficiently than
parental LLC1 tumoroid cells at a concentration of 10,000 cells per flank. (Figure 11A)
Figure 11. CSC Populations Enriched by Tumoroid Culture have Enhanced Tumor Initiation Ability
A. Tumor initiation ability of LLC1 CSC population. LLC1 cells cultured on 3D scaffold vs isolated ALDH high population were injected subcutaneously using 10,000 cells per flank and the size of the resulting tumors was measured by caliper. N=2 p=0.1
B. Tumor initiation ability of A549. Parental cells vs MACS isolated CD44+/24- population were injected subcutaneously into the flanks of Nod/SCIID immunocompromised mice using the cell numbers indicated for each group. N=3 *p≤0.05
Day
*
*

41
The A549 CD44+24- cells were also able to initiate tumors more efficiently than
parental, as CD44+/24- tumors seeded with 25,000 cells grew at a faster rate than
parental tumors seeded with 5x10⁶ cells and eventually surpassed the parental in size.
(Figure 11B)
Figure 12. Expression of CSC Marker Genes Changes Over Time During Tumoroid Culture
A. A qPCR array was used to identify changes in RNA expression for cancer stem cell related genes in first, second, and third generation LLC1 scaffold culture. Data was normalized to LLC1 monolayer and fold change values are presented as a table.
B. Scatter plot showing up and downregulated genes in LLC1 3rd
generation vs LLC1 monolayer.

42
Since LLC1 tumoroids, and especially the ALDH+ population they contain, were
confirmed to have the key CSC properties of enhanced sphere formation and tumor
initiation, their gene expression profile was further characterized using a qPCR array
containing primers for genes know to be important markers and drivers of the CSC
Figure 13. Expression of CSC Marker Genes is Enhanced by Tumoroid Culture in Multiple Cell Lines
A. Human NSCLC cell lines A549. H1299, and H460 were cultured at 3D tumoroids for 6 days or as monolayer. Cell pellets were collected from each culture, RNA was isolated and CSC related gene expression was analyzed by qPCR. Data represents increase in gene expression in tumoroids as compared to monolayer. One way ANNOVA was used to calculate significance (Prism) N=3 *p≤0.05. B. Nos2 Expression in the human cell lines H1299, A549, H460 and mouse LLC1 cultured on scaffold for 6 days normalized to monolayer. C. IHC staining for Nos2 protein in 1st Gen LLC1 tumoroids fixed on day 6 of culture and stained with rabbit anti mouse Nos2 and Alexa 488 anti-rabbit secondary. (600X magnification) *p≤0.05

43
phenotype. In order to better understand the mechanism by which culture on the 3D
scaffold is able to promote the growth of CSC, samples from 1st, 2nd, and 3rd generation
tumoroids were used to identify gene expression changes that occurred over time in
stem cell related genes. Several genes were found to be up-regulated including Nos2,
PLAT, and CD34. Many of these are involved in Wnt/β-catenin signaling, a pathway
known to drive cell proliferation and regulate cell-cell adhesion in cancer. (Figure 12A) A
scatter plot of overall gene expression changes occurring between LLC1 monolayer
culture and 3rd generation scaffold is also provided. (Figure 12B)
Nos2 showed the greatest increase in scaffold culture and this result was
replicated in the human adenocarcinoma cell lines A549, H1299, and H460 as well as in
LLC1 when cultured on scaffold. (Figure 13A) Immunohistochemistry (IHC) for the Nos2
protein was used to confirm its expression as seen in the qPCR array. (Figure 13B)
Nos2 (stained in green) is highly expressed in LLC1 tumoroids. Many of the other
stemness genes shown to increase in LLC1 cultured on scaffold were also increased in
human cell lines cultured on scaffold for 6 days, albeit at a somewhat lower fold change.
(Figure 13C) Taken together, this data demonstrates that the effects of the scaffold
culture are not cell line specific and can promote stem-ness in human cancer cells as
well as mouse cells.
4.3 Discussion
We are not the first to demonstrate an increase in CSC markers through culture on a
fibrous scaffold, as Feng et. al. have also reported this phenomenon reporting increased
expression of CSC markers Oct3/4, Sox2, and ALDH in breast cancer cell lines cultured

44
on a polycaprolactone scaffold. However, we have significantly advanced the field by
performing an extensive characterization of the phenomenon as well as validating the
CSC expansion observed on our novel scaffold material using multiple in vitro methods
as well as in vivo tumor initiation [89]. We have demonstrated that our tumoroid platform
can be used with both mouse and human cells with varying genetic background and
that it is able to expand the expression of relevant CSC markers to each cell line (ALDH
in LLC1 and CD44+/24- in A549). In addition to our own validations, other groups have
studied the relevance of ALDH in LLC1 cells and CD44 in A549 cells which adds
support to the claim that tumoroids grown on our scaffold are truly enriched in CSCs
[40, 90-92].
We have successfully utilized the tumoroid platform to generate and maintain
large numbers of CSCs separate from their bulk tumor cells enabling full scale
experiments such as RNA and protein isolation from CSCs, in vivo tumor initiation, and
drug screening. Through the study of gene expression changes occurring as CSCs are
maintained within tumoroids, we have identified the Wnt/β-catenin pathway as a major
driver not only in mouse LLC1 cells but also in multiple human NSCLC cell lines. This
phenomenon will be explored in greater detail in the coming chapters.
Nevertheless, some aspects of CSC expansion in the tumoroid model remain to
be explored. The full significance of the NO production increase we observed in
tumoroids remains unclear. Because Nos2 is a Wnt target gene it provides some
evidence that β- catenin activity is increased by scaffold culture. iNOS is known to
promote drug resistance in lung cancer by activation of the canonical Wnt pathway
through inhibition of DKK1 and to promote the growth of CSC in glioma via the Notch
45
pathway [93]16, 17). In this way, iNOS may be acting in a positive feedback loop to
promote stemness in tumoroid cultures. The NO which is released by these CSCs may
also play a role in increasing vascular permeability and inducing immune cell anergy,
but this area requires further investigation.
The significance of the difference in expression patterns of individual CSC target genes
seen in figures 13-14 may provide some insight into how CSCs arise in the presence of
differing driver mutations. For example, even though Wnt/β-catenin is implicated in the
process of CSC proliferation, different Wnt genes were observed to be active in each
cell line with some such as the common Wnt responsive gene c-myc not observed to
increase at all [94, 95]. This is most likely due to the context specificity of the Wnt
pathway and its many segments (both canonical and non-canonical) that will be
discussed in detail in chapter 7. Despite the status of c-myc as a reporter of canonical
Wnt activation, alternative Wnt activation can actually cause a decrease in c-myc
expression especially in the context of increased CD44 [96, 97]. Despite the present
validation of the tumoroid model of CSC proliferation, the details of the molecular
mechanism behind the increased CSC proliferation remain unclear. Due to the facts that
the 3D scaffold provides greater surface area for cells to attach and cells cultured on the
scaffold come together to form 3D tumor-spheres increasing their cell-cell interaction, it
is logical that stimulation of cell adhesion molecules could be responsible for the
expansion of CSCs that occurs in this model but more work must be done to determine
the specific mechanisms involved.

46
CHAPTER 5
A Novel Mechanism Regulating CSC Expansion (Natriuretic Peptide Receptor A)
5.1 Introduction
Natriuretic peptide receptor A (NPRA) is the cell surface receptor for atrial natriuretic
peptide (ANP). NPRA is found in many tissues including kidney, brain, ovaries, and
endothelium [98]. NPRA functions as a guanylyl cyclase converting GTP into cGMP
Figure 14. The Functions of ANP/NPRA Signaling
ANP is produced by the heart in response to stress/high blood pressure. It is recognized by NPRA in the kidney leading to both natriuresis (excretion of sodium) and vasodilation through the renin angiotensin pathway. Because NPRA is a receptor guanylate cyclase it can also activate PKG in other tissues including in embryonic stem cells where it maintains pluripotency through an Oct4/Nanog dependent mechanism.

47
upon its binding to ANP which in turn can activate multiple downstream signaling
pathways. ANP is a peptide hormone produced by the heart with diuretic and natriuretic
properties [99]. This is the primary function of ANP/NPRA signaling; to decrease blood
volume in response to cardiac stress as a mechanism to reduce blood pressure.
However, ANP/NPRA signaling has also been shown to modulate inflammation and
fibrosis in several animal models, as well as maintain self-renewal and pluripotency in
embryonic stem cells [100-102]. (Figure 14) Natriuretic peptide receptors are found on
immune cells including macrophages and dendritic cells, as well as MSCs [103]. NPRA
specifically has been shown to reduce endothelial inflammation through its guanylyl
cyclase activity [104]. Studies thus far indicate that the ANP-NPRA pathway plays a role
in the healing process and may be an important contributor to the outcome of
cardiovascular ischemia and myocardial infarction [105]. Studies from the Mohapatra
lab have shown that a deficit in ANP-NPRA signaling reduces the SDF-1/CXCR4
mediated homing of MSCs to tumors, indicating that a link between the NPRA and CSC
associated CXCR4 pathways exists. However, the exact mechanism of this link and the
specific cell types involved remains unclear [106].
Studies from our laboratory have shown that a blockade of ANP-NPRA signaling
can reduce CXCR4 expression in tumor microenvironments, as well as reduce
angiogenesis in aortic segments. Co-culture with MSCs can partially recover these
effects [106]. Initially, angiogenic potential of aortas derived from WT and NPRA-KO
mice were compared using an endothelial sprout assay. Results showed that NPRA-KO
aortic sections exhibit reduced sprouting (angiogenesis), which was restored when co-
cultured with MSCs [106]. Reduced angiogenesis potential of NPRA-KO aortas co-

48
related with decreased VEGF production in the culture [106]. This indicates that the
presence of MSCs can promote angiogenesis and may aid in healing at sites of
vascular damage.
NPRA is overexpressed in many cancers but its role in tumor progression has
not been extensively studied [107]. Because our previous studies suggest that NPRA is
crucial for the growth of tumors these studies examining the specific role of NPRA in the
tumor microenvironment with respect to drug resistance and CSC development will
provide significant insight into how tumors progress to more aggressive forms and
possibly identify novel targets to prevent this. Natriuretic peptide receptors are found on
many cell types including ECs, MDSCs, and are overexpressed in many cancers [108,
109]. NPRA has been shown to play a role in tumor growth and angiogenesis [28].
However, the specific role of NPRA signaling in different cell types present in the tumor
microenvironment is still unknown. Because CXCR4 and SDF-1 expression are reduced
in NPRA KO tumors and recovered when NPRA WT mesenchymal stem cells are
introduced it is likely that NPRA influences the migration and/or development of CAFs
from MSC [106]. Previously published data from our group indicates that the NPRA
pathway influences CXCR4 expression and is crucial to tumor formation in a knockout
mouse model. Both CXCR4 and its ligand CXCL-12 were greatly reduced in NPRA KO
tumors.
This data suggests that the NPRA signaling pathway is involved in tumor
progression and may also be involved in CSC development. Therefore, the scaffold
model will be used to study and further define the role that NPRA plays in the tumor-
stroma interaction. We hypothesize that NPRA expression will be increased during CSC

49
expansion and a reduction in NPRA signaling achieved by gene knockout or small
molecule antagonists will reduce both CXCR4 expression and CSC development in
cells cultured on scaffold. We further hypothesize that NPRA disruption will have a
direct effect in reducing the metastatic, proliferative, and stem like properties of cancer
cells. We are proposing to expand the CSC population in culture as described in
chapter 4 and identify the molecular mechanisms responsible for this expansion. We
aim to elucidate the role of NPRA signaling in the development of CSCs and regulation
of the expression of the CSC marker CXCR4. This will represent a candidate signaling
pathway influencing the development of CSCs.
Upon completion of this aim, we will achieve a better understanding of the
similarities and differences in CSC composition and behavior in different cell lines as
well as tumor biopsies. We will gain new insight into the signals that influence CSC
propagation, which may be useful in identification of drug targets. Furthermore, these
studies will provide novel insight into the role of specific cells in the tumor
microenvironment with respect to development of drug resistance and CSCs, as well as
insight into how NPRA signaling in each cell type affects the tumor as a whole. Finally,
we will have created and validated a novel culture environment that promotes the
growth of CSCs to be used in future studies.
The proposed work is innovative, because we aim to determine the factors and
signals that contribute to CSC proliferation. This work is also innovative because it will
reveal for the first time the influence of the NPRA pathway on CSC development and
specifically identify stromal conditions important to this process. This work will allow
CSC populations isolated by different methods to be cultured and studied more easily

50
leading to better characterizations and refinement of in vitro cancer models, as well as
identification of NPRA related drug targets to limit CSC development in vivo.
5.2 Results
After establishing that CSCs are enriched in LLC1 tumoroids in chapter 4, we next
examined weather the increase we saw in CSC markers was accompanied by an
increase in NPRA expression. LLC1 tumoroids were stained for ALDH activity and co-
stained with fluorophore conjugated antibodies for either NPRA or CXCR4. Samples
were gated into ALDH high and ALDH low populations and back-gated to show the
Figure 15.Increased ALDH Activity Coincides with Increased NPRA and CXCR4 Expression in Tumoroids
A. NPRA and CXCR4 expression in LLC1 cultured as monolayer. B. NPRA and ALDH co-expression in LLC1 tumoroids. C. CXCR4 and ALDH co-expression in LLC1 tumoroids.

51
distribution of NPRA or CXCR4 between them. LLC1 tumoroids with high ALDH activity
were found to be 43% NPRA+. However, the NPRA+ cells (in purple) were fairly evenly
distributed among the ALDH+ and the ALDH- cells. (Figure 15B) The same LLC1
tumoroids were found to contain 6% CXCR4+ cells (in orange), the majority of which co-
stained for high ALDH activity (Figure 15C). Comparing between monolayer and
tumoroids reveals that tumoroid culture caused a relatively small increase in NPRA cell
surface expression in LLC1 but does cause a significant increase in CXCR4 expression.
(Figure 15C)
A similar analysis was performed on H460 tumor spheres grown in low attachment
conditions. Tumor sphere culture was observed to cause an increase in both NPRA
Figure 16. Increased CD44+/24- Population Coincides with Increased NPRA and CXCR4 Expression in Tumoroids
A. H460 cultured as monolayer and tumorspheres were assayed for NPRA expression and CD44+/24- population by flow cytometry. B. Expression of NPRA and CXCR4 genes were compared by qPCR in H460 monolayer and tumoroids. N=3 *p≤0.05
A

52
expression (from 6.4% to 40%) and the CD44+/24- population (16% to 26%). (Figure
16A) mRNA expression was also checked in tumor spheres vs monolayer. Both NPRA
and CXCR4 expression was significantly increased in the tumorspheres.
NPRA was observed to increase in both the tumor sphere and tumoroid models,
so NPRA levels were also analyzed in a model of lung cancer drug tolerance. H1975
cells were exposed to the epidermal growth factor receptor (EGFR) inhibitor, Lapatinib,
at sub lethal concentrations to observe how they respond to treatment at the early
stages of developing drug resistance. After 20 days of exposure to the drug it was
determined that their IC50 for Lapatinib was increased H1975-drug tolerant (H1975-DT)
cells. (Figure 17A) Moreover, qPCR study revealed that the H1975-DT cells had
Figure 17. Drug Tolerance is Correlated with Increased NPRA Expression
A. Increased IC50 was confirmed in lapatinib tolerant H1975 cells by CellTiterGlo
assay. B. NPRA gene expression was assayed by qPCR in H1975 parental, and Lapatanib tolerant cells. N=3 *p≤0.05 C. NPRA receptor expression was assayed by flow cytometry in H1975 parental and Lapatanib tolerant cells.
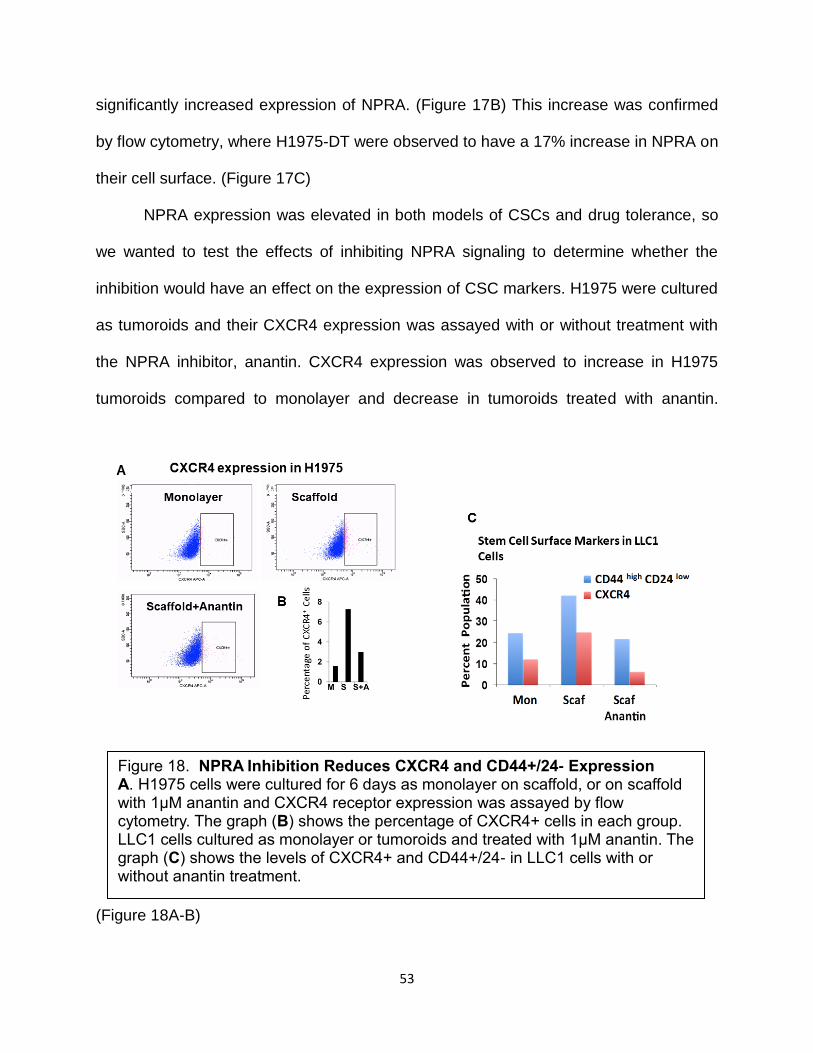
53
significantly increased expression of NPRA. (Figure 17B) This increase was confirmed
by flow cytometry, where H1975-DT were observed to have a 17% increase in NPRA on
their cell surface. (Figure 17C)
NPRA expression was elevated in both models of CSCs and drug tolerance, so
we wanted to test the effects of inhibiting NPRA signaling to determine whether the
inhibition would have an effect on the expression of CSC markers. H1975 were cultured
as tumoroids and their CXCR4 expression was assayed with or without treatment with
the NPRA inhibitor, anantin. CXCR4 expression was observed to increase in H1975
tumoroids compared to monolayer and decrease in tumoroids treated with anantin.
(Figure 18A-B)
Figure 18. NPRA Inhibition Reduces CXCR4 and CD44+/24- Expression
A. H1975 cells were cultured for 6 days as monolayer on scaffold, or on scaffold with 1μM anantin and CXCR4 receptor expression was assayed by flow cytometry. The graph (B) shows the percentage of CXCR4+ cells in each group. LLC1 cells cultured as monolayer or tumoroids and treated with 1μM anantin. The graph (C) shows the levels of CXCR4+ and CD44+/24- in LLC1 cells with or without anantin treatment.

54
This experiment was repeated using LLC1 cells and it was observed that
CXCR4, CD44+/24-, (Figure 18C) and ALDH+ (Figure 19A) markers are decreased in
LLC1 tumoroids treated with anantin. After finding that NPRA inhibition was able to
decrease cell surface CXCR4 in multiple cell lines, the effects of NPRA inhibition on the
CXCR4 promoter were investigated using a luciferase based promotor reporter
construct to determine if NPRA signaling regulates CXCR4 transcription. When LLC1
cells were stimulated with the inflammation inducing bacterial LPS their CXCR4
Figure 19. NPRA Inhibition Reduces ALDH Activity and Activity of the
CXCR4 Promoter
A. LLC1 cells were cultured as monolayer or on scaffold for 6 days. Cells on
scaffold were treated with either 10uM anantin or vehicle after 3 days. On day 6
ALDH activity was assayed by flow cytometry using ALDEFLuor.
B. LLC1 cells were transfected with a CXCR4 promoter reporter plasmid. Two
days after transfection cells were stimulated with 1μg/mL LPS and treated with
either 1uM anantin or vehicle. Luciferase activity was assayed after 24hr of
treatment. N=3

55
promotor was activated as expected, however when the cells were co-treated with
anantin, CXCR4 promotor activity remained the same as untreated. (Figure 19B)
Due to several issues in the use of anantin to inhibit NPRA inherent to its cyclic
polypeptide structure (high cost, short half-life, and high dose needed) alternate
methods of NPRA inhibition were investigated to further study the effects of NPRA on
CSC growth. Towards this end, a CRISPR Cas/9 gene knockout technique was used to
create an NPRA knockout H1299 cell line. Following transfection with a commercially
available all in one CRISPR plasmid targeting NPRA, individual cells were isolated to
form clonally derived colonies. These colonies were tested for NPRA expression by flow
Figure 20. Use of CRISPR/Cas9 to Create an NPRA Knockout Cell Line
A. H1299 cells were transfected with an all in one CRISPR/Cas9 plasmid construct containing guide RNA sequences for the NPRA gene. Following transfection, cells were cultured as individual colonies and colonies were selected and assayed for NPRA expression by flow cytometry. NPRA expression for colony #1 is plotted as both dot plot (A) and histogram (B) parental H1299 and secondary antibody only are provided as positive and negative controls.

56
cytometry to determine if the knockout was successful. One colony showed a significant
reduction in NPRA from 68% to 14% (Figure 20A-B), so studies were continued with
this colony to determine if its CSC properties were also reduced by NPRA KO.
A sphere assay was performed to test if NPRA KO has any effect on sphere
efficiency and therefore self-renewal ability. Both parental H1299 and NPRA KO H1299
were able to form spheres in a similar distribution of sizes. (Figure 21A) However, the
NPRA wild type H1299 formed ~twice as many spheres as the NPRA KO. This
reduction in sphere forming ability in the NPRA KO H1299 indicated reduced stemness.
To validate this finding, the tumor initiation ability of NPRA KO H1299 was
determined. NSG mice were injected subcutaneously with WT cells in the right flank and
KO cells in the left flank and tumor growth was monitored by caliper measurement. Both
WT and KO cells were compared in each mouse to control for individual variation
between mice. Tumors from both WT and NPRA KO were observed to increase in size
from day 30 post injection to day 50. However, in each mouse the NPRA KO tumor
Figure 21. NPRA Knockout Reduced Sphere Formation Ability
Sphere formation ability was assayed in NPRA-KO H1299 vs parental H1299 cells. The size distribution of spheres and the sphere efficiency values for each group are depicted. Sphere efficiency = cells plated/ # of spheres observed. N=3

57
grew more slowly and remained smaller in size compared to the NPRA WT tumor.
(Figure 22A)
Due to the fact that we observed that NPRA KO in cancer cells did not prevent
tumors from growing, we decided to investigate NPRA KO in the tumor stroma. To
determine how NPRA KO in the non-cancerous cells of the tumor microenvironment
would affect tumor growth we obtained commercially available NPRA KO mice of the
C57 BL/6 background and used them to study the growth of LLC1 tumors in an
environment lacking NPRA. Previous studies from our Lab have showed that LLC1
monolayer cells are not able to efficiently form tumors in NPRA KO mice, so we used
LLC1 cells derived from tumor sphere culture to compare subcutaneous tumor growth in
Figure 22. NPRA Knockout in Tumor or Stroma Reduces Tumor Growth
A. NPRA KO H1299 cells were used to initiate tumors in NSG Mice and growth was monitored over 60 days (N=3). Mice were numbered 1-3 and each mouse
received 3x10⁶ WT cells in the right flank and 3x10
6 NPRA-KO cells in the left
flank. B. Subcutaneous flank tumors were grown in NPRA KO mice using LLC tumorspheres at the indicated cell numbers (x1,000) (N=2) *p≤0.05
*
*
*

58
NPRA WT and NPRA KO mice. Monitoring tumors initiated with decreasing numbers of
cells revealed that tumors were able to grow much faster and to larger size in the WT
mice when initiated with either 100,000 or 20,000 cells. (Figure 22B) No difference was
observed in tumors initiated with 10,000 cells in the 30 day time period of the
experiment. This is likely due to the much slower growth kinetics in tumors initiated with
such a low cell number.
5.3 Discussion
While NPRA has been previously demonstrated to play a role in embryonic stem
cell pluripotency and the migration of mesenchymal stromal cells, to our knowledge we
have presented herein the first indication of NPRA’s role in maintaining CSC or drug
resistant populations of cancer cells. Other groups are beginning to investigate the role
of NPRA in cancer including studies showing that NPRA can increase invasion and
migration in squamous cell carcinoma and promote gastric cancer development
supporting our findings that it may play an important role in the progression of lung
cancer [110-112].
We did not consistently see dramatic increases in NPRA expression as a result
of tumoroid culture, and indeed have previously shown that NPRA is often
overexpressed in cancer cell lines grown as monolayer, indicating that NPRA itself may
not be a good marker for CSC identification [109]. Previously published work
demonstrates that NPRA is overexpressed in many types of cancer including in the
LLC1 cell line and in vivo tumors. Therefore, signaling through NPRA may be important
in supporting survival and/or growth of these cancers. The results presented here

59
support this conclusion, as we have demonstrated that increases in NPRA expression
are associated with increases in CSC markers (ALDH, CD44+/24-, and CXCR4) as well
as functional properties of CSCs including drug resistance, self-renewal, and the ability
for tumors to grow in vivo. Furthermore, we have demonstrated that by inhibiting NPRA
signaling, either using anantin or NPRA KO, we were able to reduce the expression of
both ALDH and CXCR4 in lung cancer cells and simultaneously reduce their self-
renewal and tumor initiation.
While the role of NPRA in lung cancer CSCs requires further study, we have
begun to reveal a possible regulatory mechanism by showing that inhibition of NPRA
signaling can reduce the transcriptional activity of the CXCR4 promotor. This may lead
to future therapeutic intervention as increased CXCR4 expression has been associated
not only with CSC growth, but also metastasis of cancer cells and migration of stromal
cells into tumors where they support tumor growth [41, 42, 106, 113].

60
CHAPTER 6
Actinomycin D and Telmisartan Combination Treatment Targets CSC and
Reduces Tumor Burden
6.1 Introduction
As described in chapter 1, a major goal of this project is to utilize the 3D tumoroid
CSC model to identify novel therapies to target and destroy CSC. Since we have
established in chapter 4 that 3D tumoroids are indeed enriched in CSC we
subsequently began testing anti-cancer drugs to determine whether they could block
this expansion. We started by using a primary drug screen of the NCI diversity set of
compounds in an established (monolayer) model of drug resistant cancer (MCF-7 Dox
cell line) in order to identify lead compounds [114]. Subsequently, a secondary screen
was performed using the NSCLC cell line H460 and Actinomycin D (AD) was identified
as the compound able to reduce cell viability most potently in both screens (Table 3). In
addition, we went on to determine that AD was also able to reduce Sox-2 expression in
breast cancer tumoroids thereby reducing stemness [115]. Therefore, since we have
identified in chapter 4 that ALDH expression is a valid marker for CSC in the LLC1 cell
line, we hypothesized that treating LLC1 tumoroids with AD would result in a reduction
in ALDH activity. We further hypothesized that if AD is successful in targeting CSC it
would be effective in reducing the viability of not only LLC1 tumoroids but also

61
tumoroids generated from human NSCLC cell lines and that this anti-CSC effect would
translate to in vivo mouse models of NSCLC as well.
The anti-cancer activity of AD has been known since the 1950’s when it was one of
the first antibiotics discovered to be effective in the treatment of tumors [116, 117]. Its
structure is a cyclic peptide, and it is produced by actinomyces soil bacteria where it
was first discovered in the 1940’s [118]. Actinomycin D exhibits genotoxic anti-
proliferative and anti-cancer effects by binding to DNA at GpC sites where it inhibits
RNA polymerases from accessing the DNA thereby inhibiting transcription [119, 120]. It
has also been shown to inhibit DNA topoisomerase activity resulting in increased stress
Table 3. Drug Screening with the NCI Diversity Set in the H460 Cell Line
Cell viability was assayed using CellTiter Glo and IC50 calculated using Graph pad prism software.

62
on the DNA molecule and ultimately double-stranded breaks [120]. Through these
mechanisms, AD has been shown to induce apoptosis in many cancer cell lines [115,
121-123]. Due to its potent activity, AD was approved by the FDA to treat Wilms tumor,
rhabdomyosarcoma, and choriocarcinoma in 1964 under the trade name Cosmegen.
Since its approval AD has been used as a chemotherapy in the clinic however its use
and effectiveness have been limited by its dose-limiting side effects including
immunosuppression, fatigue, ulcers, and diarrhea [124, 125].
In addition to its use as a primary chemotherapy, in recent years AD has been
shown to be effective in cyclotherapy. The principle of cyclotherapy states that because
many cancer therapies target rapidly dividing cells side effects of these therapies could
be minimized if non-cancerous cells could selectively be made to stop dividing during
treatment [126]. Towards this end, AD has been given in low doses to activate the P-53
DNA damage response in non-cancerous cells causing cell cycle arrest after which
point they will not be harmed by high dose chemotherapies [123, 126, 127].
Because AD has been shown to be an effective cancer therapy both in the literature
and by our preliminary screen, but its use is limited by side effects we considered
combining AD with other drugs in an effort to reduce the dose required while
maintaining its anti-cancer and anti- CSC effects. To achieve this goal, we have chosen
the drug Telmisartan (TS), an angiotensin II receptor antagonist developed by
Boehringer Ingelheim as an anti-hypertensive agent. It was selected for combination
therapy with AD due to its well-known effect reducing collagen production in the tumor
microenvironment thereby increasing the permeability of tumors and increasing drug
penetration into them [128, 129]. However, TS is also known to have other effects in

63
models of cancer that make it an attractive candidate for combination therapy. It has
been shown to inhibit the growth of the NSCLC cell line A549 as well as other cancers
through inhibition of PI3k signaling.[130] It is also known to be an activator of
peroxisome proliferator-activated receptor-γ(PPARγ) which can influence cellular
metabolism and fatty acid oxidation [131, 132]. Finally, TS has also been used as a
cardio protective agent to reduce the toxicity of anti-cancer therapies through an anti-
inflammatory mechanism dependent on ANG II inhibition [133]. For these reasons, we
hypothesize that a therapy combining AD with TS (AD+TS) will act synergistically to
reduce both the viability and the CSC properties of NSCLC in the tumoroid model as
well as in vivo models.
6.2 Results
IC50 values were determined for AD in LLC1, A549 and H1299 cell lines cultured either
as monolayer or tumoroids to ensure subsequent experiments were carried out using
sub-lethal treatments. AD was found to be very toxic to these cells cultured as a
monolayer with IC50 values of 0.63nM (LLC1), 1.28nM (H1299), and 1.64nM (A549)
(Figure 23A). Tumoroid culture was found to slightly raise the IC50 values for all cell
lines indicating that the tumoroid model better replicates the in vivo microenvironment
where drug resistance is increased; with IC50 values of 90nM (LLC1), 40nM (H1299),
and 5nM (A549) (Figure 23B). TS alone was found to be non-toxic at the relevant
therapeutic concentrations of 1-10µM (Figure 23C)

64
Figure 23. AD Reduces Viability in both Monolayer and Tumoroid Cultures of Lung Cancer Cell Lines
Dose response curves and IC50 values for mouse and human lung cancer cell lines cultured on monolayer(A) vs 3D scaffold(B). Cells were plated on scaffold in 96 well plates at a density of 5,000 cells per well. Serial dilutions of AD were added on day 4 and cell viability was assayed on day 6 by CellTiter-Glo. N=3. Cell viability was also assayed after 48hr treatment with varying concentrations of TS (C).

65
To test whether AD treatment reduces stem-ness in addition to reducing cell viability,
a sphere formation assay was performed. AD was found to be able to reduce the
sphere forming efficiency of isolated ALDH high cells from 4.8% in untreated cells down
to 2.2% with only a 0.5nM AD treatment (Figure 24A). This indicates that AD is reducing
the stemness characteristics of these cells. Because the CSC marker ALDH was found
to be highly active in LLC1 cells cultured under low attachment conditions during the
tumorsphere assay, we tested whether AD treatment would be able to reduce ALDH
activity during tumorsphere growth. Indeed, treatment with as little as 3nM AD was able
Figure 24. Actinomycin D Reduces Sphere Formation Ability and ALDH Activity in LLC1 Tumoroids
A. Sphere formation efficiency of LLC1 sorted ALDH high cells with or without AD treatment (0.5nM) N=3*p≤0.05
B-C. ALDH activity of LLC1 cells cultured as spheres on low attachment plates with or without 3nM AD treatment (B) or as tumoroids on 3D scaffold after treatment with escalating doses of AD (C), as assayed by flow cytometry using ALDEFluor kit.
ALDH
ALDH

66
to reduce ALDH activity in tumorspheres from 64% to 13% (Figure 24B). LLC1 cells
cultured as tumoroids on scaffold were also treated with AD in increasing
concentrations (3-48nM), and a dose-dependent reduction in ALDH activity was
observed (Figure 24C). Therefore, AD may be able to reduce the stem like properties of
cancer cells as evidenced by its ability to lower ALDH activity and sphere formation.
Additionally, TS was tested for its ability to synergize with AD to further reduce the
viability of lung cancer cell lines treated with AD. LLC1 cultured on scaffold were treated
with a combination of AD at varying concentrations plus 10µM TS. (Figure 25A) The
addition of TS was found to reduce the IC50 of AD from 127nM to 52nM in a synergistic
Figure 25. Actinomycin D Acts Synergistically with Telmisartan in Lung Cancer Tumoroids
IC50 values were determined for cell lines cultured as tumoroids on scaffold LLC1(A) and, H460, H1299, A549 (B) treated with AD in the presence or absence of TS (10µM). Drugs were added on day 4 of culture and viability was assayed on day 6 using CellTiter Glo. Combination index was calculated using CompuSyn Software by comparing the effects of AD and TS alone vs in combination. IC50 and combination index values are provided in the associated table(C).

67
fashion. (Calculated using CompuSyn software)(Figure 25A-C) This suggests that
through the addition of non-toxic concentrations of TS a low dose of AD may be
sufficiently effective. This effect was also seen in tumoroid cultures of human lung
cancer cell lines (Figure 25B-C) indicating that the effects of AD+TS treatment are not
cell line specific.
Next, an analysis was performed using Ingenuity Pathway Analysis(IPA) software
aiming to predict mechanisms of interaction between AD and TS based on published
findings present in the IPA database. (Figure 26) This analysis predicted 11 factors to
directly interact with both drugs including caspase3, reactive oxygen species (ROS),
Figure 26. Prediction of Mechanisms of Synergy Between AD and TS
IPA was used to find molecules that are affected by both AD and TS. Direct interactions are highlighted in red, indirect interactions are shown in grey. CASP3, NOS2, and ROS were selected for further study.

68
and Nos2. We have already seen in chapter 4 how Nos2 is up-regulated in the tumoroid
model so the fact that AD+TS are known to target it was encouraging.
The 3D tumoroid morphology previously described as a key feature of scaffold
culture was assayed following drug treatment to determine if the treatments had any
effect on the overall morphology of the cultures in addition to their ability to block the
cells from acquiring stem-like properties. The combination treatment of AD plus TS was
found to change the morphology of LLC1 cultured on scaffold. (Figure 27A) When cells
were treated with TS or AD alone, they retained the same 3D tumoroid structure as
untreated cells. However, when LLC1 were treated with AD+TS, the tumoroids were
seen to break up, and more isolated single cells were visible. This change is indicative
of the increased potency of the combination treatment since AD alone seems able to
reduce stemness as assayed by ALDH activity; however, it is not able to break up the
tumoroid structures at this low concentration without the addition of TS. Following
observations of morphology, tumoroids from these treatment groups were assayed for
ALDH activity. AD was found to greatly reduce ALDH activity which is consistent with
previous experiments, however, AD+TS was able to reduce ALDH activity further, to 0%
(Figure 27B). To investigate the mechanism of cell death occurring as a result of AD+TS
treatment, a western immunoassay was performed to assay levels of PARP and
caspase3, two proteins critical to promoting apoptosis.(Figure 27C) Following AD+TS
treatment levels of both cleaved PARP and cleaved caspase3 were found to increase
indicating that LLC1 tumoroids were undergoing apoptosis.

69
In addition to the ability of AD to reduce ALDH activity and sphere formation
efficiency the effect of AD on several of the CSC related genes identified by the qPCR
array were assayed. Scaffold cultured LLC treated with AD and AD+TS were found to
have reduced expression of several stemness-related genes previously shown to have
increased as a result of scaffold culture such as abcg2, dvl3, nos2, and plat. (Figure 28)
The combination treatment reduced expression of all genes assayed with the exception
of Oct4. TS alone was shown to reduce expression of CD44, Oct4, and Nanog revealing
ALDH
Figure 27. Combination of AD and TS Further Reduces ALDH Activity and Causes Tumoroids to Undergo Apoptosis
A. LLC1 cells were cultured as tumoroids on scaffold. On day 4 wells were treated with either AD, TS, or both in combination. On day 6 cells on scaffold were stained with Nuc Blue dye and examined by fluorescent microscopy. B. LLC1 cells cultured and treated as in (A) were collected on day 6 of culture and ALDH activity was assayed by flow cytometry using ALDEFluor kit. C. LLC1 cells were cultured and treated as in (A). On day 6 tumoroids were removed from scaffold, total protein was isolated, and expression of PARP and Caspase3 (both full length and cleaved) were assayed using the Wes system.

70
that it may have broader anti-CSC effects than merely increasing the penetration of AD
into tumors.
To assay of the effectiveness of AD and AD+TS treatments in reducing tumor burden
and CSC growth, these treatments were tested in multiple mouse models of lung
cancer. Cells cultured in monolayer as well as CSC enriched scaffold cultures were
tested to compare the effectiveness of these treatments on CSC specifically. One
million LLC1 monolayer cells were injected subcutaneously into the flanks of C57BL/6
mice to initiate tumors. Starting on day 10-post injection, intratumoral treatments of AD
(25µg/kg or 50µg/kg) were administered every 3 days for a total of 3 treatments. Tumor
diameters were measured via caliper on days 11, 14, and 17. Only the 50µg/kg
Figure 28. Combination of Actinomycin D and Telmisartan Reduces Expression of CSC Genes in Tumoroids
LLC1 cells were cultured as tumoroids and treated as in Figure 25. Cells were collected on day 6, RNA was isolated by affinity column method, and expression of CSC related genes were assayed by qPCR. Results were compared to LLC1 monolayer culture as control. N=3 *p≤0.05
* * *
* *
*
* *

71
treatment was found to significantly reduce tumor size, so this dose of AD was chosen
for subsequent experiments. To determine the anti-tumor effect of TS this experiment
was repeated with the addition of TS and AD+TS groups using only 50 µg/kg AD and 1
mg/kg TS. Both AD and the combination treatment reduced tumor size although the
combination had a more significant effect while TS treatment did not reduce tumor size.
(Figure 29A) We also tested the effectiveness of AD+TS treatment in a xenograft model
using A549 subcutaneous flank tumors in Nod/SCIID mice. In this model we also found
that TS treatment has no significant effect on tumor growth, AD was able to slow tumor
growth, but AD+TS resulted in the greatest reduction in tumor size. (Figure 29B)
In a second experiment, 100,000 3rd generation scaffold cultured LLC1 were
injected subcutaneously into the flanks of C57BL/6 mice. These tumors were treated
intratumorally with a vehicle, AD (50µg/kg), or AD plus TS (1mg/kg) every 3 days
beginning on day 10. Using 3rd generation scaffold cells to initiate tumors provides a
greater number of initial CSC meaning fewer cells are required for the tumor to grow
compared to cells derived from monolayer culture. In these 3rd generation tumors, we
observed a stronger effect of the AD+TS treatment as evidenced by the larger
difference in size between AD+TS tumors and tumors in the other treatment groups.
(Figure 29C).
To assess the stemness of the tumor cells following treatment, the tumors from the
LLC1 scaffold group were collected; one tumor from each group was digested to form
single cell suspension, and was assayed for ALDH activity by flow cytometry. The TS,
AD, and combination tumors were all found to have reduced ALDH activity compared to

72
the control group. (Figure 29D) This indicates that AD and AD+TS treatments are
effective at reducing CSC in addition to reducing overall tumor size and burden.
6.3 Discussion
Our results thus far have demonstrated a novel combination treatment (AD+TS)
that is not only able to reduce the expression of stemness markers in lung cancer cells
in vitro but also is able to reduce tumor growth in vivo. Using a novel 3D tumoroid model
Figure 29. Combination of Actinomycin D and Telmisartan Reduces Tumor Growth and Stem-ness In Vivo
A-C. In vivo tumor treatment. Cells were injected subcutaneously into the flanks of mice, 1 million LLC1 monolayer cells into C57/Bl6 (A) 5 million A549 monolayer cells into Nod/SCIID mice (B) or 100,000 LLC1 scaffold cells into C57/Bl6 (C). Mice were treated with 50µg/kg AD, 1mg/kg TS, or combination by intratumoral injection every 3 days starting when tumors reached 3mm in diameter. Tumor growth was monitored by caliper measurement and mice were sacrificed when tumors reached 10mm in diameter. For all experiments N=3 control, 4 AD, 4 TS, 7 combination. D. Tumors initiated with LLC1 3rd generation scaffold cells were assayed for ALDH activity using ALDEFluor kit following treatment described in (B). *p≤0.05

73
to enrich and maintain CSC in lung cancer cell lines has allowed us to study the gene
expression changes that occur as CSC grow. We have thus identified the Wnt pathway
as crucial for lung CSC development and re-confirmed the importance of known targets
such as Sox2, ALDH, and Nos2. Using published literature to predict possible
interactions between AD and TS we have identified and validated the apoptosis-
inducing effects of AD+TS in lung cancer through a mechanism involving caspase-3
cleavage. Through this synergistic action, AD and TS are able to significantly reduce the
viability of cancer cells both in monolayer and tumoroid culture while simultaneously
reducing expression of CSC marker genes, ALDH activity, and interfering with the ability
of cells to form 3D tumoroids. This synergistic action was validated in vivo where
AD+TS was found to significantly reduce both tumor growth and stemness via reduction
in ALDH activity.
While the mechanisms of AD’s anti-cancer activity are well known as stated in
the introduction to this chapter, the use of TS in cancer therapy and specifically its
combination warrant further study, some of which will be revealed in the following
chapter. Because TS is a partial agonist of PPARγ, which causes metabolic changes
within tumors to increase fatty acid oxidation possibly counteracting the Warburg effect
it may play a secondary role disrupting the metabolism of CSC [131-133]. The use of
metabolism to target CSC is a rapidly expanding area of research and TS’s role in this
area warrants further investigation [59, 134, 135]. It has also been used to help reduce
the toxicity of co-administered chemotherapeutics as its Ang-II inhibition has an anti-
inflammatory effect that is cardio-protective indicating that the use of TS can have
additional benefits outside the targeting of CSC [133].

74
CHAPTER 7
AD and TS Combination Treatment Reduces Stemness in Lung Cancer CSC
through Modulation of the Wnt/β-catenin Signaling Pathway
7.1 Introduction
As described in chapter 4, the expansion of lung CSC observed in 3D tumoroid culture
is associated with increased expression of several Wnt/β-catenin target genes (Sox2,
ALDH, CXCR4, and Nos2). Therefore, in addition to the anti-ALDH and pro-apoptotic
effects described in chapter 6 we hypothesized that combined treatment of AD and TS
might be mediating its effects through alterations to the pro-CSC Wnt/β-catenin
pathway.
Wnt/β-catenin is a core stemness pathway which along with Notch, sonic hedgehog,
and Janus-activated kinase/signal transducer and activator of transcription (JAK-STAT),
is known to regulate self-renewal and proliferation both in embryonic stem cells as well
as CSC [24, 60, 136-138]. Its role in driving the growth and expansion of CSC has been
extensively studied, and as mentioned in chapter 2, it is one of the pathways currently
under investigation for novel inhibitors to block CSC expansion.
Wnt signaling involves a vast interconnected network of proteins that has classically
been divided into canonical and non-canonical pathways. As research has progressed,
increasing complexity has been revealed within the non-canonical pathways and they

75
can now be further broken down into three sub-categories; the planar cell polarity
pathway, the Wnt/calcium pathway, and the non-canonical Wnt5/Fzd2 pathway [139].
(See Figure 30 for comparisons of canonical and non-canonical Wnt signaling
pathways). Taken together these pathways are known to regulate expression of over
125 target genes [140, 141]. In general, Wnt signaling is initiated when one of the 19
known Wnt ligands binds to one of the ten isoforms of the frizzled receptor (FZD) in
complex with the co-receptor LDL-related protein receptor 5/6 (LRP-5/6) on the cell
surface [142]. This leads to the phosphorylation of LRP6 by GS3K/ CK1γ and
recruitment of disheveled (Dvl) which breaks up the β-catenin destruction complex
Figure 30. Mechanisms of Canonical vs Non-Canonical Wnt Signaling
Diagram depicting the different mechanisms and outcomes of canonical Wnt/β-catenin vs non-canonical Wnt/β-catenin signaling.

76
(composed of GSK3β, APC, Axin, and Ck1α). This typically keeps cytoplasmic β-
catenin levels low by tagging it for proteasomal degradation. Therefore, when the
activity of the destruction complex is inhibited, β-catenin is allowed to accumulate in the
cytoplasm where it is stabilized and signaled to the nucleus by modifications such as
phosphorylation and acetylation. In the nucleus, β-catenin complexes with TCF/LEF
transcription factors to activate expression of their target genes.
Activation of non-canonical Wnt pathways can trigger distinct signaling events
depending on the specific Wnt ligand involved and the members of the receptor
complex that it binds to. For example, Wnt5 can bind to FZD in the absence of LRP5/6
resulting in activation of either PKC/NFAT (protein kinase C/ nuclear factor of activated
T-cell) or STAT3 target genes ultimately regulating cell adhesion and EMT.[142] Wnt5
can also bind to receptor tyrosine kinase-like orphan receptor 2(ROR2) in the absence
of FZD resulting in the destruction of β-catenin and inhibition of canonical Wnt signaling
[143, 144].
We hypothesize that because the increase in stemness promoted by our tumoroid
model is associated with increased β-catenin activity, that the ability of AD+TS to block
stem-ness in this model may involve inhibition of the Wnt/β-catenin pathway. We further
hypothesize that because these drugs are not known to be direct inhibitors of any Wnt
signaling proteins, that their effects on the Wnt pathway may involve the production of
ROS and/or activation of PPARγ since these are known effects of the drugs.

77
7.2 Results
In order to get a better understanding of the broader effects of AD+TS treatment, we
have performed RNA sequencing (RNA-Seq) on the drug-treated LLC tumor samples.
Sequencing was performed, by our collaborators at the Beth Israel Deaconess Medical
Center genomics core. 403 total genes were found to have either significantly increased
or decreased expression in the AD+TS group compared to control. (Figure 31A)
However, only 13 genes were found to be differentially expressed in all treatment
groups exhibiting the same trend after AD, TS, and AD+TS treatment. (Figure 31B)
The two genes found to increase in expression were Dmd and Abcb1. While Dmd is
the largest gene (containing 2.2Mb) indicating a possibility that its identification is an
artifact of sequence alignment it could be involved in stem cell depletion as it promotes
asymmetric division in muscle stem cells leading to differentiation [145]. Abcb11
encodes a bile salt transporter, which has also been known to transport drugs, so it may
be upregulated as a survival response caused by drug treatment [146]. Among the
decreased genes Lair1, Batf2, Gbp2, and Cxcl9 may have roles in stem-ness in this
model. Lair1 is a cell signaling receptor typically found on hematopoietic cells however it
is known to “exhaust tumor-initiating cells by apoptosis” in acute myeloid leukemia
[147]. Batf2 promotes the formation of the β-catenin destruction complex resulting in
GSK3β activation and β-catenin destruction [148]. Its expression may be decreased
after treatment in an attempt to increase canonical Wnt signaling to support cell survival
and proliferation. Gbp2 increases association between Dvl and GSK3β inhibiting
GSK3β, therefore, a decrease in Gbp2 would reduce β-catenin activity by promoting its

78
phosphorylation by GSK3β [149]. This opposes the action of the Batf2 expression
change indicating that the Wnt pathway may be dysregulated by our treatments. Cxcl9
is a chemokine that functions to attract T cells which is typically produced following
interferon-gamma stimulation. It is also known to increase activation of β-catenin in B
cell lymphoma [150].
Ingenuity Pathway Analysis (IPA) was performed using this data to identify
downstream effects of the observed expression changes. We found the expression
changes caused by AD+TS treatment to be consistent with decreased incidence of
tumors, decreased migration of cells, and changes in glucose metabolism. (Figure 32A)
This indicates that TS treatment may be affecting glucose metabolism in LLC tumors,
Figure 31. RNA-Seq Reveals Gene Expression Changes that Result from AD and TS Combination Treatment In Vivo
A. Gene Expression Changes in Treated LLC1 Tumors. RNA was isolated from drug treated LLC1 tumors (Figure 29C) and RNAseq was performed to identify differentially expressed genes within the 4 treatment groups. The number of genes identified as either increased or decreased in expression unique to each treatment or common to multiple treatments are shown. B. Table depicting genes either increased or decreased in all (AD, TS, and AD+TS) treatment groups depicted in A.

79
and is consistent with its well-known PPARγ agonism. IPA analysis was also used to
predict which cell signaling networks are likely to be inhibited by AD+TS treatment using
the RNA-Seq data. Figure 32B shows two of the top predictions based on differentially
expressed genes in AD+TS tumors vs control. These networks predicted to be inhibited
by AD+TS treatment rely on STAT1 and STAT3 signaling, a pathway known to interact
cooperatively with Wnt/β-catenin [151-153].
Figure 32. AD and TS Combination Treatment Reduces Tumor Growth, Migration, and STAT1/3 Signaling In Vivo
IPA was used to predict the downstream effects of the genes found to be differentially expressed in the combination treatment vs control by RNA-Seq. A. depicts predicted downstream effects inhibiting tumor incidence, cell migration, and glucose metabolism. B. depicts predicted downregulation of networks in the STAT1/STAT3 pathway.

80
Since several differentially expressed genes identified by qPCR are involved in or
targets of β-catenin signaling (Dvl2, Dvl3, STAT3, CD44, Oct4, Sox2) a TOPFLASH
assay for activated β-catenin was performed to determine if β-catenin activity is being
increased by scaffold culture and also if AD+ TS treatment is able to reduce β-catenin
Figure 33. β-catenin Activity is Increased in Tumoroid Cultures and Reduced by AD and TS Combination Treatment
A. LLC1 cells were cultured as monolayer or on scaffold. On day 2 of culture cells were transfected with a β-catenin reporter plasmid and luminescence was assayed at the indicated timepoints (D3-7). LLC1 monolayer were also transfected with β-catenin reporter plasmid and treated with TS (1µM), AD(2.5nM) or combination after 24hr. Luminescence was assayed at 72hr. N=3 *p≤0.05. B. Relative β-catenin abundance and phosphorylation in drug treated LLC1 tumors was assayed using a Phospho antibody array (Full Moon Biosystems). Relative normalized fold change was calculated using Graph Pad Prism software. One way ANOVA was used to determine significance. N=6 *p≤0.05

81
activation. LLC1 cultured on scaffold were shown to have higher levels of active β-
catenin than LLC1 monolayer cultures (Figure 33A). Also, monolayer LLC1 cultures
treated with AD + TS had significantly reduced levels of active β-catenin (Figure 33A-B).
This finding is significant because β-catenin activity is known to drive both metastasis
and the CSC phenotype in breast cancer, colon cancer, and hepatocellular carcinoma
and because there are currently no drugs approved to target the Wnt/β-catenin
pathway.(25-29) In addition, AD+TS treated tumors were found to express lower levels
of both total and active phospho-β-catenin (Figure 33B).
To further investigate the effects of the combination treatment on the Wnt/β-catenin
pathway we performed an analysis of protein phosphorylation on drug-treated LLC1
tumor samples using an antibody array chip (Full Moon Biosystems). Overall activation
of the Wnt pathway was reduced by the combination treatment and several key
changes to the pathway were observed including decreased production of Wnt 5a and
decreased activation of CaMk2 and CKI gamma indicating that the treatment may be
affecting the Wnt/calcium pathway in addition to the canonical Wnt/β catenin pathway
(Figure 34). Downstream effectors of the Wnt pathway were also found to be reduced
following AD+TS treatment including phospho-MAPK, phospho-Src, and phospho-AKT
indicating that the processes of cell growth and proliferation controlled by these
pathways may be reduced by AD+TS treatment. This finding corroborates the RNA-Seq
results shown in figure 32, which indicated decreased cell proliferation in LLC1 tumors
following AD+TS treatment.
To confirm that the canonical Wnt pathway is inhibited by AD+TS treatment we
performed western immunoassays for the Wnt ligand binding co-receptor LRP6.

82
Tumoroid culture was found to increase both the expression and phosphorylation of
LRP6 compared to monolayer culture in LLC1, and AD+TS treatment was found to
inhibit LRP6 expression. (Figure 35A-B). This was repeated in protein isolated from
drug-treated LLC1 tumors to confirm the phenomenon in vivo, and indeed total LRP6
was found to be lower in the AD+TS group (Figure 35C). Phospho-LRP6 was not
observed in tumor samples possibly due to a limitation of the antibody or lower
abundance of the phosphor-protein in vivo.
Figure 34. Activation of Canonical Wnt Signaling is Reduced by AD and TS Combination Treatment
Relative protein abundance and phosphorylation for Wnt pathway proteins in drug treated LLC1 tumors. Protein was collected from drug treated LLC1 tumors and a phospho antibody array assay was performed to determine changes occurring in the Wnt pathway. (Full Moon Biosystems) Relative normalized fold change was calculated and graphed for select proteins using Graph Pad Prism software. N=6 (*= decrease vs control) p≤0.05

83
Figure 35. Expression and Activation of the Wnt Co-Receptor LRP6 is Reduced by AD and TS Combination Treatment
Expression of the frizzled co-receptor protein LRP6 was determined by western immunoassay in LLC cell line (A) and tumor (C) samples. In the LLC cell line levels of active phospo-LRP6 was also determined (B) and tumoroid groups were compared to monolayer as a control. Cells were treated with 10µM TS, 48nM AD or the combination for 48hr. Assays were performed using the Wes system (Protein Simple).

84
The IPA analysis also predicted AD and TS to interact via generation of reactive
oxygen species. (ROS) Therefore we used a ROS indicator dye (CM-H2DCFDA) to
determine whether ROS production is increased in LLC1 following treatment. Figure 36
shows that TS is a potent activator of ROS resulting in a 19% increase after 1µM
treatment. When combined with a low dose of AD (0.4nM), which is only able to
generate a 5% increase on its own, the AD+TS combination worked synergistically to
cause an almost 30% increase in ROS.
Figure 36. AD and TS Combination Synergistically Increases Production of ROS
Production of ROS was assayed in LLC1 monolayer cultures treated with 0.4nM AD, 1µM TS, or the combination for 48hr. The dye CM-H2DCFDA was used as an indicator of general oxidative stress. Staining was assessed using fluorescent microscopy (B) while brightfield images were also collected for each field as a reference (A). Staining was also assayed by flow cytometry using the FITC channel (C).

85
7.3 Discussion
A significant in vivo mechanistic finding of our studies is that the efficacy of the
novel AD+TS combination treatment approach involves anti-CSC effects, which are at
least partially mediated by alterations in the Wnt/β-catenin pathway, leading to
decreased activity of key cell proliferation signals and ultimately apoptosis through a
mechanism involving increased ROS production and caspase-3 cleavage. This finding
is significant in part because as discussed in chapter 4, expansion of CSC in the lung
tumoroid model coincided with increased β-catenin transcriptional activity and
expression of Wnt/β-catenin target genes highlighting the importance of this pathway
driving the acquisition of the CSC phenotype. Indeed the enhanced cell-cell and cell-
scaffold interactions promoted by tumoroid growth may be crucial to initiating this β-
catenin activation either by signaling through the cell adhesion molecules E-cadherin or
N-cadherin or through the rearrangement of adherens junctions, but more work is
needed to determine the validity of this hypothesis.
By combining the techniques of RNA-Seq and phosphor-protein analysis, we
have profiled the effects of AD+TS treatment on the Wnt/β-catenin pathway as well as
its downstream effects on cellular properties such as migration, proliferation, and tumor
growth. Wnt5a, which we have found to be elevated in LLC1 tumors and which was
reduced by our combination treatment, has been reported to act as either a tumor
promoter or tumor suppressor depending on the cancer type [154]. In NSCLC it has
previously been associated with tumor cell proliferation and expansion of CSC [155,

86
156]. This diverse activity may be attributed to the fact that Wnt5a can either activate or
inhibit β-catenin phosphorylation through the canonical Wnt pathway depending on the
cellular context. Its function depends on its binding to ROR1/2 (receptor tyrosine kinase-
like orphan receptor) in the presence or absence of frizzled [157]. When Wnt5a
activates β-catenin after binding to the FZD-4/5 LRP5/6 complex, downstream PPARγ
activation is suppressed, and β-catenin/TCF target genes are transcribed [155, 158].
Wnt5a can also suppress PPARγ activation through the alternative Wnt/calcium
pathway through a calmodulin-dependent mechanism involving NLK [158]. In this way,
activation of canonical Wnt or Wnt/calcium signaling which lead to cell proliferation and
acquisition of CSC traits can be linked to a decrease in PPARγ activity [159].
Alternatively, when Wnt5a binds to ROR2 in the absence of FZD, β-catenin
activation is inhibited. TS is known to activate PPARγ as a partial agonist, which can, in
turn, inhibit activation of β-catenin either by stabilizing the APC/GS3kβ destruction
complex or by inhibiting the translocation of β-catenin to the nucleus [160-163]. This
mechanism has been shown to be involved in the differentiation of MSCs into
osteoblasts [158]. The inhibition of β-catenin activation in this manner not only reduces
its pro-proliferation signal but also reduces the cell’s ability to repair the DNA damage
caused by AD treatment [164]. It is known that inhibition of the Wnt/β-catenin pathway
can promote DNA damage in the presence of the genotoxic chemical benzo[a]pyrene,
so it is likely to also promote DNA damage in the presence of genotoxic concentrations
of AD [165]. In addition to inhibiting transcription, AD can also cause double-stranded
breaks in DNA leading to increased levels of ROS, which in turn can enhance apoptosis
[166-168]. This may further contribute to the apoptosis-inducing synergistic action of TS

87
in the combination treatment since other PPARγ agonists have been demonstrated to
increase ROS levels in lung cancer cells by altering glucose metabolism to reduce
glutathione levels ultimately resulting in cell cycle arrest [169]. This effect appears to be
dependent on TS’s activation of PPARγ and therefore distinct from its angiotensin
inhibition dependent anti-inflammatory, cyto-protective role.
The dual stimulation of ROS production that occurs as a result of the
combination treatment may play a key role in the treatment’s ability to precisely target
CSC through the Wnt pathway, since ROS themselves can regulate the transcriptional
activity of β-catenin [170]. Our data show that the combination of genotoxic AD with
TS’s multiple effects regulating metabolism and inflammation is able to reduce tumor
burden and simultaneously reduce expression of CSC markers in both in vitro and in
vivo models of lung cancer. TS is known to induce ROS production via activation of
PPAR gamma, and TS is also known to inhibit JAK/STAT signaling[171]. TS alone has
been reported to induce apoptosis in some cancer cell lines including prostate and
colon, but conflicting reports suggest that this effect is not universal to all cancers. [172,
173]. We have implicated Wnt signaling as a target of this treatment and reported the
treatment’s effects on both the canonical and Wnt/calcium pathways. Future directions
will include further investigation into the regulatory mechanism by which changes in
ROS and PPARγ activity induced by these drugs are able to alter the transcription and
function of Wnt target genes to reduce the stemness of CSC.
In sum, our results thus far have demonstrated that CSCs expand in lung cancer
tumoroids and tumors wherein the Wnt signaling pathway plays a crucial role in lung
CSC development, and this signaling involves several important known targets such as

88
Sox2, ALDH, and Nos2. Further, novel combination treatment was designed using two
known FDA-approved drugs, AD and TS, which not only reduced the expression of
stemness markers in lung cancer tumoroids in vitro but also was able to reduce tumor
growth in vivo. Moreover, the pivotal role of the Wnt signaling pathway was
demonstrated in the synergism underlying the combination therapy.

89
CHAPTER 8
Conclusion
In conclusion, we have demonstrated and validated a novel in vitro model for lung
CSC culture and successfully used this model to identify both a novel pathway
regulating CSC growth (NPRA) and a novel treatment targeting CSC (AD+TS). To our
knowledge, our lab is the first to demonstrate the importance of NPRA signaling in CSC
development linking it with increased self-renewal and tumor initiation. We are also the
first to demonstrate the effectiveness of the AD+TS treatment both in vitro and in vivo
targeting CSC and reducing tumor burden through a Wnt/ β-catenin dependent
mechanism.
In chapter 4 we provided evidence that our 3D tumoroid model truly enhances the
growth of CSC in lung cancer cell lines and biopsies finding a positive correlation
between tumoroid growth and expression of the CSC markers including ALDH,
CD44+/24-, and the transcription factors Sox2, Oct4, and Nanog. Also, we established
that CSC within tumoroids identified by these markers were able to initiate tumors in
vivo at low cell concentrations validating their status as true CSC. Through examination
of the gene expression changes that occur in the tumoroid model, we identified Wnt/ β-
catenin signaling as a crucial pathway promoting lung CSC growth. This pathway has
been previously described as a promotor of CSC in multiple cancers including lung,
colon, and hepatocellular carcinoma lending support to the validity of the tumoroid
model.

90
In chapter 5 we have shown how the tumoroid model can be used to enrich CSC in
culture in an effort to discover novel pathways regulating their growth. We have
identified that the expression of NPRA is correlated with CSC marker expression and
that inhibition of NPRA signaling impairs the ability of lung CSC to self-renew and to
initiate tumors. To our knowledge, this represents the first implication of the NPRA
pathway as a driver of stem-ness in cancer revealing NPRA as a novel target for future
studies aiming to develop treatments targeting CSC.
Figure 37. Summary of changes to the Wnt pathway as a result of AD+TS Treatment

91
In chapter 6 we demonstrate the effectiveness of the tumoroid model though
validating by screening for CSC targeted drugs. We show that cells grown as tumoroids
are more resistant to drug treatments and thus are a better replication of in vivo tumors.
We have characterized the effects of our novel combination treatment (AD+TS) and its
ability to decrease lung cancer tumoroid viability, ALDH activity, self-renewal through
sphere formation, and even formation of the tumoroids themselves resulting in the
induction of apoptosis through cleavage of caspase-3. The anti-CSC action of the
AD+TS combination treatment was further validated using both an in vivo syngenic
model and an in vivo xenograft model where it decreased tumor size and growth rate in
addition to ALDH activity.
Finally, in chapter 7 we investigated the molecular mechanisms responsible for
AD+TS’s ability to target CSC and the involvement of Wnt/ β-catenin signaling. We
began by surveying the gene expression changes caused by AD+TS treatment in vivo
using RNASeq which confirmed our in vitro results demonstrating that AD+TS treatment
reduces tumor incidence. We observed a decrease in active β-catenin following AD+TS
treatment in monolayer, tumoroid, and in vivo tumors as well as signaling intermediaries
downstream of β-catenin including phospho-AKT, and phospho-MAPK. We also
identified decreased activation of an upstream activator of β-catenin, LRP6, further
supporting the downregulation of canonical Wnt/ β-catenin signaling. A summary of
these effects can be seen in figure 37. Additionally, ROS generation was increased by
AD+TS treatment, which offers a possible mechanism for the observed induction of
apoptosis and changes in Wnt signaling, but further investigation is needed in this area.

92
Taken together, the results presented in these studies have highlighted the importance
of NPRA and Wnt/ β-catenin signaling in the acquisition of CSC traits in lung cancer.
The knowledge acquired from this study could be useful in the future to develop cancer
therapies targeting CSC, and ultimately improving patient outcomes.

93
References
1. Noone AM, H.N., Krapcho M, Miller D, Brest A, Yu M, Ruhl J, Tatalovich Z, Mariotto A, Lewis DR, Chen HS, Feuer EJ, Cronin KA SEER Cancer Statistics Review, 1975-2015, National Cancer Institute. Bethesda, MD, .
2. Siegel, R.L., K.D. Miller, and A. Jemal, Cancer statistics, 2018. CA Cancer J Clin, 2018. 68(1): p. 7-30.
3. Society, A.C., Cancer Facts & Figures 2018, A.C. Society, Editor. 2018: Atlanta. 4. Meza, R., et al., Lung Cancer Incidence Trends by Gender, Race and Histology
in the United States, 1973–2010. PLOS ONE, 2015. 10(3): p. e0121323. 5. Aisner, D.L., et al., The Impact of Smoking and TP53 Mutations in Lung
Adenocarcinoma Patients with Targetable Mutations—The Lung Cancer Mutation Consortium (LCMC2). Clinical Cancer Research, 2018. 24(5): p. 1038.
6. Kim, E.S., Chemotherapy Resistance in Lung Cancer. Adv Exp Med Biol, 2016. 893: p. 189-209.
7. Lapidot, T., et al., A cell initiating human acute myeloid leukaemia after transplantation into SCID mice. (0028-0836 (Print)).
8. Reagan, M.R. and D.L. Kaplan, Mesenchymal Stem Cell Tumor-Homing: Detection Methods in Disease Model Systems. Stem cells (Dayton, Ohio), 2011. 29(6): p. 920-927.
9. Yuan, Z., et al., TRAIL delivery by MSC-derived extracellular vesicles is an effective anticancer therapy. J Extracell Vesicles, 2017. 6(1): p. 1265291.
10. Kuhn, N.Z. and R.S. Tuan, Regulation of stemness and stem cell niche of mesenchymal stem cells: implications in tumorigenesis and metastasis. J Cell Physiol, 2010. 222(2): p. 268-77.
11. Liu, S., et al., Breast cancer stem cells are regulated by mesenchymal stem cells through cytokine networks. Cancer Res, 2011. 71(2): p. 614-24.
12. Hill, R.P., Identifying cancer stem cells in solid tumors: case not proven. Cancer Res, 2006. 66(4): p. 1891-5; discussion 1890.
13. Welte, Y., et al., Cancer stem cells in solid tumors: elusive or illusive? Cell Commun Signal, 2010. 8(1): p. 6.
14. Batlle, E. and H. Clevers, Cancer stem cells revisited. Nat Med, 2017. 23(10): p. 1124-1134.
15. Tammela, T., et al., A Wnt-producing niche drives proliferative potential and progression in lung adenocarcinoma. Nature, 2017. 545(7654): p. 355-359.
16. de Sousa e Melo, F., et al., A distinct role for Lgr5(+) stem cells in primary and metastatic colon cancer. Nature, 2017. 543(7647): p. 676-680.
17. Blanpain, C. and B.D. Simons, Unravelling stem cell dynamics by lineage tracing. Nature Reviews Molecular Cell Biology, 2013. 14: p. 489.

94
18. Quintana, E., et al., Efficient tumour formation by single human melanoma cells. Nature, 2008. 456: p. 593.
19. Tata, P.R., et al., Dedifferentiation of committed epithelial cells into stem cells in vivo. Nature, 2013. 503(7475): p. 218-23.
20. Kobayashi, S., et al., LGR5-positive colon cancer stem cells interconvert with drug-resistant LGR5-negative cells and are capable of tumor reconstitution. Stem Cells, 2012. 30(12): p. 2631-44.
21. Vermeulen, L., et al., Wnt activity defines colon cancer stem cells and is regulated by the microenvironment. Nat Cell Biol, 2010. 12(5): p. 468-76.
22. S, S.F., et al., In vitro models of cancer stem cells and clinical applications. BMC Cancer, 2016. 16(Suppl 2): p. 738.
23. Agliano, A., A. Calvo, and C. Box, The challenge of targeting cancer stem cells to halt metastasis. Semin Cancer Biol, 2017. 44: p. 25-42.
24. Valery Adorno-Cruz, G.K., Xia Liu, Mary Doherty, Damian J. Junk, Dongyin Guan, Chris Hubert, Monica Venere, Erin Mulkearns-Hubert, Maksim Sinyuk, Alvaro Alvarado, Arnold I. Caplan, Jeremy Rich, Stanton L. Gerson, Justin Lathia and Huiping Liu, Cancer Stem Cells: Targeting the Roots of Cancer, Seeds of Metastasis, and Sources of Therapy Resistance. Vol. 75. 2015.
25. Miyata, T., et al., The Clinical Significance of Cancer Stem Cell Markers ALDH1A1 and CD133 in Lung Adenocarcinoma. Anticancer Res, 2017. 37(5): p. 2541-2547.
26. Tian, S., Y.N. Xing, and P. Xia, The prognostic roles of circulating ALDH1(+) tumor cell in the patients with non-small cell lung cancer. Biosci Rep, 2018.
27. Sarvi, S., et al., CD133+ cancer stem-like cells in small cell lung cancer are highly tumorigenic and chemoresistant but sensitive to a novel neuropeptide antagonist. Cancer Res, 2014. 74(5): p. 1554-65.
28. Camerlingo, R., et al., The role of CD44+/CD24-/low biomarker for screening, diagnosis and monitoring of breast cancer. (1791-2431 (Electronic)).
29. Lam, C.S., et al., Prognostic significance of CD26 in patients with colorectal cancer. PLoS One, 2014. 9(5): p. e98582.
30. Lin, Z., et al., Association of Cancer Stem Cell Markers With Aggressive Tumor Features in Papillary Thyroid Carcinoma. Cancer Control, 2015. 22(4): p. 508-14.
31. Abbaszadegan, M.R., et al., Isolation, identification, and characterization of cancer stem cells: A review. J Cell Physiol, 2017. 232(8): p. 2008-2018.
32. Colak, S. and J.P. Medema, Cancer stem cells--important players in tumor therapy resistance. (1742-4658 (Electronic)).
33. Shibue, T. and R.A. Weinberg, EMT, CSCs, and drug resistance: the mechanistic link and clinical implications. Nat Rev Clin Oncol, 2017. 14(10): p. 611-629.
34. Raha, D., et al., The cancer stem cell marker aldehyde dehydrogenase is required to maintain a drug-tolerant tumor cell subpopulation. Cancer Res, 2014. 74(13): p. 3579-90.
35. Otvos, B., et al., Cancer Stem Cell-Secreted Macrophage Migration Inhibitory Factor Stimulates Myeloid Derived Suppressor Cell Function and Facilitates Glioblastoma Immune Evasion. Stem Cells, 2016. 34(8): p. 2026-39.
36. Mitra, A., L. Mishra, and S. Li, EMT, CTCs and CSCs in tumor relapse and drug-resistance. (1949-2553 (Electronic)).

95
37. Yi, Y., et al., Glioblastoma Stem-Like Cells: Characteristics, Microenvironment, and Therapy. Front Pharmacol, 2016. 7: p. 477.
38. Stankevicius, V., et al., The expression of cancer stem cell markers in human colorectal carcinoma cells in a microenvironment dependent manner. Biochem Biophys Res Commun, 2017. 484(4): p. 726-733.
39. Harner-Foreman, N., et al., A novel spontaneous model of epithelial-mesenchymal transition (EMT) using a primary prostate cancer derived cell line demonstrating distinct stem-like characteristics. Sci Rep, 2017. 7: p. 40633.
40. Larzabal, L., et al., Differential effects of drugs targeting cancer stem cell (CSC) and non-CSC populations on lung primary tumors and metastasis. PLoS One, 2013. 8(11): p. e79798.
41. Guo, F., et al., CXCL12/CXCR4: a symbiotic bridge linking cancer cells and their stromal neighbors in oncogenic communication networks. Oncogene, 2015. 35: p. 816.
42. Chatterjee, S., B.B. Azad, and S. Nimmagadda, The Intricate Role of CXCR4 in Cancer. Advances in cancer research, 2014. 124: p. 31-82.
43. Marotta, L.L., et al., The JAK2/STAT3 signaling pathway is required for growth of CD44(+)CD24(-) stem cell-like breast cancer cells in human tumors. J Clin Invest, 2011. 121(7): p. 2723-35.
44. Opyrchal, M., et al., Inhibition of Cdk2 kinase activity selectively targets the CD44(+)/CD24(-)/Low stem-like subpopulation and restores chemosensitivity of SUM149PT triple-negative breast cancer cells. (1791-2423 (Electronic)).
45. Singh, S., et al., EGFR/Src/Akt signaling modulates Sox2 expression and self-renewal of stem-like side-population cells in non-small cell lung cancer. Mol Cancer, 2012. 11: p. 73.
46. Chen, Q.Y., et al., Identification of carcinogenic potential-associated molecular mechanisms in CD133(+) A549 cells based on microRNA profiles. Tumour Biol, 2016. 37(1): p. 521-30.
47. Foshay, K.M. and G.I. Gallicano, Regulation of Sox2 by STAT3 initiates commitment to the neural precursor cell fate. Stem Cells Dev, 2008. 17(2): p. 269-78.
48. Samardzija, C., et al., Knockdown of stem cell regulator Oct4A in ovarian cancer reveals cellular reprogramming associated with key regulators of cytoskeleton-extracellular matrix remodelling. Sci Rep, 2017. 7: p. 46312.
49. Yan, T., et al., Characterization of cancer stem-like cells derived from mouse induced pluripotent stem cells transformed by tumor-derived extracellular vesicles. J Cancer, 2014. 5(7): p. 572-84.
50. Gao, F., et al., The role of LGR5 and ALDH1A1 in non-small cell lung cancer: Cancer progression and prognosis. Biochem Biophys Res Commun, 2015. 462(2): p. 91-8.
51. Lin, L., et al., STAT3 as a potential therapeutic target in ALDH+ and CD44+/CD24+ stem cell-like pancreatic cancer cells. Int J Oncol, 2016. 49(6): p. 2265-2274.
52. Zhong, Y., et al., ALDH1 is a better clinical indicator for relapse of invasive ductal breast cancer than the CD44+/CD24- phenotype. (1559-131X (Electronic)).

96
53. Murphy, G.F., et al., Stem cells and targeted approaches to melanoma cure. (1872-9452 (Electronic)).
54. Li, Y., et al., Pancreatic cancer stem cells: emerging target for designing novel therapy. Cancer Lett, 2013. 338(1): p. 94-100.
55. Carney Dn Fau - Gazdar, A.F., et al., Demonstration of the stem cell nature of clonogenic tumor cells from lung cancer patients. (0250-6793 (Print)).
56. O'Brien, C.A., et al., A human colon cancer cell capable of initiating tumour growth in immunodeficient mice. Nature, 2007. 445(7123): p. 106-10.
57. De Francesco, E.M., F. Sotgia, and M.P. Lisanti, Cancer stem cells (CSCs): metabolic strategies for their identification and eradication. Biochemical Journal, 2018. 475(9): p. 1611-1634.
58. Raggi, C., et al., Cancer stem cells and tumor-associated macrophages: a roadmap for multitargeting strategies. Oncogene, 2016. 35(6): p. 671-82.
59. Lamb, R., et al., Antibiotics that target mitochondria effectively eradicate cancer stem cells, across multiple tumor types: treating cancer like an infectious disease. (1949-2553 (Electronic)).
60. Takebe, N., et al., Targeting Notch, Hedgehog, and Wnt pathways in cancer stem cells: clinical update. Nat Rev Clin Oncol, 2015. 12(8): p. 445-64.
61. Girard, Y.K., et al., A 3D fibrous scaffold inducing tumoroids: a platform for anticancer drug development. PLoS One, 2013. 8(10): p. e75345.
62. Johnson, S., H. Chen, and P.K. Lo, In vitro Tumorsphere Formation Assays. Bio Protoc, 2013. 3(3).
63. Cojoc, M., et al., A role for cancer stem cells in therapy resistance: cellular and molecular mechanisms. (1096-3650 (Electronic)).
64. Liu, Y., et al., Lack of correlation of stem cell markers in breast cancer stem cells. British journal of cancer, 2014.
65. Alamgeer, M., et al., Cancer stem cells in lung cancer: Evidence and controversies. Respirology (Carlton, Vic.), 2013. 18(5): p. 757-764.
66. Nian, W.-Q., et al., CXCR4 positive cells from Lewis lung carcinoma cell line have cancer metastatic stem cell characteristics. Molecular and cellular biochemistry, 2011. 355(1-2): p. 241-248.
67. Sullivan, J., et al., Aldehyde dehydrogenase activity selects for lung adenocarcinoma stem cells dependent on notch signaling. Cancer research, 2010. 70(23): p. 9937-9948.
68. Chen, Y.-C., et al., Oct-4 expression maintained cancer stem-like properties in lung cancer-derived CD133-positive cells. PloS one, 2008. 3(7).
69. Ho, M.M., et al., Side population in human lung cancer cell lines and tumors is enriched with stem-like cancer cells. Cancer research, 2007. 67(10): p. 4827-4833.
70. Han, H., et al., An endogenous inhibitor of angiogenesis inversely correlates with side population phenotype and function in human lung cancer cells. Oncogene, 2014. 33(9): p. 1198-1206.
71. Eramo, A., et al., Identification and expansion of the tumorigenic lung cancer stem cell population. Cell Death Differ, 2008. 15(3): p. 504-14.
72. Xu, X.X., et al., Enrichment of cancer stem cell-like cells by culture in alginate gel beads. J Biotechnol, 2014. 177: p. 1-12.

97
73. Banerjee, M. and R.R. Bhonde, Application of hanging drop technique for stem cell differentiation and cytotoxicity studies. Cytotechnology, 2006. 51(1): p. 1-5.
74. Bielecka, Z.F., et al., Three-dimensional cell culture model utilization in cancer stem cell research. Biol Rev Camb Philos Soc, 2017. 92(3): p. 1505-1520.
75. Min, S.O., et al., Ideal sphere-forming culture conditions to maintain pluripotency in a hepatocellular carcinoma cell lines. Cancer Cell International, 2015. 15: p. 95.
76. Johnson, S., H. Chen, and P.-K. Lo, In vitro Tumorsphere Formation Assays. Bio-protocol, 2013. 3(3): p. e325.
77. Yang, T., et al., Cancer Stem Cells: Constantly Evolving and Functionally Heterogeneous Therapeutic Targets. Cancer research, 2014.
78. Cojoc, M., et al., Emerging targets in cancer management: role of the CXCL12/CXCR4 axis. OncoTargets and therapy, 2012. 6: p. 1347-1361.
79. Toloudi, M., et al., Comparison of the growth curves of cancer cells and cancer stem cells. Current stem cell research & therapy, 2014. 9(2): p. 112-116.
80. Yun-Hee, H.R., et al., CXCR4 and PTEN are involved in the anti-metastatic regulation of anethole in DU145 prostate cancer cells. Biochemical and biophysical research communications, 2014.
81. Zhong, Y., et al., ALDH1 is a better clinical indicator for relapse of invasive ductal breast cancer than the CD44+/CD24- phenotype. Medical oncology (Northwood, London, England), 2014. 31(3): p. 864.
82. Wang, J., et al., Lung Cancer Stem Cells and Implications for Future Therapeutics. Cell biochemistry and biophysics, 2014.
83. Gottschling, S., et al., Are we missing the target? Cancer stem cells and drug resistance in non-small cell lung cancer. Cancer genomics & proteomics, 2011. 9(5): p. 275-286.
84. Mircea, G.S., et al., A new strategy in the treatment of chemoresistant lung adenocarcinoma via specific siRNA transfection of SRF, E2F1, Survivin, HIF and STAT3. European journal of cardio-thoracic surgery : official journal of the European Association for Cardio-thoracic Surgery, 2014.
85. Girard, Y., et al., A 3D fibrous scaffold inducing tumoroids: a platform for anticancer drug development. PloS one, 2013. 8(10).
86. Bono, D.J.S. and A. Ashworth, Translating cancer research into targeted therapeutics. Nature, 2010. 467(7315): p. 543-549.
87. Pampaloni, F., E.G. Reynaud, and E.H.K. Stelzer, The third dimension bridges the gap between cell culture and live tissue. Nature reviews Molecular …, 2007.
88. DuPage, M., A.L. Dooley, and T. Jacks, Conditional mouse lung cancer models using adenoviral or lentiviral delivery of Cre recombinase. Nature protocols, 2008. 4(7): p. 1064-1072.
89. Feng, S., et al., Expansion of breast cancer stem cells with fibrous scaffolds. Integr Biol (Camb), 2013. 5(5): p. 768-77.
90. Yu, Y., et al., Antiangiogenic therapy using endostatin increases the number of ALDH+ lung cancer stem cells by generating intratumor hypoxia. Sci Rep, 2016. 6: p. 34239.
91. Balla, M., et al., Cellular and spectroscopic characterization of cancer stem cell-like cells derived from A549 lung carcinoma. 2016. 12(3): p. 1144-1152.

98
92. Nurwidya, F., et al., CD44 silencing decreases the expression of stem cell-related factors induced by transforming growth factor beta1 and tumor necrosis factor alpha in lung cancer: Preliminary findings. Bosn J Basic Med Sci, 2017. 17(3): p. 228-234.
93. Li, Y., et al., Effect of nitric oxide synthase on multiple drug resistance is related to Wnt signaling in non-small cell lung cancer. (1791-2431 (Electronic)).
94. Cardona, A., et al., 77PThe reduction of the expression of B-catenin and c-Myc is related to a better outcome in patients with AML. Annals of Oncology, 2018. 29(suppl_6): p. mdy314.018-mdy314.018.
95. Flanagan, D.J., et al., Frizzled7 functions as a Wnt receptor in intestinal epithelial Lgr5(+) stem cells. Stem Cell Reports, 2015. 4(5): p. 759-67.
96. Yoshida, G.J. and H. Saya, Inversed relationship between CD44 variant and c-Myc due to oxidative stress-induced canonical Wnt activation. Biochemical and Biophysical Research Communications, 2014. 443(2): p. 622-627.
97. You, Z., et al., Wnt signaling promotes oncogenic transformation by inhibiting c-Myc-induced apoptosis. J Cell Biol, 2002. 157(3): p. 429-40.
98. Pandey, K.N., Biology of natriuretic peptides and their receptors. Peptides, 2005. 26(6): p. 901-932.
99. Pandey, K.N., Guanylyl Cyclase/Atrial Natriuretic Peptide Receptor-A: Role in the Pathophysiology of Cardiovascular Regulation. Canadian Journal of Physiology and Pharmacology, 2011. 89(8): p. 557-573.
100. Kiemer, A.K. and A.M. Vollmar, The atrial natriuretic peptide regulates the production of inflammatory mediators in macrophages. Annals of the Rheumatic Diseases, 2001. 60(suppl 3): p. iii68.
101. Kato, H., et al., Atrial natriuretic peptide ameliorates peritoneal fibrosis in rat peritonitis model. Nephrol Dial Transplant, 2012. 27(2): p. 526-36.
102. Abdelalim, E.M. and I. Tooyama, NPR-A regulates self-renewal and pluripotency of embryonic stem cells. Cell Death Dis, 2011. 2: p. e127.
103. Casserly, B.P., E.H. Sears, and E.J. Gartman, The role of natriuretic peptides in inflammation and immunity. Recent Pat Inflamm Allergy Drug Discov, 2010. 4(2): p. 90-104.
104. Chen, W., et al., Atrial natriuretic peptide-mediated inhibition of microcirculatory endothelial Ca2+ and permeability response to histamine involves cGMP-dependent protein kinase I and TRPC6 channels. Arterioscler Thromb Vasc Biol, 2013. 33(9): p. 2121-9.
105. De Vito, P., Atrial natriuretic peptide: an old hormone or a new cytokine? Peptides, 2014. 58: p. 108-16.
106. Mallela, J., et al., Natriuretic peptide receptor A signaling regulates stem cell recruitment and angiogenesis: a model to study linkage between inflammation and tumorigenesis. Stem Cells, 2013. 31(7): p. 1321-9.
107. Kong, X., et al., Natriuretic peptide receptor a as a novel anticancer target. Cancer research, 2007. 68(1): p. 249-256.
108. Wang, X., et al., Natriuretic peptide receptor a as a novel target for prostate cancer. Mol Cancer, 2011. 10: p. 56.
109. Kong, X., et al., Natriuretic peptide receptor a as a novel anticancer target. Cancer Res, 2008. 68(1): p. 249-56.

99
110. Li, Z., et al., Natriuretic peptide receptor A inhibition suppresses gastric cancer development through reactive oxygen species-mediated G2/M cell cycle arrest and cell death. Free Radic Biol Med, 2016. 99: p. 593-607.
111. Nakao, Y., et al., Natriuretic peptide receptor A is related to the expression of vascular endothelial growth factors A and C, and is associated with the invasion potential of tongue squamous cell carcinoma. Int J Oral Maxillofac Surg, 2017. 46(10): p. 1237-1242.
112. Zhao, Z., et al., Expression of natriuretic peptide receptor-A in esophageal squamous cell carcinomas and the relationship with tumor invasion and migration. World J Surg Oncol, 2014. 12: p. 154.
113. Pan, W.L., et al., Overexpression of CXCR4 synergizes with LL-37 in the metastasis of breast cancer cells. Biochim Biophys Acta Mol Basis Dis, 2018. 1864(11): p. 3837-3846.
114. Akman, S.A., et al., Antioxidant and xenobiotic-metabolizing enzyme gene expression in doxorubicin-resistant MCF-7 breast cancer cells. Cancer Res, 1990. 50(5): p. 1397-402.
115. Das, T., et al., Actinomycin D Down-regulates SOX2 Expression and Induces Death in Breast Cancer Stem Cells. Anticancer Res, 2017. 37(4): p. 1655-1663.
116. Ravina, A., [Actinomycin C and its antitumoral action]. Presse Med, 1953. 61(63): p. 1270-2.
117. Moore, G.E., J.A. Dipaolo, and T. Kondo, The chemotherapeutic effects and complications of actinomycin D in patients with advanced cancer. Cancer, 1958. 11(6): p. 1204-14.
118. Waksman, S.A. and H.B. Woodruff, Bacteriostatic and Bactericidal Substances Produced by a Soil Actinomyces. Proceedings of the Society for Experimental Biology and Medicine, 1940. 45(2): p. 609-614.
119. Wang, S.-Y., et al., Spermine Attenuates the Action of the DNA Intercalator, Actinomycin D, on DNA Binding and the Inhibition of Transcription and DNA Replication. PLoS ONE, 2012. 7(11): p. e47101.
120. Lo, Y.-S., et al., The structural basis of actinomycin D–binding induces nucleotide flipping out, a sharp bend and a left-handed twist in CGG triplet repeats. Nucleic Acids Research, 2013.
121. Guo, L., et al., Combination of TRAIL and actinomycin D liposomes enhances antitumor effect in non-small cell lung cancer. Int J Nanomedicine, 2012. 7: p. 1449-60.
122. Giermasz, A., et al., Potentiated antitumor effects of butyrate and actinomycin D in melanoma model in mice. Oncol Rep, 2002. 9(1): p. 199-203.
123. Lasek, W., et al., Combination of immunotherapy with cyclophosphamide/ actinomycin D chemotherapy potentiates antileukemic effect and reduces toxicity in a L1210 leukemia model in mice. Cancer Letters, 1995. 89(1): p. 137-143.
124. Lee, Y.-J., et al., Comparing and evaluating the efficacy of methotrexate and actinomycin D as first-line single chemotherapy agents in low risk gestational trophoblastic disease. Journal of Gynecologic Oncology, 2017. 28(2): p. e8.
125. Meany, H.J., et al., Phase II Trial of Recombinant Tumor Necrosis Factor-α in Combination with Dactinomycin in Children with Recurrent Wilms Tumor. Journal of immunotherapy (Hagerstown, Md. : 1997), 2008. 31(7): p. 679-683.

100
126. Rao, B., et al., Evaluation of an Actinomycin D/VX-680 aurora kinase inhibitor combination in p53-based cyclotherapy. Oncotarget, 2010. 1(7): p. 639-50.
127. Choong, M.L., et al., Specific activation of the p53 pathway by low dose actinomycin D: a new route to p53 based cyclotherapy. Cell Cycle, 2009. 8(17): p. 2810-8.
128. Godugu, C., et al., Inhalation delivery of Telmisartan enhances intratumoral distribution of nanoparticles in lung cancer models. J Control Release, 2013. 172(1): p. 86-95.
129. Patel, K., et al., Tumor stromal disrupting agent enhances the anticancer efficacy of docetaxel loaded PEGylated liposomes in lung cancer. Nanomedicine (Lond), 2016. 11(11): p. 1377-92.
130. Zhang, S. and Y. Wang, Telmisartan inhibits NSCLC A549 cell proliferation and migration by regulating the PI3K/AKT signaling pathway. Oncol Lett, 2018. 15(4): p. 5859-5864.
131. Li, J., et al., Telmisartan exerts anti-tumor effects by activating peroxisome proliferator-activated receptor-gamma in human lung adenocarcinoma A549 cells. Molecules, 2014. 19(3): p. 2862-76.
132. Chen, Y., et al., Telmisartan counteracts TGF-β1 induced epithelial–to–mesenchymal transition via PPAR-γ in human proximal tubule epithelial cells. International Journal of Clinical and Experimental Pathology, 2012. 5(6): p. 522-529.
133. Chang, W.-T., J.-T. Cheng, and Z.-C. Chen, Telmisartan improves cardiac fibrosis in diabetes through peroxisome proliferator activated receptor δ (PPARδ): from bedside to bench. Cardiovascular Diabetology, 2016. 15: p. 113.
134. Fanale, D., V. Amodeo, and S. Caruso, The Interplay between Metabolism, PPAR Signaling Pathway, and Cancer. PPAR Res, 2017. 2017: p. 1830626.
135. Roy, A. and S. Bera, CAF cellular glycolysis: linking cancer cells with the microenvironment. Tumour Biol, 2016. 37(7): p. 8503-14.
136. Leon, G., et al., Cancer stem cells in drug resistant lung cancer: Targeting cell surface markers and signaling pathways. Pharmacol Ther, 2016. 158: p. 71-90.
137. Hanna, A. and L.A. Shevde, Hedgehog signaling: modulation of cancer properies and tumor mircroenvironment. Mol Cancer, 2016. 15: p. 24.
138. Kim, S.M., et al., Activation of IL-6R/JAK1/STAT3 signaling induces de novo resistance to irreversible EGFR inhibitors in non-small cell lung cancer with T790M resistance mutation. Mol Cancer Ther, 2012. 11(10): p. 2254-64.
139. Sandsmark, E., et al., A novel non-canonical Wnt signature for prostate cancer aggressiveness. Oncotarget, 2017. 8(6): p. 9572-9586.
140. Giles, R.H., J.H. van Es, and H. Clevers, Caught up in a Wnt storm: Wnt signaling in cancer. Biochim Biophys Acta, 2003. 1653(1): p. 1-24.
141. Nusse, R., WNT targets. Repression and activation. Trends Genet, 1999. 15(1): p. 1-3.
142. Mohammed, M.K., et al., Wnt/beta-catenin signaling plays an ever-expanding role in stem cell self-renewal, tumorigenesis and cancer chemoresistance. Genes Dis, 2016. 3(1): p. 11-40.

101
143. Verkaar, F. and G.J. Zaman, A model for signaling specificity of Wnt/Frizzled combinations through co-receptor recruitment. FEBS Lett, 2010. 584(18): p. 3850-4.
144. Grumolato, L., et al., Canonical and noncanonical Wnts use a common mechanism to activate completely unrelated coreceptors. Genes Dev, 2010. 24(22): p. 2517-30.
145. Dumont, N.A. and M.A. Rudnicki, Targeting muscle stem cell intrinsic defects to treat Duchenne muscular dystrophy. NPJ Regenerative Medicine, 2016. 1: p. 16006.
146. Vilarinho, S., et al., Paediatric hepatocellular carcinoma due to somatic CTNNB1 and NFE2L2 mutations in the setting of inherited bi-allelic ABCB11 mutations. J Hepatol, 2014. 61(5): p. 1178-83.
147. Kang, X., et al., The ITIM-containing receptor LAIR1 is essential for acute myeloid leukaemia development. Nat Cell Biol, 2015. 17(5): p. 665-77.
148. Huang, W., et al., Inhibition of Bevacizumab-induced Epithelial-Mesenchymal Transition by BATF2 Overexpression Involves the Suppression of Wnt/beta-Catenin Signaling in Glioblastoma Cells. Anticancer Res, 2017. 37(8): p. 4285-4294.
149. Del Valle-Perez, B., et al., Coordinated action of CK1 isoforms in canonical Wnt signaling. Mol Cell Biol, 2011. 31(14): p. 2877-88.
150. Ruiduo, C., D. Ying, and W. Qiwei, CXCL9 promotes the progression of diffuse large B-cell lymphoma through up-regulating beta-catenin. Biomed Pharmacother, 2018. 107: p. 689-695.
151. Zhang, S., et al., Co-ordinated overexpression of SIRT1 and STAT3 is associated with poor survival outcome in gastric cancer patients. Oncotarget, 2017. 8(12): p. 18848-18860.
152. Yang, K.T., et al., Bcr-Abl oncogene stimulates Jab1 expression via cooperative interaction of beta-catenin and STAT1 in chronic myeloid leukemia cells. J Cell Physiol, 2011. 226(11): p. 2849-56.
153. Marcato, V., et al., beta-Catenin Upregulates the Constitutive and Virus-Induced Transcriptional Capacity of the Interferon Beta Promoter through T-Cell Factor Binding Sites. Mol Cell Biol, 2016. 36(1): p. 13-29.
154. Thiele, S., et al., WNT5A and Its Receptors in the Bone-Cancer Dialogue. J Bone Miner Res, 2016. 31(8): p. 1488-96.
155. Huang, C.L., et al., Wnt5a expression is associated with the tumor proliferation and the stromal vascular endothelial growth factor--an expression in non-small-cell lung cancer. J Clin Oncol, 2005. 23(34): p. 8765-73.
156. Yang, J., et al., Wnt5a Increases Properties of Lung Cancer Stem Cells and Resistance to Cisplatin through Activation of Wnt5a/PKC Signaling Pathway. Stem Cells International, 2016. 2016: p. 1690896.
157. Asem, M.S., et al., Wnt5a Signaling in Cancer. Cancers (Basel), 2016. 8(9). 158. Okamoto, M., et al., Noncanonical Wnt5a enhances Wnt/beta-catenin signaling
during osteoblastogenesis. Sci Rep, 2014. 4: p. 4493. 159. Katoh, M., Canonical and non-canonical WNT signaling in cancer stem cells and
their niches: Cellular heterogeneity, omics reprogramming, targeted therapy and tumor plasticity (Review). Int J Oncol, 2017. 51(5): p. 1357-1369.

102
160. Lecarpentier, Y., et al., Interactions between PPAR Gamma and the Canonical Wnt/Beta-Catenin Pathway in Type 2 Diabetes and Colon Cancer. PPAR Res, 2017. 2017: p. 5879090.
161. Moldes, M., et al., Peroxisome-proliferator-activated receptor gamma suppresses Wnt/beta-catenin signalling during adipogenesis. Biochem J, 2003. 376(Pt 3): p. 607-13.
162. Lecarpentier, Y. and A. Vallee, Opposite Interplay between PPAR Gamma and Canonical Wnt/Beta-Catenin Pathway in Amyotrophic Lateral Sclerosis. Front Neurol, 2016. 7: p. 100.
163. Roarty, K., et al., Ror2-mediated alternative Wnt signaling regulates cell fate and adhesion during mammary tumor progression. Oncogene, 2017. 36(43): p. 5958-5968.
164. Zucchini-Pascal, N., L. Peyre, and R. Rahmani, Crosstalk between beta-catenin and snail in the induction of epithelial to mesenchymal transition in hepatocarcinoma: role of the ERK1/2 pathway. Int J Mol Sci, 2013. 14(10): p. 20768-92.
165. Kabatkova, M., et al., Inhibition of beta-catenin signalling promotes DNA damage elicited by benzo[a]pyrene in a model of human colon cancer cells via CYP1 deregulation. Mutagenesis, 2015. 30(4): p. 565-76.
166. Jin, C., et al., Conditioned medium from actinomycin D-treated apoptotic cells induces mitochondria-dependent apoptosis in bystander cells. Toxicol Lett, 2012. 211(1): p. 45-53.
167. Kleeff, J., et al., Actinomycin D induces apoptosis and inhibits growth of pancreatic cancer cells. International Journal of Cancer, 2000. 86(3): p. 399-407.
168. Yokoyama, C., et al., Induction of oxidative stress by anticancer drugs in the presence and absence of cells. Oncol Lett, 2017. 14(5): p. 6066-6070.
169. Srivastava, N., et al., Inhibition of cancer cell proliferation by PPARgamma is mediated by a metabolic switch that increases reactive oxygen species levels. Cell Metab, 2014. 20(4): p. 650-61.
170. Hoogeboom, D. and B.M. Burgering, Should I stay or should I go: beta-catenin decides under stress. Biochim Biophys Acta, 2009. 1796(2): p. 63-74.
171. Rasheduzzaman, M., et al., Telmisartan generates ROS-dependent upregulation of death receptor 5 to sensitize TRAIL in lung cancer via inhibition of autophagy flux. Int J Biochem Cell Biol, 2018. 102: p. 20-30.
172. Fujihara, S., et al., The angiotensin II type 1 receptor antagonist telmisartan inhibits cell proliferation and tumor growth of esophageal adenocarcinoma via the AMPKa/mTOR pathway in vitro and in vivo. Oncotarget, 2017. 8(5): p. 8536-8549.
173. Lee, L.D., et al., Antiproliferative and apoptotic effects of telmisartan in human colon cancer cells. Oncology Letters, 2014. 8(6): p. 2681-2686.

103
Appendices

104
Appendix A: IACUC Approvals

105