ACTING ON INSIGHT SO MORE PEOPLE PLAY CRICKET MORE FREQUENTLY IN TEAMS.
38
ACTING ON INSIGHT SO MORE PEOPLE PLAY CRICKET MORE FREQUENTLY IN TEAMS
-
Upload
sandra-stephens -
Category
Documents
-
view
217 -
download
1
Transcript of ACTING ON INSIGHT SO MORE PEOPLE PLAY CRICKET MORE FREQUENTLY IN TEAMS.
ACTING ON INSIGHT SO
MORE PEOPLE PLAY CRICKET
MORE FREQUENTLY IN TEAMS

2
Number of players
Source: Play-Cricket 2011-2014. Index Group and whole database. Up to end of week 18 of season
2011 2012 2013 2014
-10% -6%
+10%
The total number of players in teams has decreased by 7%

3
2011 2012 2013 2014
Average number of weeks played per player
-8%
-7%
+13%
The average number of weeks players play has decreased by 7%
Source: Play-Cricket 2011-2014. Index Group and whole database. Up to end of week 18 of season
4
2010 2011 2012 2013 20142010 2011 2012 2013 2014
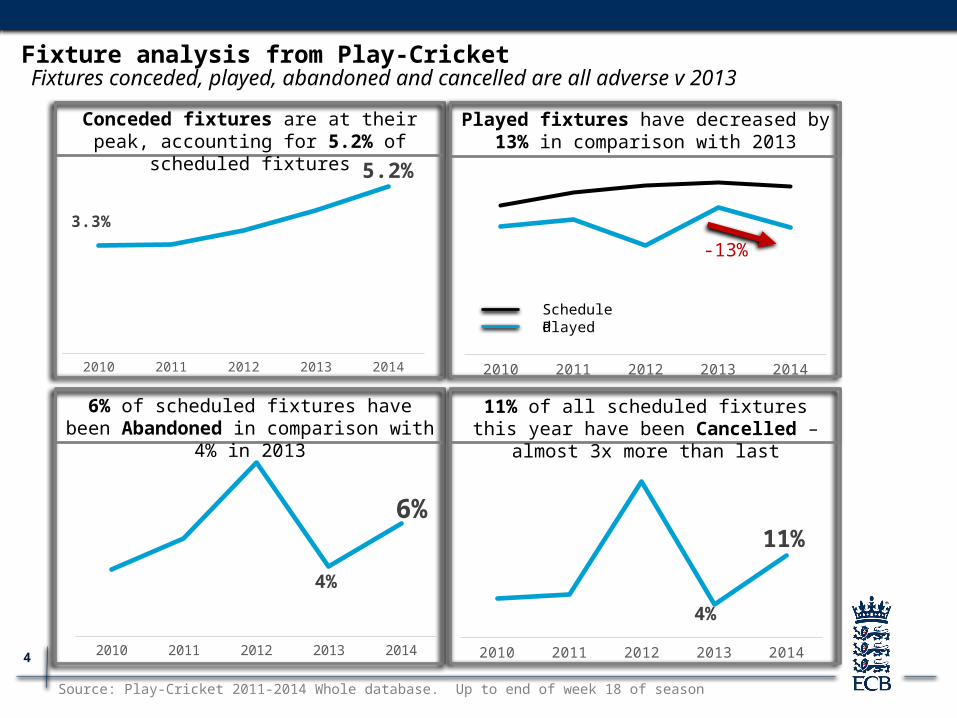
3.3%
5.2%
Conceded fixtures are at their peak, accounting for 5.2% of scheduled fixtures
6% of scheduled fixtures have been Abandoned in comparison with 4% in 2013
Played fixtures have decreased by 13% in comparison with 2013
11% of all scheduled fixtures this year have been Cancelled – almost 3x more than last
-13%
2010 2011 2012 2013 2014
4%
6%
ScheduledPlayed
2010 2011 2012 2013 2014
4%
11%
Fixtures conceded, played, abandoned and cancelled are all adverse v 2013Fixture analysis from Play-Cricket
Source: Play-Cricket 2011-2014 Whole database. Up to end of week 18 of season
5
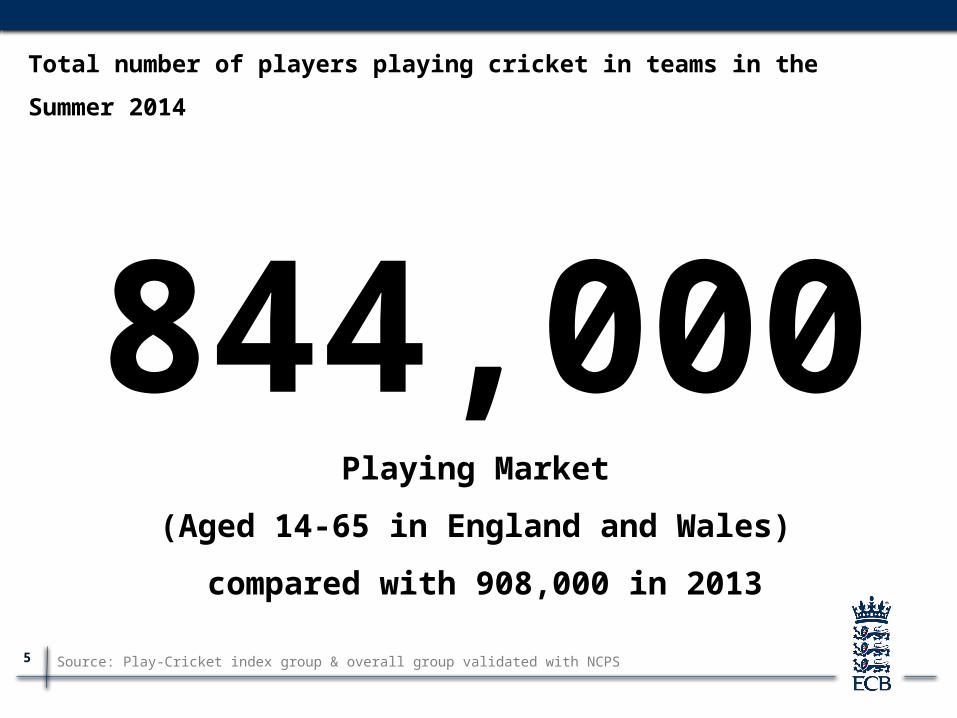
Total number of players playing cricket in teams in the Summer 2014
844,000 Playing Market
(Aged 14-65 in England and Wales)
compared with 908,000 in 2013
Source: Play-Cricket index group & overall group validated with NCPS

6
The reasons players who want to play more, don’t
Many would like to play more but can’t find the right offer
Source: NCPS 2014 DataQuestion: To what extent do you agree or disagree with the statement: ‘I would like to play more cricket’?Question: To those that would like to play more: ‘Why do you not play more?’ n=16,733
27%OFFER
Said they could play more but the cricket on offer to them doesn’t suit them
26%AVAILABILITY
Said they could play more but there is no cricket
available
47%TIME
Of players said they don’t have time

7
The reasons for not playing more, by segment
Source: NCPS 2014 DataQuestion: To what extent do you agree or disagree with the statement: ‘I would like to play more cricket’?Question: To those that would like to play more: Why do you not play more? n=16,733
14 to 19 20 to 25 26 to 34 35 to 54 55+
38%27% 20% 13% 14%
27%30%
29%26%
33%
36% 43% 50%61% 53%
Cricket availability and time prevent younger players and females playing more. The current offer is a particular problem for South Asian players
I could play more but there is none available
I could play more but what’s available doesn’t work for me
I don’t have time to play more cricket
Asian Other
28% 24%
39%22%
33%53%
Age
Ethnicity
Female Male
35%25%
27%28%
38%47%
Gender
8
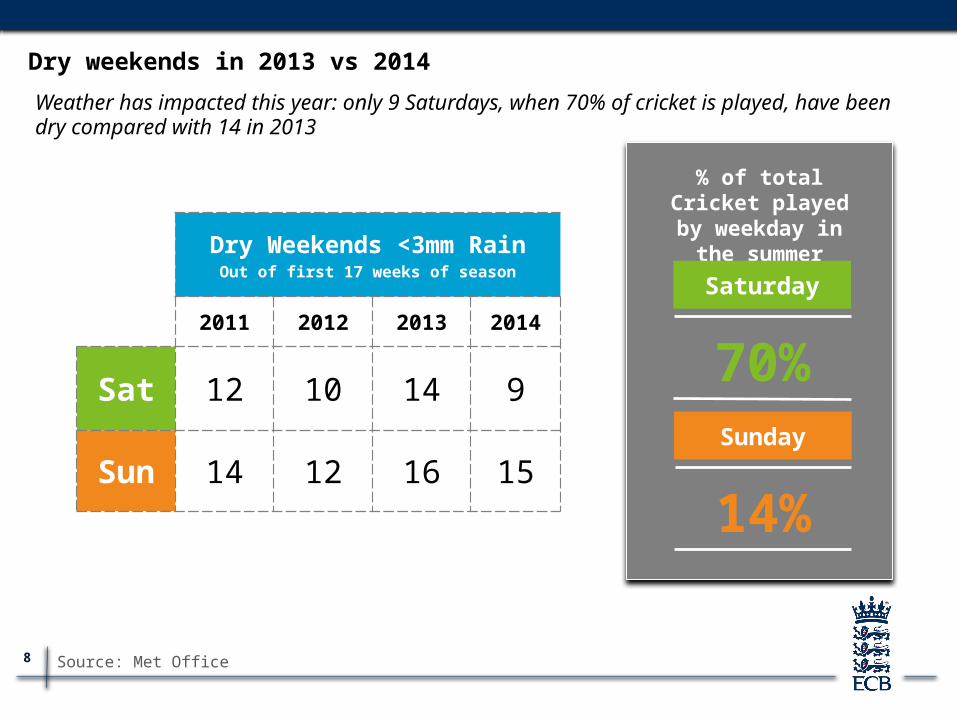
Dry weekends in 2013 vs 2014
Weather has impacted this year: only 9 Saturdays, when 70% of cricket is played, have been dry compared with 14 in 2013
Dry Weekends <3mm RainOut of first 17 weeks of season
2011 2012 2013 2014
Sat 12 10 14 9
Sun 14 12 16 15
% of total Cricket played by weekday
in the summer
70%
Saturday
14%
Sunday
Source: Met Office

9
Occasional
Core
2014 Cricket Seasonality for the market and segments
Building the shoulders of the season represents an opportunity to grow the summer market
Cameo
Source: NCPS 2014 Data Question: In what months do you play cricket? (n = 25,585)
Market
Jan Feb Mar Apr May Jun Jul Aug Sep Oct Nov Dec0%
10%
20%
30%
40%
50%
60%
70%
80%
90%
100%
10
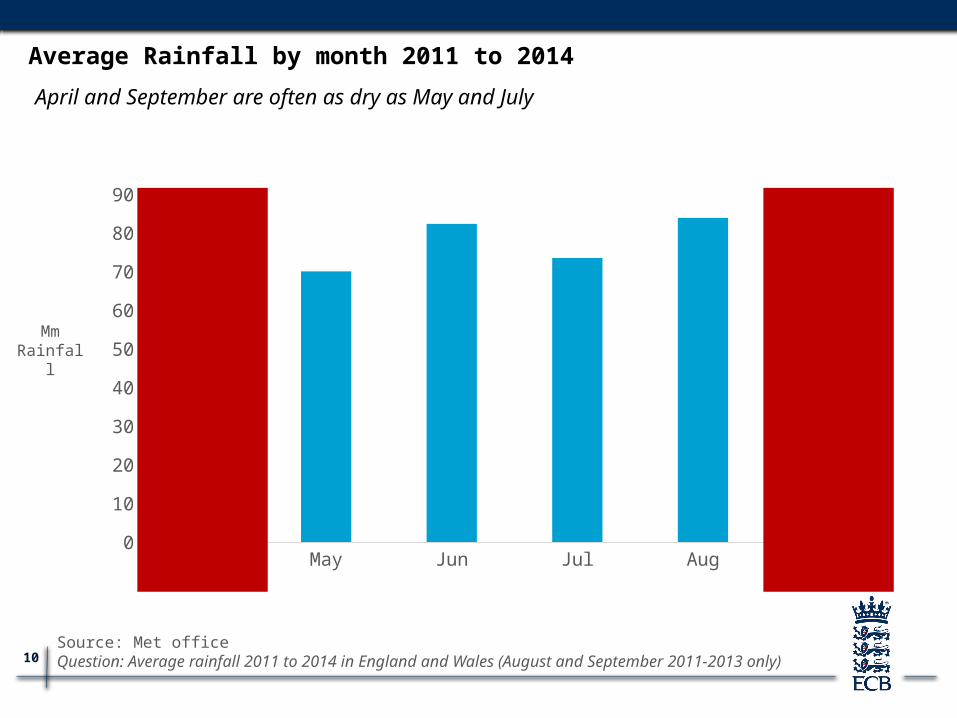
Average Rainfall by month 2011 to 2014
Apr May Jun Jul Aug Sep0
10
20
30
40
50
60
70
80
90
MmRainfall
April and September are often as dry as May and July
Source: Met officeQuestion: Average rainfall 2011 to 2014 in England and Wales (August and September 2011-2013 only)
11
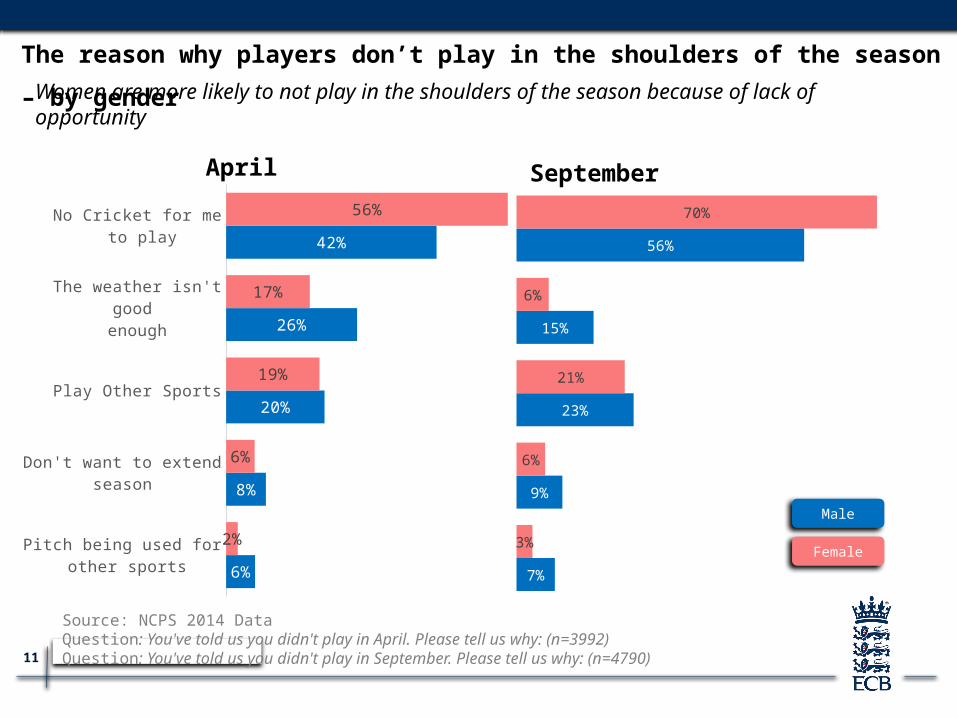
Source: NCPS 2014 DataQuestion: You've told us you didn't play in April. Please tell us why: (n=3992)Question: You've told us you didn't play in September. Please tell us why: (n=4790)
The reason why players don’t play in the shoulders of the season – by gender
Women are more likely to not play in the shoulders of the season because of lack of opportunity
Pitch being used for other sports
Don't want to extendseason
Play Other Sports
The weather isn't good
enough
No Cricket for me to play
6%
8%
20%
26%
42%
2%
6%
19%
17%
56%
April
7%
9%
23%
15%
56%
3%
6%
21%
6%
70%
September
Female
Male
12
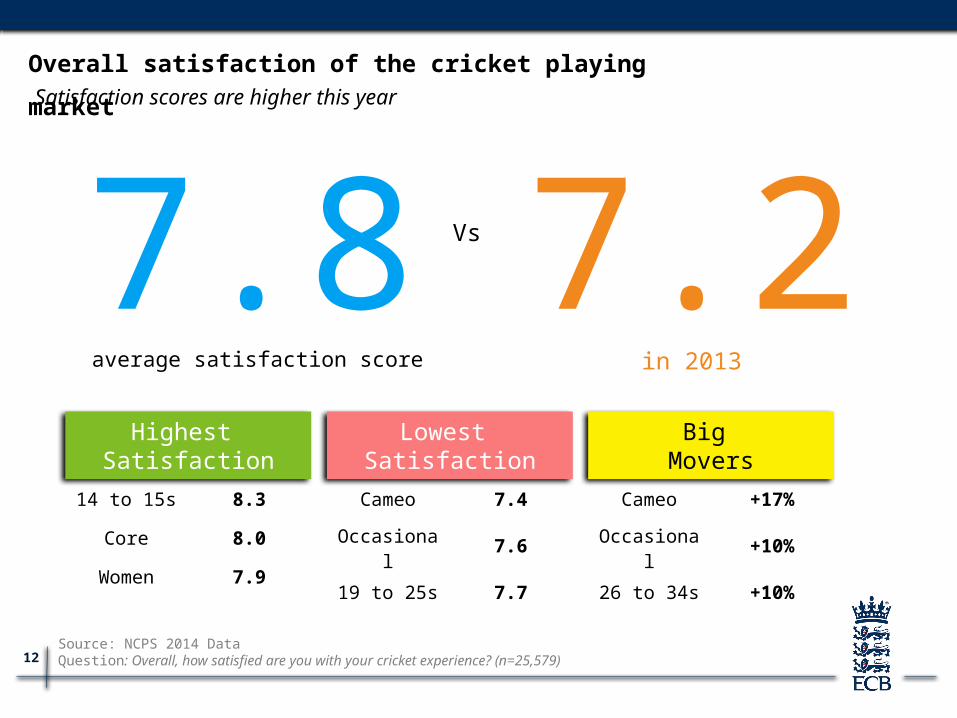
Satisfaction scores are higher this year
7.8 average satisfaction score
7.2in 2013
Vs
Overall satisfaction of the cricket playing market
Source: NCPS 2014 DataQuestion: Overall, how satisfied are you with your cricket experience? (n=25,579)
14 to 15s 8.3
Core 8.0
Women 7.9
Highest Satisfaction
Cameo 7.4
Occasional 7.6
19 to 25s 7.7
Lowest Satisfaction
Cameo +17%
Occasional +10%
26 to 34s +10%
Big Movers
13
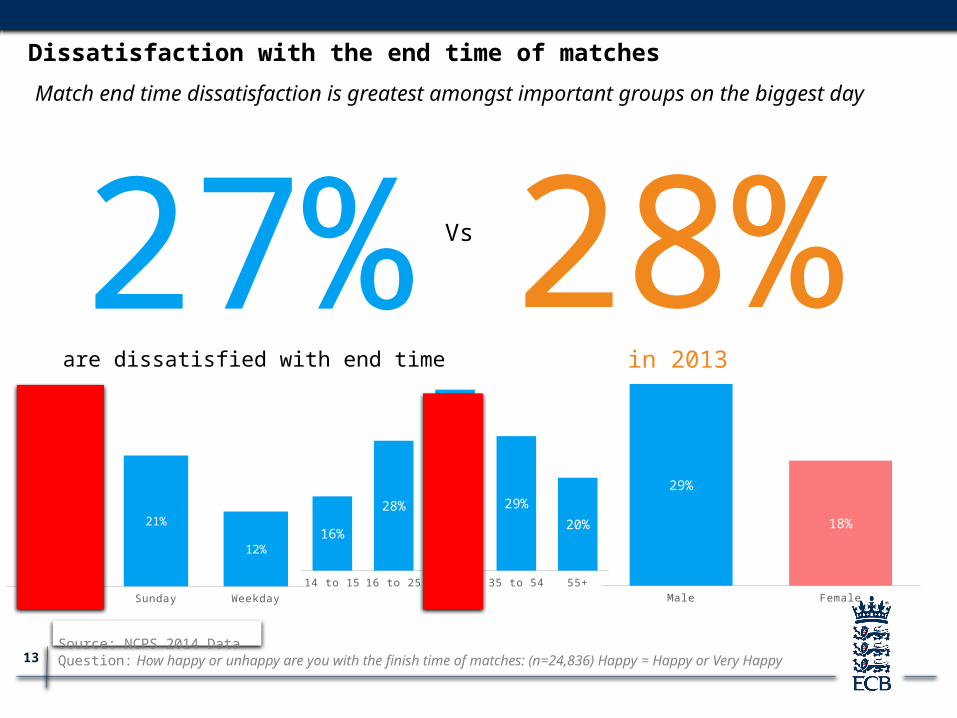
14 to 15 16 to 25 26 to 34 35 to 54 55+
16%
28%
39%
29%
20%
Saturday Sunday Weekday
32%
21%
12%
Match end time dissatisfaction is greatest amongst important groups on the biggest day
27% are dissatisfied with end time
28%in 2013
Vs
Dissatisfaction with the end time of matches
Source: NCPS 2014 DataQuestion: How happy or unhappy are you with the finish time of matches: (n=24,836) Happy = Happy or Very Happy
Male Female
29%
18%

14
Dissatisfaction with end time – National and County
27%of players are unhappy with the end time of matches
43%Worst County
17%Best County
Nationally,
Player dissatisfaction with end time by County average
….. and is an issue for at least one in five players in all but four counties
Source: NCPS 2014 DataQuestion: How happy or unhappy are you with the finish time of matches: (n=24,836) Happy = Happy or Very Happy
Suffo
lk
Norfo
lk
Durha
m
Dorse
t
Derby
shire
Yorks
hire
Leice
ster
shire
Oxfor
dshir
e
Wor
cest
ersh
ire
Berks
hire
Cornw
all
Bedfo
rdsh
ire
Midd
lesex
Huntin
gdon
shire
Hamps
hire
Wale
s
Wilts
hire
Somer
set
Cumbr
ia
Heref
ords
hire
0%
5%
10%
15%
20%
25%
30%
35%
40%
45%
50%
15
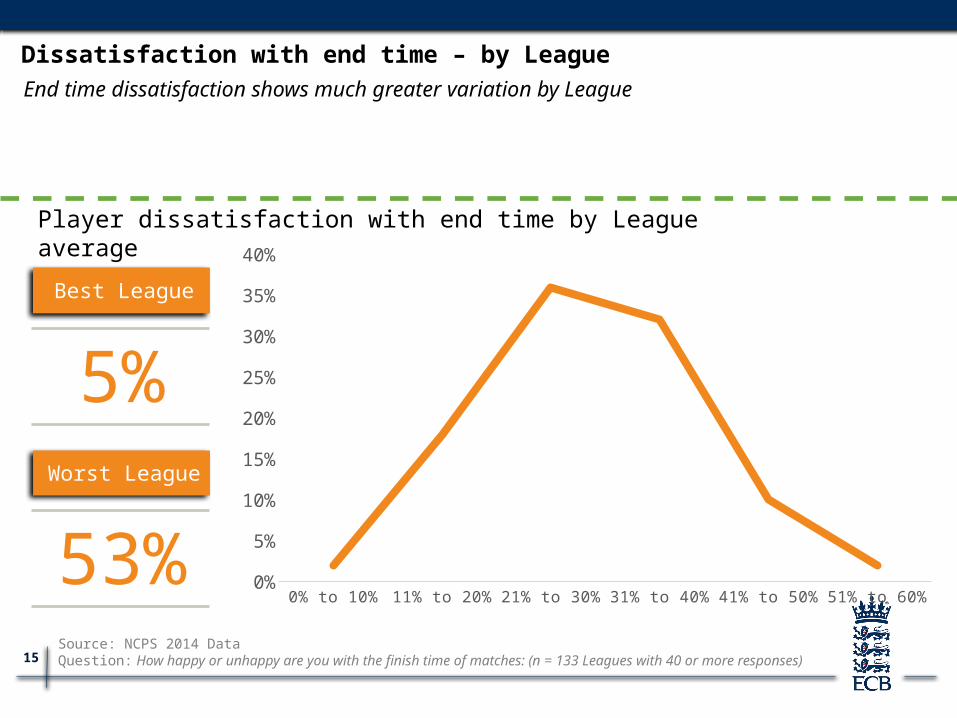
Dissatisfaction with end time – by League
53%
Worst League
5%
Best League
Player dissatisfaction with end time by League average
End time dissatisfaction shows much greater variation by League
Source: NCPS 2014 DataQuestion: How happy or unhappy are you with the finish time of matches: (n = 133 Leagues with 40 or more responses)
0% to 10% 11% to 20% 21% to 30% 31% to 40% 41% to 50% 51% to 60%0%
5%
10%
15%
20%
25%
30%
35%
40%

16
Dissatisfaction with travel distance – National and County
of players are unhappy with travel distance to matches16%
24%Worst County
0%
Best County
Nationally,
Player dissatisfaction with travel distance by County average
Source: NCPS 2014 DataQuestion: To what extent are you satisfied or dissatisfied with travel distance? (n= 23,352)
End time satisfaction shows much greater variation by League
Travel distance dissatisfaction is also widespread across Counties…..
Isle
of W
ight
Huntin
gdon
shire
Glouce
ster
shire
Durha
m
Dorse
t
Cornw
all
Buckin
gham
shire
Hamps
hire
Nottin
gham
shire
Lanc
ashir
e
Staffo
rdsh
ire
War
wicksh
ire
Norfo
lk
Somer
set
Essex
Midd
lesex
Oxfor
dshir
e
Hertfo
rdsh
ire
Chesh
ire
Wor
cest
ersh
ire0%
5%
10%
15%
20%
25%
30%
All but one County has at least one dissatisfied player
per team

17
Dissatisfaction with travel distance – by League
48%
Worst League
0%
Best League
Player dissatisfaction with travel distance by League average
Source: NCPS 2014 DataQuestion: To what extent are you satisfied or dissatisfied with travel distance? (n= 23,352)
….but is an issue for at least 1 in 5 players in 25% of Leagues
0% to 10% 11% to 20% 21% to 30% 31% to 40% 41% to 50% 51% to 60%0%
5%
10%
15%
20%
25%
30%
35%
40%
45%
50%
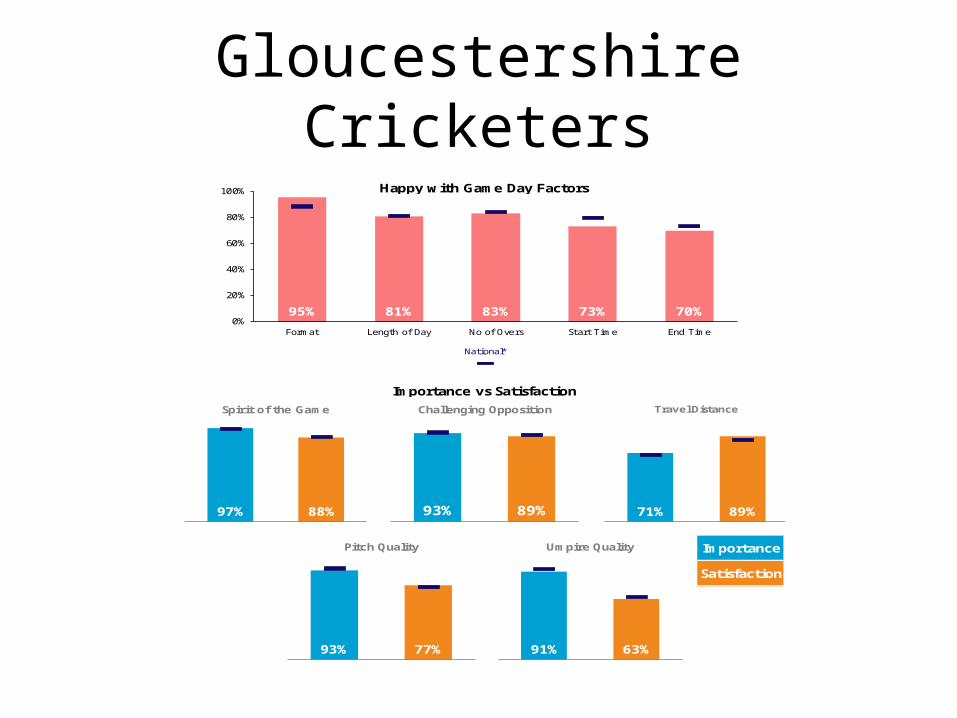
Gloucestershire Cricketers
National*
Happy with Game Day Factors
Importance vs Satisfaction
Importance
Satisfaction
95% 81% 83% 73% 70%0%
20%
40%
60%
80%
100%
Format Length of Day No of Overs Start Time End Time
93% 89%Important Satisfied
Challenging Opposition
93% 77%
Important Satisfied
Pitch Quality
91% 63%
Important Satisfied
Umpire Quality
71% 89%
Important Satisfied
Travel Distance
97% 88%
Important Satisfied
Spirit of the Game

19
2013 2013
97% 97% 0% + 88% 81% 7% +93% 91% 1% + 89% 91% -2% -93% 93% -1% - 77% 70% 7% +91% 93% -2% - 63% 52% 10% +71% 69% 2% + 89% 85% 3% +
7.9 7.1 0.8 +
2014 2014Variance Variance
Importance Satisfaction
OVERALL SATISFACTION
Overall Satisfaction
Spirit of the Game
Challenging Opposition
Pitch Quality
Umpire Quality
Travel Distance
Comparison of Satisfaction factorsbetween 2013 and 2014
IMPORTANCE vs SATISFACTION
-4% -
7% +
74%70%
81%81%
75% -1% -
89%95%
80%83% 3% +
73%
0%
% happy with the time their matches start
% happy with the time their matches end
GAME DAY FACTORS
% happy with the format they play
% happy with the number of overs they play
% happy with the length of their day -

Gloucestershire – Leagues
20
National*
Importance vs Satisfaction
Importance
Satisfaction
Happy with Game Day Factors
95% 76% 83% 71% 66%0%
20%
40%
60%
80%
100%
Format Length of Day No of Overs Start Time End Time
92% 90%Important Satisfied
Challenging Opposition
95% 77%
Important Satisfied
Pitch Quality
92% 60%
Important Satisfied
Umpire Quality
69% 84%
Important Satisfied
Travel Distance
97% 88%
Important Satisfied
Spirit of the Game
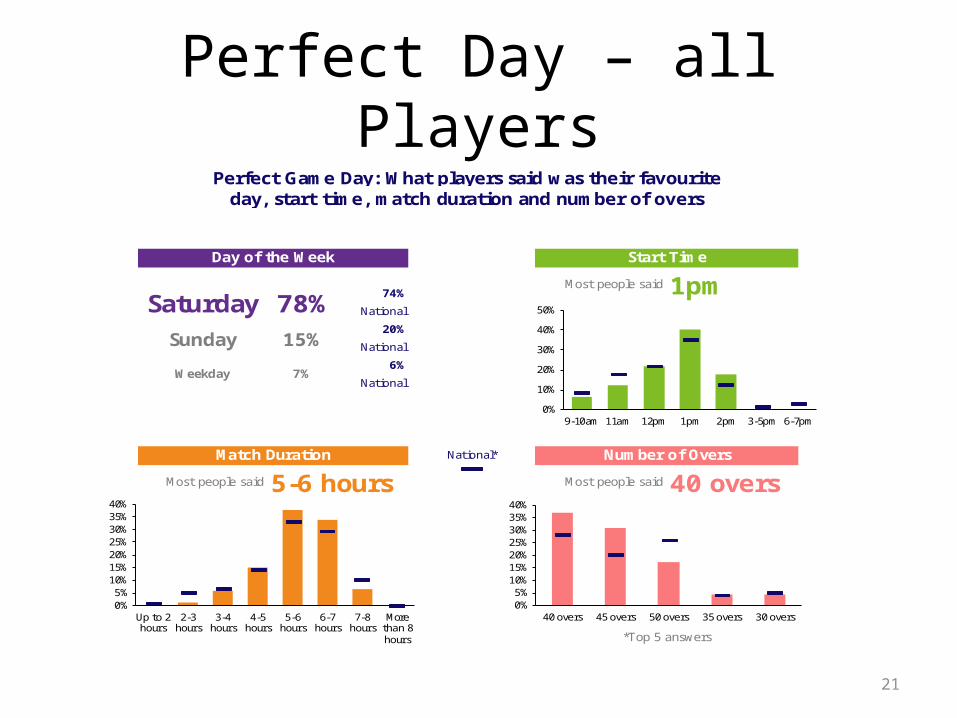
Perfect Day – all Players
21
74%
National
20%
National
6%
National
Perfect Game Day: What players said was their favouriteday, start time, match duration and number of overs
Day of the Week
National*
Most people said 40 overs
Start Time
Most people said 1pm
Weekday 7%
Sunday 15%
78%Saturday
*Top 5 answers
Number of OversMatch Duration
Most people said 5-6 hours
0%
10%
20%
30%
40%
50%
9-10am 11am 12pm 1pm 2pm 3-5pm 6-7pm
0%5%
10%15%20%25%30%35%40%
Up to 2hours
2-3hours
3-4hours
4-5hours
5-6hours
6-7hours
7-8hours
Morethan 8hours
0%5%
10%15%20%25%30%35%40%
40 overs 45 overs 50 overs 35 overs 30 overs

Pefect Day – Non Core
22
61%
National
29%
National
11%
National
Perfect Game Day: What players said was their favouriteday, start time, match duration and number of overs
Day of the Week
National*
Most people said 40 overs
Start Time
Most people said 1pm
Weekday 13%
Sunday 18%
69%Saturday
*Top 5 answers
Number of OversMatch Duration
Most people said 5-6 hours
0%
10%
20%
30%
40%
50%
9-10am 11am 12pm 1pm 2pm 3-5pm 6-7pm
0%5%
10%15%20%25%30%35%40%45%
Up to 2hours
2-3hours
3-4hours
4-5hours
5-6hours
6-7hours
7-8hours
Morethan 8hours
0%
10%
20%
30%
40%
50%
40 overs 45 overs 30 overs 50 overs 35 overs

League Comparison
23
Importance Satisfaction Importance Satisfaction Importance Satisfaction Importance Satisfaction Importance Satisfaction
Bristol & District League 91% 90% 95% 69% 88% 55% 76% 92% 98% 85% 7.7
Cotswold District Cricket Leagues 96% 83% 90% 71% 80% 60% 61% 93% 96% 97% 7.8
Gloucestershire County Cricket League 94% 84% 99% 73% 91% 61% 69% 89% 98% 82% 8.1
North Somerset League 91% 87% 92% 79% 84% 68% 74% 87% 100% 88% 7.6
Somerset Cricket League (Shrubbery Hotel) 88% 86% 95% 68% 90% 59% 71% 82% 96% 84% 7.7
Stroud League 95% 80% 90% 74% 91% 66% 72% 97% 100% 97% 7.7
West of England Premier League 93% 92% 98% 82% 95% 56% 62% 74% 96% 90% 7.9
West Somerset League 86% 95% 91% 84% 93% 64% 72% 96% 99% 88% 7.9
Wiltshire County Cricket League 88% 89% 93% 65% 92% 61% 68% 83% 94% 93% 7.7
Overall
Satisfaction
Spirit of the GameLeague
Challenging Opposition Pitch Quality Umpire Quality Travel Distance
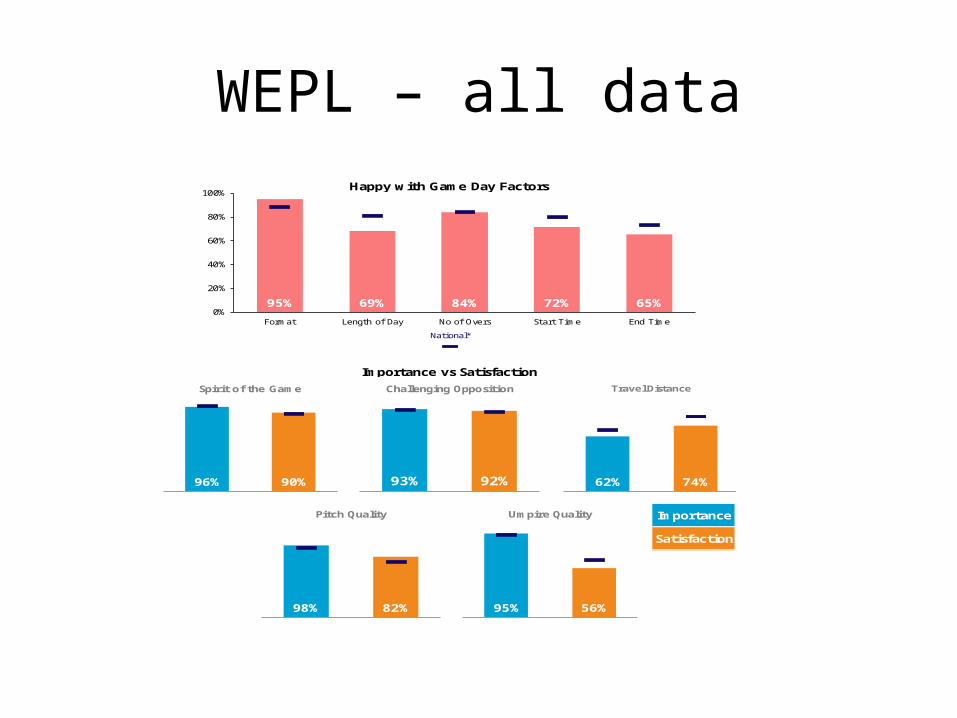
WEPL – all data
National*
Happy with Game Day Factors
Importance vs Satisfaction
Importance
Satisfaction
95% 69% 84% 72% 65%0%
20%
40%
60%
80%
100%
Format Length of Day No of Overs Start Time End Time
93% 92%Important Satisfied
Challenging Opposition
98% 82%
Important Satisfied
Pitch Quality
95% 56%
Important Satisfied
Umpire Quality
62% 74%
Important Satisfied
Travel Distance
96% 90%
Important Satisfied
Spirit of the Game
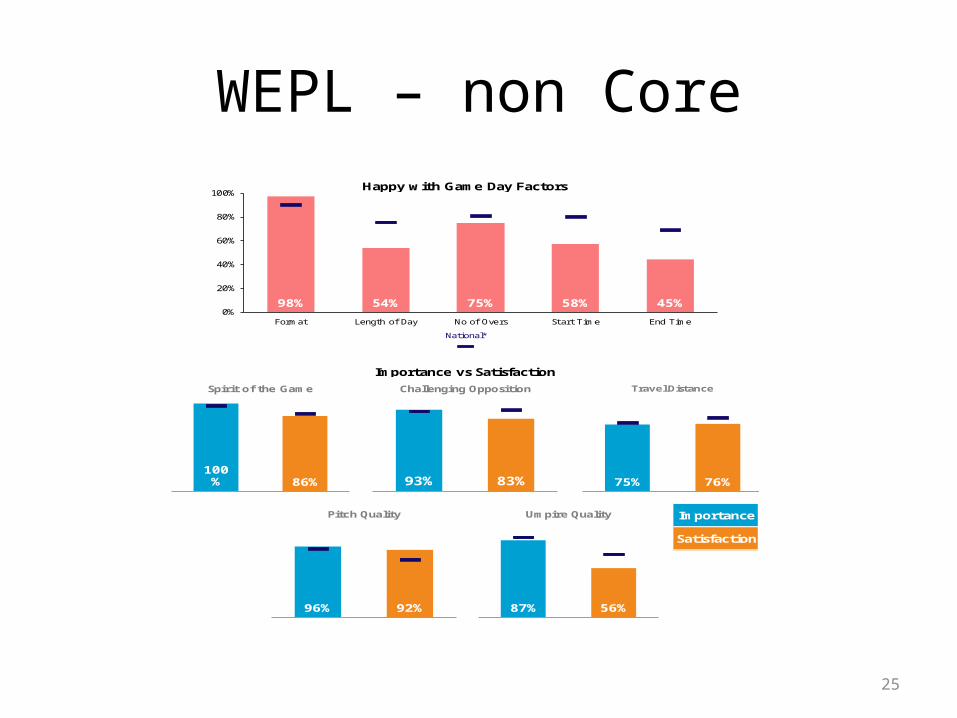
WEPL – non Core
25
National*
Happy with Game Day Factors
Importance vs Satisfaction
Importance
Satisfaction
98% 54% 75% 58% 45%0%
20%
40%
60%
80%
100%
Format Length of Day No of Overs Start Time End Time
93% 83%Important Satisfied
Challenging Opposition
96% 92%
Important Satisfied
Pitch Quality
87% 56%
Important Satisfied
Umpire Quality
75% 76%
Important Satisfied
Travel Distance
100% 86%
Important Satisfied
Spirit of the Game
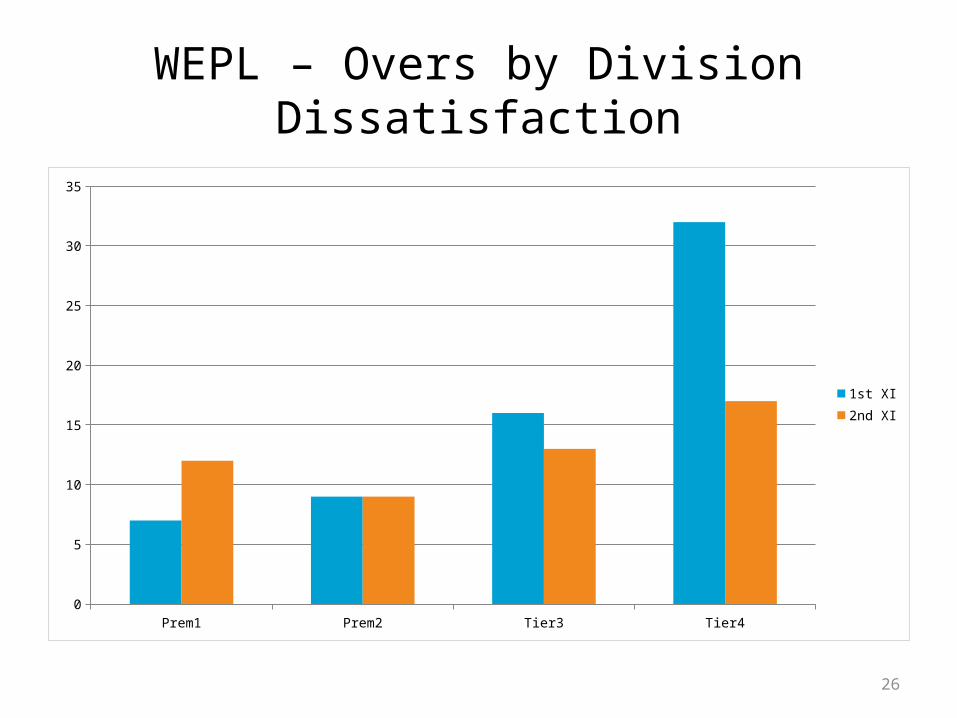
WEPL – Overs by DivisionDissatisfaction
26
Prem1 Prem2 Tier3 Tier40
5
10
15
20
25
30
35
1st XI
2nd XI

WEPL – Travel by DivisionDissatisfaction
27
Prem1 Prem2 Tier3 Tier40
10
20
30
40
50
60
70
1st XI
2nd XI
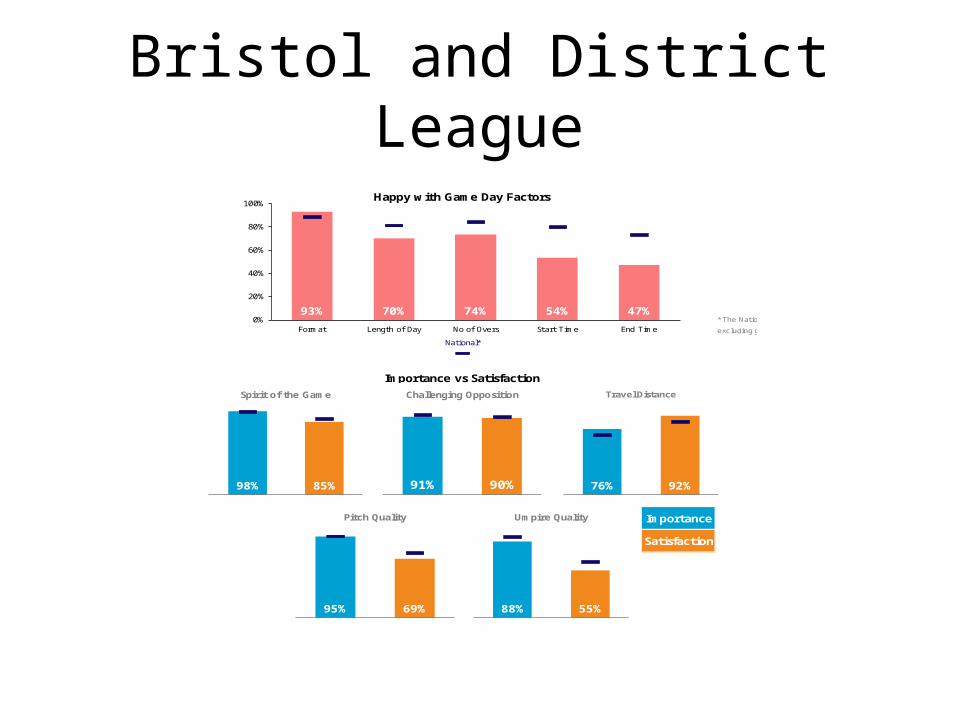
Bristol and District League
* The National average reflects your selection,
excluding geographical filters
National*
Happy with Game Day Factors
Importance vs Satisfaction
Importance
Satisfaction
93% 70% 74% 54% 47%0%
20%
40%
60%
80%
100%
Format Length of Day No of Overs Start Time End Time
91% 90%Important Satisfied
Challenging Opposition
95% 69%
Important Satisfied
Pitch Quality
88% 55%
Important Satisfied
Umpire Quality
76% 92%
Important Satisfied
Travel Distance
98% 85%
Important Satisfied
Spirit of the Game
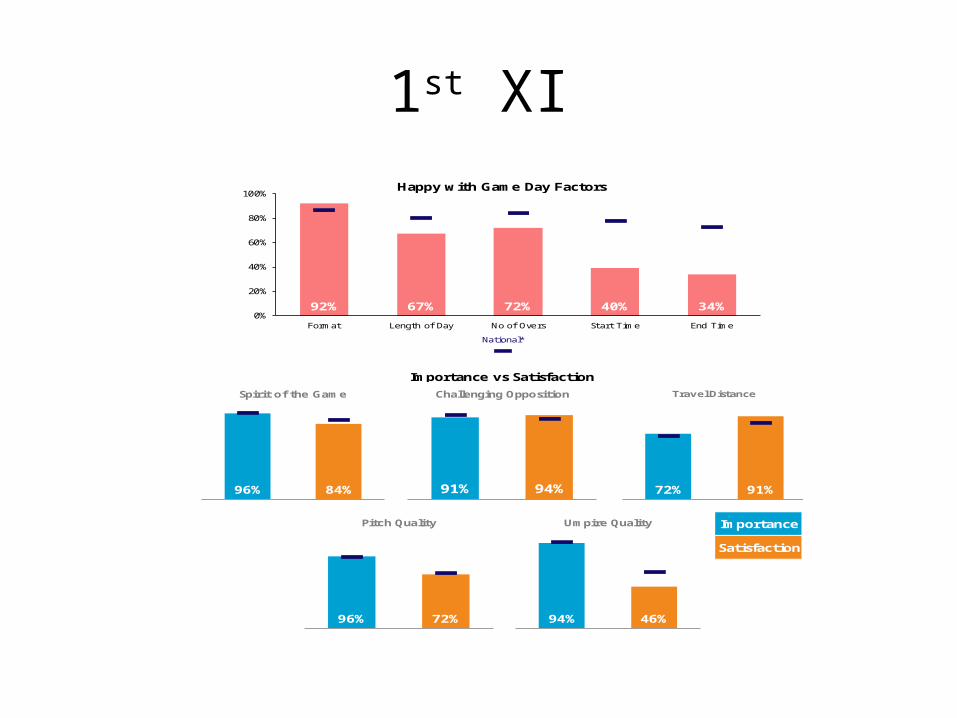
1st XI
National*
Importance vs Satisfaction
Importance
Satisfaction
Happy with Game Day Factors
92% 67% 72% 40% 34%0%
20%
40%
60%
80%
100%
Format Length of Day No of Overs Start Time End Time
91% 94%Important Satisfied
Challenging Opposition
96% 72%
Important Satisfied
Pitch Quality
94% 46%
Important Satisfied
Umpire Quality
72% 91%
Important Satisfied
Travel Distance
96% 84%
Important Satisfied
Spirit of the Game

26-44 yr Olds
National*
Importance vs Satisfaction
Importance
Satisfaction
Happy with Game Day Factors
93% 63% 70% 40% 32%0%
20%
40%
60%
80%
100%
Format Length of Day No of Overs Start Time End Time
91% 88%Important Satisfied
Challenging Opposition
95% 68%
Important Satisfied
Pitch Quality
88% 53%
Important Satisfied
Umpire Quality
78% 93%
Important Satisfied
Travel Distance
98% 82%
Important Satisfied
Spirit of the Game

B+D Perfect Day- Saturday Players
74%
National
20%
National
6%
National
8%
88%Saturday
*Top 5 answers
Number of OversMatch Duration
Most people said 5-6 hours
Perfect Game Day: What players said was their favouriteday, start time, match duration and number of overs
Day of the Week
National*
Most people said 45 overs
Start Time
Most people said 1pm
Weekday 5%
Sunday
0%
10%
20%
30%
40%
50%
9-10am 11am 12pm 1pm 2pm 3-5pm 6-7pm
0%5%
10%15%20%25%30%35%40%45%50%
Up to 2hours
2-3hours
3-4hours
4-5hours
5-6hours
6-7hours
7-8hours
Morethan 8hours
0%
10%
20%
30%
40%
50%
45 overs 40 overs 50 overs 35 overs 30 overs
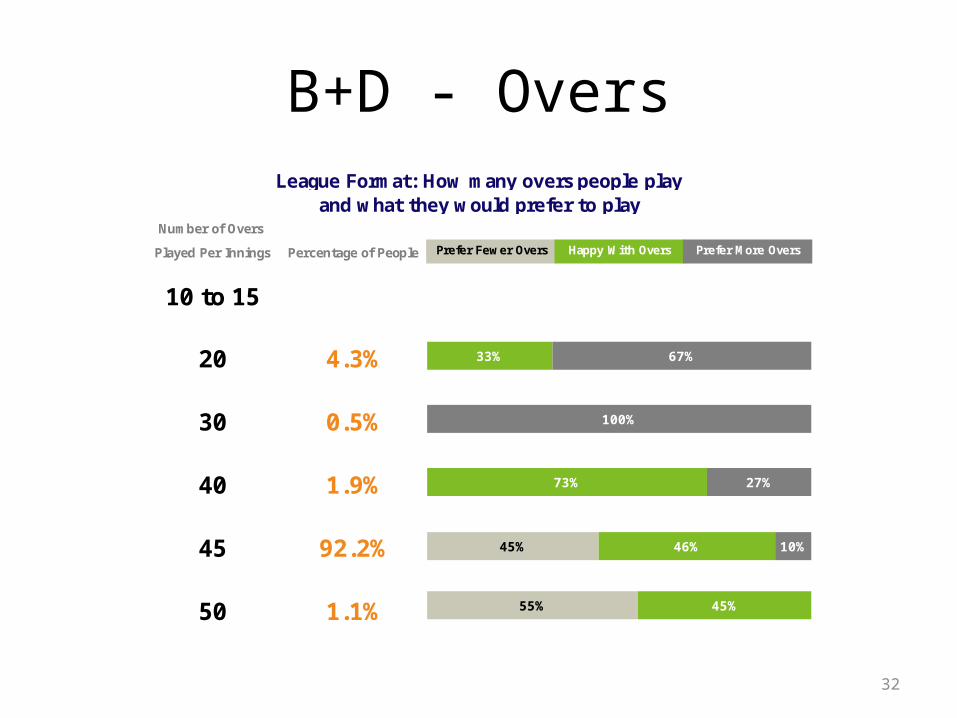
B+D - Overs
32
Played Per Innings
4.3%
0.5%
League Format: How many overs people playand what they would prefer to play
Number of Overs
10 to 15
Prefer Fewer Overs Happy With Overs Prefer More Overs
0.0%
Percentage of People
20
30
1.9%
92.2%
40
45
50 1.1%
33% 67%
100%
73% 27%
45% 46% 10%
55% 45%
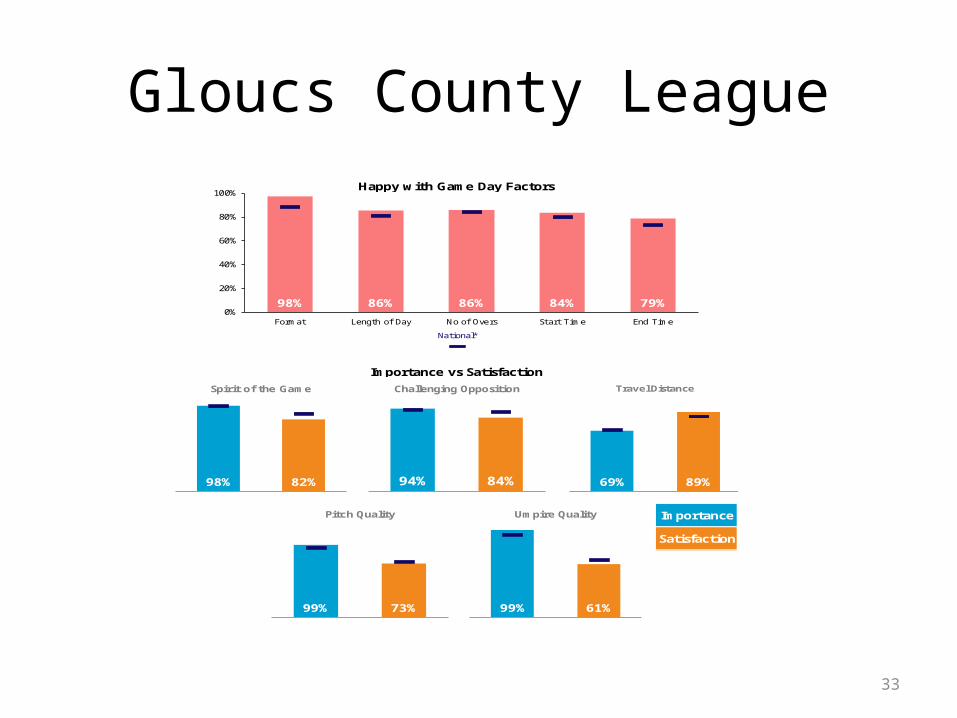
Gloucs County League
33
National*
Happy with Game Day Factors
Importance vs Satisfaction
Importance
Satisfaction
98% 86% 86% 84% 79%0%
20%
40%
60%
80%
100%
Format Length of Day No of Overs Start Time End Time
94% 84%Important Satisfied
Challenging Opposition
99% 73%
Important Satisfied
Pitch Quality
99% 61%
Important Satisfied
Umpire Quality
69% 89%
Important Satisfied
Travel Distance
98% 82%
Important Satisfied
Spirit of the Game

GCCL Perfect Day – Saturday Cricketers
34
74%
National
20%
National
6%
National
Perfect Game Day: What players said was their favouriteday, start time, match duration and number of overs
Day of the Week
National*
Most people said 45 overs
Start Time
Most people said 1pm
Weekday 3%
Sunday 4%
93%Saturday
*Top 5 answers
Number of OversMatch Duration
Most people said 6-7 hours
0%
10%
20%
30%
40%
50%
60%
9-10am 11am 12pm 1pm 2pm 3-5pm 6-7pm
0%
10%
20%
30%
40%
50%
60%
Up to 2hours
2-3hours
3-4hours
4-5hours
5-6hours
6-7hours
7-8hours
Morethan 8hours
0%
10%
20%
30%
40%
50%
45 overs 40 overs 50 overs 25 overs 35 overs

Stroud League
35
National*
Happy with Game Day Factors
Importance vs Satisfaction
Importance
Satisfaction
99% 90% 83% 76% 89%0%
20%
40%
60%
80%
100%
Format Length of Day No of Overs Start Time End Time
95% 80%Important Satisfied
Challenging Opposition
90% 74%
Important Satisfied
Pitch Quality
91% 66%
Important Satisfied
Umpire Quality
72% 97%
Important Satisfied
Travel Distance
100% 97%
Important Satisfied
Spirit of the Game

Cotswold District
36
National*
Happy with Game Day Factors
Importance vs Satisfaction
Importance
Satisfaction
92% 88% 87% 73% 62%0%
20%
40%
60%
80%
100%
Format Length of Day No of Overs Start Time End Time
96% 83%Important Satisfied
Challenging Opposition
90% 71%
Important Satisfied
Pitch Quality
81% 60%
Important Satisfied
Umpire Quality
61% 93%
Important Satisfied
Travel Distance
96% 97%
Important Satisfied
Spirit of the Game

Gloucs Perfect Day – Sunday Cricketers
37
74%
National
20%
National
6%
National
Perfect Game Day: What players said was their favouriteday, start time, match duration and number of overs
Day of the Week
National*
Most people said 40 overs
Start Time
Most people said 2pm
Weekday 7%
Sunday 15%
78%Saturday
*Top 5 answers
Number of OversMatch Duration
Most people said 4-5 hours
0%
10%
20%
30%
40%
9-10am 11am 12pm 1pm 2pm 3-5pm 6-7pm
0%5%
10%15%20%25%30%35%40%
Up to 2hours
2-3hours
3-4hours
4-5hours
5-6hours
6-7hours
7-8hours
Morethan 8hours
0%
10%
20%
30%
40%
50%
40 overs 45 overs 30 overs 35 overs 20 overs
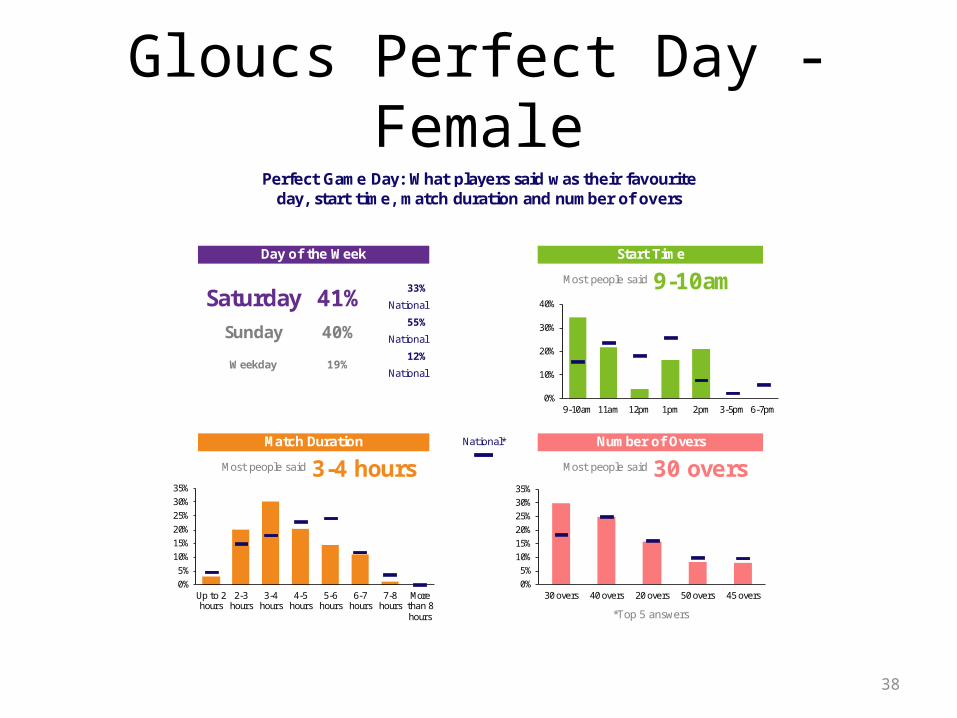
Gloucs Perfect Day - Female
38
33%
National
55%
National
12%
National
Perfect Game Day: What players said was their favouriteday, start time, match duration and number of overs
Day of the Week
National*
Most people said 30 overs
Start Time
Most people said 9-10am
Weekday 19%
Sunday 40%
41%Saturday
*Top 5 answers
Number of OversMatch Duration
Most people said 3-4 hours
0%
10%
20%
30%
40%
9-10am 11am 12pm 1pm 2pm 3-5pm 6-7pm
0%
5%10%15%20%
25%30%35%
Up to 2hours
2-3hours
3-4hours
4-5hours
5-6hours
6-7hours
7-8hours
Morethan 8hours
0%5%
10%15%20%25%30%35%
30 overs 40 overs 20 overs 50 overs 45 overs