ACTED-RNA-Lower Dir District
15
Transcript of ACTED-RNA-Lower Dir District
�������������� �������������������
������������������������ ! " #��$ %&�� '�
$(�'��)���*�����+�,�����! &�-�
&�� ! " #. ���#���/���
$�0���������������1�#���#��� ���2�
��*,,��$ �&��$(�'��)�����3��4*�������
5�)�����3��4*����34���! &��6 �&�. ���#���/�7�"�&���888� ���#���/
�����������������
� ������������������������ �������
�
��
�����������������
�������� !���"#���$�
Page 2 of 15
Assessment Report-Lower Dir District 16 august 2010
EXECUTIVE SUMMARY
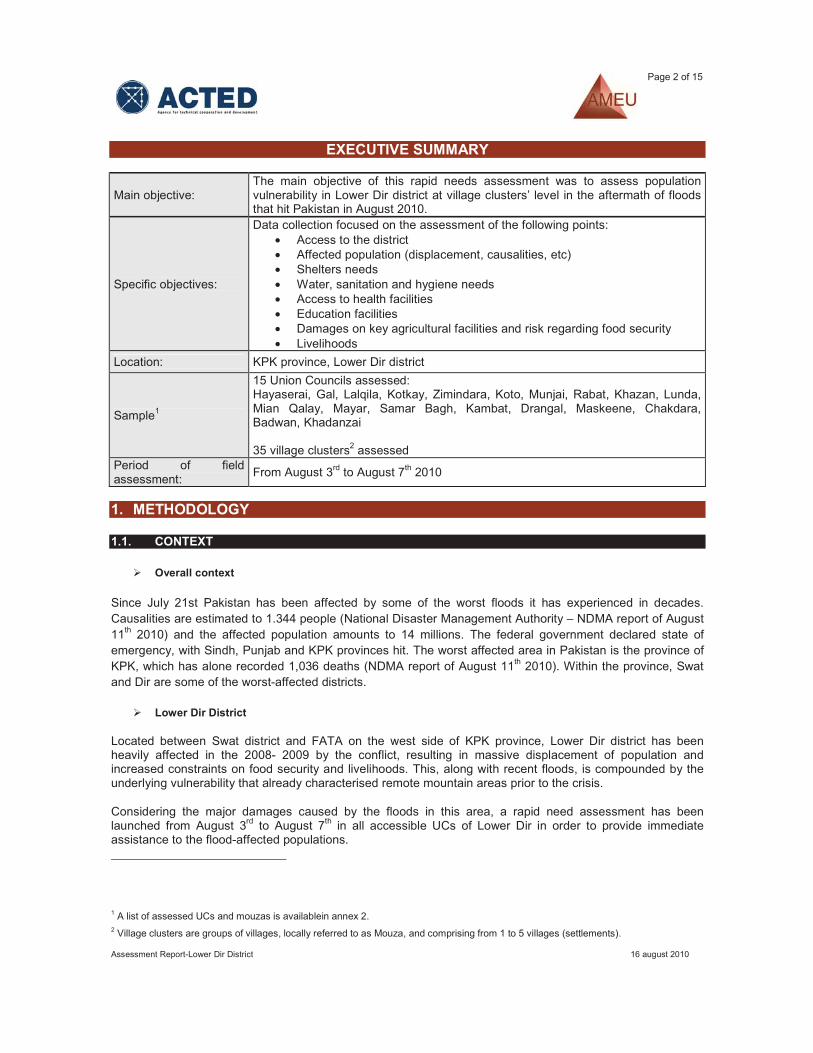
Main objective: The main objective of this rapid needs assessment was to assess population vulnerability in Lower Dir district at village clusters’ level in the aftermath of floods that hit Pakistan in August 2010.
Specific objectives:
Data collection focused on the assessment of the following points: • Access to the district • Affected population (displacement, causalities, etc) • Shelters needs • Water, sanitation and hygiene needs • Access to health facilities • Education facilities • Damages on key agricultural facilities and risk regarding food security • Livelihoods
Location: KPK province, Lower Dir district
Sample1
15 Union Councils assessed: Hayaserai, Gal, Lalqila, Kotkay, Zimindara, Koto, Munjai, Rabat, Khazan, Lunda, Mian Qalay, Mayar, Samar Bagh, Kambat, Drangal, Maskeene, Chakdara, Badwan, Khadanzai
35 village clusters2 assessed Period of field assessment: From August 3rd to August 7th 2010
1. METHODOLOGY
1.1. CONTEXT
� Overall context
Since July 21st Pakistan has been affected by some of the worst floods it has experienced in decades. Causalities are estimated to 1.344 people (National Disaster Management Authority – NDMA report of August 11th 2010) and the affected population amounts to 14 millions. The federal government declared state of emergency, with Sindh, Punjab and KPK provinces hit. The worst affected area in Pakistan is the province of KPK, which has alone recorded 1,036 deaths (NDMA report of August 11th 2010). Within the province, Swat and Dir are some of the worst-affected districts.
� Lower Dir District
Located between Swat district and FATA on the west side of KPK province, Lower Dir district has been heavily affected in the 2008- 2009 by the conflict, resulting in massive displacement of population and increased constraints on food security and livelihoods. This, along with recent floods, is compounded by the underlying vulnerability that already characterised remote mountain areas prior to the crisis.
Considering the major damages caused by the floods in this area, a rapid need assessment has been launched from August 3rd to August 7th in all accessible UCs of Lower Dir in order to provide immediate assistance to the flood-affected populations.
1 A list of assessed UCs and mouzas is availablein annex 2. 2 Village clusters are groups of villages, locally referred to as Mouza, and comprising from 1 to 5 villages (settlements).
Page 3 of 15
Assessment Report-Lower Dir District 16 august 2010
1.2. OBJECTIVES
Comprehensive assessments were conducted in three flood affected districts of KPK province: Swat, Lower Dir and Upper Dir. The present assessment report details data collected at villages’ cluster level in 15 UCs UCs of Lower Dir district.
1.3. TOOLS
The most affected village clusters in accessible UCs were assessed. A focus has been done on the main village of each village cluster. In each village main assessed, interviews were conducted with traditional authorities of villages (elderly, notables, etc) and local authorities. A specific questionnaire has been developed for this purpose. This survey has been conducted by the AMEU (Appraisal, Monitoring and Evaluation Unit). Besides, four AMEU teams in Pakistan were mobilized for this rapid need assessment.
AMEU is an autonomous unit within ACTED Pakistan, dedicated to improving the relevance, quality and accountability of ACTED’s programs by facilitating Project Cycle Management and conducting research and assessments to inform and influence policy and practice.
1.4. SAMPLE
This rapid needs assessment focused on the most affected UCs of Lower Dir. As such, 15 UCs out of 31 for the whole Lower Dir have been assessed. Overall, a total of 35 village clusters have been surveyed.
������������������� ��������� ����������
2. OVERVIEW PER UNION COUNCIL
All assessed UCs have been heavily affected by monsoon floods, but on different scopes. The present chapter will present an overview of the worst hit UCs regarding immediate damages to population, access roads, communal facilities, agriculture and food security.
An overview table of floods impact on each UC is attached in annex 1.
3. OVERVIEW PER SECTOR
The present chapter will focus on a more in-depth analysis of each sector at village cluster level.
3.1 POPULATION
3.1.1 Displacement
� Population status before floods: 65.538 families were listed with community leaders before the floods, with an average number of 7 persons per family.
� Displacements: 59 families were displaced, accounting for 0.1 % of the total population. Displacement was concentrated in Khadgadgzai UC with 75 % of displaced population. 95 % of displaced families already returned to their homes at the time of the assessment. All displaced families from Khadagazai and Khazana UCs came back. Displacement remained limited and geographical constrained which explained rapid return of most of the population.
3.1.2 Casualties � 4 deaths reported in (Khazana –Khazana village cluster, Chakdara, Mundai and Lal Qila UCs) and 1
person reported as injured in Chakdara village cluster.
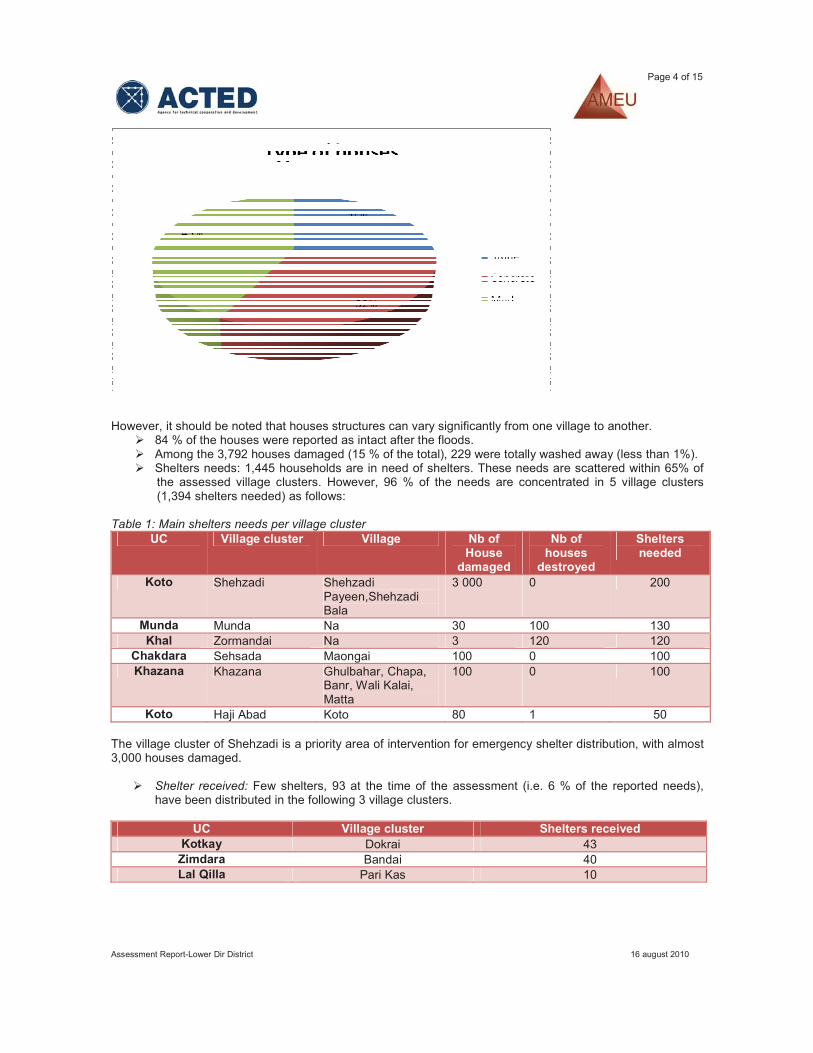
3.1.3 Houses damages � 23.262 houses have been identified, with the following structure type
Page 4 of 15
Assessment Report-Lower Dir District 16 august 2010
However, it should be noted that houses structures can vary significantly from one village to another.� 84 % of the houses were reported as intact after the floods. � Among the 3,792 houses damaged (15 % of the total), 229 were totally washed away (less than 1%). � Shelters needs: 1,445 households are in need of shelters. These needs are scattered within 65% of
the assessed village clusters. However, 96 % of the needs are concentrated in 5 village clusters (1,394 shelters needed) as follows:
Table 1: Main shelters needs per village cluster UC Village cluster Village Nb of
House damaged
Nb of houses
destroyed
Shelters needed
Koto Shehzadi Shehzadi Payeen,Shehzadi Bala
3 000 0 200
Munda Munda Na 30 100 130 Khal Zormandai Na 3 120 120
Chakdara Sehsada Maongai 100 0 100 Khazana Khazana Ghulbahar, Chapa,
Banr, Wali Kalai, Matta
100 0 100
Koto Haji Abad Koto 80 1 50
The village cluster of Shehzadi is a priority area of intervention for emergency shelter distribution, with almost 3,000 houses damaged.
� Shelter received: Few shelters, 93 at the time of the assessment (i.e. 6 % of the reported needs), have been distributed in the following 3 village clusters.
UC Village cluster Shelters receivedKotkay Dokrai 43 Zimdara Bandai 40 Lal Qilla Pari Kas 10
Page 5 of 15
Assessment Report-Lower Dir District 16 august 2010
3.2 WATER & SANITATION
3.2.1 Water sources
� Water supply schemes: o Status before the floods: 79 water supply schemes were reported as functional before the
floods. A majority (53 %) of these networks are communal. However it should be noted that more than 38 % of the schemes could not be specified (i.e. under private or communal management) by community leaders.
o Floods impact: After the floods 70 water supply schemes (i.e. 89 % of the total water schemes) were reported as damaged by the floods, out of which 60 are no longer functional. The village cluster of Sogyar in Khadgzai UC holds more than 67 % of the damaged water schemes (50 water schemes reported in this village cluster, out of the 100% were destroyed)
o Only 48 % of water supply schemes were providing drinkable water according to community leaders after the floods.
� Hand pumps o Status before floods: 445 hand pumps were identified. The village cluster of Koto has more
than 89 % of the hand pumps among out of which 400 are functional. This high number is due to the high population of the village cluster (130.000 people). Kaladog village in Haya Serai UC has also 23 hand-pumps. A majority of these hand pumps are communal property.
o Floods impact: Most of the hand-pumps (98 %) were no longer working after the floods. The number of damaged hand pumps is not confirmed yet.
� Springs o Status before floods: 477 springs were reported, among which 69 % are communal property.
Shehzadi Payeen, Shehzadi Bala villages (both part of Shezadi village cluster, Koto district) accounts for more than 83 % of the total number of springs with 400 springs indicated by community leaders.
o Floods impact: 68 springs have been damaged by floods in the following locations:
UC Village cluster Nb of springs Nb of damaged springs Chakdara Chakdara 5 5 Gal Nagotal 2 2 Gal Kass 3 3 Gal Goor 2 1 Haya serai Shakartangai 1 1 Kambat Kambat Khas 1 1Khadagzai Kamala 50 50 Samarbagh Samarbagh 4 4 Zimdara Bandai 1 1
� Wells o Status before floods: 982 wells were identified as functional before the floods, out of
which 60 % are under communal property. It should be noted that 6 village clusters gather around 71 % of the reported wells, with Gul Maqam village cluster (Chakdara UC) alone having 200 wells.
o Floods impact: 26% of these wells were damaged by the floods (259). The following 3 village clusterare particularly affected
UC Village cluster Nb of damaged wells Gal Kass 25 Gal Goor 30 Kotkay Kotkay 199
Page 6 of 15
Assessment Report-Lower Dir District 16 august 2010
� Bore Hole: 1 bore hole was reported in Barn village cluster (Mian Kalay UC). It has not been damaged by the floods.
3.2.2 Water supply schemes � 41 water supply schemes were reviewed in details with community leaders, out of which 9
were damaged by the floods. Around 8.555 linear meters of pipes (of various inches) are to be repaired, i.e. 8.2% of the reported water supply schemes in Lower Dir.
� 77 % of assessed village clusters have water supply schemes, out of which 31.4 % have more than two schemes.
3.2.3 Water tanks and springs boxes � Water tanks: 30 water tanks were reported with a medium capacity of 8.000 gallons. 7 water
tanks have been damaged by the floods as follows:
UC Village cluster Capacity of damaged water tank (gallon)
Chakdara Ramora 1 500 Gal Kass 10.000
Kambat Kambat Khas 9.600 800
Samarbagh Samarbagh 6.400
6.400 6.400
� Springs boxes: 21 spring boxes have been reported with an average capacity of 1.100 gallon. 15 springs boxes were indicated as damaged following floods.
UC Village cluster Spring box capacity (gallons) Chakdara Chakdara 5
Gal Nagotal 166 150
Gal Kass 54 Gal Goor 524 Haya Serai Shakartangai 1.187
Kambat Kambat Khas 9.600 800
Khazana Khazana 5 5
Koto Shehzadi 629
Samarbagh Samarbagh 1.731 1.7311.731
� Repairs: 3 repairs of spring boxes were ongoing at the time of the assessment, namely in Nagotal and Goord village clusters (damaged boxes).
3.2.4 Sanitation � Flush latrines: 17.072 flush latrines were reported as functional before the floods. Minor
damages occurred: 82 flush latrines were damaged by the floods (less than 0.4 % of the total number).
Page 7 of 15
Assessment Report-Lower Dir District 16 august 2010
� Pit latrines: 2,308 pit latrines were reported as functional before the floods. No information is available yet regarding their damages.
� 2 communities started to repair latrines in Munda village cluster (Munda UC) and in Samarbagh village cluster (Samarbagh UC).
� No international NGOs were found to be conducting water and sanitation activities in the assessed areas.
3.2.5 Hygiene education � Before floods: 17 village clusters (43.5 % of the total number) benefited from hygiene
education campaigns before the floods. These activities were conducted by MSF (2 village clusters), World Vision (1 village cluster) and ACTED (in 14 village clusters). The NGO conducting hygiene promotion in Barn village cluster (Mian Kalay UC) remains to be identified.
� After floods: 69% of the community leaders in the assessed village clusters indicated that hygiene education is a priority need due to the degradation of water and sanitation situation in their village.
3.3 HEALTH
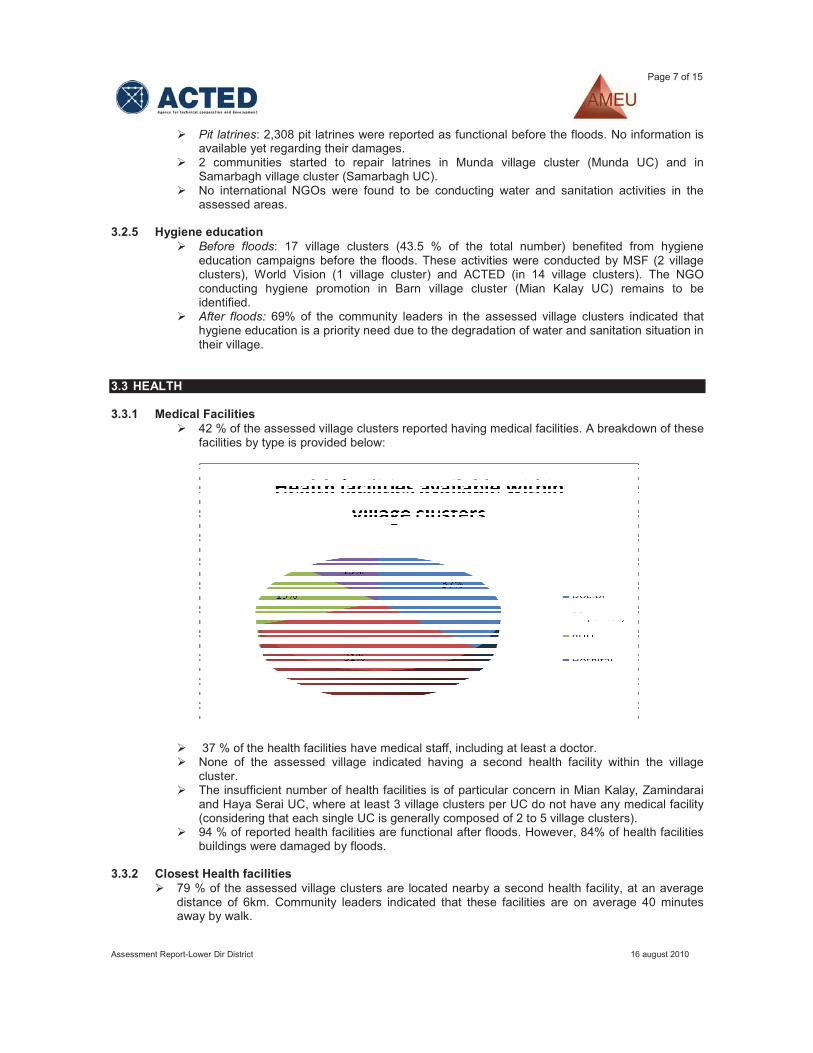
3.3.1 Medical Facilities � 42 % of the assessed village clusters reported having medical facilities. A breakdown of these
facilities by type is provided below:
� 37 % of the health facilities have medical staff, including at least a doctor. � None of the assessed village indicated having a second health facility within the village
cluster. � The insufficient number of health facilities is of particular concern in Mian Kalay, Zamindarai
and Haya Serai UC, where at least 3 village clusters per UC do not have any medical facility (considering that each single UC is generally composed of 2 to 5 village clusters).
� 94 % of reported health facilities are functional after floods. However, 84% of health facilities buildings were damaged by floods.
3.3.2 Closest Health facilities � 79 % of the assessed village clusters are located nearby a second health facility, at an average
distance of 6km. Community leaders indicated that these facilities are on average 40 minutes away by walk.
Page 8 of 15
Assessment Report-Lower Dir District 16 august 2010
� 90% of the nearby health facilities are functional and adequately staffed (with confirmed doctor presence).
� It should be noted that 90 % of the village clusters without health facilities do have an access to such facility nearby.
� Floods impact: 13 % of the health facility buildings have been damaged by floods, in the following locations.
UC Village clusters Facility typeKhadagzai Sogyar BHU Khadagzai kamala Hospital Mian kalay Mian kalay Hospital Mian kalay Barn Hospital
� Multiple health facilities nearby: Only 6 village clusters indicated having a second health facility nearby, which consists in private doctor.
3.4 EDUCATION
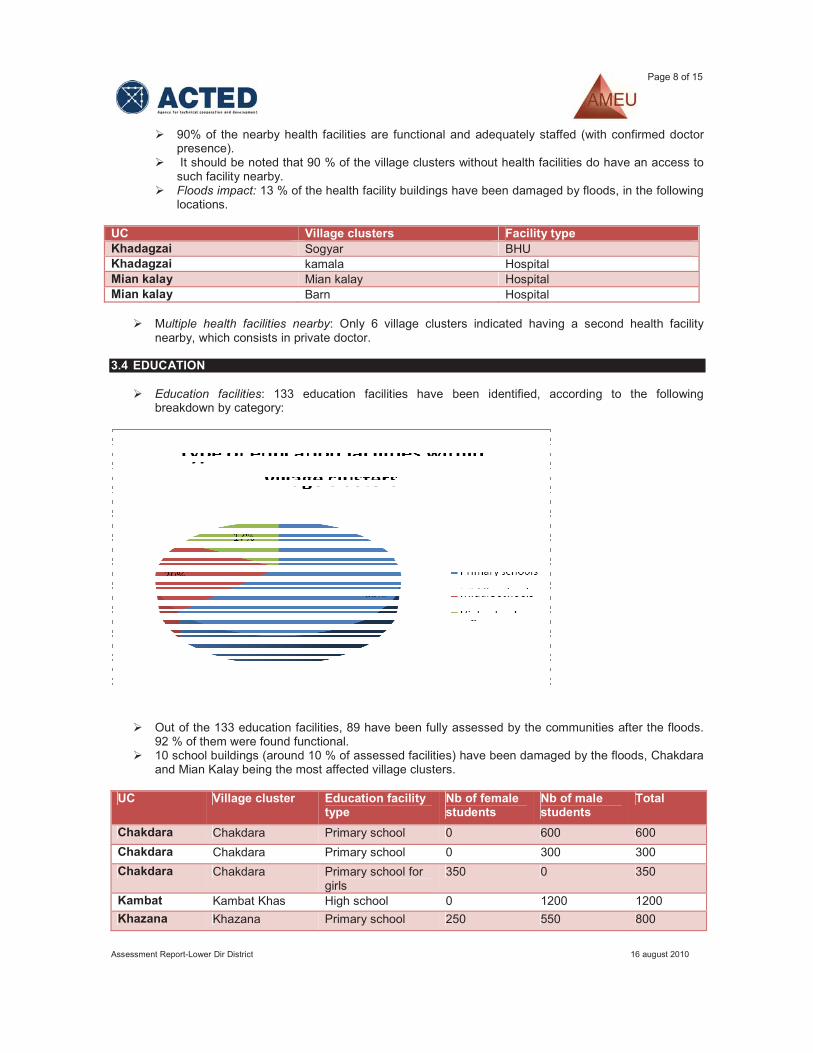
� Education facilities: 133 education facilities have been identified, according to the following breakdown by category:
� Out of the 133 education facilities, 89 have been fully assessed by the communities after the floods.92 % of them were found functional.
� 10 school buildings (around 10 % of assessed facilities) have been damaged by the floods, Chakdara and Mian Kalay being the most affected village clusters.
UC Village cluster Education facility type
Nb of female students
Nb of male students
Total
Chakdara Chakdara Primary school 0 600 600 Chakdara Chakdara Primary school 0 300 300 Chakdara Chakdara Primary school for
girls 350 0 350
Kambat Kambat Khas High school 0 1200 1200 Khazana Khazana Primary school 250 550 800
Page 9 of 15
Assessment Report-Lower Dir District 16 august 2010
Mian kalay Mian Kalay Primary school 0 300 300 Mian kalay Mian Kalay Primary school for
girls 320 0 320
Mian kalay Barn Primary school for girls
195 0 195
Mian kalay Mian Kalay High school 0 600 600 Mian kalay Mian Kalay Primary school 410 410
Total 1525 3550 5075
� Education facilities nearby: 8 education facilities (mainly high schools) were reported nearby the assessed village clusters. None of them were damaged by the floods and all were functional.
3.5 ROADS ACCESS
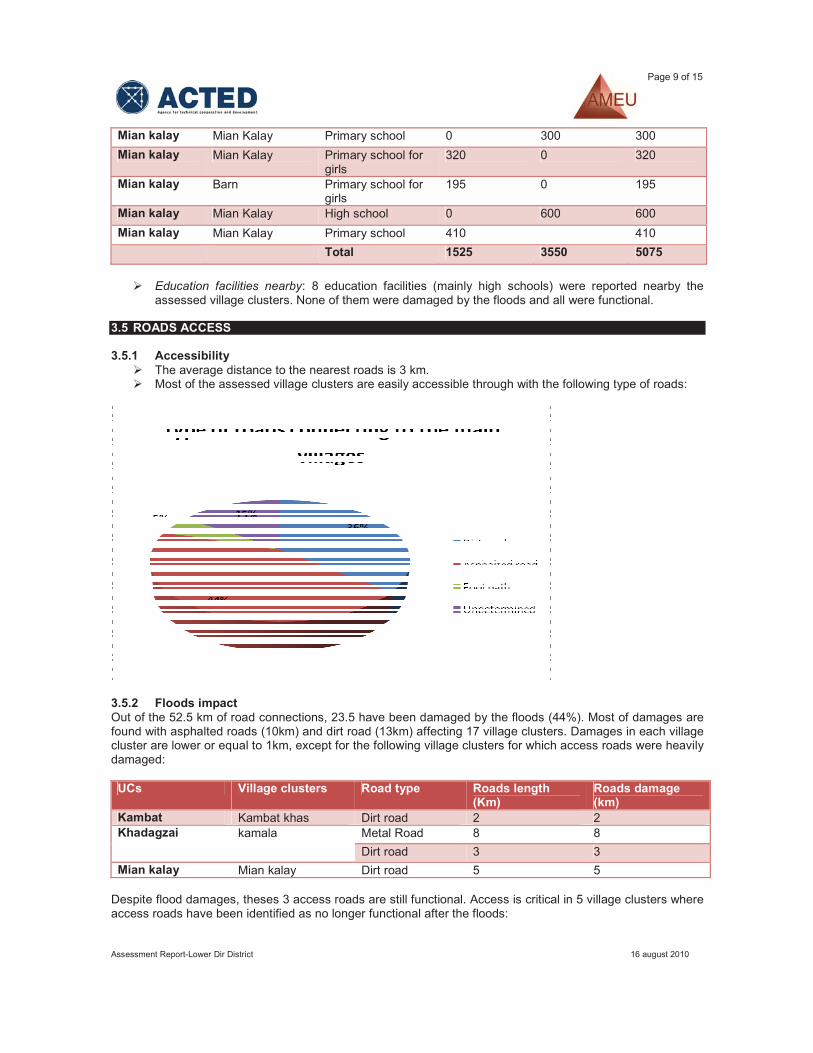
3.5.1 Accessibility � The average distance to the nearest roads is 3 km.� Most of the assessed village clusters are easily accessible through with the following type of roads:
3.5.2 Floods impact Out of the 52.5 km of road connections, 23.5 have been damaged by the floods (44%). Most of damages are found with asphalted roads (10km) and dirt road (13km) affecting 17 village clusters. Damages in each village cluster are lower or equal to 1km, except for the following village clusters for which access roads were heavily damaged:
UCs Village clusters Road type Roads length (Km)
Roads damage (km)
Kambat Kambat khas Dirt road 2 2 Khadagzai kamala Metal Road 8 8
Dirt road 3 3 Mian kalay Mian kalay Dirt road 5 5
Despite flood damages, theses 3 access roads are still functional. Access is critical in 5 village clusters where access roads have been identified as no longer functional after the floods:
Page 10 of 15
Assessment Report-Lower Dir District 16 august 2010
UCs Village clusters Road type Roads length (Km)
Roads damage (km)
Gal Kass Dirt Road 2 0,3 – bridge collapsed
Gal Goor Dirt Road 3 0,4 Haya Serai Shakartangai Dirt Road 0,5 0,3 Mian Kalay Barn Dirt Road 1 1 Munda Dhop Dirt Road 1,5 0,5
3.6 AGRICULTURE
3.6.1 Active population In the assessed UCs, 23.730 people are working in agriculture with 55% as land owners. However, the breakdown between tenants and land owners varies significantly from one village cluster to another.
3.6.2 Land Within the assessed village clusters, 61.676 acres of land are dedicated to agriculture.16.5% of the cultivable lands were reported as damaged by the floods. However, these damages are minor and easily repairable for 5.422 acres of lands.
3.6.3 Irrigation system � 40 % of assessed land is irrigated and all village clusters have functional irrigation channels with
an averge lengh of 5.9 km. � 191 km of irrigation channels were identified, out of which 30% were damaged by floods. 9
irrigation systems are damaged on more than 3km. UC Village cluster Irrigation channel
length (m) Irrigation system damages (m)
Chakdara Gul Muqam 3 000 3 000Kambat Kambat Khas 3 000 3 000 Khadagzai Mian Brangola 28 000 4 000 Khadagzai Kamala 4 000 4 000 Khadagzai Khadagazai 14 000 4 000 Khazana Khazana 3 000 3 000 Koto Shehzadi 15 000 4 500 Koto Haji Abad 19 000 4 500 Munda Mian Kalay 41 668 3 445
3.6.4 Food availability Figures stated below are a rough estimates provided by community leaders. Although they are not exact data, they give a good indication of possible food shortage.
� Flood damages per food commodity
Food commodity Stock before flood (Mt)
Swapped by floods (Mt) % of destroyed food commodities
Wheat 109 530 265 0.24% Wheat flour 5 273 50 0.95% Maize 29 385 80 0.27% Rice 132 710 150 0.11%Oil N/A N/A N/A Dry Fruits N/A N/A N/A Onion 15 393 340 2.20%
Page 11 of 15
Assessment Report-Lower Dir District 16 august 2010
� Most affected areas with food losses
UC Village cluster Food commodity
Stock before flood (Mt)
Swapped by floods (Mt)
Food insecurity
Haya Serai Shakartangai Wheat 9 000 15 Medium Khadagzai
Kamala Wheat 250 250 High –Access
road fully destroyed
Wheat Flour 50 50 Rice 150 150
Haya Serai Sher Khani Maize 640 80 Medium
3.6.5 Damage to crops
� Flood damages per type of crop
Type of crops Cultivated land (in hectare)
Destroyed land (in hectare)
% of destruction
Maize ������ ����� 21.6
Rice ������ ���� 30.8
Orchards ��� ���� 48.1
Sugar Cane 2 0.2 9.4 Vegetables ��� ��� ��
� Most affected areas in crops damages
UC Village clusters Type of crop Cultivated land (in hectare)
% of destroyed crops
Badwan Badwan Bala Maize 200 31,25 Chakdara Sehsada Maize 96 26 Chakdara Chakdara Maize 250 70 Koto Haji Abad Maize 400 15
Rice 800 50 Munda Munda Maize 70 100Chakdara Khoshal Korona Rice 100 87,5 Koto Shehzadi Rice 700 55 Khadagzai Kamala Sugar Cane 800 9.3 Khadagzai Khadagazai Vegetables 20 25
3.6.6 Livestock
� Little information is available on the impact of floods on livestock. However, primary data highlight few damages on livestock.
Type of livestock Nb before floods Nb dead with floods or slaughtered due to
floods
Affected areas
Buffalos 1 008 2, among which 1 slaughtered
Haya Serai UC, Sher Khani Village cluster
Cow 19 413 6 Toor Mang UC, Ser Village cluster
Sheep 10 774 0 None Goats 15 832 40 Toor Mang UC, Ser
Page 12 of 15
Assessment Report-Lower Dir District 16 august 2010
Village cluster
Chicken/Hen 57 269 1317, among which 300 slaughtered
1) Mian Kalay Village cluster/UC
2) Khadgzai UC - Kamala Village cluster
Donkey 175 0 NoneHorse 29 0 None
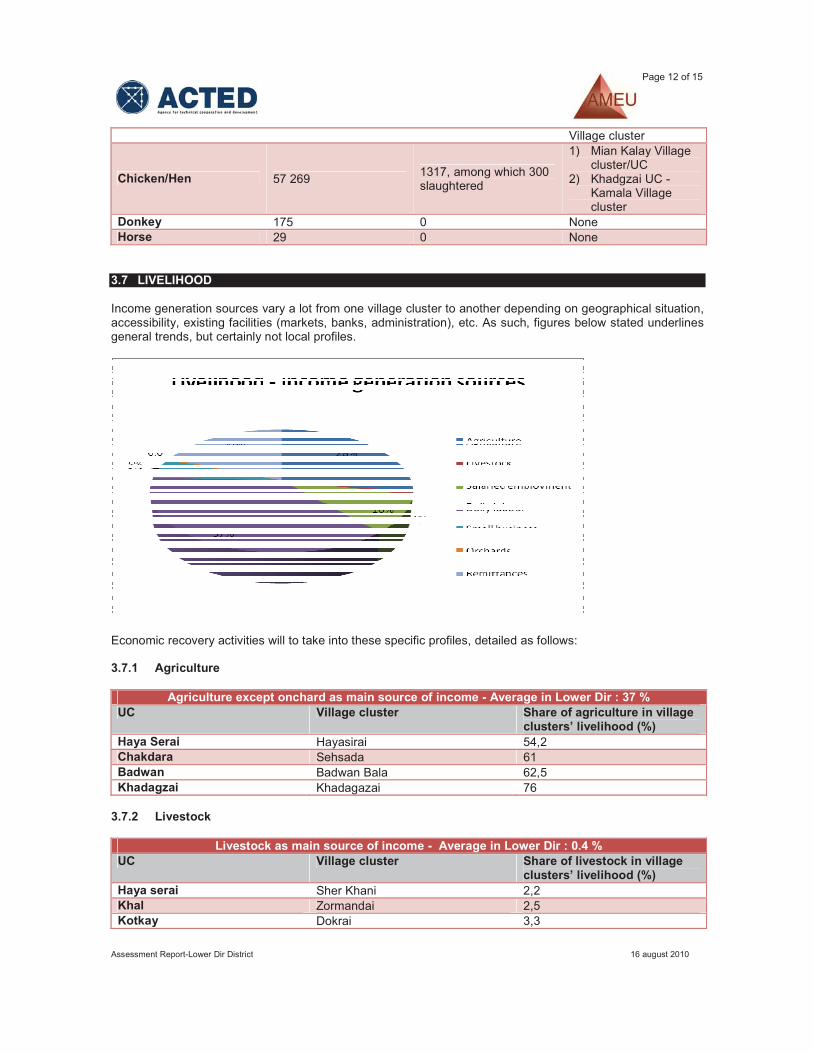
3.7 LIVELIHOOD
Income generation sources vary a lot from one village cluster to another depending on geographical situation, accessibility, existing facilities (markets, banks, administration), etc. As such, figures below stated underlines general trends, but certainly not local profiles.
Economic recovery activities will to take into these specific profiles, detailed as follows:
3.7.1 Agriculture
Agriculture except onchard as main source of income - Average in Lower Dir : 37 %UC Village cluster Share of agriculture in village
clusters’ livelihood (%) Haya Serai Hayasirai 54,2 Chakdara Sehsada 61 Badwan Badwan Bala 62,5 Khadagzai Khadagazai 76
3.7.2 Livestock
Livestock as main source of income - Average in Lower Dir : 0.4 %UC Village cluster Share of livestock in village
clusters’ livelihood (%) Haya serai Sher Khani 2,2 Khal Zormandai 2,5 Kotkay Dokrai 3,3
Page 13 of 15
Assessment Report-Lower Dir District 16 august 2010
Koto Haji Abad 3,3 Haya serai Kaladog 3,6
3.7.3 Salaried employment
Salaried employment as main source of income - Average in Lower Dir : 9.8 %UC Village cluster Share of salaries in village
clusters’ livelihood (%) Kambat Kambat Khas 25 Lal Qilla Pari Kas 30 Kotkay Dokrai 33,3Badwan Badwan Payeen 40 Khadagzai Sogyar 53,9
3.7.4 Daily Labour
Daily Labour as main source of income - Average in Lower Dir : 37 %UC Village cluster Share of daily labour in village
clusters’ livelihood (%) Gal Goor 68,3 Chakdara Khoshal Korona 71,9 Chakdara Ramora 76,2 Chakdara Chakdara 86,2
3.7.5 Business
Small Business as main source of income – Average in Lower Dir : 5 %UC Village cluster Share of business in village
clusters’ livelihood (%) Khadagzai Khadagazai 10,0 Mian Kalay Shanjai 10,0 Khadagzai Mian Brangola 12,5 Kotkay Dokrai 13,3 Samarbagh Samarbagh 15,0
3.7.6 Overseas financial support (remittances)
Remittances as main source of income – Average on Lower Dir : 18.8 %UC Village cluster Share of remittances in village
clusters’ livelihood (%) Zimdara Daro Jabagai 41,3 Gal Nagotal 43,2 Lal Qilla Pari Kas 60,0Kotkay Kotkay 78,8 Koto Shehzadi 83,1
3.7.7 Orchard crops
Orchards as main source of income– Average on Lower Dir : 0.4 %UC Village cluster Share of orchards in village
clusters’ livelihood (%) TbD Dhop 2,5 Mian kalay Shanjai 2,7 Khadagzai Mian brangola 10,0
Page 14 of 15
Assessment Report-Lower Dir District 16 august 2010
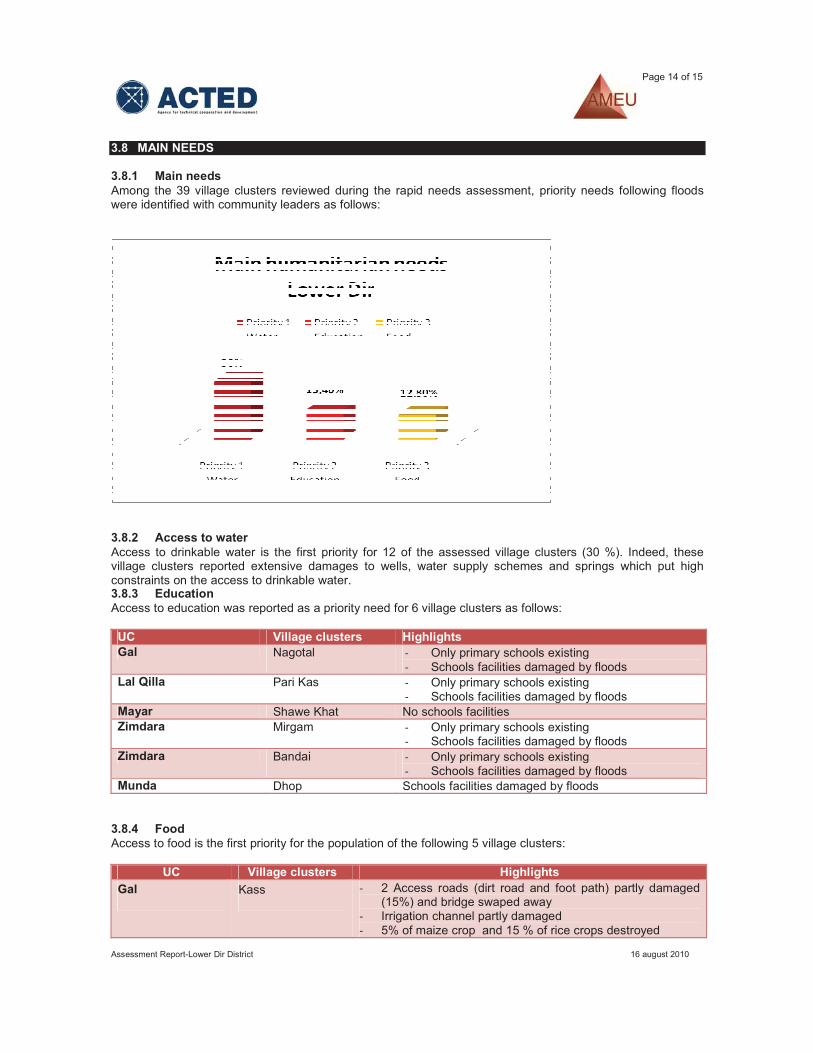
3.8 MAIN NEEDS 3.8.1 Main needs Among the 39 village clusters reviewed during the rapid needs assessment, priority needs following floods were identified with community leaders as follows:
3.8.2 Access to water Access to drinkable water is the first priority for 12 of the assessed village clusters (30 %). Indeed, these village clusters reported extensive damages to wells, water supply schemes and springs which put high constraints on the access to drinkable water. 3.8.3 Education Access to education was reported as a priority need for 6 village clusters as follows:
UC Village clusters HighlightsGal Nagotal � Only primary schools existing
� Schools facilities damaged by floodsLal Qilla Pari Kas � Only primary schools existing
� Schools facilities damaged by floods Mayar Shawe Khat No schools facilities Zimdara Mirgam � Only primary schools existing
� Schools facilities damaged by floods Zimdara Bandai � Only primary schools existing
� Schools facilities damaged by floodsMunda Dhop Schools facilities damaged by floods
3.8.4 Food Access to food is the first priority for the population of the following 5 village clusters:
UC Village clusters HighlightsGal Kass � 2 Access roads (dirt road and foot path) partly damaged
(15%) and bridge swaped away � Irrigation channel partly damaged � 5% of maize crop and 15 % of rice crops destroyed
Page 15 of 15
Assessment Report-Lower Dir District 16 august 2010
Kambat Kambat Khas � Access road (dirt road) totally damaged (100%) � Irrigation channel totally destroyed � 90 % of maize crop and 50 % of rice crops destroyed
Khadagzai Sogyar � Access road (metal road) partly damaged (16%) � Irrigation channel partly damaged � 50 % of maize crops and 40 % of rice crops destroyed
Khadagzai Kamala � All food stocks (wheat , wheat flour and rice) have been destroyed
� 2 Access roads (metal and dirt roads) totally damaged (100%)
� Irrigation channel totally destroyed � 80 % of maize crops and 37 % of rice crops destroyed
Koto Haji Abad � Access road (dirt road) partly damaged (33%) � Irrigation channel partly damaged � 50 % of rice crops and 15% of maize crops destroyed by
floods
3.8.5 Health Access to health care is second or third ranking priority by 19 village clusters. 63% of these village clusters do not have any access to health facilities. Others village clusters only benefit from a limited access to medical services (doctor or BHU/dispensary). The village cluster of Samarbagh (UC Samarbagh) is an exception since it has one hospital although its community is requesting additional health facilities. All existing health facilities in these 19 village clusters have been damaged by the floods.
3.8.6 Agriculture Support to agriculture is fifth ranking priority. It is however mentioned as first priority in 2 village clusters :
� Kotkay (Kotkay UC) � Sher Khani (Haya Serai UC)
Irrigation channels have been badly damaged by floods in both village clusters. Rice and maize crops have been slightly damaged as well (less than 10%).
3.8.7 Shelter Shelter was not reported as an immediate priority and is best scored at rank 7th. None of the assessed village clusters mentioned shelter as first, second or third priority. Little displacement occurred within the assessed village clusters and most of the displaced households had already came back to their original house or neighbourhood.
3.8.8 Income generation Income generation is not mentioned as a priority need. However, the population of Shakartangai (UC Haya Serai) mentioned income generation as its very first priority need. Daily work is indeed the most important source of income generation for this village cluster (66% of households concerned). It must have been most probably severely disrupted by the floods.
***