ACTA POLONIAE PHARMACEUTICA - PTFarm · Czasopismo Acta Poloniae Pharmaceutica ... Synthesis and in...
224
Drug Research ACTA POLONIAE PHARMACEUTICA VOL. 72 No. 3 May/June 2015 ISSN 2353-5288
-
Upload
hoangthuan -
Category
Documents
-
view
224 -
download
0
Transcript of ACTA POLONIAE PHARMACEUTICA - PTFarm · Czasopismo Acta Poloniae Pharmaceutica ... Synthesis and in...

Drug Research
ACTA POLONIAEPHARMACEUTICAVOL. 7�2 No. ����3� May/June 2015 � � � � � � ISSN 2353-5288

EDITOR
Aleksander P. MazurekNational Medicines Institute, The Medical University of Warsaw
ASSISTANT EDITOR
Jacek BojarskiMedical College, Jagiellonian University, KrakÛw
EXECUTIVE EDITORIAL BOARDThe Medical University of Warsaw
The Medical University of Warsaw
The Medical University of GdaÒsk
The Medical University of Warsaw
K. Marcinkowski University of Medical Sciences, PoznaÒ
The Medical University of Wroc≥aw
Polish Pharmaceutical Society, Warsaw
Czech Pharmaceutical Society
Charles Sturt University, Sydney
Pharmazeutisches Institut der Universit‰t, Bonn
DOV Pharmaceutical, Inc.
Semmelweis University of Medicine, Budapest
Miros≥awa FurmanowaBoøenna GutkowskaRoman KaliszanJan PacheckaJan PawlaczykJanusz PlutaWitold WieniawskiPavel KomarekHenry Ostrowski-MeissnerErhard RˆderPhil SkolnickZolt·n Vincze
This Journal is published bimonthly by the Polish Pharmaceutical Society (Issued since 1937)
Charges
Annual subscription rate for 2015 is US $ 210 including postage and handling charges. Prices subject to change. Back issues of previously published volumes are available directly from Polish Pharmaceutical Society, 16 D≥uga St., 00-238 Warsaw, Poland.Payment should be made either by bankerís draft (money order) issued to ÑPTFarmî or to our account Millennium S.A.No. 29 1160 2202 0000 0000 2770 0281, Polskie Towarzystwo Farmaceutyczne, ul. D≥uga 16, 00-238 Warszawa, Poland,with the memo Acta Poloniae Pharmaceutica - Drug Research.
Warunki prenumeraty
Czasopismo Acta Poloniae Pharmaceutica - Drug Research wydaje i kolportaø prowadzi Polskie TowarzystwoFarmaceutyczne, ul. D≥uga 16, 00-238 Warszawa.Cena prenumeraty krajowej za rocznik 2015 wynosi 207,90 z≥ (w tym 5% VAT). PrenumeratÍ naleøy wp≥acaÊ w dowol-nym banku lub UrzÍdzie Pocztowym na rachunek bankowy Wydawcy:
Millennium S.A.29 1160 2202 0000 0000 2770 0281Polskie Towarzystwo Farmaceutyczneul. D≥uga 16, 00-238 Warszawa
z dopiskiem: prenumerata Acta Poloniae Pharmaceutica - Drug Research. Warunki prenumeraty zagranicznej - patrz tekst angielski.
Typeset by RADIUS, Warszawa; Printed by MCP, Marki
The paper version of the Publisher magazine is a prime version.The electronic version can be found in the Internet on page
www.actapoloniaepharmaceutica.pl
An access to the journal in its electronics version is free of charge
Impact factor (2013): 0.693MNiSW score (2013): 15 pointsIndex Copernicus (2012): 13.18

Acta Poloniae Pharmaceutica ñ Drug Research
Volume 72, Number 3 May/June 2015
CONTENTS
REVIEW
409. Witold Musia≥, Janusz Pluta, Ji¯Ì Mich·lek Thermosensitive microgels of poly-N-isopropylacrylamide for drug carriers - practical approach to synthesis.
ANALYSIS
423. Przemys≥aw Zalewski, Piotr Garbacki, Judyta Development and validation of the stability-indicating LC-UVCielecka-Piontek, Katarzyna Bednarek-Rajewska, method for determination of cefozopran hydrochloride.Anna Krause
429. Eløbieta Kublin, Ewa Malanowicz, Barbara Development of chromatographic method for determination ofKaczmarska-Graczyk, Krystyna CzerwiÒska, drugs reducimg cholesterol level - statins and ezetimibe.Eløbieta Wyszomirska, Aleksander P. Mazurek
DRUG BIOCHEMISTRY
439. Ma≥gorzata Ewertowska, Przemys≥aw £. Miko≥ajczak, Different response of antioxidant defense system toIrena Okulicz-Kozaryn, Bogdan Stachecki, Marek Murias, acamprostate in ethanol-preferring and non-preferring rats.Jadwiga Jodynis-Liebert
447. Dorota Wrzeúniok, Artur Beberok, Micha≥ OtrÍba, Impact of gentamicin on antioxidant enzymes activity in Ewa Buszman HEMn-DP cells.
455. Tatjana KastratoviÊ, Slobodan ArsenijeviÊ, Methotrexate and myotrexate induce apoptosis in human Zoran MatoviÊ, Marina MitroviÊ, Ivana NikoliÊ, myoma fibroblasts (T hES cell line) via mitochondrial Zoran MilosavljeviÊ, Zoran Protrka, Marija äorak , pathway. Janko DuriÊ
DRUG SYNTHESIS
465. Eman M.H. Morsy, Eman R. Kotb, Hanan A. Soliman, Synthesis and in vitro antimicrobial activity of novel series ofHayam H. Sayyed, Nayira A.M. Abdelwahed 3,5-diacetylpyridine compounds.
475. Rasha S. Gouhar, Somaia S. Abd El-Karim, Mogedda Synthesis and antimicrobial evaluation of cyanopyridinylE. Haiba, Magdy I. El-Zahar, Ghada E.A. Awad tetrahydronaphthalene derivatives.
489. Marzanna StrupiÒska, Graøyna RostafiÒska-Suchar, Synthesis and study of halogenated benzylamides of someEløbieta Pirianowicz-Chaber, Mateusz Grabczuk, isocyclic and heterocyclic acids as potential anticonvulsants.Magdalena JÛzwenko, Hubert Kowalczyk, Joanna Szuba, Monika WÛjcicka, Tracy Chen, Aleksander P. Mazurek
NATURAL DRUGS
497. Ahmed Elkirdasy, Saad Shousha, Abdulmohsen Hematological and immunobiochemical study of green tea andH. Alrohaimi, M. Faiz Arshad ginger extracts in experimentally induced diabetic rabbits.
507. Tomasz Baj, Elwira Sieniawska, Radoslaw Kowalski, Effectiveness of the Deryng and Clevenger-type apparatus inMarek Weso≥owski, Beata Ulewicz-Magulska isolation of various types of components of essential oil from
the Mutelina purpurea Thell. flowers.
517. Anna Paulina Kowalczuk, Anna £ozak, Monika Kiljan, Application of chemometrics for identification of psychoactiveKrystynaMÍtrak, Jordan Konrad Zjawiony plants.
PHARMACEUTICAL TECHNOLOGY
527. Regina Kasperek, £ukasz Zimmer, Wojciech JawieÒ, Pharmacokinetics of diclofenac sodium and papaverineEwa Poleszak hydrochloride after oral administration of tablets to rabbits.
539. BarboraVranÌkov·, Jan Gajdziok Evaluation of sorptive properties of various carriers and coating materials for liquisolid systems.
APPHAX 72 (3) 407 ñ 626 (2015)
551. Eløbieta Kuriata, Wies≥aw Sawicki Evaluation of cases with the usage of commercially available tablets in the pediatric formula.
559. Michael A. Odeniyi, Nasir K. Khan, Kok K. Peh Release and mucoadhesion properties of diclofenac matrix tablets from natural and synthetic polymer blends.
569. Marta Szekalska, Katarzyna Winnicka, Anna Evaluation of alginate microspheres with metronidazole Czajkowska-Koúnik, Katarzyna Sosnowska, obtained by spray drying technique.Aleksandra Amelian
PHARMACOLOGY
579. Ma≥gorzata Zygmunt, Graøyna Ch≥oÒ-Rzepa, The effect of serotonin 5-HT1A, 5HT2 receptor ligands,Jacek Sapa ketoprofen and their combination in models of induced pain
in mice.
587. Ilona Kaczmarczyk-Sedlak, Maria Zych, Weronika Biochanin A shows no effect on skeletal system inWojnar, Ewa Ozimina-KamiÒska, S≥awomir Dudek, ovariectomized rats, when administered in moderate dose.Natalia Chada≥a, Agnieszka Kachel
597. Beata Diomöina Clinical experience of long-term treatment with aripiprazol (Abilify) in children and adolescents at the Child and Adolescent Psychiatric Clinic 1 in Roskilde, Denmark.
GENERAL
607. Muhammad Ashraf, Farah Abid, Sualeha Riffat, Rationalized and complementary findings of silymarin (milkSajid Bashir, Javed Iqbal, Muhammad Sarfraz, thistle) in Pakistani healthy volunteers.Attia Afzal, Muhammad Zaheer
615. Saleha Sadeeqa, Azmi Sarriff, Imran Masood, KAP among doctors regarding Halal pharmaceuticals acrossMuhammad Atif,,Maryam Farooqui sectional assessment.
625. Erratum

Acta Poloniae Pharmaceutica ñ Drug Research, Vol. 72 No. 3 pp. 409ñ422, 2015 ISSN 0001-6837Polish Pharmaceutical Society
Microgels are typically defined as crosslinkedpolymer particles dispersed in colloidal form in asuitable medium, which usually is water. Due to thepresence of specific functional groups, dependingon the type of dispersion medium, they may be sub-ject of extensive swelling (1). Sometimes, themicrogels are also referred to cross-linked latex par-ticles that swell in water, and release water as aresult of changes in thermodynamic conditions, suchas the presence of different additional solvents, thechange in environmental temperature, pH or ionicstrength of the solution. In practice, the swellingleads to significant hydration of the microgel parti-cles. In this case, the macroscopic picture can be vir-tually imperceptible with the naked eye. The parti-cles classified in a number of scientific publicationsas microgels vary in the terms of diameter, althoughthey are usually in the range from 1 nm to 10 µm,some authors accept a diameter range of 50-500 nmfor dried microgels. Hydrodynamic diameter ofmicrogels is the result of osmotic pressure on theone hand. On the other hand, the elastic forces andrespective tension, present in the molecule, influ-ence the diameter.
First study, confirming receipt of the microgel,in accordance with generally accepted definition,
appeared more than 70 years ago in chemical jour-nal printed in Berlin - Staudinger and Huseman pre-sented the synthesis and properties of polystyreneparticles (2). Less than 15 years later, Baker intro-duced the term ìmicrogelî for cross-linked polymerof butadiene and styrene (3). According to hisobservation of the resulting polymer, in contrast topreviously manufactured, he found that microgelsare characterized by solubility of the correspondinglinear polymers in the sol state (4). In the late eight-ies and in nineties, microgels based on N-isopropyl-acrylamide (NIPA) have become extremely attrac-tive subject of study by developing a simple andefficient method for their preparation by Pelton andChibante (5). Schematic course of the synthesis ofpoly-N-isopropylacrylamide (PNIPA) is shown inFigure 1.
REVIEW
THERMOSENSITIVE MICROGELS OF POLY-N-ISOPROPYLACRYLAMIDEFOR DRUG CARRIERS ñ PRACTICAL APPROACH TO SYNTHESIS
WITOLD MUSIA£1*, JANUSZ PLUTA2 and JIÿÕ MICH¡LEK3
1 Department of Physical Chemistry, 2 Department of Pharmaceutical Technology, Faculty of Pharmacy,Wroclaw Medical University, Borowska 211, 50-556 Wroc≥aw, Poland
3 Department of Polymer Gels, Institute of Macromolecular Chemistry, of the Academy of Sciences of Czech Republic, HeyrovskÈho n·m. 2, 162 06 Praha 6 ñ B¯evnov, Czech Republic
Abstract: The aim of the work is to present the main actual information on the preparation of polymers, deriv-atives of N-isopropylacrylamide, formed into microgels. The most often used comonomers, crosslinkers, andinitiator systems are gathered herein. The known methods of emulsion polymerization and precipitation poly-merization are also described, including the application of the surfactants, as well as the surfactant free emul-sion polymerization. Finally, the procedures of lab-scale production of microgel were evaluated in the paper,with special intact on the thermosensitive N-isopropylacrylamide derivatives for application in biomedicalfield.
Keywords: microgel, N-isopropylacrylamide, emulsion polymerization, precipitation polymerization
409
* Corresponding author: e-mail: [email protected]
Figure 1. Scheme of PNIPA synthesis

410 WITOLD MUSIA£ et al.
Poly-N-isopropylacrylamide is sometimesreferred to various acronyms, such as PNIPA,PNIPAAm, PNIPAA, PNIPAm. It is a thermosensi-tive polymer and through the application ofcrosslinking agent forms a stable three-dimensionalstructures, known as microgels or macrogels -depending on the type of structures formed. Sincethe critical phase transition temperature is around32OC, in dilute solutions the expanded structure ñ socalled coil structure - is collapsing. It transforms intoa globular form when the temperature of the volumephase transition temperature is achieved, as illustrat-ed in Figure 2. In the course of water removal fromthe area between the polymer chains, the loss ofnearly 90% of the particles mass occurs (6). Whenthe NIPA copolymer is applied intravenously, theelimination of circulating NIPA copolymers by thekidney is possible, if the molar mass of macromole-cules does not exceed 32,000 g/mol (7).
Microgels synthesized using NIPA enjoy agrowing interest among specialists in drug formtechnology, bioengineering and biocompatibile poly-mers (8-10). This is due to the above mentioned factof removal large amounts of water from particles ofPNIPA, around Volume Phase TransitionTemperature (VPTT). Consequently, one can expectthe release of drug substance from the microgels ofPNIPA under the influence of the thermal factor.Importantly, the VPTT is in the range of knownphysiological temperatures, e.g., in the range of thetemperature of human skin surface. By modifyingthe composition and structure of derivatives of NIPAit is possible to obtain a number of macromoleculeswith programmed VPTT in the water system. Thehigh compatibility of this group of polymers with thetissues of the body is of extreme importance. Itinvolves not only the chemical properties of PNIPA.
The high water content in the macromolecule con-tributes to high biocampatibility of forming micro-gels. This fact enables the development of experi-mental methods in the field of tissue engineering,such as synthesis of resorbable implants and inter-vertebral discs (11, 12). In addition, the PNIPAmicrogels form very stable colloidal dispersions, arerelatively simple to prepare, and their functionaliza-tion does not pose particular difficulties, assumingsuitable manner of reaction processing. The size ofthe obtained particles can be well controlled, and thepolydispersity index is usually maintained at a suffi-ciently low level. Through appropriate functionaliza-tion, i.e., through the introduction of fixed function-al groups, the obtained microgels become sensitiveto: the temperature factor, the factor of pH, or tochanges in ionic strength of the solution. The area ofpotential applications of thermosensitive polymers iscurrently being developed intensively (13).
Initiation systems, copolymers, crosslinking
agents
The first mention of the use of NIPA goes backto the fifties of the twentieth century, when it wastested due to potential repellent properties. Also thefirst approaches to the synthesis of NIPA polymerswere done at that time. Preparation of PNIPA wascarried out in different ways, although only in cer-tain cases, suitable microgels were obtained. Thestraight chains of PNIPA were formed in the courseof free radical polymerization. In this case, theorganic solvents are used, such as methanol, ben-zene, tetrahydrofuran, tert-butanol, dioxane, andchloroform, with specific initiators: azo-bis-isobuty-ronitrile, benzyl peroxide or lauryl peroxide.
Another way to obtain chains of PNIPA is aprocess carried out using a redox initiator in aqueous
Figure 2. Depiction of volume phase transition of PNIPA microgel initiated by temperature increase in aqueous environment

Thermosensitive microgels of poly-N-isopropylacrylamide for drug carriers... 411
medium. The reaction is initiated using the appro-priate initiator, usually: ammonium persulfate(APS), potassium persulfate (KPS) and sodium per-sulfate (NPS). As the initiator is sometimes alsoused azo-bis-isobutyronitrile (AIBN). Each of theinitiator molecules, resulting in activation, maybecome the center of the polymerization. The spher-ical structures are formed around polymerizationcenters. They are treated in the bibliography as solidparticles, dispersed in the aqueous phase. However,the resulting material is in varying degree filled withwater, and connected in the areas of polymer wherethe hydrophilic functional groups exist. Increasedtemperature in the course of synthesis affects theisolation of the polymer phase with low water con-tent from the external aqueous phase. This phenom-enon manifests itself in turbidity or opalescencewhen the macroscopic view of the reaction mixtureis observed.
The formation of hydrogels as nano- ormicrostructures was evaluated by numerous authors,whereas Duöek developed in details the problem ofso called microsyneresis; in the case of NIPAincreased temperature plays important role in micro-gel formation around the polymerization centers(14-16). The concentration of the initiator is alsocrucial for the properties of the resulting polymer.According to research of Xiao, with increasing con-centration of initiator - APS in the reaction mixture,the ability of the polymer to swell increased (17).Table 1 presents the sample composition of the ini-tial reaction mixture used to obtain microgels ofPNIPA.
Free radicals derived from initiator are dis-solved in water, and they remain in the solution,hence the initial reaction site is an aqueous solution,as presented in Figure 3 in stage I. As time passes,the oligomer chains with ionized groups are form-ing, coming from the initiator molecule. The result-ing oligomers are amphiphilic, due to the presenceof the hydrophilic ionic group and the lipophilic
chain of the resulting polymer - Phase II. This leadsover time to a micellar structures - Phase III, soonsaturated with a solution of monomer (stage IV); atthis point the reaction site is situated within themicelles, resulting in larger particles with time(stage V), which are stabilized by implementing anappropriate crosslinking agent. The hydrophilicgroups are forming outer layer of the micelles. Dueto the surface charge, the mutual repulsions stabilizethe resulting colloid. Addition of electrolyte in thecourse of the reaction, such as sodium chloride,favors the formation of larger colloidal particles. Itis caused by a reduction of repulsive forces betweenparticles.
The main factor, used for initiation of the poly-merization reaction is the temperature increase, butalso visible light, ultraviolet radiation or X-ray irra-diation are used (18). To ensure consistent molecu-lar weight of macromolecules obtained in the courseof the polymerization initiated in redox conditions,proper pH of the reaction mixture should be kept,using e.g., complex buffers in the pH range 6.5 or7.4 (19). In order to accelerate the reaction it is nec-essary to supplement the accelerator, such asN,N,Ní,Ní-tetramethylethane-1,2-diamine (tetra-methylethylenediamine, TEMED), or sodiummetabisulfite (sodium pyrosulfite). PNIPA, a linearpolymer, was first comprehensively described byHoward G. Schild from Research Division ofPolaroid Corporation in the early nineties of the lastcentury (20).
In order to obtain a microgel it is necessary toensure proper composition of the mixture of sub-strates, including the main monomer, comonomer,crosslinker, initiator system, and in some cases sur-factant. Polymerization carried out in one reactor,the so called ìbatch-synthesisî, requires the selec-tion of such components, in which the individualcomponents will react with each other with similarrate. The rate of reaction of individual comonomersaffects the final composition of the resulting poly-
Table 1. Exemplification of reactants composition in surfactant free precipitation polymerization of PNIPA.
Reactant type Reactant Acronyms
Initiator Ammonium persulfate APS
Accelerator N,N,Ní,Ní-tetramethylethane-1,2-diamine TEMED, TMED
Monomer N-isopropylacrylamide NIPA, NIPAA, NIPAAc
Crosslinker N,Ní-methylene-bis-acrylamide MBA, MBAm, BIS
Reaction environment Aqueous
Temperature 70OC

412 WITOLD MUSIA£ et al.
mer, according to the Mayo-Lewis equation (21).The compositions used for the receipt of the micro-gel are extremely diverse and include NIPA, theabove mentioned ingredients and comonomers, e.g.,acrylic acid (22), methacrylic acid and fumaric acid(23), acryl amide (24), maleic acid (25), hydroxy-ethyl methacrylate, N-vinylpyrrolidone (26), or N-tert-butylacrylamide (27, 28). The copolymers areusually used to obtain specific properties of themicrogel. Introduction of anionic functional groupsto the microgel can be achieved by applying suitablecopolymers: unsaturated monocarboxylic or dicar-boxylic acids, such as the above-mentioned acrylicacid, methacrylic acid and pentenoic acid (29).Table 2, prepared on the basis of Rzaev et al. work(30), summarizes selected comonomers used for thepreparation of functionalized microgels.
Production of a stable microgel is essentiallyconditioned by a suitable crosslinking agent. Themost commonly used crosslinking agents, and per-haps with the longest tradition of use in studies ofmicrogels, is N,Ní-methylene-bis-acrylamide (31-34). However, there are also used another crosslink-ers. In previously conducted studies, special atten-
tion was paid to influence of the content of thecrosslinking agent on physicochemical properties ofthe resulting polymer. We also evaluated the imple-mentation of the crosslinking agent to the polymerparticles (35). Among the crosslinking agents N,Ní-bis-cystaminoacrylamide is applied in the synthesis(36, 37). It was observed that with increasing con-tent of crosslinking agent increases the phase transi-tion temperature, although the course of the hydro-dynamic diameter changes as a function of increas-ing temperature is much milder and the phase tran-sition point is less well visualized (38).
Between various known crosslinkers, bifunc-tional derivatives of polyethylene glycol are used, asfactors affecting the morphology and thermosensi-tivity of PNIPA microgels (39). For controlleddelivery of insulin, the PNIPA derivative microgelswere synthesized with polyethylene glycol 400 -dimethacrylate derivative crosslinker (40, 41).Derivatives of NIPA in solution of chitosan weresynthesized with the addition of ethylene glycoldiacrylate which comprised four glycol units in thechain. It led to the formation of a thermosensitivegel (42). The use of ethylene glycol diacrylate with
Table 2. Choice of comonomers applied in the synthesis of copolymers of NIPA.
Group of comonomers Examples of comonomers
Comonomers with acidic groups Acrylic acid
Methacrylic acid
4-Pentenoic acid
2-Acrylamido-2-methyl-1-propenesulfonic acid
2-(Dimethylmaleimido)-N-ethylacrylamide
Maleic anhydride
Itaconic anhydride
4-Vinylphenylboronic acid
DNA
Acrylamide type comonomers Acrylamide
Acrylonitrile
2-(Dimethylamine)propylmethacrylamide
N-[3-(dimethylamine)propyl]methacrylamide
2-(Dimethylmaleimido)-N-ethylacrylamide
N-tert-butylacrylamide
N-butylacrylamide
Heterocyclic comonomers N-vinyl-2-pyrrolidone
4-Acryloyl-morpholine
1-Vinylimidazole
2-Methacryloylamidohistidine
N-acryloylpyrrolidine

Thermosensitive microgels of poly-N-isopropylacrylamide for drug carriers... 413
one (ethylene glycol dimethacrylate, EGDMA), andthree ethylene segments (triethylene glycoldimethacrylate, TEGDMA), resulted in micros-pheres with a diameter of 356 and 444 nm, respec-tively (43). In studies of crosslinking agents withdifferent solubility in water, such as tetraethyleneglycol dimethacrylate (TETGDMA), ethylene gly-
col dimethacrylate (EGDMA), dimethacrylatebutanediol-1,3 (1,3-BDDMA), and 1,4-BDDMA theincrease of solubility was accompanied by increasedhydrodynamic diameter of the microgels obtained.However, the VPTT remained unchanged (44). Toobtain submicron microgel some authors used glyc-erol dimethacrylate (GDMA), pentaerythritol tri-acrylate (PETA) and its propoxy derivative: pen-taerythritol triacrylate propoxylate (PEPT) - in thecase of crosslinking agents with the three acrylicfunctionals, microgels with low diameter wereobtained, whereas in the case of crosslinkers withtwo acrylic functionals higher diameters wereobserved (45). Due to the possibility of handlingcrosslinking agents with diversified polyoxyethyl-ene chain lengths within diacrylate and dimethacry-late derivatives, they are examined in the context ofthe controlled release of therapeutic substances (46).Figure 4 shows examples of crosslinking agents ofdifferent chain lengths.
Erbil et al. proposed the acrylated poly(dimeth-yl)siloxane (47). This resulted in a change in theVPTT, compared with NIPA polymer obtained fromconventional crosslinking agent - N,Ní-methylene-bis-acrylamide. More sophisticated methods include theuse of biodegradable crosslinking agents, such as ACL- 3,9-divinyl-2,4,8,10-tetraoxaspiro[5.5]undekane(acid-degradable crosslinking agent) (48). Efforts arealso attempted to synthesize microgel of PNIPA with-out the addition of crosslinking agent (49).
Figure 3. The changes of the locus of synthesis in the course of SFDP of NIPA derivatives, details in the text
Figure 4. Crosslinking agents with varied chain length: N,Ní-methylene-bis-acrylamide, glycol polyoxyethylene dimethacry-late, glycol polyoxyethylene diacrylate, respectively
414 WITOLD MUSIA£ et al.
The course of the reaction
A key element in the course of the synthesis ofmicrogels of PNIPA is that the NIPA is soluble inwater. Along with changes in temperature also thechanges in the solubility are observed, as demonstrat-ed in studies using nuclear magnetic resonance.Concentrated solution of NIPA delaminates, at tem-peratures below 25OC, as the concentration excess thestandard solubility of NIPA, while above 25OC thesolubility is lower than the standard NIPA solubilityvalue (50). In contrast to NIPA, its polymer is insolu-ble in water. However, it is true only at temperaturesabove the VPTT. Thus, the polymer particles are sep-arating from the solution and in the course of poly-merization the turbidity or iridescence of the reactionmixture is observed in the process of surfactant freeprecipitation polymerization (SFPP) or surfactant freeemulsion polymerization (SFEP) (51).
Preparation of microgels is usually conductedby one of the three currently mostly available meth-ods: by means of emulsion polymerization (EP), by
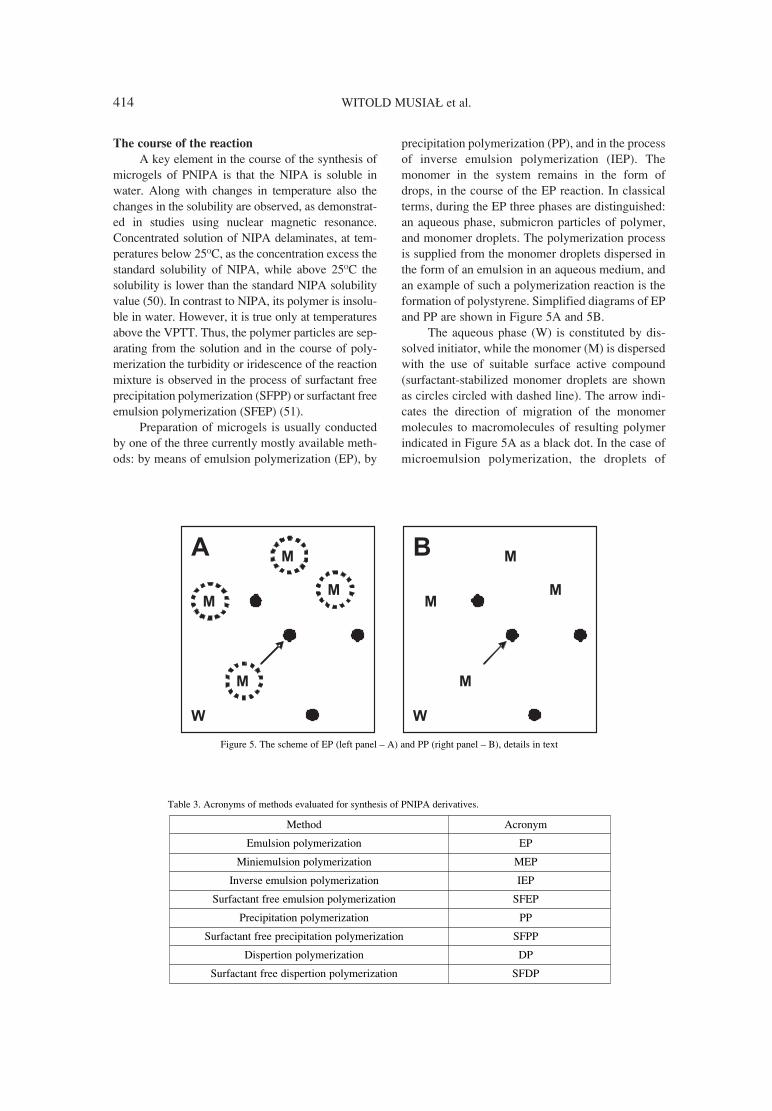
precipitation polymerization (PP), and in the processof inverse emulsion polymerization (IEP). Themonomer in the system remains in the form ofdrops, in the course of the EP reaction. In classicalterms, during the EP three phases are distinguished:an aqueous phase, submicron particles of polymer,and monomer droplets. The polymerization processis supplied from the monomer droplets dispersed inthe form of an emulsion in an aqueous medium, andan example of such a polymerization reaction is theformation of polystyrene. Simplified diagrams of EPand PP are shown in Figure 5A and 5B.
The aqueous phase (W) is constituted by dis-solved initiator, while the monomer (M) is dispersedwith the use of suitable surface active compound(surfactant-stabilized monomer droplets are shownas circles circled with dashed line). The arrow indi-cates the direction of migration of the monomermolecules to macromolecules of resulting polymerindicated in Figure 5A as a black dot. In the case ofmicroemulsion polymerization, the droplets of
Figure 5. The scheme of EP (left panel ñ A) and PP (right panel ñ B), details in text
Table 3. Acronyms of methods evaluated for synthesis of PNIPA derivatives.
Method Acronym
Emulsion polymerization EP
Miniemulsion polymerization MEP
Inverse emulsion polymerization IEP
Surfactant free emulsion polymerization SFEP
Precipitation polymerization PP
Surfactant free precipitation polymerization SFPP
Dispertion polymerization DP
Surfactant free dispertion polymerization SFDP

Thermosensitive microgels of poly-N-isopropylacrylamide for drug carriers... 415
monomer are characterized by very small radius ofseveral nanometers, and this is the right place forpolymerization. PP bases on the fact of precipitationof insoluble polymer obtained by polymerization ofa monomer soluble in water - Figure 5B. Evaluatedmethods with its variations and respective acronymsare gathered in Table 3.
In the course of EP, suitable emulsifier can beused. But in some cases, the components of the reac-tion mixture may be maintained in the dispersedphase without adding any surfactant. In this case, weare talking about EP without surfactant i.e., SFEP.For the synthesis of PNIPA, the terms SFEP orSFPP are used in bibliography. This second defini-tion better reflects the process, because as men-tioned earlier, the monomer, NIPA, in contrast tostyrene, is soluble in water and the resulting poly-mer is water insoluble. IEP bases on the phenome-non of polymer synthesis of monomer dissolved inthe aqueous phase, which in turn is dispersed in acontinuous oil phase. The advantage of this methodis the possibility of incorporation of water-solubletherapeutic substances or bioactives dispersed inwater, to the particles obtained in the polymerizationprocess. Group of such methods is also referred to asthe miniemulsion polymerization (MEP), althoughthere are some differences here in relation to theIEP. Consequently, we can distinguish reversed sus-pension polymerization, in which monomer is sus-pended in the droplets of aqueous phase dispersed inthe oil phase. Another way is to obtain microgels viamicroemulsion polymerization. Lin and colleaguesconducted a comparison of methods for the poly-merization of NIPA. According to the results of theirwork, they received the smallest diameter of themicrogels using EP, the intermediate values wereobserved in the case of SFEP, while the relatively
large microgels were obtained by polymerization ata temperature not exceeding 25OC (52).
The use of surfactants usually affects the deter-mined average diameter of the microgel. The diam-eters are in this case at a lower level than in the tech-niques without the use of surfactant. At the twoopposite poles, in terms of size of particles obtained,are the microgels obtained by polymerizationthrough the reverse microemulsion polymerizationand through EP - in the case of the former the syn-thesized microgels are of 100 nm, and the monomerdroplets are of diameter up to 10 nm. In the case ofEP, the particle size is of about 10 µm. In the case ofEP, drops can have a diameter between 10-100microns, and in MEP the magnitude of initialmonomer droplet is 30-500 nm (53). The emulsifiersused in the manufacture of microemulsions include:dodecyltrimethyl ammonium bromide and cetyltri-methyl ammonium bromide as examples of cationicemulsifiers, whereas the anionic emulsifiers are e.g.:1,4-bis (2-ethylhexyl) sulfosuccinate sodium andsodium lauryl sulfate (54).
Emulsion polymerization without surfactant
Many authors classify methods SFPP andSFEP as polymerization by homogeneous nucle-ation. This means that the monomer is dissolved ina suitable solvent. As a result of the polymerizationprocess, the polymer centers are formed, aroundwhich are growing polymer macromolecules.PNIPA, as insoluble in water, is precipitating in thecourse of the reaction, so the turbidity or opales-cence is observed in the previously transparent sys-tem. Typically, in the reaction system all the reac-tants are present, except the initiator system. Theintroduction of the initiator initiates the sequence inwhich oligomers are formed, and then unstable pre-
Figure 6. SEM images of NIPA derivatives, synthesized in similar conditions. The batch of microgels with higher diameter (left panel ñ I)was synthesized without comonomer, whereas the batch with lower diameter was synthesized with N-tert-butyl acrylamide as comonomer(right panel ñ II), details in text

416 WITOLD MUSIA£ et al.
cursor particles. Their aggregation leads to the for-mation of colloidally stable primary particles withunified sizes. The further course of the reactionaffects the polydispersity. The polydispersity indexincreases as a result of aggregation of primary parti-cles. This method may be developed to the, socalled, seeding polymerization, which will play arole in synthesis in more sophisticated core poly-meric structures, such as microgels with shell - core-shell microgels (55). SFEP method is successfullyused for the preparation of microgels with positive-ly charged surface - cationic microgels based onNIPA and 4-vinylpyridine (56). EP is subjected tonumerous modifications, including the ìsemi-batchîprocess. In that case the reactants are added to thereaction mixture in portions - as demonstrated byZhang et al. They obtained NIPA copolymer usingthe modified method, and resulting microgels werecharacterized by a lower diameter, while the poly-dispersity index was dependent on nucleation time(57). Fernandez and colleagues, in the course ofpolymerization of microemulsion particles, obtainedPNIPA with a diameter of 30 nm using a system ofbenzyl peroxide initiator and TEMED (58). InFigure 6, there are images from scanning electronmicroscopy (SEM), of microgels from two batchesof different PNIPA derivatives synthesized in thesame SFEP conditions. The only difference includesthe addition to the reactant mixture a lipophiliccomonomer - N-tert-butylacrylamide. The resultingstructures are smaller and more homogenous whenadditional lipophilic comonomer is applied (27).
Emulsion polymerization and precipitation poly-
merization using a surfactant
The use of an emulsifier, in concentrationsexceeding the critical micellar concentration, allowsthe stabilization of primary particles. This mecha-nism enables generally to obtain particle sizes lowerthan in the SFEP. The surfactant is binding to thesurface of primary particles and protects themagainst aggregation with other particles in the sys-tem. There are several interesting studies on thepreparation of the polymers of NIPA by precipita-tion method (59). In one study, authors used non-ionic surfactant Triton X-405, and in effect themicrospheres were pH-sensitive and changed thestructure due to the varied magnetic field ñ with pos-sible application in the columns for the fractionationof DNA (60). In a similar manner the synthesis wascarried out for copolymer of NIPA and acrylic acidwith 2-acrylamide-deoxyglucose, in order to obtainmicrospheres of approximately 100 nm loaded withglucosamine (61).
Inverse emulsion polymerization
In the IEP particles are prepared from pre-gel,i.e., from droplets of a solution of monomer suitablefor polymerization. The solution is dispersed in theoil phase. As a result, in the course of the reaction inaqueous phase, homogeneous microgels and aggre-gates of numerous microparticles smaller than thediameter of the emulsion droplets may be formed.An example of this type of polymerization is pro-duction of thermosensitive NIPA microgels, sensi-tive to an additional factor - the pH. Dowding et al.(62) applied here heptane as the continuous phase,while the NIPA was in the dispersed phase withMBA as a crosslinking agent. In IEP performed byZhang et al., the microspheres were synthesizedfrom NIPA, which enabled controlled release ofibuprofen (63). In the course of reverse MEP, thePNIPA was synthesized with the cobalt tetrafluo-roborate as a soft template (64).
Dispersion polymerization
Dispersion polymerization (DP) may be con-sidered as an interesting alternative to previouslymentioned polymerization methods that affordsmicron-size monodisperse particles, using a singlebatch process. The DP is a type of PP in which thepolymerization is performed from a monomer in thepresence of a suitable polymeric stabilizer solublein the reaction medium. Both the monomer and thepolymeric stabilizer should be easily soluble in theapplied solvent, whereas the formed polymer mustbe insoluble in the medium, usually an organic sol-vent. Initially, the system consists of a homoge-neous solution of monomer with initiator and dis-persant. The progression of the process leads to for-mation of sterically stabilized polymer particles bythe precipitation of the resulting polymer. Due tothe increase of monomer conversion rate, the prop-erties of the solvent evolve. Finally, the obtainedpolymer particles can achieve diameter of 0.1ñ15mm, and high monodispersity. Dispersant polymermay play a role as a reactive, polymerizablemacromonomer. The course of the reaction mayinvolve a block copolymer with specific affinity tothe surface of the precipitated polymer, as efficientdispersant. Also application of a soluble polymercalled ìstabilizer precursorî with grafting feature ispossible. In DP the dispersant polymer with hairylayer is a crucial factor in the process, due to thespecific adsorption or incorporation onto the sur-face of the polymer particles obtained by PP. Thetype of dispersant polymer controls the stability ofthe colloidal system, and influences particle size offormed objects (65, 66). Lee et al. synthesized

Thermosensitive microgels of poly-N-isopropylacrylamide for drug carriers... 417
crosslinked copolymer of NIPA and chitosan, usingDP. They applied the anionic initiator APS and thecationic initiator AIBA. The homogeneous mor-phology was obtained in the case of APS, whereasthe copolymer particles synthesized with AIBA asthe initiator presented a coreñshell morphology(67). Interesting structures were obtained by Akashiet al. (68), who applied as a dispersant polymer -PNIPA macromonomer 18 in ethanol, and synthe-sized thermosensitive microspheres 0.4ñ1.2 mm indiameter consisting of a polystyrene core, andPNIPA branches on the core surface. Also the mag-netic microspheres of PNIPA were synthesized bythe DP method; obtained particles were sensitive tothe magnetic field and shrunk into an increasinglycollapsed state at ca. 40OC (69).
Suspension polymerization
Within the process of suspension polymeriza-tion the monomer, relatively insoluble in water, isdispersed in the form of liquid droplets, with addi-tion of steric stabilizer. The vigorous stirring duringthe course of polymerization process enables pro-duction of polymer particles which are maintainedin the liquid phase, however, the dispersed particlesform a dispersed solid phase. The initiators must besoluble in the liquid monomer phase. Parallel terms:pearl and bead polymerization are simultaneously
applied for the description of the suspension poly-merization process, in the case of production of non-porous particles. The main target in suspensionpolymerization is to elicit uniform dispersion ofmonomer droplets in the liquid - aqueous phase,succeeded by precise coalescence of the droplets inthe polymerization course. Several factors influencethe uniformity and size of obtained polymericforms: the interfacial tension, the agitation and thetype of the reactor device. The synthesized poly-meric forms usually reach the range of 10 µm to 5mm in diameter. Application of suspending agentsresults in reduction of the coalescence of monomerdroplets, and in the reduction of the adjacency ofnascent particles. This leads to high uniformity ofthe dispersion of synthesized polymer. For somepolar monomers, e.g., acrylic acid, the dispersingmedium should be non-polar. The paraffin oils areapplied in this case. The isolation of obtained parti-cles is possible by filtration or sedimentation, espe-cially when the beads diameter does not exceed 10µm (70, 71). Within the process, a so called stablestate is ultimately reached, in which individualdrops maintain their size over prolonged periods oftime. In some cases the initially low-viscous solu-tion of liquid monomer is transformed progressivelyinto a viscous dispersion of polymer in monomersolution; finally solid particles are observed (72).
Table 4. Choice of bibliography dealing with NIPA derivatives applied in research which aimed controlled or targeted drug delivery.
Pharmacological group Bioactive substance Application route Ref.
ABA Chlorhexidine topical (75)
Lysozyme topical (76)
Ofloxacin parenteral (77)
CVA Fluvastatin stent platform (78)
Nifedipine topical (79)
Propranolol topical (80)
Caffeine topical (81)
ACA Doxorubicin parenteral (82)
Doxorubicin parenteral (83)
5-Fluorouracil topical (84)
5-Fluorouracil parenteral (85)
LA Procaine topical (86)
Lidocaine topical (87)
Bupivacaine parenteral (88)
NSAIDís Diclofenac topical (89)
Naproxen topical (90)
ABA - antibacterial agents; CVA - cardiovascular agents; ACA - anticancer agents; LA - local anestetics; NSAIDís - non-steroidal antiin-flammatory drugs

418 WITOLD MUSIA£ et al.
Zhou et al. gave a detailed prescription, con-sidering the suspension polymerization of PNIPAMmicrogel particles (73). The NIPAM, BIS, and sodi-um dodecyl sulfate (SDS) were dissolved in deion-ized water, heated to 70OC and stirred at 200 rpm for40 min with a nitrogen purge to remove oxygen.After nitrogen purge, the KPS dissolved in deion-ized water was added to initiate the polymerization.The reactant mixture was mixed at 1000 rpm for 4 h.The SDS was removed by centrifugation cycles withdecantations and dispersions in deionized water, andconcentrated with the use of centrifuge. Thermo-responsive macroporous poly(acrylamide-co-NIPA)microgels were synthesized by inversion suspensionpolymerization by Hao et al (74). The microgelspossessed large surface area, which is promisingfactor for future applications in the area of drugdelivery.
Approach to practical applications of NIPA deriv-
atives in drug delivery
Numerous publications consider the topic ofcontrolled or targeted drug delivery, by the use ofthermosensitive polymeric carriers ñ nanospheres ormicrospheres synthesized from the main monomerNIPA, and respective comonomers. In Table 4, wepresent a choice of bibliography dealing with NIPAderivatives synthesized in the form of microgel,applied in research which aimed controlled or tar-geted drug delivery. The reviewed bibliographycovers choice of original papers published in lasttwo years in the considered area.
Due to the data presented in Table 4, the NIPAderivatives were synthesized to obtain parenteral ortopical carriers for numerous drug moieties: anti-bacterial agents (ABA), cardiovascular agents(CVA), anticancer agents (ACA), local anestetics(LA), non-steroidal antiinflammatory drugs(NSAID). The simple and efficient method of sur-factant-free DP was applied for synthesis of micro-gels loaded by chlorhexidine for topical drug deliv-ery, where the temperature change was the factorinfluencing drug release (75). Similarly, topicalapplication of lysozyme was proposed with the useof copolymer of carboxymethylcellulose (CMC)and NIPA ñ the synthesis based on decorating thebackbone of CMC with linear chains of NIPA (76).Another antibacterial agent, ofloxacine, was incor-ported into NIPA crosslinked by acrylate terminat-ed poly(L-lactic acid)-b-poly(ethylene glycol)-poly(L-lactic acid) (77).
In several cases CVA were loaded to the sys-tems which consisted of NIPA derivatives. Theprocess of DP was used to obtain matrix/microgel
copolymer system for application of fluvastatin inthe form of stent platform (78). Nifedipine, potentinhibitor of calcium channels was introduced intopoly(2-acrylamido-2-methylpropanesulfonic acid)synthesized by single-spinneret electrospinningtechnique (79). Propranolol hydrochloride was com-bined with polyampholite N-isopropylacrylamide-based hydrogels copolymerized with acrylic acidand N-(3-aminopropyl)methacrylamide; the processof polymerization was performed via free radicalpolymerization using NIPA and cross-linker BIS indimethyl sulfoxide (80) Caffeine, an agent appliedboth for cardiovascular system, as well as topicalagent for skin imperfections was loaded to semi-telechelic poly(tert-butyl methacrylate)-b-PNIPAAmbrush-like polymers ñ the synthetic approach includ-ed complex method with chain transfer agent (81).
One of the rising branches in the field of drugmicro- and nanoforms is development of potentialcarriers for targeted and controlled delivery of ACA.Doxorubicin with folic acid were implemented intothe PNIPA-acrylamide-allylamine coated magneticnanoparticles, which are presumed for parenteralapplication (82). In another approach, doxorubicinwas loaded to thermo and pH dual responsive, poly-mer shell coated, magnetic mesoporous silicananoparticles, obtained via PP (83). Nanogel ofPNIPAM-co-chlorophyllin was synthesized bySFEP, and applied for the development of topicallyapplied 5-fluorouracil (84). The targeted delivery of5-fluorouracil was also studied in folate-targetedpoly[(p-nitrophenyl acrylate)-co-(NIPA)] nanohy-drogel, polymerized in the process of PP (85).
There is some information on the use of micro-gels synthesized via SFEP or PP for the controlledtopical delivery of LA ñ procaine (86) and lidocaine(87). One study involved complex problem of par-enteral application of acrylic acid-functionalizedmicrogels loaded by bupivacaine (88). Behind theLA also the NSAIDís are studied for topical appli-cations. Diclofenac diethyl ammonium was embed-ded into system, which based on sodium methacry-late and NIPA, as hydrophilic/pH-sensitive andthermo-responsive monomers, and on methacrylatebovine serum albumin as cross-linker (89).Naproxen sodium release was studied from 4-vinylpyridine-based smart nanoparticles synthesizedwith NIPA, 2-hydroxyethyl methacrylate, andacrylic acid, obtained in the process of PP in thepresence of shell-forming monomers (90). In onestudy, 5-aminolevulinic acid for topical applicationwas implemented to PNIPA-co-acrylic acid micro-gel; the microgel was synthesized via microemul-sion polymerization in oil-in-water system (91).

Thermosensitive microgels of poly-N-isopropylacrylamide for drug carriers... 419
Several works dealt with the influence of newlysynthesized NIPA derivatives on the release of modelparticles: dyes or aromatic model drugs; in somecases the dyes were introduced to reflect the structureof obtained polymer system. Interesting approach tothe synthesis of drug carrier was presented by Wynteret al., who proposed microfluidic synthesis for pro-duction of copolymer in a form of monodispersemicrogels, using so called co-flow glass capillarydevice for making single emulsion droplets of 25 ñ100 µm in diameter (92). Detailed NMR study ofinfluence of temperature on the release of five modeldrugs: salicylaldehyde, m-hydroxybenzaldehyde, eth-ylvanillin, 3,4-dimethoxybenzaldehyde and p-hydroxybenzaldehyde from beads synthesized via PPwas described by Hofmann and Schˆnhoff (93).Fluorescein-labeled dextran was used in the study ofmagnetic composite with obtained by surfactant-freeDP (94). Single fluorescein sodium salt was intro-duced to poly(acrylonitrile-co-NIPA) coreñshellnanoparticles, obtained in a complex procedure withamidoximation and quaternization of the shell materi-al (95). In another study, polyvinyl alcohol (PVA)matrix with nanosized pores was obtained by treat-ment with silica and glutaraldehyde; afterwards, theinternal pores of the dry PVA matrix were filled withPNIPA, and the rhodamine B dye was used for visu-alization of the release process (96). Microfluidicgeneration of organic/aqueous/organic double emul-
sions and subsequent photopolymerization of themonomer residing in the aqueous phase of thedroplets resulted in fabrication of PNIPA microgelscontaining hexadecane droplets: the system wasinvestigated using hydrophobic dye 7-diethylamino-3,4-benzophenoxazine-2-one i.e., Nile Red, andhydrophilic dye 4í,6-diamidino-2-phenylindole, toassess the characteristics of the obtained NIPA deriv-ative system (97). Microgel beads of PNIPA-co-acrylic acid copolymer obtained by PP were studiedby loading with fluorescent dye ñ FITC (98).
The synthesis of NIPA microgel is determinedby the use or proper composition of reactants, andrespective conditions of the reaction. The systemusually consists of a glass reactor with a lid for theintroduction of substrates to the reaction mixtureand to control the course of synthesis. The con-trolled steps of the procedure include the fixed reac-tion temperature conditions, the appropriatesequence of the substrates, the isolation of the sys-tem from the influence of atmospheric oxygen, andthe speed and method of stirring. Sample set for thesynthesis of PNIPA microgels is shown in Figure 7.
New approaches to synthesis of NIPAM deriv-atives involve synthesis of cross-linked poly(N-iso-propylacrylamide) microparticles in supercriticalcarbon dioxide (99).
SUMMARY
NIPA is a substrate for the synthesis of the cor-responding copolymers with different properties andnumerous possible applications in drug dosage formtechnology and in various branches of medicine.Synthesis of NIPA copolymers takes place mainlyas a free radical process. In order to obtain microgelswith the desired properties, the relevant systems, ini-tiators and accelerators, as well as the specificcomonomers and crosslinking agents must bearranged. This procedure allows one to transmit anappropriate charge to microgel surface or to main-tain planned hydrophilic or lipophilic properties ofthe microgel. An important factor influencing theparticle size obtained in the course of emulsionpolymerization, is application of a surfactant. Alsoprecipitation polymerization is often used, whichtherefore does not consume any surfactant. Thereare numerous modifications of the emulsion poly-merization and they are still under development.
Acknowledgments
The study was supported by research fellow-ship within ìDevelopment program of Wroclaw
Figure 7. Synthesis set for preparation of NIPA microgels, withmagnetic stirrer and feed-back control of temperature (M), cooler(C) and nitrogen inlet (N2)
420 WITOLD MUSIA£ et al.
Medical Universityî funded from European SocialFund, Human Capital, national Cohesion Strategy,Contract no. UDA-POKL.04.01.01-00-010/08-00.Authors would like to thank Mrs. Tonica Boncinafrom University of Maribor, Faculty of MechanicalEngineering, University Center for ElectronMicroscopy for the assistance in SEM measure-ments, within the frames of the project MTKD-CT-2005-029540-POLYSURF.
REFERENCES
1. Saunders B.R., Laajam, Daly N.E., Teow S., HuX., Stepto R.: Adv. Colloid Interface Sci. 147,251 (2009).
2. Staudinger H., Husemann E.: Ber. Dtsch.Chem. Ges. 68, 1618, (1935).
3. Baker W.O.: Ind. Eng. Chem. 41, 511 (1949).4. Seligman K.L.: Ind. Eng. Chem. 49, 1709
(1957)5. Pelton R.H., Chibante P.: Colloids Surf. 20, 247
(1986).6. Wu C., Wang X.: Phys. Rev. Lett. 80, 4092
(1998).7. Bertrand N., Fleischer J.G., Wasan K.M.,
Leroux J.-C.: Biomaterials 30, 2598 (2009).8. Quan C.-Y., Wei H., Shi Y., Li Z.-Y., Cheng S.-
X., Zhang X.-Z., Zhuo R.-X.: Colloid Polym.Sci. 289, 667 (2011).
9. Lee L., Woo I., Cheong S.: Macromol. Res. 18,208 (2010).
10. Dai W., Zhang Y., Du Z., Ru M., Lang M.: J.Mater. Sci. Mater. Med. 21, 1881 (2010).
11. Ohya S., Nakayama Y., Matsuda T.:Biomacromolecules 2, 856 (2001).
12. Stile R.A., Burghardt W.R., Healy K.E.:Macromolecules 32, 7370 (1999).
13. Shravani D., Lakshmi P.K.: Pharm. Sci. Monit.Int. J. Pharm. Sci. 2, 48 (2011).
14. Duöek K.: J.Polym. Sci. C Polym. Symp. 16,1289 (1967).
15. Duöek K.: J.Polym. Sci. C Polym. Symp. 3, 83(1972).
16. Duöek K.: Makromolekulare Chemie. Macro-molecular Symposia 7, 37 (1987).
17. Xiao X.C.: eXPRESS Polym. Lett. 1, 232(2007).
18. S·fr·ny A., Wojn·rovits L.: Radiat. Phys.Chem. 67, 707 (2003).
19. Wooten W.C., Blanton R.B., Coover H.W.: J.Polym. Sci. 25, 403 (1957).
20. Schild H.G.: Progr. Polym. Sci. 17, 163 (1992).21. Mayo F.R., Lewis F.M.: J. Am. Chem. Soc. 66,
1594 (1944).
22. Zhou J., Wang G., Zou L., Tang L., MarquezM., Hu Z.: Biomacromolecules 9, 142 (2008).
23. Hoare T., Pelton R.: Langmuir 24, 1005 (2008).24. Hoare T., Pelton R.H.: Biomacromolecules 9,
733 (2008).25. Das M., Sanson N., Fava D., Kumacheva E.:
Langmuir 23, 196 (2007).26. Jung J.-H., Sung Y.K.: Korea Polym. J. 2, 85
(1994).27. Musial W., Vincent B., Szumny A., Voncina B.:
Chem. Pap. 64, 602 (2010).28. Naha P.C., Casey A., Tenuta T., Lynch I.,
Dawson K.A., Byrne H.J., Davoren M.: Aquat.Toxicol. 92, 146 (2009).
29. Chen G., Hoffman A.S.: Macromol. Chem.Phys. 195, 1251 (1995).
30. Rzaev Z.M.O., DinÁer S., Piskin E.: Prog.Polym. Sci. 32, 534 (2007).
31. Acciaro R., Gilanyi T., Varga I.: Langmuir 27,7917 (2011).
32. Caykara T., Kiper S., Demirel G.: Eur. Polym.J. 42, 348 ( 2006).
33. Varga I., Gilanyi T., Meszaros R., Filipcsei G.,Zr˝nyi M.: J. Phys. Chem. B. 105, 9071 (2001).
34. Kara S., Pekcan O.: Mater. Chem. Phys. 80, 555(2003).
35. Tokuyama H., Ishihara N., Sakohara S.: Eur.Polym. J. 43, 4975 (2007).
36. Wang C., Flynn N.T., Langer R.: Adv. Mater.16, 1074 (2004).
37. Lee H., Park T.G.: Polym. J. 30, 976 (1998).38. Sierra-MartÌn B., Choi Y., Romero-Cano M.S.,
Cosgrove T., Vincent B., Fern·ndez-BarberoA.: Macromolecules 38, 10782 (2005).
39. Drapala P.W., Brey E.M., Mieler W.F., VenerusD.C., Derwent J.J., PÈrez-Luna V.H.: J.Biomater. Sci. Polym. Ed. 22, 59 (2011).
40. Leobandung W., Ichikawa H., Fukumori Y.,Peppas N.: J. Appl. Polym. Sci. 87, 1678 (2003).
41. Leobandung W., Ichikawa H., Fukumori Y.,Peppas N.: J. Control. Release 80, 357 (2002).
42. Verestiuc L., Ivanov C., Barbu E., Tsibouklis J.:Int. J. Pharm. 269, 185 (2004).
43. Kratz K., Lapp A., Eimer W., Helweg T.:Colloids Surf. A Physicochem. Eng. Asp. 197,55 (2002).
44. Hazot P., Delair T., Pichot C., Chapel J.P.,Elaissari A.: C. R. Chimie 6, 1417 (2003).
45. Elmas B., Tuncel M., ™enel S., Patir S., TuncelA.: J. Colloid Interface Sci. 313, 174 (2007).
46. Musial W., Kokol V., Fecko T., Voncina B.:Chem. Pap. 64, 791 (2010).
47. Erbil C., Kazanc�o�lu E., Uyan�k N.: Eur.Polym. J. 40, 1145 (2004).

Thermosensitive microgels of poly-N-isopropylacrylamide for drug carriers... 421
48. Zhang L., Bernard J., Davis T., Barner-Kowollik T., Stenzel M.: Macromol. RapidCommun. 29, 1521 (2008).
49. Gao J., Frisken B.J.: Langmuir 19, 5212 (2003).50. Sasaki S., Okabe S., Miyahara Y.: J. Phys.
Chem. B 114, 14995 (2010).51. Chun S.-W., Kim J.D.: Korean J. Chem. Eng.
19, 803 (2002).52. Lin C.-L., Chiu W.-Y., Lee C.-F.: J. Polym. Sci.
A Polym. Chem. 44, 356 (2006).53. Herk A.M.: Adv. Polym. Sci. 233, 1 (2010).54. Chow P.-Y., Gan L.M.: Adv. Polym. Sci. 175,
257 (2005).55. Xiao X.-C., Chu L.-Y., Chen W.-M., Wang S.,
Rui X.: Langmuir 20, 5247 (2004).56. Pinkrah V.T., Snowden M.J., Mitchell J.C.,
Seidel J., Chowdhry B.Z., Fern G.R.; Langmuir19, 585 (2003).
57. Zhang Q., Zha L., Ma J., Liang B.; J. ColloidInterface Sci. 330, 330 (2009).
58. Fernandez V.V.A., Tepale N., S·nchez-DÌazJ.C., Mendiz·bal E., Puig J.E., Soltero F.A.:Colloid Polym. Sci. 284, 387 (2007).
59. Pich A., Richtering W.: Adv. Polym. Sci. 234, 1(2010).
60. Rahman M., Elaissari A.: Sep. Purif. Technol.81, 286 (2011).
61. Teng D., Hou J., Zhang X., Wang X., Wang Z.,Li C.: J. Colloid Interface Sci. 322, 333 (2008).
62. Dowding P.J., Vincent B., Williams E.: J.Colloid Interface Sci. 221, 268 (2000).
63. Zhang K., Wu W., Guo K., Chen J., Zhang P.:Langmuir 26, 7971 (2010).
64. Cao Z., Ziener U., Landfester K.: Macromo-lecules 43, 6353 (2010).
65. Kawaguchi S., Ito K.: Adv. Polym. Sci. 175,299 (2005).
66. Oh J.K., Drumright R., Siegwart D.J., Matyja-szewski K.: Prog. Polym. Sci. 33, 448 (2008).
67. Lee C.-F., Wen C.-J., Chiu W.-Y.: J. Polym.Sci. A Polym. Chem. 41, 2053 (2003).
68. Chen M.-Q., Kishida A., Akashi M.: J. Polym.Sci. A Polym. Chem. 34, 1099 (1996).
69. Mackov· H., Kr·lov· D., Hor·k D.: J. Polym.Sci. A Polym. Chem. 45, 5884 (2007).
70. Vivaldo-Lima E., Wood P.E., Hamielec A.E.,Penlidis A.: Ind. Eng. Chem. Res. 36, 939(1997).
71. Dawkins J.V.: in Comprehensive PolymerScience. The Synthesis, Characterization &Applications of Polymers, Geoffrey A.,Bevington J.C. Eds., p. 231, Pergamon Press,Oxford, 1989.
72. Hamielec A.E., Tobita H.: in UllmannísEncyclopedia of Industrial Chemistry, p. 305,VCH Publishers, New York 1992.
73. Zhou S.Q., Wu C.: Macromolecules 29, 4998(1996).
74. Hao L., Yang H., Lei Z.: Mater. Lett. 70, 83(2012).
75. Musial W., Voncina B., Pluta J., Kokol V.: Sci.World J. 2012, Article ID 2437072012 (2012).
76. L¸ S., Liu M., Ni B.: Chem. Eng. J. 173, 241(2011).
77. Chen S., Zhong H., Gu B., Wang Y., Li X.,Cheng Z., Zhang L., Yao C.: Mat. Sci. Eng. C32, 2199 (2012).
78. Hickey J.A., Lynch I., Dawson K.A., Cox D.,Keenan A.K.: J. Biomat. Nanobiotechnol. 2, 18(2011).
79. Lin X., Tang D., Cui W., Cheng Y.: J. Biomed.Mat. Res. A. 100A, 1839 (2012).
80. Lago M.A., Grinberg V.Y., Burova T.V.,Concheiro A., Alvarez-Lorenzo C.: J. Funct.Biomater. 2, 373 (2011).
81. Luo Y.L., Zhang L.L., Xu F.: Chem. Eng. J.189, 431 (2012).
82. Alsmadi N.A., Wadajkar A.S., Cui W., NguyenK.T.: J. Nanopart. Res. 13, 7177 (2011).
83. Chang B., Sha X., Guo J., Jiao Y., Wang C.,Yang W.: J. Mater. Chem. 21, 9239 (2011).
84. Li W., Guo Q., Zhao H., Zhang L., Li J., Gao J.,Qian W. et al.: Nanomedicine 7, 383 (2012).
85. Blanco M.D., Guerrero S., Benito M.,Fern·ndez A., TeijÛn C., Olmo R., Katime I.,TeijÛn J.M.: Polymers 3, 1107 (2011).
86. Moreno-Bautista G., Tam K.C.: Colloid Surf.A: Physicochem. Eng. Asp. 389, 299 (2011).
87. Musia≥ W., Kokol V., Voncina B.: Polim. Med.39, 15 ( 2009).
88. Sivakumaran D., Maitland D., Hoare T.:Biomacromolecules 12, 4112 (2011).
89. Cirillo G., Iemma F., Spizzirri U.G., Puoci F.,Curcio M., Parisi O.I., Picci N.: J. Biomat. Sci.Polym. Ed. 22, 823 (2011).
90. Gomez C., Benito M., Katime I., Teijon J.M.,Blanco M.D.: J. Microencapsul. 29, 626 (2012).
91. Sahiner N., Ozay O., Aktas N.: Curr. Nanosci.7, 453 (2011).
92. Duncanson W.J., Lin T., Abate A.R., SeiffertS., Shah R.K., Weitz D.A.: Lab Chip. 12, 2135(2012).
93. Hofmann C.H., Schˆnhoff M.: Colloid Polym.Sci. 290, 689 (2012).
94. Hoare T., Timko B.P., Santamaria J., GoyaG.F., Irusta S., Lau S., Stefanescu C.F., Lin D.,

422 WITOLD MUSIA£ et al.
Langer R., Kohane D.S.: Nano Lett. 11, 1395(2011).
95. Silan C., Akcali A., Otkun M.T., Ozbey N.,Butun S., Ozayc O., Sahiner N.: Colloid Surf. BBiointerfaces 89, 248 (2012).
96. Gao S.F., Chen H.G., Wang Z.H., Cui Z.J.,Zhang Y.H.: Plast. Rubber Compos. 41, 13(2012).
97. Jagadeesan D., Nasimova I., Gourevich I.,Starodubtsev S., Kumacheva E.: Macromol.Biosci. 11, 889 (2011).
98. Acciaro R., Aulin C., W�gberg L., LindstrˆmT., Claesson P.M., Varga I.: Soft Matter 7, 1369(2011).
99. L. Cao, L. Chen, J. Jiao, S. Zhang, W. Gao:Colloid Polym. Sci. 2007, 285, 1229.
Received: 25. 11. 2013

Acta Poloniae Pharmaceutica ñ Drug Research, Vol. 72 No. 3 pp. 423ñ427, 2015 ISSN 0001-6837Polish Pharmaceutical Society
Cefozopran hydrochloride (Fig. 1) is a new,parenteral, fourth generation cephalosporin original-ly created by Takeda Chemical Industries. It wasfirst registered for treatment in Japan in 1995. CZHhas a broad spectrum of antibacterial activity againstGram positive such as Staphylococcus aureus andGram negative bacteria including Escherichia coliand Pseudomonas aeruginosa (1). It is stable againstvarious β-lactamases and has low affinities to theseenzymes (2). Cefozopran hydrochloride containsimidazopyridazinium methyl group at position 3,while in position 7 it is aminothiadiazomethoxyimi-noacetylamino structure (Fig. 1). Those elements areresponsible for broad spectrum of antibacterialactivity of CZH. It is often used for antibacterialprophylaxis in abdominal surgery and for treatmentof post-operative intra-abdominal infections (IAIs)(3, 4). Its recommended dose is only 2 g per day (1g every 12 h) because of its impact on healthcarecosts, and up to 4 g per day considered only for crit-ically ill patients. In view of its good stability in
solution, 1ñ2 g cefozopran dissolved in 100 mLsaline could be infused for 1 h every 8 h (5). Itsexcretion rate into urine up to 24 h after administra-tion is 82ñ94% and no active anti-microbial metabo-lite is observed in urine (6-9). CZH is well toleratedand most of adverse effects after its administrationwere of a mild or moderate severity, were of shortperiod, improved spontaneously, and recoveredcompletely (9). Since the majority of the side effectsof β-lactam antibiotics are caused by their degrada-
ANALYSIS
DEVELOPMENT AND VALIDATION OF THE STABILITY-INDICATING LC-UV METHOD FOR DETERMINATION
OF CEFOZOPRAN HYDROCHLORIDE
PRZEMYS£AW ZALEWSKI1*, PIOTR GARBACKI1, JUDYTA CIELECKA-PIONTEK1, KATARZYNA BEDNAREK-RAJEWSKA2 and ANNA KRAUSE3
1Department of Pharmaceutical Chemistry, Faculty of Pharmacy,Poznan University of Medical Sciences, Grunwaldzka 6, 60-780 PoznaÒ, Poland
2Department of Clinical Pathomorphology, Faculty of Medicine I,Poznan University of Medical Sciences, Przybyszewskiego 49, 60-355 PoznaÒ, Poland
3PozLab sp. z o.o. (Contract Research Organization) Parkowa 2, 60-775 PoznaÒ, Poland
Abstract: The stability-indicating LC assay method was developed and validated for quantitative determina-tion of cefozopran hydrochloride (CZH) in the presence of degradation products formed during the forceddegradation studies. An isocratic, RP-HPLC method was developed with C-18 (250 mm ◊ 4.6 mm, 5 µm) col-umn and 12 mM ammonium acetate-acetonitrile (92 : 8, v/v) as a mobile phase. The flow rate of the mobilephase was 1.0 mL/min. Detection wavelength was 260 nm and temperature was 30OC. Cefozopran hydrochlo-ride as other cephalosporins was subjected to stress conditions of degradation in aqueous solutions includinghydrolysis, oxidation, photolysis and thermal degradation. The developed method was validated with regard tolinearity, accuracy, precision, selectivity and robustness. The method was applied successfully for identifica-tion and determination of cefozopran hydrochloride in pharmaceuticals and during kinetic studies.
Keywords: method validation, stability-indicating method, cefozopran hydrochloride
423
* Corresponding author: e-mail: [email protected]; phone 004861-854-66-49
Figure 1. Chemical structure of cefozopran hydrochloride

424 PRZEMYS£AW ZALEWSKI et al.
tion products, it is vital to improve analytical meth-ods for the determination of β-lactam analogues.Previous studies have proved that cephalosporinsare susceptible to degradation in aqueous solutions(10-17) and in solid state (18-26). Developed chro-matographic method for the determination of CZHhad many disadvantages like significant organic sol-vent consumption or incompatible to HPLC-MSwater phase (27-30).
The aim of this work was to develop and vali-date HPLC method with UV detection suitable foridentification, determination, and stability study ofcefozopran hydrochloride and its degradation prod-ucts.
EXPERIMENTAL
Chemicals, reagents and solutions
Cefozopran hydrochloride was obtained fromCHEMOS GmbH Werner-von-Siemens Str. 3, D-93128 Regenstauf, Germany. It is white or pale yel-lowish white, crystalline powder soluble in waterand conforms to Japanese Pharmacopeia XV stan-dards.
All other chemicals and solvents were obtainedfrom Merck KGaA (Germany) and were of analyti-cal grade. High quality pure water was prepared byusing the Millipore purification system (Millipore,Molsheim, France, model Exil SA 67120).
Instrumentation
HPLC Dionex Ultimate 3000 analytical systemconsisted of a quaternary pump, an autosampler, acolumn oven and a diode array detector was used.As the stationary phase a Lichrospher RP-18 col-umn, 5 µm particle size, 250 mm × 4 mm (Merck,Darmstadt, Germany) was used. The mobile phasecomposed of acetonitrile ñ 12 mM ammoniumacetate (8 : 92, v/v). The flow rate of the mobilephase was 1.0 mL/min and the injection volume was10 µL. The wavelength of the DAD detector was setat 260 nm. Separation was performed at 30OC.Photodegradation stability studies were performedusing Suntest CPS+ (AtlasÆ) with filter Solar ID65.
Procedure for forced degradation study of cefozo-
pran hydrochloride
Stability tests were performed according toInternational Conference on HarmonizationGuidelines (31).
Degradation in aqueous solutions
The degradation of cefozopran hydrochloridein aqueous solutions was studied in hydrochloric
acid (1 mol/L) at 298 K, in sodium hydroxide (0.1mol/L) at 298 K and in water at 373 K. Degradationwas initiated by dissolving an accurately weighed5.0 mg of cefozopran hydrochloride in 25.0 mL ofthe solution equilibrated to desired temperature instoppered flasks. At specified times, samples of thereaction solutions were withdrawn and instantlycooled with a mixture of ice and water.
Oxidative degradation
Degradation was initiated by dissolving anaccurately weighed 5.0 mg of cefozopranhydrochloride in 25.0 mL solution of 3% H2O2
equilibrated to 298 K.
Thermal degradation
Samples of cefozopran hydrochloride (5.0 mg)were weighed into glass vials. In order to achievethe degradation of cefozopran hydrochloride in solidstate, their samples were immersed in heat chambersat 373 K at RH = 0%, at 373 K at RH ~ 76.4% andat 353 K at RH ~ 76.4%. At specified time intervals,determined by the rate of degradation the vials wereremoved, cooled to room temperature and their con-tents were dissolved in mixture acetonitrile andwater (1 : 1, v/v). The obtained solutions were quan-titatively transferred into measuring flasks and dilut-ed with the same mixture of solvents to 25.0 mL.
UV degradation
Samples of cefozopran hydrochloride (5.0 mg)were accurately weighed, dissolved in 25.0 mL ofwater and then they were exposed to light accordingto ICHQ1b directions.
RESULTS AND DISCUSSION
It was observed that satisfactory resolution ofcefozopran hydrochloride (retention time 4.6 min.)and their degradation products (retention time from1.9 to 3.6 min.) formed under various stress condi-tions was achieved when analysis of stressed sam-ples were performed on an HPLC system using a C-18 column and a mobile phase composed of 8 vol-umes of acetonitrile and 92 volumes of ammoniumacetate, 12 mmol/L. The detection was carried out at260 nm. The mobile phase flow rate was 1.0mL/min. Typical retention times of cefozopranhydrochloride were about 4.6 min (Fig. 2). Peakasymmetry was 0.98.
Method validation
HPLC method was validated according toInternational Conference on Harmonization

Development and validation of the stability-indicating LC-UV method for... 425
Guidelines. The method was validated for parame-ters such as specificity, linearity, precision, accura-cy and robustness.
SelectivityThe selectivity was examined for non-degrad-
ed and degraded samples (the solutions of cefozo-pran hydrochloride after stress conditions of hydrol-ysis (acid, base and neutral), photolysis, oxidation(H2O2) and thermal degradation.
The HPLC method for determination of cefo-zopran hydrochloride was found selective in thepresence of degradation products as shown in Figure2. Peaks were symmetrical, clearly separated fromeach other (Fig. 2).
LinearityLinearity was evaluated in the concentration
range 20-300 mg/L (10-150% of the nominal con-
centration of cefozopran hydrochloride duringdegradation studies). The samples of each solutionwere injected three times and each series comprised7 experimental points.
The calibration plots were linear in the follow-ing concentration range 20-300 mg/L (n = 9, r =0.9999). The calibration curve was described by theequation y = ac; y = (0.7904 ± 0.0022) c. The bvalue, calculated from equation y = ac + b, was notsignificant. Statistical analysis using Mandelís fit-ting test confirmed linearity of the calibrationcurves.
Accuracy, as recovery testThe accuracy of the method was determined by
recovering cefozopran hydrochloride from theplacebo. The recovery test was performed at threelevels 50, 100 and 150% of the nominal concentra-tion of cefozopran hydrochloride during degradation
Figure 2. HPLC chromatogram of cefozopran hydrochloride (CZH) after 120 h incubation at 298 K in 1 mol/L HCl
Table 1. Intra-day, inter-day precision (n = 6) and recovery studies (n = 3).
Spiked concentration (mg/L) Measured concentration ± S.D. (mg/L) RSD (%)
Intra-day precision
100.00 100.51 ± 0.22 0.15200.00 199.32 ± 0.82 0.39300.00 299.24 ± 1.14 0.36
Inter-day precision
100.00 100.05 ± 0.54 0.51
Recovery studies
Spiked concentration (mg/L) Measured concentration ± S.D. (mg/L) Recovery (%)
100.0 (~ 50%) 100.15 ± 0.65 100.15200.0 (~ 100%) 199.25 ± 1.23 99.62300.0 (~ 150%) 299.69 ± 1.51 99.90

426 PRZEMYS£AW ZALEWSKI et al.
studies. Three samples were prepared for eachrecovery level. The solutions were analyzed and thepercentage of recoveries was calculated.
PrecisionPrecision of the assay was determined in rela-
tion to repeatability (intra-day) and intermediateprecision (inter-day). In order to evaluate therepeatability of the methods, six samples were deter-mined during the same day for three concentrationsof cefozopran hydrochloride. Intermediate precisionwas studied comparing the assays performed on twodifferent days.
The intra-day and inter-day precision values ofmeasured concentration of cefozopran hydrochlo-ride, as calculated from linearity plots are given inTable 1. The RSD values were 0.15 and 0.51%,respectively, demonstrating that the method wasprecise.
Good recoveries were obtained for each con-centration, confirming that the method was accurate(Table 1).
Limits of detection (LOD) and quantification(LOQ)
The LOD and LOQ parameters were deter-mined from the regression equation of cefozopranhydrochloride: LOD = 3.3 Sy/a, LOQ = 10 Sy/a;where Sy is a standard error and a is the slope of thecorresponding calibration curve.
Under applied chromatographic conditions, theLOD of cefozopran hydrochloride was 1.04 mg/Land LOQ of cefozopran hydrochloride was 3.15mg/L.
RobustnessThe robustness of the procedure was evaluat-
ed after changing the following parameters: the
composition of the mobile phase (content of ace-tonitrile in the range 6ñ10%), the mobile phaseflow rate (flow rate in the range 0.8ñ1.2 mL/min),wavelength of absorption (in the range 255ñ265nm) and temperature (30 ± 2OC). For each parame-ter change, its influence on the retention time, res-olution, area and asymmetry of peak was evaluat-ed. No significant changes in resolution and shapesof peak, areas of peak and retention time wereobserved when above parameters were modified.Modifications of the composition of the mobilephase: organic-to-inorganic component ratio andpH resulted in the essential changes of retentiontime and resolution in determination of cefozopranhydrochloride.
Results of forced degradation experiments
During stability studies, degradation of20ñ80% should be achieved for establishing stabili-ty-indicating nature of the assay method. In previousstudies, concerning the stability of cephalosporins, itwas observed that basic hydrolysis was a fast reac-tion (10-17). Also in the case of cefozopranhydrochloride significant degradation was observedat basic hydrolysis. Photodegradation of cefozopranhydrochloride was observed after exposition evenon 1.2 million lux h (solution). It was observed thataround 30% of cefozopran hydrochloride degradedunder these conditions. Cefozopran hydrochloridewas susceptible for degradation in solid state. Atincreased RH the degradation was much faster thanin dry air. The results of forced degradations in var-ious conditions are summarized in Table 2. Similarresults were observed for other 4th generationcephalosporins: cefpirome sulfate (CPS) (23, 32)and cefoselis sulfate (CSS) (13, 24). CZH is morestable in solutions but easier degrades in solid statethan CPS and CSS.
Table 2. Results of forced degradation studies.
Stress conditions and time studies Degradation [%]
Acidic (1 mol/L HCl; 298 K; 77 h) 35.17
Basic (0.1 mol/ L NaOH; 298 K; 11 min) 48.76
Neutral (373 K; 65 min) 54.85
Oxidizing (3% H2O2; 298 K; 4 h) 23.65
Thermal (solid state; 373 K; RH~0%; 41 days) 88.68
Thermal (solid state; 373 K; RH~76.4%; 1 h) 96.83
Thermal (solid state; 353 K; RH~76.4%; 1 h) 47.61
1.2 million lux h (solution) 32.12
6.0 million lux h (solution) 83.37

Development and validation of the stability-indicating LC-UV method for... 427
CONCLUSION
The isocratic RP-LC method developed for theanalysis of cefozopran hydrochloride in their phar-maceutical preparations is selective, precise andaccurate. The method is useful for routine analysisdue to short run time and low amounts of used sol-vents (acetonitrile) in mobile phase. Water phase ofdeveloped method is compatible to HPLC-MS andcan be used for identification of degradation prod-ucts.
Acknowledgment
This study was supported by PRELUDIUMgrant from the National Science Centre Poland(UMO-2013/09/N/NZ7/01479).
REFERENCES
1. Iizawa Y., Okonogi K., Hayashi R., Iwahi T.,Imada A.: Antimicrob. Agents Chemother. 37,100 (1993).
2. Klein O., Chin N.X., Huang H.B., Neu H.C.:Antimicrob. Agents Chemother. 38, 2896(1994).
3. Ikawa K., Nomura K., Morikawa N., Ikeda K.,Ohge H., Sueda T., Taniwaki M.: J. Infect.Chemother. 14, 130 (2008).
4. Ikawa K., Morikawa N., Matsuda S., Ikeda K.,Ohge H., Takesue Y., Sueda T.: Int. J.Antimicrob. Agents 30, 352 (2007).
5. Nomura K., Morikawa N., Ikawa K., Ikeda K.,Fujimoto Y., Shimizu D., Taniguchi K. et al.: J.Antimicrob. Chemother. 61, 892 (2008).
6. Kita Y., Kimura Y., Yamazaki T., Imada A.:Chemotherapy 41, 121 (1993).
7. Ikawa K., Kozumi T., Ikeda K., Morikawa N.,Kobayashi R.: Jpn. J. Antibiot. 62, 435 (2009).
8. Motohiro T., Hanada S., Yamada S., Sasaki H.,Oki S., Yoshinaga Y., Oda K. et al.: Jpn. J.Antibiot. 47, 1589 (1994).
9. Paulfeuerborn W., M¸ller H.J., Borner K.,Koeppe P., Lode H.: Antimicrob. AgentsChemother. 37, 1835 (1993).
10. Patel G., Rajput S.: Acta Chromatogr. 23, 215(2011).
11. Ikeda Y., Ban J., Ishikawa T., Hashiguchi S.,Urayama S., Horibe H.: Chem. Pharm. Bull. 56,1406 (2008).
12. JeliÒska A., Dobrowolski L., Oszczapowicz I.:J. Pharm. Biomed. Anal. 35, 1273 (2004).
13. Zalewski P., Cielecka-Piontek J., JeliÒska A.:React. Kinet. Mech. Cat. 108, 285 (2013).
14. Sugioka T., Asano T., Chikaraishi Y., SuzukiE., Sano A., Kuriki T., Shirotsuka M., Saito K.:Chem. Pharm. Bull. 38, 1998 (1990).
15. Fubara J.O., Notari R.E.: J. Pharm. Sci. 87,1572 (1998).
16. Zalewski P., Cielecka-Piontek J., JeliÒska A.:Asian J. Chem. 25, 7596 (2013).
17. Medenecka B., JeliÒska A., Zajπc M., Ba≥dykaM., Juszkiewicz K., Oszczapowicz I.: Acta Pol.Pharm. Drug Res. 66, 563 (2009).
18. JeliÒska A., Medenecka B., Zajπc M., KnajsiakM.: Acta Pol. Pharm. Drug Res. 65 261 (2008).
19. Zajπc M., JeliÒska A., Zalewski P.: Acta Pol.Pharm. Drug Res. 62, 89 (2005).
20. JeliÒska A., DudziÒska I., Zajπc M., Oszcza-powicz I., Krzewski W.: Acta Pol. Pharm. DrugRes. 62, 183 (2005).
21. Zalewski P., Cielecka-Piontek J., Garbacki P.,JeliÒska A., Karaüniewicz-£ada M.: Chromato-graphia 76, 387 (2013).
22. Zajπc M., JeliÒska A., Dobrowolski L., Oszcza-powicz I.: J. Pharm. Biomed. Anal. 32, 1181(2003).
23. Zalewski P., SkibiÒski R., Cielecka-Piontek J.:J. Pharm. Biomed. Anal. 92, 22 (2014).
24. Zalewski P., Cielecka-Piontek J., JeliÒska A.:Centr. Eur. J. Chem. 10, 121 (2012).
25. JeliÒska A., Zajπc M., Jakubowska M.: React.Kinet. Catal. Lett. 73, 325 (2001).
26. Ikeda K., Ikawa K., Morikawa N., Ohge H.,Sueda T.: J. Pharm. Biomed. Anal. 49, 1075(2009).
27. Borner K., Borner E., Lode H.: J. Chromatogr.615, 174 (1993).
28. Kitahashi T., Furuta I.: J. Pharm. Biomed. Anal.34, 409 (2004).
29. Liu S.Y., Zhang D.S., Hu C.Q.: Eur. J. Med.Chem. 45, 5808 (2010).
30. Ikeda K., Morikawa N., Kuribayashi M., IkawaK., Nomura K., Taniwaki M.: J. Pharm.Biomed. Anal. 45, 811 (2007).
31. ICH, Stability Testing of New Drug Substancesand Products (Q1AR). International Conferenceon Harmonization, IFPMA, Geneva (2000).
32. Zalewski P., SkibiÒski R., Cielecka-Piontek J.,Bednarek-Rajewska K. Acta Pol. Pharm. DrugRes. 71, 731 (2014).
Received: 5. 05. 2014


Acta Poloniae Pharmaceutica ñ Drug Research, Vol. 72 No. 3 pp. 429ñ437, 2015 ISSN 0001-6837Polish Pharmaceutical Society
Hyperlipidemia (HLP) is a group of lipidmetabolism disturbances of various pathologicalbackground and they are characteristic in that theblood levels of cholesterol, mainly low density cho-lesterol (LDL) and/or triglycerides, increase.Elevated levels of total cholesterol and LDL aretightly associated with an increased risk of ischemicheart disease and disturbances in the cerebral, coro-nary and peripheral circulation. The most importantparameter of a lipid panel includes the LDL levels ñthe normal levels should be below 100 mg/dL, oreven below 80 mg/dL according to the current stan-dards of the European Society of Cardiology.Moreover, the cut-off value for the HDL levels hasbeen elevated ñ the normal levels are those above 40mg/dL for men and above 50 mg/dL for women,whereas a risk factor includes levels below 40mg/dL. The third most important parameter includesthe triglyceride levels ñ the normal levels are theones that do not exceed 150 mg/dL.
First-choice medicinal products used in thetreatment of hyperlipidemia, mainly in order toreduce the cholesterol levels, include 3-hydroxy-3-
methylglutaryl-coenzyme A (HMG-CoA) reductaseinhibitors namely statins, and aryloxyalkylcar-boxylic acids derivatives, namely fibrates (1-4).
Currently, a medicinal product belonging to anew group of agents affecting the lipid metabolismin the body has been introduced ñ and it is calledezetimibe. Ezetimibe selectively inhibits the absorp-tion of exogenous cholesterol from a diet and pres-ent in the bile, as well as plant sterols in the intes-tines. It binds to the Niemann-Pick C1 like 1 protein(NPC1L1) in the epithelium of the intestinal mucousmembrane. This protein plays a vital role in theabsorption of cholesterol into the cells, therefore thisagent reduces the cholesterol levels in the bloodplasma. However, the mechanism of action of eze-timibe is different from the one observed for agentsinhibiting the intestinal cholesterol absorption, ion-exchange resins and sitosterols (plant sterols) usedso far in pharmacotherapy. Moreover, it has beenobserved that this new medicinal product does notaffect the inhibition of gastrointestinal absorption inthe case of triglycerides, fatty acids, bile acids or fat-soluble vitamins (A and D vitamins). Therefore,
DEVELOPMENT OF CHROMATOGRAPHIC METHOD FOR DETERMINATION OF DRUGS REDUCING CHOLESTEROL
LEVEL ñ STATINS AND EZETIMIBE
ELØBIETA KUBLIN1*, EWA MALANOWICZ1, BARBARA KACZMARSKA-GRACZYK1,KRYSTYNA CZERWI—SKA1, ELØBIETA WYSZOMIRSKA1 and ALEKSANDER P. MAZUREK1,2
1 Department of Basic and Applied Pharmacy, National Medicines Institute, 30/34 Che≥mska St., 00-725 Warszawa, Poland
2 Department of Drug Chemistry, Medical University of Warsaw, 1 Banacha St., 02-097 Warszawa, Poland
Abstract: The presented developed HPLC method and GC method may be used to separate and determine allanalyzed 3-hydroxy-3-methylglutaryl-coenzyme A reductase inhibitors (statins) and ezetimibe using a singlecolumns and a uniform methodology. In order to perform qualitative and quantitative tests of statins and eze-timibe the Symmetry C18 column 250 mm ◊ 4.6 mm, 5 µm, the mobile phase: acetonitrile:water (70 : 30, v/v),adjusted to pH = 2.5 and a spectrophotometric detector for the HPLC method were used. For GC method col-umn HPñ 1; 30 m ◊ 0.25 mm ◊ 0.25 µm and FID detector were selected. All results and statistical data obtainedindicate good method sensitivity and precision. The RSD values are appropriate for both newly developedmethods.
Keywords: hyperlipidemia, HPLC, GC, 3-hydroxy-3-methylglutaryl-coenzyme A (HMG-CoA) reductaseinhibitors, atorvastatin calcium, fluvastatin sodium, rosuvastatin calcium, lovastatin, simvastatin, ezetimibe
429
* Corresponding author: e-mail: [email protected]

430 ELØBIETA KUBLIN et al.
ezetimibe has been included in a new subgroup ofmedicinal products used in the treatment of elevatedlevels of total cholesterol and LDL fraction. It isused in the treatment of primary hypercholes-terolemia (familial heterozygous and homozygous,and non-familial) and of familial homozygous sitos-terolemia as a diet-supporting agent.
Ezetimibe is used in monotherapy or more fre-quently in combination therapy with statins, if the
use of agents belonging to this group is contraindi-cated or poorly tolerated in high doses in thesepatients (5, 6).
Chemical formulas and names of medicinalproducts belonging to both therapeutic groups andused in combination therapy are presented in Figure 1.
Available literature of recent years does notinclude any publications discussing the method toidentify and determine ezetimibe in pharmaceutical
ROSUVASTATIN CALCIUM (C22H27FN3O6S) 2Cabis[(E)-7-[4-(4-fluorophenyl)-6-isopropyl-2-
[methyl(methylsulfonyl)amino]pyrimidin-5-yl](3R,5S)-3,5-dihydroxyhept-6-enoic acid] calcium salt
ATORVASTATIN CALCIUM (C22H27FN3O6S) 2Ca[R-(R*,R*)-2-(4-fluorophenyl)-‚,‰-dihydroxy-5-
(1-methylethyl)-3-phenyl-4-[(phenylamino)carbonyl]-1H-pyrrolo-1-heptanoate calcium
SIMVASTATIN (C25H38O5)(1S,3R,7S,8S,8aR)-8-[2-[(2R,4R)-4-hydroxy-6-oxotetrahydro-2H-pyran-2-yl]ethyl]-3,7-
dimethyl-1,2,3,7,8,8a-hexahydronaphthalen-1-yl 2,2-dimethylbutanoate
LOVASTATIN (C24H36O5)(1S,3R,7S,8S,8aR)-8-[2-[(2R,4R)-4-hydroxy-6-oxotetrahydro-2H-pyran-
2-yl]ethyl]-3,7-dimethyl-1,2,3,7,8,8a-hexahydronaphthtalen-1-yl (2S)-2-
methylbutanoate
FLUVASTATIN SODIUM (C24H25FNNaO4)[3R,5S,6E]-7-[3-(p-fluorophenyl)-1-(1-isopropyl)indol-2-yl]-3,5-dihydroxy-6-
heptenoate sodium
EZETIMIBE (C24H21F2NO3)(3R,4S)-1-(4-fluorophenyl)-3-[(3S)-
3-(4-fluorophenyl)-3-hydroxypropyl]-4-(4-hydroxyphenyl) azetidine-2-one
Figure 1. Chemical formulas and names of compounds belonging to statins and ezetimibe

Development of chromatographic method for determination of... 431
products and biological materials. There are onlyfew studies regarding clinical trials on the use ofezetimibe and statins in monotherapy and combina-tion therapy (5, 6).
In 2006, Kublin et al. have published a studyon determination of a whole group of statins usinggas chromatography with the FID detector (7). In2010, a study of a method to determine all medicinalproducts belonging to statins using HPLC with theSymmetry C18 column and a spectrophotometricdetector was published by the same authors (8). In2012, Kublin et al. published an article presentingtest methods for the most commonly used agentsbelonging to statins and fibrates using HPLC andGC (9).
In modern therapy of hypercholesterolemiasimvastatin or atorvastatin at a dose between 10 mgand 40 mg daily and ezetimibe at a dose 10 mg dailyare used most frequently. As a result, it is possible toreduce significantly statin doses that are used and toreduce the simvastatin dose of 80 mg, which is com-monly used and poorly tolerated by patients, toapprox. 10ñ20 mg with simultaneous use of ezetim-ibe at a dose of 10 mg. The medicinal product calledInegy, including simvastatin and ezetimibe at a dose
of 10 mg + 10 mg, has been already introduced tothe American market. On the Polish market, thisproduct has not been registered yet.
Due to lack of any reports regarding commonmethods for the identification and quantitative deter-mination of agents belonging to statins and ezetim-ibe simultaneously, especially in medicinal prod-ucts, it is justified to prepare methods to determinethe contents of these compounds.
The study was assumed to prepare further sim-ple, sensitive and unified quantification methods forthe identification and quantitative determination thatcould be used to study a group of 3-hydroxy-3-methylglutaryl-coenzyme A reductase inhibitors(HMG-CoA), namely statins and ezetimibe in rou-tine analyses, and to assess its analytical and eco-nomical aspects.
EXPERIMENTAL
Reference materials
Rosuvastatin calcium (MSN LaboratoriesLtd.), atorvastatin calcium (Pharmathen), simvas-tatin (Aurobindo Pharma Ltd.), lovastatin (Teva),fluvastatin sodium (USP), ezetimibe (Merck).
Figure 2. Regression curve for ezetimibe (HPLC)

432 ELØBIETA KUBLIN et al.
Medicinal products
Ezetrol ñ tablets 10 mg (MSD-SP Limited),Simorion ñ coated tablets 10 mg (Orion Pharma).
Reagents and equipment
High purity HPLC reagents: acetonitrile,methanol (Rathburn), orthophosphoric acid 85%(AppliChem). Dionex liquid chromatograph with aspectrophotometric detector. Agilent Technologiesgas chromatograph type 6890N with FID detector.
High performance liquid chromatography ñ
HPLC
Qualitative analysisEzetimibe identification
The Symmetry C18 column, 250 ◊ 4.6 mm, 5µm and a spectrophotometric detector were used forthe test (9, 10).
The following identification conditions wereprepared: mobile phase: acetonitrile:water (70 : 30,v/v), adjusted to pH = 2.5 with 85% orthophosphor-ic acid; column temperature: 35OC; autosamplertemperature: 15OC; mobile phase flow rate: 1.2mL/min; injection volume: 10 µL; wavelength: 232nm.
Preparation of calibration curve for ezetimibeStandard solutions of ezetimibe in methanol at
appropriate concentrations were prepared and a cal-
ibration curve for this compound was constructed(Fig. 2).
The linearity of the examined compound in thetested range of levels 0.010ñ199.92 µg/mL wasobserved.
The determination limit was 0.050 µg/mL, andthe detection limit ñ 0.010 µg/mL.
Quantitative determination Determination of ezetimibe
Under predetermined conditions, the selectedezetimibe levels were quantitatively determined in amedicinal product ñ Ezetrol tablets 10 mg.
A spectrophotometric detector and the wave-length of 232 nm were used during an analysis.Methanol was used as a solvent.
Preparation of standard and tested solutionsStandard solution of ezetimibe
Ca. 5 mg of a reference material - ezetimibewas weighed into a 100 mL measuring flask, dis-solved in methanol and diluted to volume withmethanol.
Tested solutionsCa. 50 mg of a powdered tablet mass of Ezetrol
(corresponding to approx. 5 mg of the active sub-stance - ezetimibe) was weighed into a 100 mLmeasuring flask, approx. 50 mL of methanol was
Table 1. Retention times (Rf) of tested compounds (HPLC).
RETENTION COMPOUND NAME TIME
[min]
ROSUVASTATIN CALCIUM 2.45
EZETIMIBE 3.01
ATORVASTATIN CALCIUM 3.41
FLUVASTATIN SODIUM 3.73
LOVASTATIN 7.65
SIMVASTATIN 9.96
Table 2. Retention time (Rf) for tested compounds (GC).
RETENTIONCOMPOUND TIME
[min]
FLUVASTATIN SODIUM 2.26
ROSUVASTATIN CALCIUM 3.19
LOVASTATIN 4.14
SIMVASTATIN 4.41
ATORVASTATIN CALCIUM 5.51
EZETIMIBE 6.74
Table 3. Statistical assessment of results of determining the contents of ezetimibe in a medicinal product with HPLC and GC methods.
NAME OF NUMBER AVERAGE STANDARD CONFIDENCECOMPOUND / OF TESTS FROM ALL DEVIATION INTERVAL X ± ∆X
RSD
PRODUCT n MEASUREMENTS X (%) S Pu = 95% (w %)(%)
Ezetimibe tablets (Ezetrol) 10 99.04 0.02 99.04 ± 0.02 0.22HPLC
Ezetimibe tablets (Ezetrol) 10 100.21 0.04 100.21 ± 0.04 0.55
GC

Development of chromatographic method for determination of... 433
added and the solution was shaken mechanically for30 min. Solutions were diluted to the volume, andfiltered. The solutions obtained were used in tests.Table 3 presents results and a statistical assessment.Exemplary chromatograms are presented in Figures3 and 4.
Simultaneous quantitative determination of eze-
timibe and simvastatin
Medicinal products: Ezetrol and SimorionThe determination was carried out at the fol-
lowing wavelengths: 232 nm for ezetimibe and 238nm for simvastatin.
Preparation of standard solution of ezetimibe andsimvastatin
Ca. 5 mg of a reference material (ezetimibe)and 5 mg of a reference material (simvastatin) were
transferred to a 100 mL measuring flask, dissolvedin methanol and diluted to volume with methanol.
Tested solutionsApproximately 50 mg of a powdered tablet
mass of Ezetrol (corresponding to approx. 5 mg ofthe active substance - ezetimibe) and 50 mg of apowdered tablet mass of Simorion (correspondingto approx. 5 mg of the active substance - simvas-tatin) were weighed into a 100 mL measuring flask.Approx. 50 mL of methanol was added and thesolution was shaken mechanically for 30 min.Solutions were diluted with methanol and filtered.The solutions obtained were used in tests.Exemplary chromatograms are presented in Figures5 and 6. Table 4 presents results and a statisticalassessment.
Figure 3. Chromatogram of the ezetimibe standard (HPLC)
Figure 5. Chromatogram of the mixture of ezetimibe and simvas-tatin prepared from tablets at the wavelength of 232 nm (HPLC)
Figure 4. Chromatogram of the ezetimibe solution prepared fromtablets (HPLC)
Figure 6. Chromatogram of the mixture of ezetimibe and simvas-tatin prepared from tablets at the wavelength of 238 nm (HPLC)

434 ELØBIETA KUBLIN et al.
Gas chromatography (GC) method
Qualitative analysisEzetimibe identification
The following column was used: HPñ 1; 30 m◊ 0.25 mm ◊ 0.25 µm and the FID detector (8, 10).The identification conditions prepared: detectortemperature: 320OC; injection chamber temperature:300OC; column temperature: programme ñ initialtemp. 190OC for 1 min; increment of 8OC/1 min to
the final temp. of 285OC/2 min; gas flow: 3.9mL/min; injection volume: 1.0 µL and split: 10 : 1.
Preparation of a calibration curve for ezetimibe
Standard solutions of ezetimibe in methanol atappropriate concentrations were prepared and a cali-bration curve for this compound was drawn (Fig. 7).
The linearity in the tested range of levels39.98ñ999.60 µg/mL was observed. The determina-
Figure 7. Regression curve for ezetimibe (GC)
Figure 8. Chromatogram of ezetimibe standard (GC)
Figure 9. Chromatogram of the ezetimibe solution prepared from tablets (GC)

Development of chromatographic method for determination of... 435
tion limit was 39.984 µg/mL and the detection limitñ 19.992 µg/mL.
Quantitative determination Determination of ezetimibe with the GC method
Under predetermined conditions, the selectedezetimibe concentrations were quantitatively deter-mined in a medicinal product ñ Ezetrol tablets 10mg. The FID detector was used during analyses.Methanol was used as a solvent.
Preparation of standard and tested solutionsStandard solution of ezetimibe
Ca. 5 mg of a reference material was weighedinto a 25 mL measuring flask, dissolved in methanoland diluted to volume with methanol.
Tested solutionsCa. 100 mg of a powdered tablet mass of
Ezetrol (corresponding to approx. 10 mg of theactive substance - ezetimibe) was weighed into a 50
Figure 10. Chromatogram of the mixture of ezetimibe and simvastatin standards (GC)
Figure 11. Chromatogram of ezetimibe and simvastatin solution prepared from tablets (GC)
Table 4. Statistical assessment of results of determining the contents of active substances in medicinal products with HPLC and GC meth-ods parallely.
NAME OF NUMBER AVERAGE STANDARD CONFIDENCECOMPOUND / OF TESTS FROM ALL DEVIATION INTERVAL X ± ∆X
RSD
PRODUCT n MEASUREMENTS X (%) S Pu = 95% (w %)(%)
Ezetimibe tablets 9 99.06 0.05 99.06 ± 0.04 0.46
(Ezetrol)
Simvastatin coated tablets 9 98.10 0.03 98.10 ± 0.02 0.27
(Simorion)
Ezetimibetablets 8 99.84 0.87 99.84 ± 0.73 0.87
(Ezetrol)
Simvastatincoated tablets 8 95.48 0.26 95.48 ± 0.22 0.28
(Simorion)
HPL
C
GC

436 ELØBIETA KUBLIN et al.
mL measuring flask, approx. 25 mL of methanolwas added and the solution was shaken mechanical-ly for 30 min. Solutions were diluted to volume, andfiltered. The solutions obtained were used in tests.
Table 3 presents results and a statistical assess-ment. Exemplary chromatograms are presented inFigures 8 and 9.
Parallel quantitative determination of ezetimibe
and simvastatin
Medicinal products: Ezetrol and SimorionThe tests were performed under predetermined
conditions used for the gas chromatography method.
Standard solution of ezetimibe and simvastatinCa. 5 mg of a reference material - ezetimibe
and 5 mg of a reference material - simvastatin wereweighed into a 25 mL measuring flask, dissolved inmethanol and diluted to volume with methanol.
Tested solutions.Ca. 100 mg of a powdered tablet mass of
Ezetrol (corresponding to approx. 10 mg of the
active substance - ezetimibe) and 100 mg of a pow-dered tablet mass of Simorion (corresponding toapprox. 10 mg of the active substance ñ simvastatin)were weighed into a 50 mL measuring flask, approx.25 mL of methanol was added and the solution wasshaken mechanically for 30 min. Solutions werediluted to volume with methanol and filtered. Thesolutions obtained were used in tests. Exemplarychromatograms are presented in Figures 10 and 11.Table 4 presents results and a statistical assessment.
Identification of the mixture containing ezetimibe
and 3-hydroxy-3-methylglutaryl-coenzyme A
(HMG-CoA) reductase inhibitors - statins
The parallel test to identify HMG-CoA reduc-tase inhibitors used in pharmacotherapy ñ statinsand ezetimibe using the HPLC method and gas chro-matography method was performed.
During the HPLC method a mixture of the fol-lowing substances in methanol was used: atorvas-tatin calcium ñ 52.7 µg/mL, lovastatin ñ 48.8µg/mL, simvastatin ñ 52.2 µg/mL, fluvastatin sodi-um ñ 50.5 µg/mL rosuvastatin calcium ñ 51.5µg/mL and ezetimibe ñ 51.9 µg/mL.
The following predetermined assay conditionswere used: Symmetry C18, 250 ◊ 4.6 mm, 5 µmcolumn; mobile phase: acetonitrile : water (70 : 30,v/v), adjusted to pH = 2.5 with 85% orthophosphor-ic acid; column temperature: 35OC; autosamplertemperature: 15OC; mobile phase flow: 1.2 mL/min;injection volume: 10 µL; wavelength: 232 nm.
All tested compounds were separated, andretention times obtained are presented in Table 1.The separation factor between two adjacent peaks ofatorvastatin and fluvastatin (peaks 3 and 4 in Fig.10) is 2.44. The chromatogram is presented inFigure 12.
During the gas chromatography (GC) method amixture of following substances in methanol solu-tions was used: atorvastatin calcium ñ 52.7 µg/mL,lovastatin ñ 48.8 µg/mL, simvastatin ñ 55.2 µg/mL,fluvastatin sodium ñ 101.0 µg/mL, rosuvastatin cal-cium ñ 103.0 µg/mL and ezetimibe ñ 266.3 µg/mL
Figure 13. Chromatogram of the statin mixture and ezetimibe standards (GC)
Figure 12. Chromatogram of the statin mixture and ezetimibe stan-dards (HPLC)

Development of chromatographic method for determination of... 437
The following identification conditions weredeveloped: HPñ 1 column; 30 m ◊ 0.25 mm ◊ 0.25µm; detector temperature: 320OC; injection chambertemperature: 300OC; column temperature: pro-gramme ñ initial temp. 240OC for 1 min; incrementof 10OC/1 min to the final temp. of 295OC, 2 min;gas flow: 3.9 mL/min; injection volume: 1.0 µL;split: 10 : 1.
All tested compounds were separated, andretention times obtained are presented in Table 2.The separation factor between two adjacent peaksof lovastatin and simvastatin (peaks 4 and 5 in Fig.13) is 2.08. The chromatogram is presented inFigure 13.
DISCUSSION OF RESULTS
With regard to the fact that treatment of hyper-cholesterolemia often involves combination therapyincluding medicinal products belonging to statins ñsimvastatin the most frequently and ezetimibe, thispaper was aimed to perform a quantitative analysisusing HPLC and GC methods of compounds that arethe most frequent ingredients of medicinal products.Results and statistical data obtained presented inTable 3 and 4 indicate good method sensitivity andprecision. The RSD values presented in Table 3 and4 are appropriate for newly developed methods todetermine ezetimibe alone, as well as ezetimibe andsimvastatin simultaneously.
CONCLUSIONS
HPLC and GC methods developed and pre-sented herein may be used for simultaneous separa-tion and determination of all tested (HMGñCoA)
reductase inhibitors ñ statins, and a newly intro-duced compound ñ ezetimibe, using one column andsimilar methods.
REFERENCES
1. Therapy and drugs (Polish); K≥osiewicz-Latoszek L. Ed., 6, Center of ScientificInformation Polfa, Warszawa 1999.
2. Chemistry of medicines (Polish), Zejc A.,Gorczyca M. Eds., p. 421, PZWL, Warszawa2008.
3. Chemistry of medicines (Polish): Zajπc M.,Pawe≥czyk E. Eds., p. 403, PoznaÒ Universityof Medical Sciences, PoznaÒ 2000.
4. Bon-Ba≥aciÒska M.: Medicine after graduation(Polish), Vol. 12, 111 (2003).
5. Woøakowska-Kapion B., Gorczyca-Michta I.:Cardiovascular diseases (Polish), 8, 86 (2011).
6. Koz≥owski D., Sominka D., Koz≥owska M.,RekúÊ £., Sid≥owska E., Homenda W.,Budrejko Sz., Raczak G.: Geriatry (Polish), 2,105 (2008).
7. Kublin E., Kaczmarska-Graczyk B., MazurekA.P.: Acta Pol. Pharm. Drug Res. 62, 404(2006).
8. Kublin E., Kaczmarska-Graczyk B., Malano-wicz E., Mazurek A.P.: Acta Pol. Pharm. DrugRes. 67, 455 (2010).
9. Kublin E., Malanowicz E., Kaczmarska-Graczyk B., Mazurek A.P.: Acta Pol. Pharm.Drug Res. 69, 139 (2012).
Received: 29. 05. 2014


Acta Poloniae Pharmaceutica ñ Drug Research, Vol. 72 No. 3 pp. 439ñ445, 2015 ISSN 0001-6837Polish Pharmaceutical Society
It is generally accepted that oxidative stressplays an important role in ethanol toxicity. The abil-ity of acute and chronic ethanol treatment toincrease production of reactive oxygen species(ROS) and enhance peroxidation of lipids as well asoxidative damage of protein and DNA has beendemonstrated in a variety of systems, cells andspecies including humans. Various pathways play akey role in ethanol-induced oxidative stress e.g.,redox state changes (decrease in the NAD+/NADHratio) produced as a result of ethanol oxidation,effects on antioxidant enzymes, one electron oxida-tion of ethanol to the 1-hydroxyethyl radical. It hasbeen shown that CYP2E1 which is specificallyinvolved in ethanol oxidation has a high oxidaseactivity and plays a crucial role in the microsomalgeneration of ROS and of ethanol-derived free radi-cals (1, 2).
Acamprosate (calcium 3-acetamido-1-propanesulfate; CAS number 77337-73-6) (AC), astructural analog of „-aminobutyric acid andhomolog of taurine, has been shown to attenuaterelapse in human alcoholics (3, 4). There is someevidence suggesting that AC affects glutamatergicreceptor system and may act as ìpartial co-agonistîdirectly on spermidine-sensitive site of the N-methyl-D-aspartate (NMDA) receptor or viametabotropic receptors type 5 (mGluR5) but manyaspects of its pharmacological profile are stillunknown (5). Moreover, results of some researchsuggest that, as a taurine analog, AC can act as a lig-and for taurine receptors (6). It was also noted thatAC administration to laboratory animals significant-ly increased taurine levels in the brain (7).
Taurine has been shown to be tissue protectivein many models of oxidative injury. For example,
DRUG BIOCHEMISTRY
DIFFERENT RESPONSE OF ANTIOXIDANT DEFENSE SYSTEM TO ACAMPROSATE IN ETHANOL PREFERRING AND NON-PREFERRING RATS
MA£GORZATA EWERTOWSKA1, PRZEMYS£AW £. MIKO£AJCZAK2, IRENA OKULICZ-KOZARYN2, BOGDAN STACHECKI3, MAREK MURIAS1
and JADWIGA JODYNIS-LIEBERT1*
PoznaÒ University of Medical Sciences, 1Department of Toxicology, Dojazd 30, 60-631 PoznaÒ, Poland2Department of Pharmacology, Rokietnicka 5A, 60-806 PoznaÒ, Poland
3Department of Pharmaceutical Biochemistry, åwiÍcickiego 4, 60-781 PoznaÒ, Poland
Abstract: The aim of the study was to investigate whether acamprosate, an agent attenuating relapse in humanalcoholics, might modulate antioxidant status in rats chronically administered ethanol. Male Wistar rats werepresented with a free choice paradigm between tap water and ethanol solution for three month to distinguishtwo groups of animals, preferring (PRF) and non-preferring (NPF) ethanol. Then, rats were administered acam-prosate, 500 mg/kg/day, per os, for 21 days. The hepatic level of enzymatically-driven lipid peroxidation wasenhanced by ethanol in PRF and NPF rats by 67 and 82%, respectively. Unstimulated microsomal lipid perox-idation was increased solely in NPF rats by 33%. Acamprosate caused 36% increase in stimulated lipid perox-idation only in NPF animals. The activities of all hepatic antioxidant enzymes examined: superoxide dismutase,catalase, glutathione peroxidase, glutathione reductase and glutathione S-transferase were decreased in ratstreated with ethanol by 30 to 64% as compared to controls, however, this decrease was more distinct in ethanolpreferring rats. Administration of acamprosate further reduced the activity of antioxidant enzymes only in NPFrats: catalase by 47%, glutathione peroxidase and glutathione S-transferase by 37% and glutathione reductaseby 33%. No effect of acamprosate on 4-nitrophenol hydroxylase, a marker of CYP2E1 activity, was observed.As acamprosate enhanced oxidative stress only in the rats non-preferring ethanol, it could be expected that theseadverse effects are not demonstrated in alcohol-dependent humans treated with acamprosate.
Keywords: ethanol, acamprosate, lipid peroxidation, antioxidant enzymes
439
* Corresponding author: e-mail: [email protected]; phone/fax: +48 618470721

440 MA£GORZATA EWERTOWSKA et al.
protective effects of taurine against hepatic steatosisand lipid peroxidation were demonstrated in ratsadministered ethanol (8). Taurine protects hepato-cytes against H2O2-induced damage (9) and inhibitstert-butylhydroperoxide-induced damage to lipids inrat liver slices (10). It has been found that taurineanalog, acamprosate, acts as antioxidant/free radicalscavenger in the brain of rats intoxicated with alco-hol (11).
The present study was undertaken to assesswhether acamprosate can also prevent oxidativedamage in the liver of alcoholized rats. We haveused a model similar to that applied in our previousexperiments, namely selectively bred alcohol-pre-ferring and non-preferring rats (12, 13). This modelhas been introduced to investigate the neurobehav-ioral backgrounds for alcoholism and to developefficacious therapeutic treatment (14).
The aim of the present study was to investigatewhether acamprosate might modulate antioxidantstatus i.e., antioxidant enzymes, microsomal lipidperoxidation and GSH level in the liver of ratschronically administered ethanol.
MATERIALS AND METHODS
Acamprosate (AC) (tabl. 333 mg) was pur-chased from Campral, Lipha S.A., France, whereasthe rest of chemicals were from Sigma Aldrich,Poland.
Experimental design
Thirty male Wistar rats (180 ± 10 g bodyweight) obtained from certified supplier (LaboratoryAnimals Breeding, BrwinÛw, Poland) were used inthe experiment. Rats were housed individually instandard plastic cages with stainless steel covers,kept in an animal facility on reversed 12 h light-darkcycle at 20 ± 1OC, controlled humidity (65%) andcirculation of air, fed Labofeed diet (ISO 9001) andtap water ad libitum.
The rats were presented with a free choice par-adigm between tap water and ethanol solution (12%w/w) for three month with two 2-week withdrawalperiods after the first and the second month. Thisprocedure ñ preference development ñ permitteddistinction of two groups of ethanol-drinking ani-mals: (i) rats with a mean intake of ethanol about 4.9g/kg b.w./day, preferring alcohol (PRF) and (ii) ratswith a mean intake of ethanol about 1.2 g/kgb.w./day, non-preferring alcohol (NPF).Additionally, for comparative purposes, throughoutthe whole period of chronic ethanol treatment, anethanol-naive control group of animals received
only tap water. Both types of ethanol-drinking ratswere divided into 2 subgroups, 6 rats each. In thesecond part of the experiment, one subgroup of PRFand one subgroup of NPF rats were treated withacamprosate (500 mg/kg b.w./day, p.o., suspendedin 1% methylcellulose solution) for 21 days. Twosubgroups of animals, PRF and NPF, were treatedp.o. with 1% methylcellulose solution alone for 21consecutive days.
During the last week of drug treatment, ethanoland total fluid (sum of water and ethanol solution)intakes were measured and expressed in g/kg/day.The body weight of animals was measured after thedrug treatment period.
At the end of the experiment, animals wereanesthesized with ketamine (160 mg/kg b.w.; i.p.)and sacrificed by decapitation. The livers wereremoved, perfused with ice-cold 1.15% KCl andhomogenized in buffered sucrose solution (Tris,pH 7.55). Microsomal and cytosol fractions wereprepared by differential centrifugation according tothe standard procedure. Protein concentration inthe fractions was determined using Folin-Ciocalteureagent (15). Liver homogenate for glutathionedetermination was prepared in phosphate buffer,pH 7.4.
The experiment was performed according tothe Local Animal Ethics Committee guidelines foranimal experimentation.
Biochemical assays
Microsomal lipid peroxidation in the liver wasassayed in two systems: uninduced andFe3+/ADP/NADPH-stimulated (enzymatic). Thelevel of lipid peroxidation was evaluated by measur-ing thiobarbituric acid reactive substances (TBARS)(16). The level of glutathione was evaluated by thedetermination of non-protein sulfhydryl groups con-centration in liver homogenate with Ellmanísreagent (17).
Antioxidant enzymes were assayed in the livercytosol. Glutathione peroxidase (GPx) activity wasdetermined according to Mohandas et al. (18).Hydrogen peroxide was used as a substrate. The dis-appearance of NADPH was a measure of theenzyme activity. Glutathione reductase (GR) wasassayed by measuring NADPH oxidation using oxi-dized glutathione as a substrate (18). Glutathione S-transferase (GST) activity measurement was basedon the spectrophotometric determination of 1-chloro-2,4-dinitrobenzene (CDNB) conjugateformed in a GSH coupled reaction (18). Superoxidedismutase (SOD) assay was based on its ability toinhibit spontaneous epinephrine oxidation (19).

Different response of antioxidant defense system to acamprostate in... 441
Catalase (CAT) activity was determined by moni-toring the rate of hydrogen peroxide decomposition(19). 4-Nitrophenol hydroxylase (PNPH) activitywas determined by the method described by Reinkeand Moyer (20). The method relies on the formationof 4-nitrocatechol which can be measured spec-trophotometrically.
Statistical analysis
The data were expressed as the means ± SD.One way analysis of variance (ANOVA) followedby the Student-Newman-Keuls test for multiplecomparisons were used.
RESULTS
Our study showed statistically significant dif-ferences between rats in voluntary EtOH intake(Table 1). Ethanol-preferring animals (PRF) con-sumed significantly greater amount of EtOH thanthe corresponding NPF rats. Multiple AC adminis-tration resulted in a decrease in EtOH intake in PRFrats. Simultaneously, no effect of AC on EtOHintake in NPF animals was found. The differences in
the total fluid intake and in the body weight betweenall groups were statistically insignificant.
Unstimulated lipid peroxidation was moderate-ly increased, by 33%, only in NPF rats. Enzym-atically-driven lipid peroxidation was enhanced byethanol in PRF and NPF rats by 67% and 82%,respectively, as compared to control rats. The drugtested did not affect this parameter in PRF rats.However, in NPF group acamprosate caused 36%increase in the level of stimulated lipid peroxidation(Table 2).
The concentration of hepatic GSH was notchanged in any of the groups (data not shown).
Results of antioxidant enzymes activities deter-mination are shown in Figure 1. To facilitate theevaluation of ethanol effect on enzymes tested, theresults obtained from ethanol drinking rats (PRF andNPF groups) were compared with those from con-trol group, and PRF rats were compared with NPFrats. Effect of acamprosate was assessed by compar-ison of ethanol alone drinking rats with rats exposedto ethanol and acamprosate together.
SOD activity was decreased in both groups ofrats administered ethanol alone, by 30% in PRF rats
Table 1. Effect of acamprosate on ethanol intake in ethanol preferring and ethanol non-preferring rats.
Treatment Body weight Total fluid intake Ethanol intake(g) (g/kg/day) (g/kg/day)
Control 525 ± 44 90.7 ± 4.9 -
NPF 516 ± 39 89.9 ± 8.8 1.2 ± 0.2B
NPF + AC 479 ± 34 102.1 ± 16.6 1.6 ± 1.2
PRF 476 ± 49 87.6 ± 15.2 4.9 ± 1.5AB
PRF + AC 466 ± 69 104.0 ± 37.4 3.4 ± 1.5A
NPF = ethanol-non-preferring rats; AC = acamprosate; PRF = ethanol-preferring rats. Results are the mean of6 rats ± SD. Results with the same superscripts are significantly different, A = p < 0.05, B = p < 0.01.
Table 2. Microsomal lipid peroxidation in the liver of rats administered ethanol and acamprosate.
Lipid peroxidation Lipid peroxidationTreatment unstimulated Fe3+/ADP/NADPH-stimulated
(nmol/TBARS/mg protein) (nmol/TBARS/mg protein)
Control 0.48 ± 0.08A 20.1 ± 3.2A
PRF 0.57 ± 0.14 33.5 ± 4.9A
PRF + AC 0.63 ± 0.02 40.2 ± 5.2
NPF 0.64 ± 0.08A 36.5 ± 2.9A,B
NPF + AC 0.68 ± 0.07 49.7 ± 4.4B
PRF = ethanol-preferring rats; NPF = ethanol-non-preferring rats; AC = acamprosate. Results are the mean of6 rats ± SD. A - PRF and NPF groups are compared with control group; B - groups fed alcohol alone (PRF andNPF) are compared with rats fed alcohol + acamprosate; values with the same superscripts are significantly dif-ferent, p < 0.01.

442 MA£GORZATA EWERTOWSKA et al.
and by 41% in NPF rats. Acamprosate did not affectthe SOD activity in ethanol drinking rats.
CAT activity was diminished by 30% in PRFrats and raised by 26% in NPF rats. Administrationof acamprosate had no effect on CAT activity inPRF groups, while in NPF animals acamprosatecaused the reduction of enzyme activity by 47% ascompared to that in rats receiving ethanol alone.
The activity of GPx was decreased in bothgroups of rats receiving ethanol, in PRF rats - by 64%,while in NPF rats the decrease was small and insignif-icant. Administration of acamprosate to PRF ratscaused a weak insignificant increase in this enzymeactivity as compared to that of the rats receiving
ethanol alone. Conversely, in rats with lower ethanolintake (NPF) a decrease in the GPx activity by 37%after acamprosate administration was observed.
The activity of glutathione reductase (GR) wasdecreased in PRF and NPF group by 51% and 30%,respectively, as compared to controls. No changes inGR activity in PRF rats administered acamprosatewere found. In NPF group the activity of the enzymewas lowered by 33% after acamprosate administra-tion.
The activity of GST in PRF group wasdecreased by 31% in comparison with controls. InNPF rats the decrease in GST activity was statisti-cally insignificant. Acamprosate administration to
Figure 1. Activity of antioxidant enzymes and p-nitrophenol hydroxylase in the liver of rats administered ethanol and acamprosatePRF = ethanol-preferring rats; NPF = ethanol-non-preferring rats; AC = acamprosate; SOD = superoxide dismutase; CAT = catalase; GPx= glutathione peroxidase; GR = glutathione reductase; GST = glutathione S-transferase; PNPH = p-nitrophenol hydroxylase. Results arethe mean of 6 rats ± SD. * PRF and NPF groups are compared with control group (without AC treatment); A) PRF group is compared withNPF and with PRF + AC groups; B) NPF group is compared with NPF+AC group. Values with the same superscripts are significantly dif-ferent, p < 0.01

Different response of antioxidant defense system to acamprostate in... 443
NPF rats caused further reduction of GST activityby 37%.
4-Nitrophenol hydroxylase activity was slight-ly increased, by 20%, only in PRF rats receivingethanol alone. Acamprosate did not affect thisenzyme activity in rats drinking ethanol (Figure 1).
DISCUSSION
Two groups of rats (PRF and NPF) differing involuntary ethanol intake were used in this study andthe observed differences in alcohol drinking were inline with our previous report (13). The ethanoldrinking pattern observed in the PRF group (> 4.0g/kg/day) was in agreement with the suggestion, thatsuch level of drinking may be considered as ìprefer-enceî (21). The dose of AC (500 mg/kg, p.o.) waschosen on the basis of the previous findings (12).AC treatment led to a decrease in EtOH intake inPRF rats, what was in accordance with antialcoholicactivity of acamprosate.
In the majority of chronic experiments withethanol feeding an increase in hepatic lipid peroxi-dation in rodents was observed (22, 23). However,numerous studies using ethanol-feeding modelsfailed to show the increase in lipid peroxidation (24,25). It was demonstrated that enhanced liver lipidperoxidation was not a constant feature after longterm ethanol consumption. It may be due to adaptiveprocesses that result in an enhanced antioxidantdefense (24).
In our experiment, enzymatically-drivenmicrosomal lipid peroxidation level in the liver ofrats fed ethanol alone was increased to a greaterextent than non-stimulated lipid peroxidation level.The assay using enzymatic induction of lipid perox-idation aimed at assessment of the resistance ofmicrosomes of rats fed ethanol to oxidative damage.Our results demonstrated that the liver microsomesof NPF rats exposed to the lower dose of ethanolwere less resistant because the level of lipid peroxi-dation was higher in this group of rats. Thus, it couldbe suggested that in ethanol-preferring rats someadaptive mechanisms counteracting ethanol-relatedincrease in ROS level started earlier or were moreefficient than in NPF rats.
There was a difference in the TBARS level inPRF and NPF rats administered acamprosate. Theincrease in the level of enzymatically-driven lipidperoxidation was observed only in livers of NPF ratsadministered acamprosate. It should be emphasizedthat this increase was consistent with the reducedactivity of hepatic antioxidant enzymes in the samegroup.
Many authors reported a decrease in GSH level inacute intoxication with ethanol (24). It is suggestedthat GSH depletion is caused by the enhancement ofoxidative process mediated by Fe2+ ions liberatedfrom ferritin and hemosiderin by ethanol. Similarlyto that referring to antioxidant enzymes, the data onliver GSH in animals chronically treated withethanol are inconsistent. In several experiments theincreased GSH concentration in livers of rats fedethanol was found (25, 26), some authors reportedthat GSH levels remain unchanged (27). The presentstudies confirmed the latter findings. According toOh et al. (25) these discrepancies in the GSH levelsmight have originated from differences in the strainof rodents used and the dose as well as duration ofethanol administration.
The results of this study show that the activityof hepatic antioxidant enzymes was decreased inrats treated with ethanol alone as compared to that incontrol group, except for catalase which activity wasraised in NPF rats. However, this decrease wasgreater in ethanol-preferring rats (differenceinsignificant only for SOD). This is consistent withthe free radical theory of ethanol toxicity - thegreater the dose of ethanol the greater generation ofROS and inactivation of antioxidant enzymes.
Generally, it was evidenced that an acuteethanol load elicits decreased efficiency of antioxi-dant enzymes (24). However, there are some contro-versies regarding the changes in antioxidantenzymes activity in animals chronically exposed toethanol. It is suggested that chronic intake of ethanolinduces CYP2E1 and triggers some adoptive mech-anisms counteracting the impairment of cell antiox-idant defense system including antioxidant enzymes(1). We have found that in PRF rats GPx activitywas markedly reduced as compared to that in controlgroup. In rats with lower intake of ethanol (NPF) thedecrease in GPx activity was not statistically signif-icant. In several experiments with a similar protocol(i.e., 4 week ethanol drinking, 6-16 g/kg b.w./day) adecrease in this enzyme activity was also found (25,26). In two other reports the activity of GPx was notchanged (28, 29). On the contrary, the increase inthis enzyme activity was observed in rats receivingethanol in a dose of 5.0 g/kg for 5 and 6 weeks (30).In our experiment GR activity was reduced to agreater extent in PRF than in NPF rats. Similarresponse of GR to ethanol was reported byMallikarjuna et al. (31). However, some authorsdemonstrated an increase in GR activity in rats fedethanol for several weeks (25, 26). It was hypothe-sized that the explanation might be the enhancementof gene expression mediated by antioxidant respon-

444 MA£GORZATA EWERTOWSKA et al.
sive element (ARE) as a response to free radicalsgenerated by ethanol (32). The decrease in GSTactivity in rats fed ethanol found in the presentexperiment was not confirmed by reports of otherauthors, who found that chronic treatment of ratswith ethanol resulted in the raise in GST activity(25, 29, 31). It was suggested that the induction ofGST by ethanol could be considered as an adaptiveresponse to ethanol-induced oxidative stress.Enhanced GST activity facilitates conjugation ofcytotoxic aldehydes, such as 4-hydroxynonenal,with GSH and reduction of lipid hydroperoxides,thus preventing lipid peroxidation (31).
The increase in CAT activity observed in ourexperiment in rats treated with the lower dose ofethanol, e.g., in NPF rats, was also reported by Oh etal. (25). It is consistent with the interpretation that inanimals chronically intoxicated with ethanol someadaptive mechanisms are triggered. However, inPRF rats the activity of CAT was lower than in con-trols, which could be due to CAT inactivation byfree radicals generated by the higher dose of ethanol.SOD activity was decreased in both PRF and NPFanimals which was confirmed by other authorsífindings (23, 29, 31). The changes in SOD, CAT andGPx in rats fed chronically ethanol reported in liter-ature appear highly contradictory (24). It could besuggested that the response of antioxidant enzymesto chronic ethanol feeding depends on both, the doseand the time of exposure.
In PRF rats acamprosate did not change theactivity of antioxidant enzymes. However, the activ-ity of the majority of enzymes in NPF group wasdecreased after acamprosate administration. SODwas the only enzyme whose activity was not affect-ed by acamprosate in any group of rats fed ethanol.In the available literature we have found one reportconcerning the effect of a acamprosate analogue,taurine, on hepatic antioxidant enzymes in ratsintoxicated with ethanol. Pushpakiran et al. (33)found about 50% decrease in the activity of SOD,CAT and GPx after ethanol administration in a doseof 6 g/kg/day and the recovery of all enzymes activ-ity to the basal level in rats fed simultaneously tau-rine for 28 days.
The results of the current study differ fromthose presented by Pushpakiran et al. (33) andBalkan et al. (34), however, direct comparison of thedata obtained in our experiment and those in thereports cited is not justified because we used taurineanalogue, acamprosate, not taurine itself, whichmight affect antioxidant enzymes in a different way.In our experiment acamprosate, a potential source oftaurine (7), caused a decrease in antioxidant
enzymes activity only in rats fed the lower dose ofethanol. The different response of antioxidantenzymes to acamprosate in PRF and NPF rats wasapparently associated with the dose of ethanol, how-ever, the mechanism of this relationship is not clear.It could be suggested that this difference might bedue to some adaptive mechanism evoked by the longterm exposure to ethanol. Probably this adaptiveprocess appeared earlier in PRF rats consuming thehigher dose of ethanol. Hence, hepatic antioxidantenzymes in this group were more resistant tochanges caused by acamprosate.
Chronic ethanol consumption leads to anincrease in the content of CYP2E1 in the liver andenhances its catalytic activity in the microsomalfraction. In numerous reports induction of CYP2E1in alcohol-fed animals has been shown to increasethe lipid peroxidation in hepatic microsomes (35). Itis known that CYP2E1 plays an important role in thegeneration of hydroxyethyl radical during chronicfeeding of ethanol and that ethanol-derived free rad-icals are major contributors to ethanol-inducedoxidative stress and liver injury (1). In the currentexperiment, the activity of 4-nitrophenol hydroxy-lase (PNPH), which is known to be CYP2E1dependent, was assayed (36). The activity of thisenzyme was slightly increased only in PRF ratsadministered ethanol alone. In the other groups nochanges in PNPH activity were observed. Similarresults were reported by Kerai et al. (22), who didnot observe any increase in PNPH activity in rats fedethanol in liquid diet for 28 days. As in the currentexperiment, the increase in PNPH activity wasnoticed only in PRF rats receiving higher dose ofethanol, it could be suggested that the dose ofethanol consumed by NPF rats was too low toinduce CYP2E1 activity. The lack of markedCYP2E1 induction observed in our experiment, isconsistent with low level of unstimulated lipid per-oxidation in the hepatic microsomes of rats chroni-cally fed ethanol. Acamprosate did not affect theactivity of CYP2E1 although it was shown thatacamprosate analogue, taurine, can inactivate thisisoform of cytochrome P450 (22).
Summing up, some consistency in the effectsof acamprosate on the parameters of alcohol-induced oxidative stress in the liver was observed,namely, an increase in the level of lipid peroxidationand a decrease in the activity of antioxidantenzymes. However, these effects were restricted torats non preferring alcohol. Hence, it could beexpected that, by analogy to our findings, theseadverse effects are not demonstrated in alcohol-dependent humans treated with acamprosate.

Different response of antioxidant defense system to acamprostate in... 445
REFERENCES
1. Albano E.: Proc. Nutr. Soc. 65, 278 (2006). 2. Cederbaum A.I., Lu Y, Wu D.: Arch.Toxicol.
83, 519 (2009). 3. Mason B.J., Lehert P.: Alcohol. Clin. Exp. Res.
36, 497 (2012). 4. Spanagel R., Vengeliene V.: Curr. Top. Behav.
Neurosci. 13, 583 (2013). 5. Palucha-Poniewiera A., Pilc A.: Prog.
Neuropsychopharmacol. Biol. Psychiatry 39,102 (2012).
6. Wu J-Y, Jin H., Schloss J.V., Faiman M.D.,Ningaraj N.S., Foos T., Chen W.: J. Biomed.Sci. 8, 96 (2001).
7. Olive M.F, Nannini M.A., Ou C.J., KoenigH.N., Hodge C.W.: Eur. J. Pharmacol. 437, 55(2002).
8. Schuller-Levis G.B., Park E.: FEMS Microbiol.Lett. 226, 195 (2003).
9. Schaffer S., Azuma J., Takahashi K., MozaffariM.: Adv. Exp. Med. Biol. 526, 307 (2003).
10. Oliveira M.W., Minotto J.B., de Oliveira M.R.,Zanotto-Filho A., Behr G.A, Rocha R.F,Moreira J.C., Klamt F.: Pharmacol. Rep. 62,185 (2010).
11. Dahchour A., Lallemand F., Ward R.J., DeWitte P.: Eur. J. Pharmacol. 520, 51 (2005).
12. PioruÒska-Miko≥ajczak A., PioruÒska-Stolzmann M., Miko≥ajczak P., Okulicz-Kozaryn I., KamiÒska E.:. J. Basic Clin.Physiol. Pharmacol. 15, 153 (2004).
13. Szulc M., Mikolajczak P.L., Geppert B.,Wachowiak R., Dyr W., Bobkiewicz-Kozlowska T.: Addict. Biol. 18, 689 (2013).
14. Rodd Z.A., Bell R.L., Kuc K.A., Murphy J.M.,Lumeng L., McBride W.J.: Addict. Biol. 14,152 (2009).
15. Lowry O.H., Rosenbrough N.J., Farr A.I.,Randal R.J.: J. Biol. Chem.193, 265 (1951).
16. Sanz M.J., Ferrandiz M.L., Cejudo M.,Terencio M.C., Gil B., Bustos G., Ubeda A. etal.: Xenobiotica 24, 689 (1994).
17. Sedlak J., Lindsay R.H.: Anal. Biochem. 25,192 (1968).
18. Mohandas J., Marshall J.J., Duggin G.G.,Horvath J.S., Tiller D.J.: Cancer Res. 44, 5086(1984).
19. Jodynis-Liebert J., Murias M., B≥oszyk E.:Planta Med. 66, 199 (2000).
20. Reinke L.A, Moyer M.J.: Drug Metab. Dispos.13, 548 (1985).
21. Sanchis-Segura C., Spanagel R.: Addict. Biol.11, 2 (2006).
22. Kerai M.D., Waterfield C.J., Kenyon S.H.,Asker D.S., Timbrell J.A.: Alcohol Alcohol. 34,529 (1999).
23. Uzun H., Simsek G., Aydin S., Unal E., KarterY., Yelmen N.K., Vehid S. aset al.: World J.Gastroenterol. 28, 600 (2005).
24. Nordmann R.: Alcohol Alcohol. 29, 513 (1994). 25. Oh S.I., Kim C.I., Chun H.J., Park S.C.: J. Nutr.
128, 758 (1998).26. Bailey S.M., Patel V.B., Young T.A., Asayama
K., Cunningham C.C.: Alcohol Clin. Exp. Res.25, 726 (2001).
27. Mitchell M.C., Raiford D.S., Mallat A.: in LiverPathology and Alcohol, Watson R.R. Ed.,Humana Press, Totowa, NJ 1991.
28. Kono H., Arteel G.E., Rusyn I., Sies H.,Thurman R.G.: Free Radic. Biol. Med. 30, 403(2001).
29. Rajasree C.R., Rajamohan T., Augusti K.T.:Indian J. Exp. Biol. 36, 60 (1998).
30. Lee J.S.: Clin. Chim. Acta 347, 121 (2004).31. Mallikarjuna K., Shanmugam K.R., Nishanth
K., Wu M.C., Hou C.W., Kuo C.H., ReddyK.S.: Alcohol 44, 523 (2010).
32. Rushmore T.H., Morton M.R., Pickett C.B.: J.Biol. Chem. 266, 11632 (1991).
33. Pushpakiran G., Mahalakshmi K., AnuradhaC.V.: Amino Acids 27, 91 (2004).
34. Balkan J., Dogru-Abbasoglu S., Kanbagli O.,Cevikbas U., Aykac-Toker G., Uysal M.: Hum.Exp. Toxicol. 20, 251 (2002).
35. Kessova I., Cederbaum A.I.: Curr. Mol. Med. 3,509 (2003).
36. Jayyosi Z., Knoble D., Muc M., Erick J.,Thomas P.E., Kelley M.: J. Pharmacol. Exp.Ther. 273, 1156 (1995).
Received: 22. 10. 2013


Acta Poloniae Pharmaceutica ñ Drug Research, Vol. 72 No. 3 pp. 447ñ453, 2015 ISSN 0001-6837Polish Pharmaceutical Society
Gentamicin is a widely used aminoglycosideantibiotic, however the clinical usefulness of thisdrug is limited due to its ototoxicity and nephrotox-icity. Nephrotoxicity is reversible, but destruction ofauditory system is irreversible, resulting in perma-nent hearing loss (1-5). Many studies have reportedthat gentamicin-induced ototoxicity is mediated byreactive oxygen species (ROS) (1, 6, 7).Overproduction of ROS triggers the signaling path-ways of cellular apoptosis, resulting in inner eardamage. Several agents that scavenge ROS or blocktheir formation (8-10) may be considered as protec-tive substances that reduce ROS-induced ototoxicity(11, 12).
Melanin is a unique pigmented biopolymersynthesized by melanocytes in human and variousanimals species. In humans, melanin is found in theskin, eyes, brain and ear (13, 14). Many investiga-tors have demonstrated the affinity of natural andsynthetic melanins for various drugs by in vivo andin vitro studies. It is generally accepted that the abil-ity of melanin-containing tissue to accumulate andretain these drugs is remarkable (15-17).
In view of the fact that melanin is an abundantconstituent of the inner ear, it seems reasonable to
suspect that the specificity of gentamicin ototoxicitymay result from its ability to form a complex withmelanin. This phenomenon may contribute to theaccumulation of the antibiotic in the inner ear andfacilitate a toxic effect on surrounding cells.
Previously, we have documented that gentam-icin, kanamycin, amikacin, neomycin, tobramycinand netilmicin (18-23) form stable complexes withmodel synthetic melanin in vitro. Our studies havealso demonstrated that amikacin (24), kanamycin(25), netilmicin (26) and streptomycin (27) suppressmelanin biosynthesis and cause depletion of antiox-idant defense system in human light pigmentedmelanocytes (HEMa-LP).
To our knowledge, the effect of gentamicin onbiochemical processes in melanocytes has neverbeen reported. Therefore, we investigated theantioxidant enzymes activity in gentamicin-treateddark pigmented melanocytes HEMn-DP.
EXPERIMENTAL
Chemicals
Amphotericin B was purchased from Sigma-Aldrich Inc. (USA). Gentamicin and neomycin sul-
IMPACT OF GENTAMICIN ON ANTIOXIDANT ENZYMES ACTIVITY IN HEMn-DP CELLS
DOROTA WRZEåNIOK*, ARTUR BEBEROK, MICHA£ OTR BA and EWA BUSZMAN
Department of Pharmaceutical Chemistry, Faculty of Pharmacy, Medical University of Silesia, JagielloÒska 4, PL-41-200 Sosnowiec, Poland
Abstract: Aminoglycoside antibiotics, including gentamicin, are widely used clinically in treatment of bacter-ial infections. Unfortunately, their side effects, especially nephrotoxicity and ototoxicity remain a problem. Itis known that aminoglycoside antibiotics bind well to melanin biopolymer, but the relation between their affin-ity to melanin and ototoxicity is not well documented. The aim of this work was to examine the impact of gen-tamicin on antioxidant enzymes activity in cultured dark pigmented normal human melanocytes (HEMn-DP).The WST-1 assay was used to detect gentamicin cytotoxic effect. The analyzed antibiotic induced concentra-tion-dependent loss in melanocytes viability. The value of EC50 was found to be 7.5 mM. Significant changesin the cellular antioxidant enzymes: SOD, CAT and GPx were stated in melanocytes exposed to gentamicin,what may indicate the depletion of antioxidant defense system. It is concluded, that the results obtained in vitromay explain a potential role of melanocytes and melanin in the causative mechanisms of aminoglycosides oto-toxic effects in vivo.
Keywords: gentamicin; melanocytes; superoxide dismutase; catalase, glutathione peroxidase
447
* Corresponding author: e-mail: [email protected]

448 DOROTA WRZEåNIOK et al.
fates were obtained from Amara, Poland. Penicillinwas acquired from Polfa Tarchomin (Poland).Growth medium M-254 and human melanocytesgrowth supplement-2 (HMGS-2) were obtainedfrom Cascade Biologics (UK). Trypsin/EDTA wasobtained from Cytogen (Poland). Cell ProliferationReagent WST-1 was purchased from Roche GmbH(Germany). The remaining chemicals were pro-duced by POCH S.A. (Poland).
Cell culture
The normal human dark pigmented melano-cytes (HEMn-DP, Cascade Biologics, UK) weregrown according to the manufacturerís instruction.The cells were cultured in M-254 medium supple-mented with HMGS-2, penicillin (100 U/mL),neomycin (10 µg/mL) and amphotericin B (0.25µg/mL) at 37OC in 5% CO2. All experiments wereperformed using cells in the passages 7-10.
Cell viability assay
The viability of melanocytes was evaluated bythe WST-1 (4-[3-(4-iodophenyl)-2-(4-nitrophenyl)-2H-5-tetrazolio]-1,3-benzene disulfonate) colori-metric assay. WST-1 is a water-soluble tetrazoliumsalt, the rate of WST-1 cleavage by mitochondrialdehydrogenases correlates with the number of viablecells. In brief, 5000 cells per well were placed in a96-well microplate in a supplemented M-254growth medium and incubated at 37OC and 5% CO2
for 48 h. Then, the medium was removed and cellswere treated with gentamicin solutions in a concen-tration range from 0.01 to 10 mM. After 21 h incu-bation, 10 µL of WST-1 were added to 100 µL ofculture medium in each well, and the incubation wascontinued for 3 h. The absorbance of the sampleswas measured at 440 nm with a reference wave-lenght of 650 nm, against the controls (the samecells but not treated with gentamicin) using amicroplate reader UVM 340 (Biogenet, Poland).The controls were normalized to 100% for eachassay and treatments were expressed as the percent-age of the controls.
Superoxide dismutase (SOD) assay
Superoxide dismutase (SOD) activity wasmeasured using an assay kit (Cayman, MI, USA)according to the manufacturerís instruction. This kitutilizes a tetrazolium salt for the detection of super-oxide radicals generated by xanthine oxidase andhypoxanthine. One unit of SOD was defined as theamount of enzyme needed to produce 50% dismuta-tion of superoxide radical. SOD activity wasexpressed in U/mg protein.
Catalase (CAT) assay
Catalase (CAT) activity was measured usingan assay kit (Cayman, MI, USA) according to themanufacturerís instruction. This kit utilizes the per-oxidatic function of CAT for determination ofenzyme activity. The method is based on the reac-tion of enzyme with methanol in the presence of anoptimal concentration of H2O2. The formaldehydeproduced is measured colorimetrically with 4-amino-3-hydrazino-5-mercapto-1,2,4-triazole(Purpald) as the chromogen. One unit of CAT wasdefined as the amount of enzyme that causes the for-mation of 1.0 nM of formaldehyde per minute at25OC. CAT activity was expressed in nM/min/mgprotein.
Glutathione peroxidase (GPx) assay
Glutathione peroxidase (GPx) activity wasmeasured using an assay kit (Cayman, MI, USA)according to the manufacturerís instruction. Themeasurement of GPx activity is based on the princi-ple of a coupled reaction with glutathione reductase(GR). The oxidized glutathione (GSSG) formed afterreduction of hydroperoxide by GPx is recycled to itsreduced state by GR in the presence of NADPH. Theoxidation of NADPH is accompanied by a decreasein absorbance at 340 nm. One unit of GPx wasdefined as the amount of enzyme that catalyzes theoxidation of 1 nM of NADPH per minute at 25OC.GPx activity was expressed in nM/min/mg protein.
Statistical analysis
In all experiments, the mean values of at leastthree separate experiments (n = 3) performed in trip-licate ± standard error of the mean (SEM) were cal-culated. The results were analyzed statistically usingGraphPad Prism 6.01 software. A value of p < 0.05(*) or p < 0.005 (**), obtained with a Studentís t-testby comparing the data with those for control (cellswithout gentamicin), was considered statisticallysignificant.
RESULTS AND DISCUSSION
Although aminoglycosides induce ototoxicityand nephrotoxicity, they are still important antibi-otics in current clinical practice and are widely used,especially in developing countries. Aminoglyco-sides exhibit broad-spectrum of antibacterial activi-ty against enterococcal, mycobacterial, and especial-ly multi-drug-resistant Gram-negative bacterialinfections (2, 3). Additionally, aminoglycosides arecommonly used in experimental ototoxicity models(28-30).

Impact of gentamicin on antioxidant enzymes activity in HEMn-DP cells 449
Figure 1. The effect of gentamicin on viability of melanocytes. Cells were treated with various concentrations of gentamicin (0.01-10 mM)and examined by WST-1 assay. Data are expressed as % of cell viability. The mean values ± SEM from three independent experiments (n= 3) performed in triplicate are presented. * p < 0.05 vs. the control samples; ** p < 0.005 vs. the control samples
Figure 2. The superoxide dismutase (SOD) activity in HEMn-DP cell after 24 h incubation with 0.075, 0.75 or 7.5 mM of gentamicin. Dataare the mean ± SEM of at least three independent experiments (n = 3) performed in triplicate. * p < 0.05 vs. the control samples; ** p <0.005 vs. the control samples

Aminoglycoside-induced ototoxicity progress-es from high to low frequencies with an increase indose or duration of treatment (2). It has been sug-gested that the relationship between the aminoglyco-side treatment and pigmented tissue damage isimportant to understand the ototoxic process. Manydrugs are known to be markedly accumulated andretained for a considerable time by melanin-contain-ing tissues and the retention of these compounds isproportional to degree of pigmentation. The abilityof melanins to bind different drugs and transitionmetal ions is probably of the greatest biologicalimportance (15).
The aim of the present study was to investigatethe effect of gentamicin on antioxidant defense sys-tem in HEMn-DP melanocytes. Human melanocytesdevelop from the neural crest, later becoming dis-tributed in the epidermis, hair bulbs of the skin, theuveal tract, the retinal pigment epithelium, the innerear, and the leptomeninges, which are collectivelyregarded as pigmented organs. In this study, wehave used the culture of normal human melanocytesas an in vitro experimental model system.
Melanocytes were treated with gentamicin in arange of concentrations from 0.01 mM to 10 mM for24 h (Fig. 1). The cell viability was determined bythe WST-1 test assay. At a relative low antibioticconcentration (0.01 mM) the loss in cell viabilitywas not statistically significant. Cells treated with0.1, 1.0, 2.5, 5.0, 7.5 and 10 mM of gentamicin for24 h lost about 7.3, 12.5, 23.0, 36.3, 50.6 and 61.1%in viability, respectively. The value of EC50 (i.e., theamount of a drug that produces loss in cell viabilityby 50%) was 7.5 mM.
The ototoxic effects of aminoglycosides havebeen linked to oxidative stress. Aminoglycosidessuch as gentamicin can react with iron to generateROS within the inner ear, with permanent damage tohair cells and neurons (2, 28, 31). Overproduction ofROS was suggested as an initial step in triggeringapoptotic pathways, resulting in cell death due toaminoglycoside-induced ototoxicity. Methods ofblocking ROS in the cochlea under in vitro or in vivoaminoglycoside exposure have been analyzed inmany studies (31, 32). Although the ototoxicitycaused by aminoglycosides is well documented, themolecular mechanism have not yet been preciselydetermined.
To explain the effect of the tested antibiotic onROS metabolism, the activities of the antioxidativeenzymes: SOD, CAT and GPx in melanocytes wereestimated.
SOD converts superoxide radical anion (O2ï -)
into hydrogen peroxide (H2O2). In the presence of
reduced transition metal ions (e.g., Fe2+ and Cu+),hydrogen peroxide can be converted into highlyreactive hydroxyl radical (OHï -). Alternatively,hydrogen peroxide may be converted into water bythe enzymes catalase or glutathione peroxidase (33).
Human melanocytes HEMn-DP were exposedto gentamicin in concentrations of 0.075, 0.75 or 7.5mM (EC50) for 24 h. The first enzyme measured wasthe SOD, i.e., the enzyme which catalyzes the for-mation of hydrogen peroxide from superoxide anion.Gentamicin enhanced the SOD activity in a concen-tration-dependent manner (Fig. 2). Treatment of cellswith 0.75 and 7.5 mM of gentamicin, increased theSOD activity by 37 and 66%, respectively, as com-pared with the controls. CAT and GPx work togeth-er to catalyze the breakdown of hydrogen peroxide,produced by SOD, to water. The intracellular CATactivity was significantly decreased by 24% for cellstreated with gentamicin in EC50 concentration (7.5mM). (Fig. 3). After gentamicin treatment in concen-trations of 0.075 and 0.75 mM, no significantchanges in cellular CAT activity were determined incomparison with the control cells (Fig. 3). The activ-ity of GPx increased by 26% for melanocytes treatedwith gentamicin in concentration of 0.75 mM anddecreased by 24% for cells treated with the antibiot-ic in concentration of 7.5 mM (EC50), in comparisonto the control cells (Fig. 4).
ROS are products of normal cells metabolismor xenobiotic exposure, and on concentrations, ROScan be beneficial or harmful to cells and tissues. Atphysiological low concentrations, ROS function asredox messengers in intracellular signaling and regu-lation while their excess induce oxidative modifica-tion of cellular macromolecules, inhibit protein func-tion and promote cell death (33). A protective effectagainst drug-induced toxicity was provided by broadspectrum ROS scavengers, such as low molecularweight thiol compounds, vitamin E and salicylate(34). Melanin is known to be a scavenger of free rad-icals and it has been suggested that it possessessuperoxide dismutase activity (35). Moreover, thisbiopolymer acts as a biochemical dustbin, moppingup potentially toxic agents (16). Such properties maybe important for protecting the pigment cells as wellas surrounding tissues from the natural toxins, xeno-biotics, oxygen and ROS (including free radicals)(36). The ability of melanin to bind gentamicin usedin low concentrations may prevent the antibiotic-induced toxic effects. The observed changes inantioxidant enzymes activity in cells exposed to thelowest gentamicin concentration (0.075 mM) con-firmed that the antioxidative response is sufficient tocompensate the increase in ROS formation. Under
450 DOROTA WRZEåNIOK et al.

Impact of gentamicin on antioxidant enzymes activity in HEMn-DP cells 451
Figure 3. The catalase (CAT) activity in HEMn-DP cell after 24 h incubation with 0.075, 0.75 or 7.5 mM of gentamicin. Data are the mean± SEM of at least three independent experiments (n = 3) performed in triplicate. * p < 0.05 vs. the control samples
Figure 4. The glutathione peroxidase (GPx) activity in HEMn-DP cell after 24 h incubation with 0.075, 0.75 or 7.5 mM of gentamicin.Data are the mean ± SEM of at least three independent experiments (n = 3) performed in triplicate. * p < 0.05 vs. the control samples; **p < 0.005 vs. the control samples

452 DOROTA WRZEåNIOK et al.
certain conditions, when ROS production isincreased more strongly and persistently, the antiox-idative response may not be sufficient to provide thecellular redox homeostasis (33). The use of gentam-icin in higher concentrations (0.75 and 7.5 mM)induced depletion of antioxidant defense system andtherefore it could be further concluded that the pro-longation of treatment with the high concentration ofgentamicin may augment the toxic effect of amino-glycosides on pigmented tissues of the inner ear.
Previously, we documented that other amino-glycoside antibiotics, namely kanamycin (25) andstreptomycin (27) caused depletion of antioxidantstatus of light pigmented normal human melano-cytes (HEMa-LP). The observed changes in antiox-idant enzymes activity were much more higher thanin HEMn-DP cells under gentamicin treatment. Theresults of our prior studies (25, 27) and thosedescribed in this work reveal that the large amountof melanin present in dark pigmented melanocytesmay prevent cells against the ROS induced toxiceffects. In addition, this phenomenon could be con-firmed by the lower gentamicin cytotoxicity (EC50 =7.5 mM) in regard to kanamycin (EC50 = 6.0 mM)and streptomycin (EC50 = 5.0 mM), what mayexplain a protective role of melanin in the mecha-nisms of aminoglycosides ototoxic effects.
CONCLUSION
In summary, the present work provides the firstin vitro study of the mechanisms involved in gen-tamicin-induced toxic effects on pigmented tissuesusing HEMn-DP melanocytes. Based on theobtained results concerning the effect of gentamicinon antioxidant enzymes activity in melanocytes, thepotential role of melanin and melanocytes in themechanisms of aminoglycosides toxic effects direct-ed to pigmented tissues was determined, especiallyduring high-dose and/or long-term therapy.
Acknowledgment
This work was supported by the MedicalUniversity of Silesia (Grant No. KNW-1-094/K/3/0).
REFERENCES
1. Forge A., Schacht J.: Audiol. Neurootol. 5, 3(2000).
2. Buszman E., Wrzeúniok D., Grzegorczyk A.,MatusiÒski B., MolÍda K.: Sci. Rev. Pharm. 4,2 (2007).
3. Durante-Mangoni E., Grammatikos A., Utili R.,Falagas M.F.: Int. J. Antimicrob. Agents 33,201 (2009).
4. Harris T., Peer S., Fagan J.J.: J. Laryngol. Otol.126, 548 (2012).
5. Xie J., Talaska A.E., Schacht J.: Hear. Res. 281,28 (2011).
6. Audo I., Warchol M.E.: Curr. Opin. Neurol. 25,76 (2012).
7. Lopez-Gonzalez M.A., Lucas M., Delgado F.,Diaz P.: Neurochem. Int. 33, 55 (1998).
8. Wu W.J., Sha S.H., Schacht J.: Audiol.Neurootol. 7, 171 (2002).
9. McFadden S.L., Ding D., Salvemini D., Salvi R.J.: Toxicol. Appl. Pharmacol. 186, 46(2003).
10. Sha S.H., Schacht J.: Hear. Res. 142, 34 (2000).11. Wang A.M., Sha S.H., Lesniak W., Schacht J.:
Antimicrob. Agents Chemother. 47, 1836(2003).
12. Bodmer D., Brors D., Pak K., Gloddek B., RyanA.: Hear. Res. 172, 81 (2002).
13. Ylikoski J., Xing-Qun L., Virkkala J., PirvolaU.: Hear. Res. 166, 33 (2002).
14. OtrÍba M., Rok J., Buszman E., Wrzeúniok D.:Postepy Hig. Med. Dosw. 66, 33 (2012).
15. Plonka P.M., Passeron T., Brenner M., TobinD.J., Shibahara S., Thomas A., Slominski A. etal.: Exp. Dermatol. 18, 799 (2009).
16. Larsson B.S.: Pigment Cell Res. 6, 127 (1993).17. díIschia M., Napolitano A., Pezzella A.,
Meredith P., Sarna T.: Angew. Chem. Int. Ed.48, 3914 (2009).
18. Wrzeúniok D., Buszman E., Karna E., NawratP., Pa≥ka J.: Eur. J. Pharmacol. 446, 7 (2002).
19. Buszman E., Wrzeúniok D., Trzcionka J.:Pharmazie 62, 210 (2007).
20. Wrzeúniok D., Buszman E., Lakota D.: ActaPol. Pharm. Drug Res. 68, 493 (2011).
21. Wrzeúniok D., Buszman E., Grzegorczyk M.,Grzegorczyk A. Hryniewicz T.: Acta Pol.Pharm. Drug Res. 69, 41 (2012).
22. Wrzeúniok D., Buszman E., Karna E., Pa≥ka J.:Pharmazie 60, 439 (2005).
23. Buszman E., Wrzeúniok D., Suraøynski A.,Pa≥ka J., MolÍda K.: Bioorg. Med. Chem. 14,8155 (2006).
24. Wrzeúniok D., Beberok A., OtrÍba M.,Buszman E.: Toxicol. In Vitro 27, 1102 (2013).
25. Wrzeúniok D., OtrÍba M., Beberok A., Busz-man E.: J. Cell. Biochem. 114, 2746 (2013).
26. Wrzeúniok D., Beberok A., OtrÍba M.,Buszman E.: Acta Pol. Pharm. Drug Res. 70,803 (2013).

Impact of gentamicin on antioxidant enzymes activity in HEMn-DP cells 453
27. Wrzeúniok D., Beberok A., OtrÍba M.,Buszman E.: Mol. Cell. Biochem. 383, 77(2013).
28. Choung Y.H., Taura A., Pak K., Choi S.J.,Masuda M., Ryan A.F.: Neuroscience 161, 214(2009).
29. Choung Y.H., Kim S.W., Tian C., Min J.Y., LeeH.K., Park S.N., Lee J.B., Park K.:Laryngoscope 121, 1294 (2011).
30. Xiong M., He Q., Lai H., Wang J.: ActaOtolaryngol. 131, 914 (2011).
31. Rybak L.P., Ramkumar V.: Kidney Int. 72, 931(2007).
32. Rizzi M.D., Hirose K.: Curr. Opin. Otolaryngol.Head Neck Surg. 15, 352 (2007).
33. Drˆge W.: Physiol Rev. 82, 47 (2002).34. Poirrier A.L., Pincemail J., Van Den
Ackerveken P., Lefebvre P.P., Malgrange B.:Curr. Med. Chem. 17, 3591 (2010).
35. Hoogduijn M.J., Cemeli E., Ross K., AndersonD., Thody A.J., Wood J.M.: Exp. Cell. Res.294, 60 (2004).
36. Rozanowska M., Sarna T., Land E.J., TruscottG.: Free Radic. Biol. Med.: 26, 518 (1999).
Received: 14. 03. 2014


Acta Poloniae Pharmaceutica ñ Drug Research, Vol. 72 No. 3 pp. 455ñ464, 2015 ISSN 0001-6837Polish Pharmaceutical Society
Uterine leiomyomas (fibroids) are the mostcommon benign tumors in women of reproductiveage (1). Surgery, in the form of myomectomy orhysterectomy, is currently the primary treatment foruterine fibroids and so these tumors cause hysterec-tomy in the 77% of cases (2). The initiating factorsthat lead to the development of fibroids are not wellunderstood.
However, some evidence supports that ovariansteroids, such as estrogen and progesterone, are theimportant factors for leiomyoma growth (3). Overthe past decade, analogs of GnRH (GonadotropinReleasing Hormone) have been commonly used inthe conservative treatment of fibroids. Continuousapplication of GnRH analogs reliably andreversibly suppress the gonadal function causingthe condition similar to hypogonadotropic hypogo-nadism and affect the reduction of the myoma size.Some literature data indicate that their effect isachieved by causing apoptosis in myomas (3), but
the role of apoptosis in uterine myomas is stillunknown. Our preliminary clinical study showedthat local application of low dose of methotrexate(MTX) on the eighth day of menstrual cycle, duringthree consecutive cycles, reduced the volume ofuterine myomas (20-30%), decreased menstrualbleeding, improved hematological status of patientsand most importantly reduced incidence of hys-terectomy and other invasive methods. Thisapproach did not cause menopause and its sideeffects and was able to diminish the use of hormon-al substitution therapy (4). MTX is used in the treat-ment of numerous lymphomas, osteosarcomas,breast, ovarian, lung and urinary bladder cancers(5-10). Furthermore, it serves as an immunosup-pressive agent in the treatment of rheumatoid arthri-tis (11) and for hiperproliferative epidermal celldisorders (psoriasis) (12) that are often associatedwith the increased angiogenesis (13). MTX com-petitively inhibits dihydrofolate reductase (DHFR)
METHOTREXATE AND MYOTREXATE INDUCE APOPTOSIS IN HUMAN MYOMA FIBROBLASTS (T hES CELL LINE) VIA
MITOCHONDRIAL PATHWAY
TATJANA KASTRATOVI∆1*, SLOBODAN ARSENIJEVI∆ 1, ZORAN MATOVI∆2, MARINA MITROVI∆ 3, IVANA NIKOLI∆3, ZORAN MILOSAVLJEVI∆ 4, ZORAN PROTRKA1,
MARIJA äORAK1 and JANKO –URI∆1
1 Department of Obstetrics and Gynaecology, Faculty of Medical Sciences, 2 Faculty of Chemistry, 3 Department of Biochemistry, Faculty of Medical Sciences, 4 Department of Histology,
Faculty of Medical Sciences, University of Kragujevac, Kragujevac, Serbia
Abstract: Uterine leiomyomas (fibroids) are the most common benign tumors in women of reproductive age.Although the local application of low doses of methotrexate (MTX) is used as an effective treatment of themyomas, myotrexate could be a promising new drug. This study investigated the cytotoxic and apoptotic effectsof both MTX and myotrexate in human fibroblasts derived from the uterine fibroids (T hES cell line). Themyotrexate adduct is an aqueous solution of MTX and L-arginine. Cells were treated with a graded concentra-tions of both MTX and myothrexate (0.1-16 µM) for 24 h. The cytotoxicity was assayed by MTT test, apopto-sis was evaluated by Annexin V-FITC assay and their possible role in apoptosis was determined by immnu-flourescence. Both MTX and myotrexate induced apoptosis in T hES cells in a dose dependent manner (p <0.001). Myotrexate significantly increased the percentage of AnnexinV positive cells, BAX/Bcl-2 ratio and sub-sequent caspase-3 activation compared to the MTX treated cells (p < 0.05). Both MTX or myotrexate treatmentshowed a diffuse staining of cytochrome c indicating its release from mitochondria to the cytosol, suggestingthat their mechanisms of action most likely involves the mitochondrial apoptotic pathway.
Keywords: MTX, myotrexate, apoptosis, Bcl-2 family, cytochrome c
455
* Corresponding author: e-mail: [email protected]; phone: +38163615594

456 TATJANA KASTRATOVI∆ et al.
and it prevents folic acidís participation in the denovo synthesis of nucleic acids and proteins (14),especially during the S-phase of the cell cycle.Thus, it achieves the greatest toxic effect on rapid-ly dividing cells. The exact mechanism of action ofMTX is not fully understood. Recently, Spurlock etal. have shown that MTX did not induce apoptosisdirectly, but through indirect cells stimulation thatled to the cells induced sensitivity to apoptosis, pos-sibly through mitochondrial or death receptor path-way through Jun N-terminal kinase (JNK)-depend-ent mechanisms (15). Moreover, Savion et al.showed that MTX was directly involvolved withBAX regulation, a molecule of Bcl-2 family group(16), and key regulators of the apoptotic processes(17). One of MTXís shortcomings is the ability oftumor cells to continually develop resistance to it,possibly due to the amplification of the DHFRgene, or gene mutation that impairs MTXís bind-ing. Using computer programs (Discovery StudioVisualizer and Hyperchem), we identified that bybinding to DHFR, MTX is placed into a largehydrophobic niche (18, 19) where is predominantlysurrounded by amino acid residues of L-arginine ina 1 : 5 ratio with which produces hydrogen and Wander Waals links which are most responsible for sec-ondary and tertiary structure and hence activity ofthe substrate.
Based on this observation, in our laboratory wesynthesized the adduct myotrexate as an aqueoussolution of MTX and L-arginine. Combining theresults of NMR spectroscopy, quantum mechanicalmodelling and molecular dynamics simulations wegot 3D look of solvating myotrexate. The finalresults show that the drug compounds in solution areunaltered on a molecular level, but held each otherwith strong inter- and intra-molecular hydrogenbonding. Hydrogen bonds are particularly pro-nounced between the deprotonated carboxyl groupsof MTX and guanidine group the three of the fivemolecules of L-arginine.
Here, we investigated the effect of myotrexateon the basic cell component of myomas fibroblasts.Additionally, knowing that Bcl-2 group moleculesplay a role in the MTX apoptotic signalling path-way, we invstigated if that the same would apply tomyotrexate.
Myotrexate has been classified as A 61 K31/195 (WIPO Patent Application WO/2003/022260) by the International Patent Office.
The aim of this study was to investigate andcompare both the cytotoxic and apoptotic effects ofmethotrexate and myotrexate and their potential rolein apoptosis.
MATERIALS AND METHODS
Cell line
T hES cell line (T hES; ATCCÆ: CRL-4003tm)human fibroblasts derived from uterine fibroids,immortalized with human telomerase reversibletranscriptase. Cells were grown in DMEM(Dulbeccoís modified Eagleís medium, SigmaAldrich, Germany) enriched with L-glutamine (2mM/L, Invitrogen, USA), 1% nonessential aminoacids (Sigma Aldrich, Germany), 1% ITS (insulintransferin supplement, BD Biosciences, USA), peni-cillin-streptomycin (1 mM/L, Sigma Aldrich,Germany) and 10% FBS (fetal bovine serum, SigmaAldrich, Germany). Cells were incubated at 37OC,atmosphere of 5% CO2.
Pharmaceutical composition (myotrexate) wasprepared by dissolving 10 g of L- arginine in a 600cm3 of distilled water and the vessel was softlyshaked until the L-arginine was completely dis-solved. After that, 5 g of methotrexate was addedand the vessel was softly shaked until all methotrex-ate was dissolved, and following that another 385cm3 of distilled water was added and the obtainedsolution was autoclaved. An aqueous solution ofmethotrexate and L-arginine prepared in this mannercontains methotrexate and L-arginine in molar ratioof 1 : 5.
Cells were treated with pre-sterilized meth-otrexate (Sigma Aldrich, Germany) and/or myotrex-ate in concentrations of 16, 12, 8, 4, 2, 1, 0.1 and0.01 µM and L-arginine (Sigma Aldrich, Germany)in concentrations 80, 60, 40, 20, 10, 5 and 0.5 µM.
Cytotoxic effect of these compounds wasexamined by MTT cytotoxicity assay.
Briefly, in a 96-well microtiter plate, cellswere resuspended in a medium (1.8 ◊ 104 cells/200µL medium), treated with tested substances (MTX,myotrexate and L-arginine in appropriate concen-trations for 24 h), and incubated with MTT solu-tion (5 mg/mL MTT dissolved in PBS) for 4 h(37OC, 5% CO2). After centrifugation (1000 rpm, 5min) and removal of supernatant, cells were resus-pended in 200 µL DMSO (Sigma Chemical, St.Louis, MO) per well and incubated for 30 min on ashaker, at room temperature, and away from light.The optical density (OD) was measured at wave-length 595 nm (multimode microplate detector,Zenuth 3100). The percentage of unviable cellswas calculated by the formula: Cytotoxicity (%) =[1 - (experimental group (OD)) / (control group(OD)) ◊ 100].
Investigation of apoptotic effect of these sub-stances was performed by Annexin V-FITC assay.

Methotrexate and myotrexate induce apoptosis in human myoma fibroblasts... 457
Briefly, cells (5 ◊ 105 cells/800 µL) were treatedwith tested substances (MTX, myotrexate and L-arginine in appropriate concentrations for 24 h),then washed two times with cold PBS, and resus-pended in a binding buffer. Annexin V-FITC (5 µL)and propidium iodide (5 µL) was added in 100 µL ofthat solution. After 15 min, away from light, and atroom temperature, 400 µL of binding buffer wasadded and cells were analyzed on FACS (Becton-Dickinson, FACS-Calibur, Montainview, CA, USA)within one hour.
The mechanism of apoptotic effect was deter-mined by fluorescence microscopy.
Briefly, cells (2 ◊ 104 cells/400 µL) were seed-ed on sterile cover slips and incubated for 24 h(37OC, 5% CO2) to achieve confluence of 80%. Cellswere then treated with tested substances (MTX andmyotrexate) for 24 h, washed in PBS, and fixed in4% paraformaldehyde, 23 mM NaH2PO4 and 77 mMNa2HPO4 (pH 7.3). Cells were permeabilized for 10min with 0.2% Triton-X/PBS, incubated for 30 minin a blocking buffer (10% FCS, 0.1% Triton X-
100/PBS), washed and then incubated for one hourwith different anti-rabbit primary antibodies: Bax(N20, sc-493, Santa Cruz Biotech. Inc.), Bcl-2(DC21, sc-783, Santa Cruz Biotech. Inc.), caspase-3(9661, Cell Signalling Technology, USA) and anti-mouse antibodies: cytochrome-c (G7421, Promega,USA), β-actin (A5316, Sigma Aldrich, Germany).After the incubation, cells were washed three timesin PBS, incubated and stained with fluorescent sec-ondary antibodies Alexa 488 (11001, Invitrogen,USA) and Cy3 (C7604, Sigma Aldrich, Germany)for one hour away from light at room temperature.Fluorescence of the cells was observed at 100◊ and400◊ magnifications on Olympus (model BX51).ImageJ was used for image analysis.
Studentís t-test or nonparametric Mann-Whitneyís sum rank tests were used for statisticalanalysis. Results were analyzed by commercialsoftware package SPSS (version 13) and are pre-sented as the mean ± SD (standard deviation) andstatistical significance was determined by the levelof p < 0.05.
Figure 1. Cytotoxic and apoptotic effects of MTX, myotrexate and L-arginine on fibroblasts. Cells were treated with various concentra-tions of MTX, myotrexate and L-arginine for 24 h at 37∞C. A) represent cytotoxic effect of those agents and B) comparison of cytotoxiceffect of MTX and myotrexate. Cell viability was determined by MTT assay. Results are presented as the mean values of five independ-ent experiments for each concentration ± standard deviation (SD). Statistical analysis of the presented relationships was performed withStudentís t test for independent samples and statistical significance was determined by the level of p < 0.05. C) represent apoptotic effectof those agents and D) comparison of apoptotic effect of MTX and myotrexate. FACS analysis was performed with Annexin V-FITC andpropidium-iodide. Results are presented as the mean values of three independent experiments for each concentration ± SD. Statisticalanalysis of the presented relationships was performed with Studentís t test, the Mann-Whitneyís test for independent samples, and statis-tical significance was determined by the level of p < 0.05
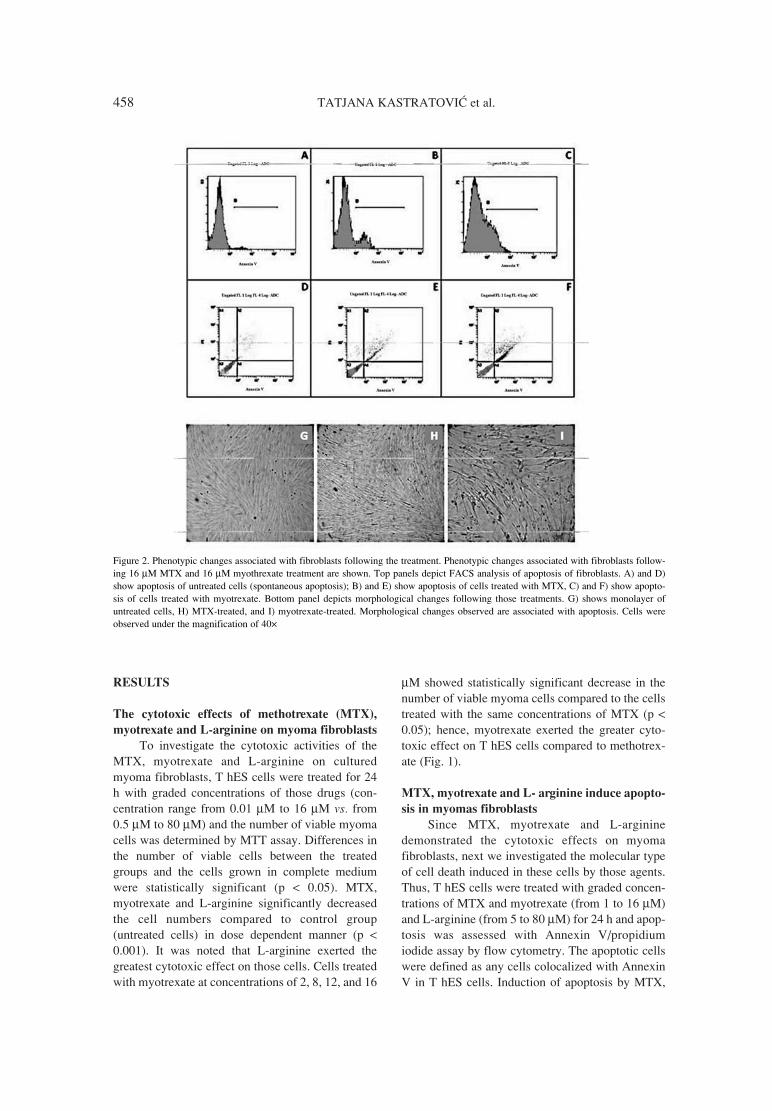
458 TATJANA KASTRATOVI∆ et al.
RESULTS
The cytotoxic effects of methotrexate (MTX),
myotrexate and L-arginine on myoma fibroblasts
To investigate the cytotoxic activities of theMTX, myotrexate and L-arginine on culturedmyoma fibroblasts, T hES cells were treated for 24h with graded concentrations of those drugs (con-centration range from 0.01 µM to 16 µM vs. from0.5 µM to 80 µM) and the number of viable myomacells was determined by MTT assay. Differences inthe number of viable cells between the treatedgroups and the cells grown in complete mediumwere statistically significant (p < 0.05). MTX,myotrexate and L-arginine significantly decreasedthe cell numbers compared to control group(untreated cells) in dose dependent manner (p <0.001). It was noted that L-arginine exerted thegreatest cytotoxic effect on those cells. Cells treatedwith myotrexate at concentrations of 2, 8, 12, and 16
µM showed statistically significant decrease in thenumber of viable myoma cells compared to the cellstreated with the same concentrations of MTX (p <0.05); hence, myotrexate exerted the greater cyto-toxic effect on T hES cells compared to methotrex-ate (Fig. 1).
MTX, myotrexate and L- arginine induce apopto-
sis in myomas fibroblasts
Since MTX, myotrexate and L-argininedemonstrated the cytotoxic effects on myomafibroblasts, next we investigated the molecular typeof cell death induced in these cells by those agents.Thus, T hES cells were treated with graded concen-trations of MTX and myotrexate (from 1 to 16 µM)and L-arginine (from 5 to 80 µM) for 24 h and apop-tosis was assessed with Annexin V/propidiumiodide assay by flow cytometry. The apoptotic cellswere defined as any cells colocalized with AnnexinV in T hES cells. Induction of apoptosis by MTX,
Figure 2. Phenotypic changes associated with fibroblasts following the treatment. Phenotypic changes associated with fibroblasts follow-ing 16 µM MTX and 16 µM myothrexate treatment are shown. Top panels depict FACS analysis of apoptosis of fibroblasts. A) and D)show apoptosis of untreated cells (spontaneous apoptosis); B) and E) show apoptosis of cells treated with MTX, C) and F) show apopto-sis of cells treated with myotrexate. Bottom panel depicts morphological changes following those treatments. G) shows monolayer ofuntreated cells, H) MTX-treated, and I) myotrexate-treated. Morphological changes observed are associated with apoptosis. Cells wereobserved under the magnification of 40◊

Methotrexate and myotrexate induce apoptosis in human myoma fibroblasts... 459
myotrexate and L-arginine in T hES cells was statis-tically higher than in the control cells in a dosedependent manner (p < 0.001). L-arginine had thegreatest effect of apoptosis on this cell line.Furthermore, myotrexate treatment of T hES cells,particularly at the concentrations of 8, 12 and 16µM, significantly increased the percentage ofAnnexinV positive cells compared to the MTXtreated cells (Fig. 1).
Moreover, by examining the morphology of ThES cells treated with both agents at the concentra-tion of 16 µM, we observed typical apoptotic mor-phological changes, such as cell rounding, conden-sation and detachment of cells compared to control.Here, myotrexate displayed stronger apoptotic mor-phological changes in the cells compared to MTXtreated cells (Fig. 2). These results suggest myotrex-ate to be more efficient apoptotic agent on the cul-tured myoma fibroblasts than MTX.
MTX and myotrexate induce the decrease of Bcl-
2 expression
Cell survival is enabled by anti-apoptotic pro-tein Bcl-2 through the inhibition of apoptosis. The
effects of different cytotoxic stimuli that induceapoptosis in the cells also lead to the reduction of theexpression level of Bcl-2. Thus, we examined theeffects of MTX and myotrexate stimulation of ThES cells on the total expression levels of endoge-nous Bcl-2 by immunoflourescence. T hES cellstreated either with 8 µM concentration of MTX ormyotrexate demonstrated significantly reducedexpression of Bcl-2 compared to untreated cells by19.54 ± 11.57% in MTX and by 71.35 ± 8.7% inmyotrexate (p < 0.05; Fig. 3).
MTX and myotrexate treatment of myoma
fibroblasts induces the activation of pro-apoptot-
ic protein BAX
Apoptosis is regulated by Bcl-2 family memberssuch as proapoptotic BAX that upon induction ofapoptosis is activated and recruited into the outerbilayer of mitochondria causing its permeabilization.To investigate the possible role of BAX in our study,we tested the effect of MTX and myotrexate on BAXactivation and its recruitment into the mitochondrialouter membrane by immunoflourescence. Our resultsdemonstrated that both MTX and myotrexate at 8 µM
Figure 3. Total cell expression of anti-apoptotic protein Bcl-2 in the fibroblasts following MTX and myotrexate treatment. Cells were treat-ed with 8 µM MTX and 8 µM myotrexate for 24 h and assayed for Bcl-2 expression. Top panel depicts immunofluorescent staining in A)untreated cells, B) cells treated with MTX, and C) cells treated with myotrexate. Cells were observed under 100◊ magnification. Bottompanel (D) represents quantified immunostaining results on the same number of cells in three different visual fields with ImageJ software.Cells treated with myotrexate demonstrated significantly reduced expression of Bcl-2 compared to MTX treated cells. Statistical analysiswas performed with Studentís t test for independent samples and statistical significance was determined by the level of p < 0.05

460 TATJANA KASTRATOVI∆ et al.
concentration induced the activation and incorporationof pro-apoptotic BAX into mitochondria of T hEScells compared to the control cells. Whereas the per-cent of cells expressing active BAX in cells treatedwith either MTX or myotrexate was 19.5 ± 3.4% and32.42 ± 4.45%, respectively, the percent in untreatedcells was only 3.19 ± 1.1% (Fig. 4). Therefore, bothagents induced the activation of BAX; however, thiseffect was significantly greater in myotrexate treatedcells compared to MTX treated cells.
MTX and myotrexate induce the release of
cytochrome c from mitochondria
Following the stimulation of T hES cells witheither MTX or myotrexate, activation and recruit-ment of BAX occurred into the mitochondrial outermembrane. Therefore, we further examined theeffect of these drugs on the cytochrome c releasefrom mitochondria. This was examined byimmunoflourescence in both untreated cells andcells treated with MTX and myotrexate at the con-centration of 8 µM (Fig. 5). T hES cells stimulated
with either MTX or myotrexate showed diffusestaining of cytochrome c indicative of its releasefrom mitochondria to the cytosol. However, theuntreated T hES cells demonstrated a punctuatestaining typical for the the cytochrome c localized inthe intermembranous space of mitochondria.
MTX and myotrexate induce caspase-3 depend-
ent apoptosis
To investigate the apoptotic mechanisms in thecells treated with MTX and myothrexate, next weanalyzed the activation of caspase-3 by immuno-flourescence. Our results demonstrated that bothMTX and myothrexate treatment of the cells causedmorphological changes in the cytoskeleton offibroblasts as well as the activation of caspase-3,whereas the same changes were not detected in theuntreated cells (Fig. 6). Percentage of cells express-ing the active caspase-3 when stimulated with eitherMTX or myotrexate was 5.72 ± 2.05%, and 37.36 ±5.3%, respectively (p = 0.008). The cell activation ofcaspase-3 in untreated samples was 3.41 ± 1.13%, a
Figure 4. Activation of pro-apoptotic protein BAX following MTX and myotrexate treatment. ThES cells were treated with 8 µMmethotrexate and 8 µM myotrexate for 24 h. Cells were then immunostained and signal quantified. Top panel represents immunostainingof active form of pro-apoptotic BAX so that in A) are untreated cells, B) cells treated with MTX, and in C) cells treated with myotrexate.Cells were observed under magnification 100◊. Bottom panel (D) represents quantified immunostaining results on the same number ofcells in three different visual fields with ImageJ software. The activation of BAX was significantly greater in myotrexate-treated cells com-pared to MTX-treated cells. Statistical analysis was performed with Studentís t test for independent samples and statistical significance wasdetermined by the level of p < 0.05

Methotrexate and myotrexate induce apoptosis in human myoma fibroblasts... 461
consequence of spontaneous apoptosis. Caspase-3activation in cells treated with myotrexate was sta-tistically significantly higher (p < 0.05) when com-pared to the MTX treated cells.
DISCUSSION
Although methotrexate (MTX) is commonlyused in the treatment of numerous neoplastic andhiperproliferative disorders, our preliminary clinicalstudy showed that local application of low dose ofthis antimetabolite agent could be used for myomastreatment as well. However, growing resistance toMTX has been reported for various cancers (20, 21).To overcome the resistance we sought to investigatethe possibility of improving MTXís effects. Usingcomputer programs, we identified that MTX bindsL-arginine through hydrogen and Wan der Waalsforces in a 1 : 5 ratio inside a hydrophobic pocket ofthe DHFR enzyme. Thus, we synthesized myotrex-ate, an aqueous solution of MTX and L-arginine andtested its efficacy on T hES cell line.
Analyzing the percentage of apoptotic cells, itwas observed that the adduct myotrexate exhibitedgreater apoptotic effect compared to MTX and thestatistical significance of this difference rises withincreasing concentrations of these substances.Spectrophotometric analysis of myotrexate showedthat MTX created strong hydrogen bonding withthree molecules of L-arginine leading to its confor-mational change. As the concentration increases,differences in their apoptotic effect also increase, somight be assumed that two molecules of L-arginine,which are free and the number of which increaseswith rising concentration, contribute to the betterapoptotic effect of myotrexate. MTX, which is inclinical use, is actually the sodium salt of MTX. Byreplacing NaOH with L-arginine to make it soluble(because MTX is insoluble in water) we have con-tributed to the improvement of its efficiency.
L-arginine is a basic semi-essential amino acidserving as a precursor for many important moleculesfor cellular physiology (proline, glutamate, creatine,nitric oxide (NO) and polyamines), making L-argi-nine one of the most versatile amino acids (22). Theplasma concentration of L-arginine is about 200µmol/L in humans (23). In some cell types, L-argi-nine, NO, and polyamines stimulate cell prolifera-tion and reduce apoptosis (24) and inhibit cell pro-liferation and promote apoptosis in others (25, 26).Chen et al. have shown that supraphysiological con-centration of L-arginine led to apoptosis of humanchoriocarcinoma cells (cell line JAR) (27) but thisstudy have shown that L-arginine added to the cul-ture media at subphysiological concentrationsinduced apoptosis in T hES cells as well.
Methotrexateís immunosuppressive, anti-inflammative, anti-proliferative and cytotoxiceffects are consequences of apoptosis (28, 29).
Some studies have shown that MTX couldinduce apoptosis through Fas / Fas- ligand system(30) and the others demonstrated that it activatedapoptosis via the mitochondrial pathway (27).Morphological changes, including a notabledecrease in cell size, increase in granularity - phe-nomena that may implicate apoptotic death, cellshrinkage and cytoplasmic condensation as well asAnnexin V test showed that apoptotic process wasnotable in T hES cells after treatment by MTX andmyotrexate. In cells treated with tested substances,the release of cytochrome c from intermembra-nous space of mitochondria into the cytosol wasobserved, suggesting that apoptosis in these cellswas realized through, so called, internal, mito-chondrial pathway. After release into the cyto-plasm, cytochrome c forms a complex with anenzyme called apoptosis activating factor-1 (Apaf-1) with consumption of energy (ATP). The com-plex binds to caspase-9, forming the apoptosome -oligomeric complex of cytochrome c/Apaf-1/cas-
Figure 5. Release of cytochrome c from intramembranous space of mitochondria into the cytosol of fibroblasts. Cells treated with 8 µMMTX and 8 µM myotrexate for 24 h were analyzed for cytochrome c release by immunofluorescence. A) shows untreated cells, B) cellstreated with MTX, and C) cells treated with myotrexate. Cells were observed under the 100◊ magnification
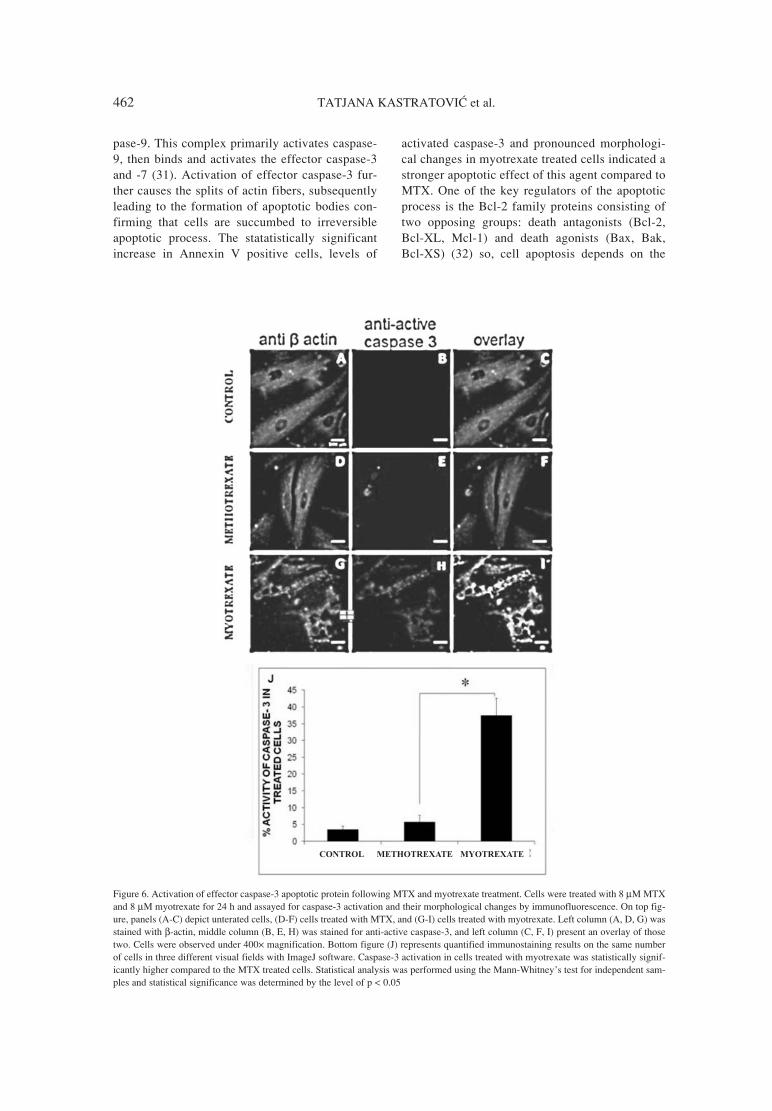
462 TATJANA KASTRATOVI∆ et al.
pase-9. This complex primarily activates caspase-9, then binds and activates the effector caspase-3and -7 (31). Activation of effector caspase-3 fur-ther causes the splits of actin fibers, subsequentlyleading to the formation of apoptotic bodies con-firming that cells are succumbed to irreversibleapoptotic process. The statatistically significantincrease in Annexin V positive cells, levels of
activated caspase-3 and pronounced morphologi-cal changes in myotrexate treated cells indicated astronger apoptotic effect of this agent compared toMTX. One of the key regulators of the apoptoticprocess is the Bcl-2 family proteins consisting oftwo opposing groups: death antagonists (Bcl-2,Bcl-XL, Mcl-1) and death agonists (Bax, Bak,Bcl-XS) (32) so, cell apoptosis depends on the
Figure 6. Activation of effector caspase-3 apoptotic protein following MTX and myotrexate treatment. Cells were treated with 8 µM MTXand 8 µM myotrexate for 24 h and assayed for caspase-3 activation and their morphological changes by immunofluorescence. On top fig-ure, panels (A-C) depict unterated cells, (D-F) cells treated with MTX, and (G-I) cells treated with myotrexate. Left column (A, D, G) wasstained with β-actin, middle column (B, E, H) was stained for anti-active caspase-3, and left column (C, F, I) present an overlay of thosetwo. Cells were observed under 400◊ magnification. Bottom figure (J) represents quantified immunostaining results on the same numberof cells in three different visual fields with ImageJ software. Caspase-3 activation in cells treated with myotrexate was statistically signif-icantly higher compared to the MTX treated cells. Statistical analysis was performed using the Mann-Whitneyís test for independent sam-ples and statistical significance was determined by the level of p < 0.05

Methotrexate and myotrexate induce apoptosis in human myoma fibroblasts... 463
ratio of these protein groups (33). However, theexact mechanism of apoptosis regulation by Bcl-2family is still unknown and being intensivelyinvestigated (34, 35). The fibroid cells havedemonstrated increased Bcl-2 protein expressioncompared to the normal myometrial cells of thesame uterus and the enlarged expression of Bcl-2protein in leiomyoma cells is the molecular basefor the increased proliferation of myocytes similarto the smooth-muscle cells of myometrium (36).
The influence of sex hormones (estrogen andprogesterone) on the expression of pro- and anti-apoptotic proteins is well known (37-39). The treat-ment of myomas with GnRH was based on the indi-rect influence on these proteins and predominantlyby reducing the level of sex hormones (40).However, in this in vitro investigation we presenteda completely different approach to the treatment offibroids by direct action on Bcl-2 protein family.Our results showed that MTX and myotrexatereduced the level of anti-apoptotic (Bcl-2),increased the level of pro-apoptotic proteins and theincrease in BAX/Bcl-2 ratio led cells to apoptosis.Myotrexate was more efficient with the increase ofthis ratio; therefore, it could be a better potentialapoptotic agent. So far, there are no known literaturedata on the effects of MTX and myotrexate on ThES cell line.
CONCLUSION
The findings presented in this study indicatedthat MTX and myotrexate exhibited cytotoxic effecton myoma fibroblasts (T hES cell line) and thiseffect was achieved by the induction of apoptosisvia caspase dependent mitochondrial pathway anddue to an imbalance in the expression of pro-apop-totic and anti-apoptotic proteins.
Myotrexate exhibited greater apoptotic effectcompared to MTX partially due to conformationalchanges and partially due to the effect of free mole-cules of L-arginine.
This study opens up the possibility for further invivo investigations that could indicate that myotrex-ate might be a potential new drug not only for theconservative treatment of myomas, but also as a pos-sibility of applying this drug in the treatment of theother disorders where MTX is commonly used.
REFRENCES
1. Cotran R.S., Kumar V., Robbins S.L.: Robbinspathologic basis of diseases. 5th edn., WBSaunders Co., Philadelphia 1994.
2. Sankaran S., Manyonda I.: Best Pract. Res.Clin. Obstet. Gynaecol. 22, 655 (2008).
3. Cook J.D., Walker C.L.: Semin. Reprod. Med.22, 105 (2004).
4. éivanoviÊ A., ArsenijeviÊ S., JankoviÊ S.,JevremoviÊ M.: Arch. Oncol. 6, 95 (1998).
5. Mantadakis E., Smith A.K., Hyman L., WinickN.J., Kamen B.A.: J. Pediatr. Hematol. Oncol.24, 636 (2002).
6. Batchelor T., Carson K., OíNeill A., GrossmanS.A., Alavi J., New P., Hochberg F., Priet R.: J.Clin. Oncol. 21, 1044 (2003).
7. Gorlick R., Jaffe N.: J. Clin. Oncol. 26, 4365(2008).
8. Ejlertsen B., Mouridsen H.T., Jensen M.B.:Acta Oncol. 47, 662 (2008).
9. Scheusan R., Curescu S., Stanculeanu D.,Curescu P.: J. Clin. Oncol. 27, 16574 (2009).
10. Yan K.H., Lee L.M., Hsieh M.C., Yan M.D.,Yao C..J, Chang P.Y., Chen T.L. et al.: Oncol.Rep. 30, 1497 (2013).
11. Hoekstra M., Haagsma C., Neef C., Proost J.,Knuif A., van de Laar M.: J. Rheumatol. 31, 645(2004).
12. Tamilselvi E., Haripriya D., Hemamalini M.,Pushpa G., Swapna S.: Scand. J. Immunol. 78,545 (2013).
13. Park S.K., Kim H.I., Yang Y.I., Hur D.Y.: Am.J. Rhinol. Allergy. 25, 129 (2011).
14. Galbiatti A.L., Castro R., Caldas H.C.,Padovani J.A. Jr., Pavarino E.C., Goloni-Bertollo E.M.: Tumour Biol. 34, 3765 (2013).
15. Spurlock C.F. 3rd, Aune Z.T., Tossberg J.T.,Collins P.L., Aune J.P., Huston J.W., CrookeP.S. 3rd, et al.: Arthritis Rheum. 63, 2606(2011).
16. Savion S., Shtelman E., Orenstein H.,Torchinsky A., Fein A., Toder V.: Toxicol. InVitro 23, 1062 (2009).
17. Annis M.G., Yethon J.A., Leber B., AndrewsD.W.: Biochem. Biophys. Acta 1644, 115(2004).
18. Samanta A., Datta A.K., Datta S.: Bioinfor-mation 19, 10 (2014).
19. Lamb K.M., G-Dayanandan N., Wright D.L.,Anderson A.C.: Biochemistry 52, 7318 (2013).
20. de Almagro M.C., Selga E., Thibaut R., PorteC., NoÈ V., Ciudad C.J.: Biochem. Pharmacol.81, 60 (2011).
21. Morales C., GarcÌa M.J., Ribas M., MirÛ R.,MuÒoz M., Caldas C., Peinado MA.: Mol.Cancer Ther. 8, 424 (2009).
22. Jezova D., Makatsori A., Smriga M., MorinagaY., Duncko R.: Nutr. Neurosci. 8, 155 (2005).

464 TATJANA KASTRATOVI∆ et al.
23. Cameron I.T., Campbell S.: Hum. Reprod.Update 4, 565 (1998).
24. Nitta T., Igarashi K., Yamamoto N.: Exp. CellRes. 276, 120 (2002).
25. Shen S.F Hua C.H.: J. Matern. Fetal NeonatalMed. 24, 822 (2011).
26. Melisi D., Rosso F., Curcio A., Tortora C.,Nieddu M., Marino G., Lettieri M. et al.: J. Cell.Physiol. 221, 440 (2009).
27. Chen Y.X., Lv W.G., Chen H.Z., Ye F., Xie X.:Eur. J. Obstret. Gynecol. Reprod. Biol. 143, 107(2009).
28. Florou D., Patsis C., Ardavanis A., Scorilas A.:Cancer Biol. Ther. 14, 587 (2013).
29. Nakazawa F., Matsuno H., Yudoh K.,Katayama R., Sawai T., Uzuki M., Kimura T.:J. Rheumatol. 28, 1800 (2001).
30. Floros K.V., Maroulio T., Andreas S.: Biol.Chem. 387, 1629 (2006).
31. Schinzel A., Kaufmann T., Borner C.: Biochim.Biophys. Acta 1644, 95 (2004).
32. Aouacheria A., Cibiel A., Guillemin Y., GilletG., Lalle P.: Recent Pat. DNA Gene Seq. 1, 43(2007).
33. Adams J.M, Cory S.: Trends Biochem. Sci. 26,61 (2001).
34. Terrones O., Etxebarria A., Landajuela A.,Landeta O., Antonsson B., Basa�ez G.: J. Biol.Chem. 283, 7790 (2008).
35. Willis S.N., Fletcher J.I., Kaufmann T., vanDelft M.F., Chen L., Czabotar P.E., Ierino H. etal.: Science. 315, 856 (2007).
36. Uyar Y., Nese N., Baytur Y., Yildis H., IncebozU., Kandiloglu A.R.: J. Gynecol. Obstet. 19,249 (2009).
37. Gao Z., Matsuo H., Wang Y., Nakago S.,Maruo T.: J. Clin. Endocrinol. Metab. 86, 5593(2001).
38. Maruo T., Matsuo H., Shimomura Y., KurachiO., Gao Z., Nakago S., Yamada T. et al.:Steroids 68, 817 (2003).
39. William H., Parker M.D.: Fertil. Steril. 87, 725(2007).
40. Chegini N., Ma C., Tang X.M., Williams R.S.:Mol. Hum. Reprod. 8, 1071 (2002).
Received: 5. 05. 2014
Acta Poloniae Pharmaceutica ñ Drug Research, Vol. 72 No. 3 pp. 465ñ474, 2015 ISSN 0001-6837Polish Pharmaceutical Society
1,4-Dihydropyridine is a six membered aro-matic ring containing N atom at the 1st position andis saturated at the 1st and 4th positions. Literature sur-vey exhibits that the pyridine derivatives possesswide spectrum of biological activities such as thecalcium channel antagonistic effect (1), antianginal(2-4), antitumor (5), anti-inflammatory (6, 7), anti-tubercular (8), analgesic activity (9), antithrombotic(10, 11), vasolidation (12), anticonvalsant (13) andstress protective (14). Also, various pyridine deriva-tives have been synthesized as insecticides (15, 16),antifungal (17), antibacterial (18), herbicidal (19)and antimicrobial agents compared to oxytetracy-cline (20). Many studies have been devoted to thephotochemistry and photooxidation of symmetricaldihydropyridine drugs such as lacidipine (21),nifedipine (22-26) and unsymmetrical dihydropyri-dine such as amlodipine (27), nisoldipine (28), nil-vadipine (29) and nimodipine (30). As regards bio-logical implications, thiosemicarbazide complexeshave been intensively investigated for their antiviral,anticancer, antitumor, antimicrobial, antiamoebicand anti-inflammatory activities (31-41). This infor-
mation encouraged us to synthesize new pyridinecompounds to evaluate their antimicrobial activityagainst different strains of Gram positive, Gramnegative bacteria and fungi.
EXPERIMENTAL
Chemistry
All melting points are uncorrected and wererecorded in open glass capillary tubes using anElectrothermal IA 9100 digital melting point appa-ratus. Elemental microanalyses were carried out atMicro Analytical Unit, Central Service Lab (CSL),National Research Centre (NRS), using VarioElementar apparatus and were found within ± 0.4%of the theoretical values. IR spectra were recordedon Jasco FT/IR, Fourier Transform, infrared spec-trometer (Japan), while 1H- and 13C-NMR spectrawere obtained using JEOL EX-270 and 500 usingavailable solvent and TMS as internal standard.Mass spectra were recorded on Finnigan Mat SSQ-7000 mass spectrometer at CSL, NRS. TLC on sili-ca gel-60, F254, aluminum sheets were also used.
DRUG SYNTHESIS
SYNTHESIS AND IN VITRO ANTIMICROBIAL ACTIVITY OF NOVEL SERIESOF 3,5-DIACETYLPYRIDINE COMPOUNDS
EMAN M.H. MORSY1, EMAN R. KOTB1*, HANAN A. SOLIMAN1, HAYAM H. SAYYED1
and NAYIRA A.M. ABDELWAHED2
1Photochemistry Department, 2Chemistry of Natural and Microbial Products Department, National Research Centre, Dokki-12311, Cairo, Egypt
Abstract: Bis diacetylpyridine derivative (1) was prepared and reacted with different halo-compounds, name-ly: epichlorohydrine and dichloroethyl ethyl ether to give 2a,b, respectively, and reacted with morpholine andpiperidine to afford Mannich products 3a,b, successively. Compound 4 was synthesized by reaction of 1 withpotassium thiocyanate. Reaction of 4 with 4-chlorobenzaldehyde, glucose and phthalic or maleic anhydridesproduced 5, 6 and 7a,b. Compound 1 reacted with 4-chlorobenzaldehyde to give bisanylmethylene derivative8. Also some new compounds 9-11 were prepared from the reaction of compound 8 with nucleophiles, name-ly: hydrazine hydrate, thiosemicarbazide and hydroxylamine via Michael condensation reaction. On the otherhand, compound 8 was reacted with cyclohexanone and cyclopentanone to give 12a,b. The structures of newlysynthesized products have been deduced on the basis of elemental analysis and spectral data. Some synthesizedcompounds were screened for their antimicrobial evaluation. Among the assayed compounds, derivatives 3b
and 12a showed the highest antimicrobial activities.
Keywords: bis diacetylpyridines, aminothiazoles, pyrazoles, oxazoles, antimicrobial evaluation
465
* Corresponding author: e-mail: [email protected]

466 EMAN M.H. MORSY et al.
4-(4-Chloranylphenyl)-2,6-dimethyl-3,5-bis-(1-
oxidanylideneethyl)-1,4-dihydropyridine (1) A mixture of 4-chlorobenzaldehyde (0.01
mol), acetylacetone (0.02 mol) and 1 g ammoniumacetate in 30 mL H2O was refluxed for 6 h. The solidformed was filtered off and crystallized from diethylether.
Yield: 60%; m.p. 180-182OC. IR (KBr, cm-1):3153 (NH), 1700, 1703 (2C=O). 1H NMR (DMSO-d6, δ, ppm): 1.70 (s, 6H, 2CH3), 2.30 (s, 6H, 2CH3),4.43 (s, 1H, pyridine-H), 7.00 (d, J = 9 Hz, 2H, Ar-H), 7.15 (d, J = 9 Hz, 2H, Ar-H), 9.71 (s, 1H, NH,D2O exchangeable). 13C NMR (DMSO-d6, δ, ppm):8.70 (2CH3), 23.10 (2CH3), 26.40 (CH), 109.60(2C=C), 128.30-135.80 (6 Ar-C), 140.40 (2C=C),196.50 (2C=O). MS m/z (%): 303 (100), 192 (70).Analysis: calcd. for C17H18ClNO2 (303.78): C,67.21, H, 5.97, N, 4.61%; found: C, 67.00; H, 5.93,N, 4.65%.
General procedure for synthesis of compounds 2
A mixture of compound 1 (3.03 g, 0.01 mol)and sodium hydroxide (0.80 g, 0.02 mol) in ethanol(20 mL) was stirred at 60OC for 3 h. The reactionmixture was cooled and then epichlorohydrine ordichloroethyl ethyl ether (0.02 mol) was added. Thereaction mixture was heated under reflux for 3 h,then evaporated. The residue was washed with H2O,filtered off and recrystallized from ethanol.
4-(4-Chloranylphenyl)-2.6-dimethyl-3,5-bis(1-
oxidanylideneethyl)-1-(oxiran-2-yl-methyl)-1,4-
dihydropyridine (2a)Yield: 52%; m.p. 162-164OC. IR (KBr, cm-1):
1698, 1703 (2C=O). 1H NMR (DMSO-d6, δ, ppm):1.71 (s, 6H, 2CH3, acetyl), 2.30 (s, 6H, 2CH3,acetyl), 2.51 (m, 2H, CH2, oxiranyl ring), 2.77 (m,1H, CH-oxiranyl ring), 2.80 (m, 2H, CH2), 4.43 (s,1H, pyridine-H), 7.00 (d, J = 9 Hz, 2H, Ar-H), 7.15(d, J = 9 Hz, 2H, Ar-H). 13C NMR (DMSO-d6, δ,ppm): 16.50 (2CH3), 23.00 (2CH3), 26.70 (CH-pyro-line), 44.61 (CH2-oxiranyl ring), 50.30 (CH, oxi-ranyl ring), 52.11 (CH2), 109.60 (2C=C), 128.80-135.80 (6 Ar-C), 140.40 (2C=C), 196.50 (2C=O).MS m/z (%): 359 (50), 303 (100). Analysis: calcd.for C20H22ClNO3 (359.84): C, 66.75, H, 6.16, N,3.89%; found: C, 66.80, H, 6.20, N, 4.10%.
1-(2-[(2-Chloranylethyl)oxidanyl]ethyl)-4-(4-
chloranylphenyl)-2,6-dimethyl-3,5-bis(1-oxi-
danylideneethyl)-1,4-dihydropyridine (2b)
Yield: 51%; m.p. 126-128OC. IR (KBr, cm-1):1690, 1700 (2C=O). 1H NMR (DMSO-d6, δ, ppm):1.71 (s, 6H, 2CH3), 2.30 (s, 6H, 2CH3), 2.8 (t, 2H,
CH2N), 3.51 (t, 2H, CH2O), 3.55 (t, 2H, CH2Cl),3.61 (t, 2H, CH2O), 4.43 (s, 1H, pyridine-H), 7.00(d, J = 9 Hz, 2H, Ar-H), 7.15 (d, J = 9 Hz, 2H, Ar-H), 9.71 (s, 1H, NH, D2O exchangeable). MS m/z(%): 410 (70), 303 (100). Analysis: calcd. forC21H25Cl2NO3 (410.33): C, 61.47, H, 6.14, N,3.41%; found: C, 61.44, H, 6.14, N, 3.50%.
General procedure for synthesis of compounds 3
Formaldehyde (1 mL, 40%) was added to com-pound 1 (3.03 g, 0.01 mol) in dry ethanol (30 mL),and the reaction mixture was heated for 5 min,cooled, then secondary amine, morphine or piperi-dine (0.02 mol) was added and the reaction mixturewas stirred overnight at room temp. The formedsolid was filtered off, dried and recrystallized frommethanol.
4-[(4-Chloranylphenyl)-2,6-dimethyl-3,5-bis(1-
oxidanylideneethyl)pyridine-1-(4H)-yl)]-morpho-
line (3a)
Yield: 67%; m.p. 173-175OC. IR (KBr, cm-1):1698, 1703 (2C=O). 1H NMR (DMSO-d6, δ, ppm):1.66 (s, 6H, 2CH3), 2.30 (s, 6H, 2CH3), 2.37 (t, 4H,morpholine-H), 3.67 (t, 4H, morpholine-H), 3.95 (s,2H, N-CH2-N), 4.43 (s, 1H, pyridine-H), 7.00 (d, J =9 Hz 2H, Ar-H), 7.15 (d, J = 9 Hz, 2H, Ar-H). 13CNMR (DMSO-d6, δ, ppm): 16.20 (2CH3), 23.00(2CH3), 26.70 (CH-pyridine), 54.70 (2C-morpho-line), 69.70 (CH2), 71.5 (2C-morpholine), 109.00(2C=C), 128.80-135.60 (6 Ar-C), 140.40 (2C=C),196.50 (2C=O). MS m/z (%): 402 (70), 303 (100).Analysis: calcd. for C22H27ClN2O2 (402.91): C,65.58, H, 6.15, N, 6.92%; found: C, 65.66, H, 6.75,N, 7.00%.
4-[(4-Chloranylphenyl)-2,6-dimethyl-3,5-bis(1-
oxidanylideneethyl)-1-(piperidin-1-yl-methyl)]-
1,4-dihydropyridine (3b)
Yield: 65%; m.p. 121-123OC. IR (KBr, cm-1):1698, 1703 (2C=O). 1H NMR (DMSO-d6, δ, ppm):1.17-1.49 (m, 6H, piperidine-H), 1.70 (s, 6H, 2CH3),2.30 (s, 6H, 2CH3), 2.20-2.45 (m, 4H, piperidine-H),3.72 (s, 2H, N-CH2-N), 4.43 (s, 1H, pyridine-H),7.00 (d, J = 9 Hz 2H, Ar-H), 7.15 (d, J = 9 Hz 2H,Ar-H). MS m/z (%): 400 (80), 303 (100). Analysis:calcd. for C23H29ClN2O2 (400.92): C, 68.90, H, 7.29,N, 6.99%; found: C, 68.00, H, 7.32, N, 6.98%.
3,5-Bis(2-amino-1,3-thiazol-5-yl)-4-(4-chloran-
ylphenyl)-2,6-dimethyl-1,4-dihydropyridine (4)
A mixture of compound 1 (3.03 g, 0.01 mol)and potassium thiocyanate (1.94 g, 0.02 mol) wasrefluxed in glacial acetic acid containing 4 mL

Synthesis and in vitro antimicrobial activity of novel series of... 467
bromine for 3 h. The reaction mixture was cooledand poured into ice water. The formed solid was fil-tered off, dried and crystallized from dioxane.
Yield: 60%; m.p. 202-204OC. IR (KBr, cm-1):3350 (NH2), 3240 (NH). 1H NMR (DMSO-d6, δ,ppm): 1.71 (s, 6H, 2CH3), 4.00 (s, 4H, 2NH2, D2Oexchangeable), 4.43 (s, 1H, pyridine-H), 7.00 (d, J =9 Hz, 2H, Ar-H), 7.15 (d, J = 9 Hz, 2H, Ar-H), 7.50(s, 2H, thiazole-H), 9.8 (s, 1H, NH, D2O exchange-able). 13C NMR (DMSO-d6, δ, ppm): 18.80 (2CH3),43.40 (CH-pyridine), 107.80 (2C=C), 108.00(2C=C), 128.80-130.60 (6Ar-C), 130.90 (2C=C),139.00 (2CH), 172.00 (2C=N). MS m/z (%): 415(85), 304 (100). Analysis: calcd. for C19H18ClN5S2
(415.96): C, 54.86, H, 4.36, N, 16.84%; found: C,54.80, H, 4.40, N, 16.80%.
3,5-Bis(4-chloranylbenzylidene)amino-1,3-thia-
zole-5-yl)-4-(4-chloranylphenyl)-2,6-dimethyl-
1,4-dihydropyridine (5)
A mixture of compound 4 (4.15 g, 0.01 mol)and 4-chlorobenzaldehyde (5.60 g, 0.02 mol) inacetic anhydride (30 mL) was refluxed for 11 h. Thesolution was cooled, poured into cold water and theprecipitate formed was crystallized from glacialacetic acid.
Yield: 45%; m.p. 255-257OC. IR (KBr, cm-1):3230 (NH). 1H NMR (DMSO-d6, δ, ppm): 1.70 (s,6H, 2CH3), 4.43 (s, 1H, pyridine-H), 6.92-7.61 (m,12H, Ar-H), 8.00 (s, 2H, thiazole-H), 8.10 (s, 2H,Schiffís base), 9.8 (s, 1H, NH, D2O exchangeable).Analysis: calcd. for C33H24Cl3N5S2 (660.64): C,63.74, H, 4.25, N, 10.93%; found: C, 64.00, H, 4.50,N, 10.90%.
3,5-Bis[(2,3,4,5,6-pentahydroxyhexylidine)
amino-1,3-thiazol-5-yl]-4-(4-chloranylphenyl)-
2,6-dimethyl-1,4-dihydropyridine (6)
Compound 4 (4.15 g, 0.01 mol) and glucose(7.20 g, 0.2 mol) in ethanol (30 mL) containing 1mL glacial acetic acid was heated with continuousstirring at 80OC for 6 h. The formed precipitate wasfiltered off, dried and recrystallized from ethanol.
Yield: 63%; m.p. 188-190OC. IR (KBr, cm-1):3451-3219 (br, OH and NH), 1590 (CH=N). 1HNMR (DMSO-d6, δ, ppm): 1.71 (s, 6H, 2CH3),3.32-3.92 (m, 12H glucose-H), 4.43 (s, 1H, pyri-dine-H), 4.19-5.00 (m, 10 H, OH, D2O exchange-able), 6.94 (d, J = 9 Hz, 2H, Ar-H), 7.00 (d, J = 9Hz, 2H, Ar-H), 7.40 (2H, CH=N), 8.00 (s, 2H, thi-azole-H), 9.80 (1H, NH, D2O exchangeable).Analysis: calcd. for C31H38ClN5O10S2 (739.82): C,53.39, H, 5.74; N, 9.73%; found: C, 53.52; H, 5.70,N, 9.70%.
General procedure for synthesis of compounds 7
To a solution of compound 4 (4.15 g, 0.01 mol)in acetic acid, phthalic anhydride or maleic anhy-dride (0.02 mol) was added. The mixture wasrefluxed for 8 h, then poured into ice water. Theformed solid was filtered off, washed with water andrecrystallized from dioxane.
4-(4-Chloranylphenyl)-3,5-bis[2-(2,7-dioxidanyli-
dene-2,7-dihydroindolin-1-yl)-1,3-thiazol-5-yl]-
2,6-dimethyl-1,4-dihydropyridine (7a)Yield: 55%; m.p. > 300OC. IR (KBr, cm-1):
3235 (NH), 1698 (2C=O), 1702 (2C=O). 1H NMR(DMSO-d6, δ, ppm): 1.70 (s, 6H, 2CH3), 4.43 (s, 1H,pyridine-H), 7.10-8.20 (m, 12H, Ar-H + 2H, pyra-zole-H), 9.82 (s, 1H, NH, D2O exchangeable). MSm/z (%): 676 (27). Analysis: calcd. forC35H22ClN5O4S2 (676.17): C, 62.17, H, 3.28, N,10.36%. found: C, 62.20, H, 3.30, N, 10.30%.
4-(4-Chloranylphenyl)-3,5-bis[2-(2,5-dioxidanyli-
dene-2,5-dihydro-1H-pyrol-1-yl)-1,3-thiazol-5-
yl]-2,6-dimethyl-1,4-dihydropyridine (7b)
Yield: 69%; m.p. 285-287OC. IR (KBr, cm-1):3230 (NH), 1701 (2C=O), 1705 (2C=O). 1H NMR(DMSO-d6, δ, ppm): 1.70 (s, 6H, 2CH3), 4.43 (s,1H, pyridine-H), 6.12 (d, J =5.2 Hz, 2H, vinylic-H), 6.32 (d, J = 5.2 Hz, 2H, vinylic-H), 7.00 (d, J= 9 Hz 2H, Ar-H), 7.15 (d, J = 9 Hz, 2H, Ar-H),7.50 (s, 2H, thiazole-H), 9.80 (s, 1H, NH, D2Oexchangeable). MS m/z (%): 576 (60). Analysis:calcd. for C27H18ClN5O4S2 (576.48): C, 56.30, H,3.15, N, 12.20%; found: C, 56.33, H, 3.13, N,12.25%.
4-[(4-Chloranylphenyl)-2,6-dimethyl-3,5-bis(4-
chloroanylphenyl)-1-oxidanylideneprop-2-enyl]-
1,4-dihydropyridine (8)
A mixture of compound 1 (3.03 g, 0.01 mol)and 4-chlorobenzaldehyde (2.24 g, 0.02 mol) inethanol containing 1 g sodium hydroxide wasrefluxed for 3 h, then cooled and poured into water.The precipitate formed was filtered off and recrys-tallized from dioxane.
Yield: 50%; m.p. 162-164OC. IR (KBr, cm-1):3250 (NH), 1698 (C=O). 1H NMR (DMSO-d6, δ,ppm): 1.71 (s, 6H, 2CH3), 4.45 (s, 1H, pyridine-H),7.00-7.26 (m, 12H, Ar-H), 7.33 (d, J = 12.9 Hz, 2H,methylene), 7.96 (d, J = 12.9 Hz, 2H, methylene),9.80 (s, 1H, NH, D2O exchangeable). MS m/z (%):548 (85), 437 (100). Analysis: calcd. forC31H24Cl3NO2 (548.88): C, 67.83, H, 4.41, N,2.55%; found: C, 67.87, H, 4.38, N, 2.60%.
468 EMAN M.H. MORSY et al.
4-(4-Chloranylphenyl)-2,6-dimethyl-3,5-bis(chlo-
ranylphenyl)-1H-pyrazol-3-yl)-1,4-dihydropyri-
dine (9)
A mixture of compound 8 (5.48 g, 0.01 mol)and hydrazine hydrate (1 mL, 0.03 mol) wasrefluxed in absolute ethanol (30 mL) for 4 h. Theprecipitated solid was filtered off, and crystallizedfrom methanol.
Yield: 45%; m.p. 204-206OC. IR (KBr, cm-1):3160, 3217, 3220 (3NH). 1H NMR (DMSO-d6, δ,ppm): 1.70 (s, 6H, 2CH3), 4.42 (s, 1H, pyridine-H),6.50 (s, 2H, pyrazole-H), 7.00-7.42 (m, 12H, Ar-H),9.80 (s, 1H, NH, D2O exchangeable), 10.20 (s, 2H,NH-pyrazole, D2O exchangeable). MS m/z (%): 572(55), 461 (100). Analysis: calcd. for C31H24Cl3N5
(572.91): C, 64.99, H, 4.22, N, 12.22%; found: C,65.20, H, 4.20, N, 22.40%.
3,5-Bis[1-(aminosulfanylidine)methyl-5-(4-chlo-
ranylphenyl)-1H-pyrazol-3-yl]-2,6-dimethyl-4-(4-
chloranylphenyl)-1,4-dihydropyridine (10)
A mixture of compound 8 (5.48 g, 0.01 mol)and thiosemicarbazide (1.80 g, 0.02 mol) wasrefluxed in 30 mL ethanol containing sodiumhydroxide (0.80 g, 0.02 mole) for 4 h. The reactionmixture was cooled, poured onto water and theformed solid was filtered off and recrystallized fromdioxane.
Yield: 50%; m.p. 228-230OC. IR (KBr, cm-1):3150 (NH), 3360-3365 (2NH2), 1228 (C=S). 1HNMR (DMSO-d6, δ, ppm): 1.70 (s, 6H, 2CH3), 2.00(s, 4H, 2NH2, D2O exchangeable), 4.42 (s, 1H, pyri-dine-H), 6.50 (s, 2H, pyrazole-H), 7.00-7.62 (m,12H, Ar-H), 9.80 (s, 1H, NH, D2O exchangeable).13C NMR (DMSO-d6, δ, ppm): 18.80 (2CH3), 43.40(CH-pyridine), 104.00 (2CH, pyrazole), 107.80(2C=C), 128.40-135.80 (18Ar-C), 130.70 (2C=C),134.00 (2C=C), 150.00 (2C=C), 190 (2C=S). MSm/z (%): 691 (60), 580 (100). Analysis: calcd. forC33H26Cl3N7S2 (691.09): C, 57.35, H, 3.79, N,14.19%; found: C, 57.40, H, 3.80, N, 14.22%.
4-(4-Chloranylphenyl)-2,6-dimethyl-3,5-bis(4-
chloranylphenylisoxazol-3-yl)-1,4-dihydropyri-
dine (11)
A mixture of compound 8 (5.48 g, 0.01 mol)and hydroxyl amine hydrochloride (1.40 g, 0.02mol) was refluxed in 30 mL pyridine for 3 h. Thereaction mixture was cooled, poured into cold waterand neutralized with dil. HCl. The formed solid wasfiltered off and recrystallized from acetic acid.
Yield: 45%; m.p. 150-152OC. IR (KBr, cm-1):3145 (NH). 1H NMR (DMSO-d6, δ, ppm): 1.70 (s,6H, 2CH3), 4.45 (s, 1H, pyridine-H), 6.55 (s, 2H,
isoxazole-H), 7.00-7.45 (m, 12H, Ar-H), 9.80 (s,1H, NH, D2O exchangeable). MS m/z (%): 574 (30),463 (100). Analysis: calcd. for C31H22Cl3N3O2
(574.88): C, 64.77, H, 3.86, N, 7.31%; found: C,64.77, H, 3.90, N, 7.35%.
General procedure for synthesis of compounds 12
A mixture of compound 8 (5.48 g, 0.01 mol),cyclohexanone or cyclopentanone (0.04 mol) wasstirred in 30 mL ethanol containing sodium hydrox-ide (0.06 mol) for 12 h at room temp. The mixturewas extracted with ethyl acetate (20 mL) and driedover sodium sulfate anhydrous. After removing offthe solvent in vacuo, the collected gummy productwas precipitated in CCl4/hexane (3 : 1) and crystal-lized from dioxane.
[4-(4-Chloranylphenyl)-2,6-dimethyl-3,5-bis(4-
chloranylphenyl)-1-oxidanylidene-prop-2-enyl]-
1,4-dihydropyridine]cyclohexanone (12a)
Yield: 45%; m.p. 107-109OC. IR (KBr, cm-1):1695, 1698 (2C=O), 1707-1710 (2C=O). 1H NMR(DMSO-d6, δ, ppm): 1.70 (s, 6H, 2CH3), 4.43 (s, 1H,pyridine-H), 1.80-2.59 (m, 18H, cyclohexanone),3.17-3.20 (m, 2H, propyl-H), 3.25 (dd, J = 11.66,2.60 Hz, 2H, propyl-H), 3.40 (dd, J = 12.90, 3.37Hz, 2H, propyl-H,), 7.00-7.19 (m, 12H, Ar-H), 9.80(s, 1H, NH, D2O exchangeable). MS m/z (%): 745(70). Analysis: calcd. for C43H44Cl3NO4 (745.17): C,69.31, H, 5.95, N, 1.88%; found: C, 69.40, H, 5.92,N, 2.00%.
[4-(4-Chloranylphenyl)-2,6-dimethyl-3,5-bis(4-
chloranylphenyl)-1-oxidanylideneprop-2-enyl]-
1,4-dihydropyridine]cyclopentanone (12b)
Yield: 61%; m.p. 110-112OC. IR (KBr, cm-1):1698, 1700 (2C=O), 1702, 1677 (2C=O). 1H NMR(DMSO-d6, δ, ppm): 1.71 (s, 6H, 2CH3), 2.06-2.43(m, 14H, pentanone-H), 3.20-3.23 (m, 2H, propyl-H), 3.30 (dd, J = 11.88, 3.00 Hz, 2H, propyl-H),3.45 (dd, J = 12.94, 3.25 Hz, 2H, propyl-H), 4.43 (s,1H, pyridine-H), 7.00-7.19 (m, 12H, Ar-H), 9.80 (s,1H, NH, D2O exchangeable). MS m/z (%): 717 (90).Analysis: calcd. for C41H40Cl3NO4 (717.11): C,68.67, H, 5.6,2 N, 1.95%; found: C, 68.70, H, 5.60,N, 1.90%.
Antimicrobial activity
The antibacterial activity of the synthesizedcompounds was tested against Bacillus subtilisNRRL 543 , Staphylococcus aureus NRRL B-313(Gram-positive bacteria), Escherichia coli NRRL B-210, Pseudomonas aeruginosa NRRL B-23 (Gram-negative bacteria) using nutrient agar medium. The

Synthesis and in vitro antimicrobial activity of novel series of... 469
antifungal activity of the compounds was testedagainst Candida albicans NRRL Y-477 andAspergillus niger NRRL 599 using Sabouraud dex-trose agar medium.
Agar diffusion medium
All compounds were screened in vitro for theirantimicrobial activity by agar diffusion method (42).A suspension of the organisms were added to sterilenutrient agar media at 45OC and the mixture wastransferred to sterile Petri dishes and allowed tosolidify. Holes of 10 mm in diameter were madeusing a cork borer. An amount of 0.1 mL of the syn-thesized compounds was poured inside the holes. Ahole filled with DMSO was also used as control. Theplates were left for 1 h at room temperature as a peri-od of pre-incubation diffusion to minimize theeffects to variation in time between the applicationsof the different solutions. The plates were then incu-bated at 37OC for 24 h and observed for antibacteri-al activity. The diameters of zone of inhibition weremeasured and compared with that of the standard;the values were tabulated. Ciprofloxacin (50 µg/mL)and fluconazole (50 µg/mL) were used as standardfor antibacterial and antifungal activity, respective-ly. The observed zones of inhibition are presented inTable 1.
Minimal inhibitory concentration
Minimal inhibitory concentration (MIC) of thetest compounds were determined by agar streak
dilution method. Stock solutions of the synthesizedcompounds (100 mg/mL) were made using DMSOas the solvent. From this stock solution, a range ofconcentrations from 5 to 0.05 mg/mL of the testedcompounds solutions was mixed with the knownquantities of molten sterile agar media aseptically.About 20 mL of nutrient agar medium for bacteriaand Sabouraud dextrose agar medium for fungi con-taining the tested compound under study was dis-pensed into each sterile Petri dish. Then, the mediawere allowed to get solidified. Microorganismswere then streaked one by one on the agar platesaseptically. After streaking, all the plates were incu-bated at 30OC for 24 h/48 h for bacteria and fungi,respectively. Then, the plates were observed for thegrowth of microorganisms. The lowest concentra-tion of the synthesized compounds inhibiting thegrowth of the given bacteria/fungus was consideredas minimal inhibitory concentration (MIC) of thetest compounds against that bacteria or fungi on theplate. The MIC values of each compound againstvarious bacteria and fungi were tabulated in Table 2.
RESULTS AND DISCUSSION
Chemistry
4-(4-Chlorophenyl)-2,6-dimethyl-3,5-bisdi-acetyl-1,4-dihydropyridine (1) was prepared viacondensation of 4-chlorobenzaldehyde and acetyl-acetone in the presence of ammonium acetate. Theassignment of the structure was proved based on ele-
Table 1. Inhibition zone in mm as a criterion of antibacterial and antifungal activities of the newly synthesized compounds.
Microorganism inhibition zone diameter (mm)
Gram positive bacteria Gram negative bacteria Fungi Compound
Bacillus Staphylococcus Escherichia Pseudomonas Candida Aspergillus subtilis aureus coli aeruginosa albicans niger
1 14 13 15 14 13 11
2a 13 12 14 13 14 12
3a 17 16 18 17 16 14
3b 23 21 24 22 22 19
8 19 18 20 18 19 15
9 17 17 18 18 18 16
10 17 16 17 17 15 13
12a 25 23 25 25 21 19
Ciprofloxacin 22 24 24 23 - -
Fluconazole - - - - 22 24
Highly active = inhibition zone > 20 mm, moderately active = inhibition zone 15-20 mm, slightly active = inhibition zone 11-14 mm, inac-tive = inhibition zone < 11 mm.

470 EMAN M.H. MORSY et al.
Table 2. MIC in µg/mL of the newly synthesized compounds against microorganisms.
Gram positive bacteria Gram negative bacteria Fungi
Compound Bacillus Staphylococcus Escherichia Pseudomonas Candida Aspergillus subtilis aureus coli aeruginosa albicans niger
1 1.4 1.6 1.2 1.4 1.6 2
2a 1.8 1.8 1.4 1.6 1.4 1.8
3a 0.8 1 0.6 0.8 1 1.4
3b 0.14 0.18 0.12 0.16 0.16 0.4
8 0.4 0.6 0.2 0.6 0.4 1.2
9 0.8 0.8 0.6 0.6 0.6 1
10 0.8 1 0.8 0.8 1.2 1.6
12a 0.1 0.14 0.1 0.1 0.18 0.4
Scheme 1. Synthesis of compounds 1-3
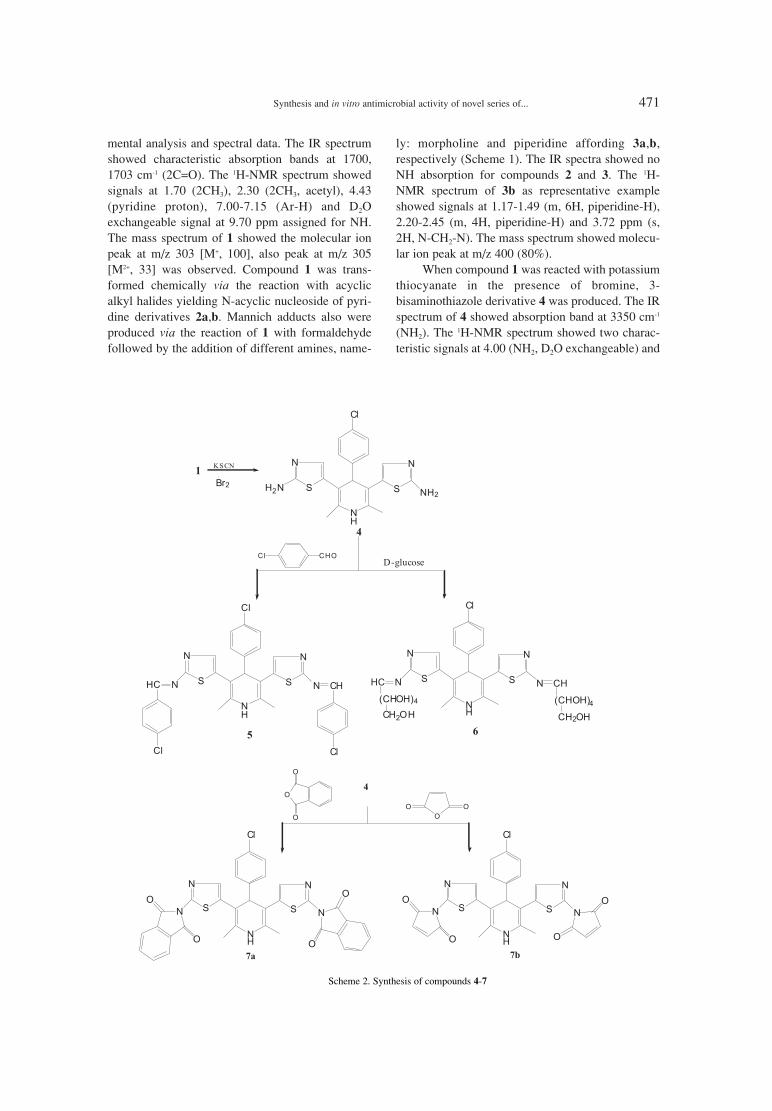
Synthesis and in vitro antimicrobial activity of novel series of... 471
mental analysis and spectral data. The IR spectrumshowed characteristic absorption bands at 1700,1703 cm-1 (2C=O). The 1H-NMR spectrum showedsignals at 1.70 (2CH3), 2.30 (2CH3, acetyl), 4.43(pyridine proton), 7.00-7.15 (Ar-H) and D2Oexchangeable signal at 9.70 ppm assigned for NH.The mass spectrum of 1 showed the molecular ionpeak at m/z 303 [M+, 100], also peak at m/z 305[M2+, 33] was observed. Compound 1 was trans-formed chemically via the reaction with acyclicalkyl halides yielding N-acyclic nucleoside of pyri-dine derivatives 2a,b. Mannich adducts also wereproduced via the reaction of 1 with formaldehydefollowed by the addition of different amines, name-
ly: morpholine and piperidine affording 3a,b,respectively (Scheme 1). The IR spectra showed noNH absorption for compounds 2 and 3. The 1H-NMR spectrum of 3b as representative exampleshowed signals at 1.17-1.49 (m, 6H, piperidine-H),2.20-2.45 (m, 4H, piperidine-H) and 3.72 ppm (s,2H, N-CH2-N). The mass spectrum showed molecu-lar ion peak at m/z 400 (80%).
When compound 1 was reacted with potassiumthiocyanate in the presence of bromine, 3-bisaminothiazole derivative 4 was produced. The IRspectrum of 4 showed absorption band at 3350 cm-1
(NH2). The 1H-NMR spectrum showed two charac-teristic signals at 4.00 (NH2, D2O exchangeable) and
Scheme 2. Synthesis of compounds 4-7
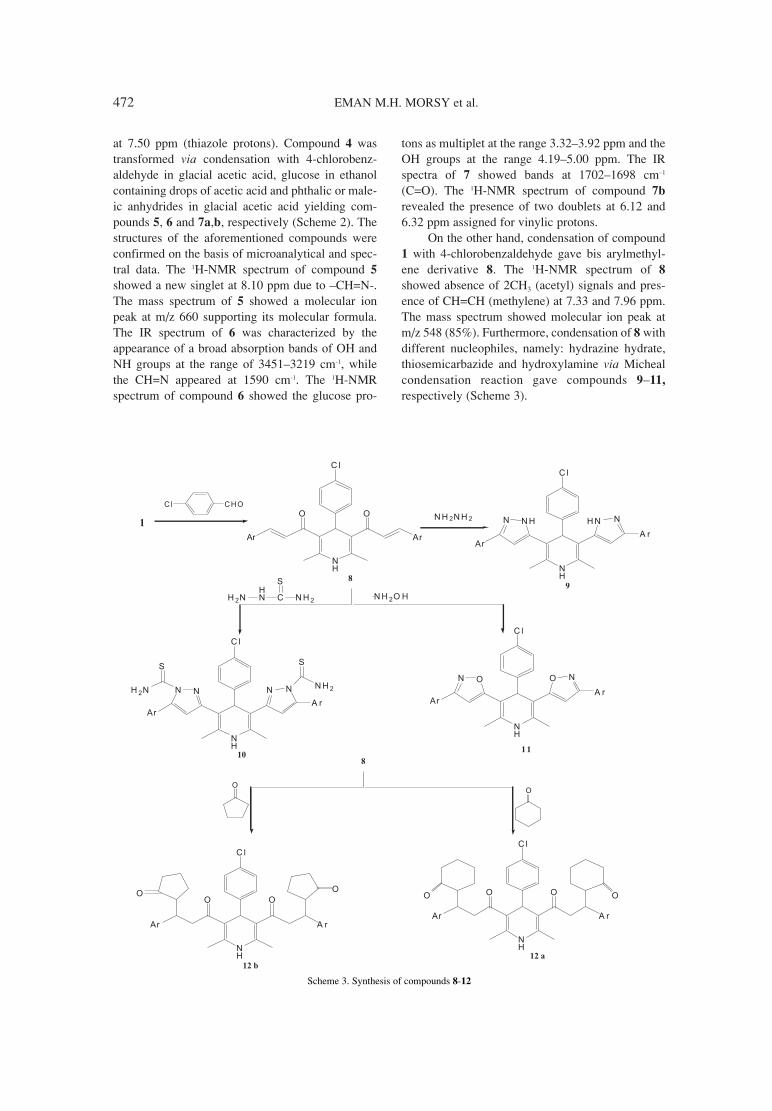
472 EMAN M.H. MORSY et al.
at 7.50 ppm (thiazole protons). Compound 4 wastransformed via condensation with 4-chlorobenz-aldehyde in glacial acetic acid, glucose in ethanolcontaining drops of acetic acid and phthalic or male-ic anhydrides in glacial acetic acid yielding com-pounds 5, 6 and 7a,b, respectively (Scheme 2). Thestructures of the aforementioned compounds wereconfirmed on the basis of microanalytical and spec-tral data. The 1H-NMR spectrum of compound 5
showed a new singlet at 8.10 ppm due to ñCH=N-.The mass spectrum of 5 showed a molecular ionpeak at m/z 660 supporting its molecular formula.The IR spectrum of 6 was characterized by theappearance of a broad absorption bands of OH andNH groups at the range of 3451ñ3219 cm-1, whilethe CH=N appeared at 1590 cm-1. The 1H-NMRspectrum of compound 6 showed the glucose pro-
tons as multiplet at the range 3.32ñ3.92 ppm and theOH groups at the range 4.19ñ5.00 ppm. The IRspectra of 7 showed bands at 1702ñ1698 cmñ1
(C=O). The 1H-NMR spectrum of compound 7b
revealed the presence of two doublets at 6.12 and6.32 ppm assigned for vinylic protons.
On the other hand, condensation of compound1 with 4-chlorobenzaldehyde gave bis arylmethyl-ene derivative 8. The 1H-NMR spectrum of 8
showed absence of 2CH3 (acetyl) signals and pres-ence of CH=CH (methylene) at 7.33 and 7.96 ppm.The mass spectrum showed molecular ion peak atm/z 548 (85%). Furthermore, condensation of 8 withdifferent nucleophiles, namely: hydrazine hydrate,thiosemicarbazide and hydroxylamine via Michealcondensation reaction gave compounds 9ñ11,
respectively (Scheme 3).
Scheme 3. Synthesis of compounds 8-12

Synthesis and in vitro antimicrobial activity of novel series of... 473
The structures of compounds 9ñ11 were in agree-ment with their spectral and analytical data. The massspectrum of compound 9 showed a molecular ion peakat m/z 572 (55%). Its 1H-NMR spectrum showed sin-glet at 6.50 ppm characteristic for pyrazole ring pro-tons. Compound 8, when condensed with cyclohexa-none and cyclopentanone, afforded compounds 12a,b.The IR spectrum of 12a showed absorption bandsat1695, 1698, 1700ñ1705, 1710 cm-1 (C=O). The 1H-NMR spectrum of 12a showed multiplet at 1.80ñ2.59for 18 protons of cyclohexanone, signals at 3.17ñ3.20for 2CH-propyl protons and at 3.25ñ3.40 ppm for2CH2-propyl protons. The mass spectrum of 12a
showed molecular ion peak at m/z 745 (100%).
Antimicrobial activity
All the newly synthesized compounds werescreened for their in vitro antibacterial activity againsttwo strains of Gram positive bacteria (Staphylococcusaureus, Bacillus subtilis), and two strains of Gramnegative bacteria (Escherichia coli, Pseudomonasaeruginosa) using ciprofloxacin as a standard drug(100 µg/mL). They were also evaluated for their invitro antifungal activity against the mycotic strains(Candida albicans and Aspergillus niger) using flu-conazole as a standard antifungal drug (100 µg/mL).Agar-diffusion method was used in this investigationfor determination of the preliminary antibacterial andantifungal activity and the results were recorded foreach tested compound as the average diameter ofinhibition zones (IZ) of bacterial or fungal growtharound the discs in mm (Table 1). The minimalinhibitory concentrations (MIC) were determined forcompounds showing promising growth inhibition,using the twofold serial dilution method (43). TheMIC (µg/mL) values against the tested bacterial andfungal isolates are presented in Table 2.
According to Tables 1 and 2, it is clear thatcompounds 1, 2a and 3a showed low activitiestoward all types of microorganisms. Compounds 9and 10 showed moderate antibacterial and antifun-gal activities. Bis-arylmethylene derivative 8 wasfound to be highly active against Escherichia coli,but showed moderate activity towards Gram posi-tive bacteria, Gram negative bacteria and fungi.Derivatives 3b, 3,5-bis-pyridin-1H-morpholine and12a, dihydropyridine cyclohexanone, showed highactivity toward all microorganisms.
CONCLUSION
In the present study, 2,6-dimethyl-3,5-bis-acetyl-1,4-dihydropyridine (1) was used to synthe-size novel derivatives of N-acyclic nucleosides
(2a,b), Mannich products (3a,b), 3,5-bis-aminothia-zole (4), heterocyclic derivatives (5-7), 3,5-bisaryl-methylene (8) and (9-12). The antimicrobial activityof some compounds was reported. Compounds 3b
and 12a showed high activity against Gram positivebacteria, Gram negative bacteria and fungi.
Acknowledgment
The authors are grateful to National ResearchCentre (NRC) for supporting this work.
REFERENCES
1. Triggle D.J.: Biochem. Pharmacol. 74, 1(2007).
2. Love B., Goodman M., Snader K., Tedeschi R.,Macko E.: J. Med. Chem. 17, 956 (1974).
3. Bossert F., Meyer H., Wehinger E.: Angew.Chem. Int. Ed. Engl. 20, 762 (1981).
4. Breitenbucher, J.G., Figliozz G.: TetrahedronLett. 41, 4311 (2000).
5. Boer R., Gekeler V.: Drugs Fut. 20, 499 (1995).6. Briukhanov V.M., Zverev Iaf, Elkin V.I.: Eksp.
Klin. Farmakol. 57, 47 (1994).7. Bahekar S., Shinde D.:, Acta Pharm. (Zagreb)
A. 52, 281 (2002).8. Wachter G.A., Davis M.C.: J. Med. Chem. 41,
2436 (1998).9. Gullapalli S., Ramarao P.: Neuropharmacology
42, 467 (2002).10. Sunkel C.E., De Casa Juana M.F., Santos L.: J.
Med. Chem. 33, 3205 (1990).11. Ono Handkinura M.: Arzneimittelforschung 3,
1131 (1981).12. Tusell J.M., Barron S., Seratosa J.: J. Brain Res.
622, 99 (1993).13. Tarasenko L.M., Neporada K.S., Klusha V.:
Bull. Exp. Biol. Med. 133, 426 (2002).14. Budriesi R., Ioan P., Locatelli A., Cosconati S.,
Leoni A., Maria P. Ugenti M.P., Andreani A. etal.: J. Med. Chem. 51, 1592 (2008).
15. Kagabu S., Azuma A., Nishimura K.: J. Pest.Sci. 27, 267 (2002).
16. Nishiwaki H., Nakagawa Y., Ueno T., KagabuS., Nishimura K.: Science 57, 810 (2001).
17. Raj M.P.P., Rao J.T.: Asian J. Chem. 25, 492(2003).
18. Reddy D.B., Seshamma T., Seenaiah B.: IndianJ. Chem. 30B, 46 (1991).
19. Kennedy A.D., Summers A.L.: J. Heterocycl.Chem. 18, 409 (1981).
20. Attia A., Abo-Ghalia M.H., Abd El-Salam O.I.:Pharmazie 50, 455 (1995).

474 EMAN M.H. MORSY et al.
21. De Filippis P., Bovina E., Da Ros L., Fiori J.,Cavrini V.: J. Pharm. Biomed. Anal. 27, 803(2002).
22. Testa R., Dolfini E., Reschiotto C., Secchi C.,Biondi P.A.: Farmaco Ed. Prat. 34, 463 (1979).
23. Jakobsen P., Lederballe Pedersen O., MikkelsenE.J.: J. Chromatogr. 162, 81 (1979).
24. Pietta P., Rava A., Biondi P.: J. Chromatogr.210, 516 (1981).
25. Majeed I.A., Murray W.J., Newton D.W.,Othman S., Al-Turk W.A.: J. Pharm.Pharmacol. 39, 1044 (1987).
26. Krivopalov V.P., Sedova V.F., Shkurko O.P.:Russ. Chem. Bull. Int. Ed. 52, 2440 (2003).
27. Ragno G., Garofalo A., Vetuschi C.: J. Pharm.Biomed. Anal. 27, 19 (2002).
28. Marinkovic V., Agbaba D., Karljikovic-RajicK., Comor J., Zivanov-Stakic D.: Farmaco 55,128 (2000).
29. Mielcarek J., Stobiecki M., Franski R.: J.Pharm. Biomed. Anal. 24, 71 (2000).
30. Zanocco A., Diaz L., LÛpez M., Nu�ez-VergaraL.J., Squella J.A.: J. Pharm. Sci. 81, 920 (1992).
31. Afrasiabi Z., Sinn E., Padhye S., Dutta S.,Newton C., Anson C.E., Powell A.K.: J. Inorg.Biochem. 95, 306 (2003).
32. Rakhi C., Shelly C.: Res. J. Chem. Sci. 1, 1(2011).
33. Berhardt P.V., Caldwell L.M., Lovejoy D.B.,Richardson D.R.: Acta Cryst. 59 C, 629 (2003).
34. Afrasiabi Z., Sinn E., Chen J.: Inorg. Chim.Acta 357, 271 (2004).
35. Lakobidou Z., Mioglou E., Mourelatos D.,Kotsis A., Demertzis M.A., Papagoergiou A.,Miller J.M., Demertzi D.K.: Anticancer Drugs,12, 65 (2001).
36. Singh S., Bharti N., Naqvi F., Azam A.: Eur. J.Med. Chem. 39, 459 (2004).
37. Sharma S., Athar F., Maurya M.R., Naqvi F.,Azam A.: Eur. J. Med. Chem., 40, 557 (2005).
38. Quenelle D.C., Keith K.A., Kern E.R.: Antivir.Res. 71, 24 (2006).
39. Bharti N., Athar F., Maurya M.R., Azam A.:Bioorg. Med. Chem. 12, 4679 (2004).
40. Jeragh B.J.A., El-Dissouky A.: J. Coord. Chem.58, 1029 (2005).
41. Labisbal E., Haslow K.D., A Sousa-Pedrares.,ValdÈs-MartÌnez J., Hern·ndez-Ortega S., WestD.X.: Polyhedron 22, 2831 (2003).
42. Gross D.C., De Vay S.E.: Physiol. Plant Pathol.11, 13 (1977).
43. Bauer A.W., Kirby W.W.M., Sherris J.C.,Turck M.: Am. J. Clin. Pathol. 45, 493 (1966).
Received: 14. 04. 2014

Acta Poloniae Pharmaceutica ñ Drug Research, Vol. 72 No. 3 pp. 475ñ487, 2015 ISSN 0001-6837Polish Pharmaceutical Society
In the last twenty five years there has been asteep decline in the commercial output andresearch and development of antimicrobial agentsby the major pharmaceutical companies due to themore attractive commercial returns that can bemade for treatments of chronic human diseases. Atthe same time, there has been an explosion both inthe numbers of pathogenic bacteria that havebecome resistant to antibiotics due to their wide-spread and misuse and of immuno-compromisedpatients that are particularly susceptible to oppor-tunistic pathogens (1, 2). In addition, it is knownthat antifungal drugs do not have selective activitybecause of the biochemical similarity betweenhuman cell and fungi forms (3). Therefore, the dis-covery of new antimicrobial agents with novelmodes of action and no cross-resistance with cur-rent antibiotics will be vital to meet the threats cre-ated by the emergence of bacteria resistant to thecurrent therapeutic agents.
Literature survey revealed that tetralin is animportant ring comprising different efficaciousantimicrobial derivatives (4, 5). Additionally, thepyridine nucleus plays a key role of catalyzing bothbiological and chemical systems. In many enzymesof living organisms it is the prosthetic pyridinenucleotide (NADP) that is involved in various oxi-dationñreduction processes. It is also one of themost important heterocycles found in many antimi-crobial pharmaceuticals (6, 7).
Since it is documented that the most effectiveantimicrobial compounds can be designed by join-ing two or more biologically active cyclic systemstogether in a single molecular framework, we reporthere the synthesis and antimicrobial evaluation ofsome novel structure hybrids incorporating both thetetralin moiety with pyridine heterocycle. This com-bination was suggested in an attempt to investigatethe influence of such hybridization and structurevariation on the anticipated biological activities,
SYNTHESIS AND ANTIMICROBIAL EVALUATION OF CYANOPYRIDINYLTETRAHYDRONAPHTHALENE DERIVATIVES
RASHA S. GOUHAR1, SOMAIA S. ABD EL-KARIM1, MOGEDDA E. HAIBA1,2, MAGDY I. EL-ZAHAR1* and GHADA E.A. AWAD3
1Therapeutical Chemistry Department, National Research Center, Dokki, Cairo, 12622, Egypt2Department of Pharmaceutical Chemistry, Faculty of Pharmacy, King Saud University,
Riyadh 11451, Saudi Arabia3Chemistry of Natural and Microbial Products Department, National Research Center,
Dokki, Cairo, 12622, Egypt
Abstract: A novel series of cyanopyridinyl tetrahydronaphthalene incorporated with different heterocycleswere synthesized. The key compounds 2a,b were condensed with chloroacetone and ethyl chloroacetate to give3a,b and 4a,b, respectively. Also condensation of 4a,b with hydrazine hydrate gave the correspondinghydrazide 5a,b. Reaction of 5b with different isothiocyanates gave the corresponding thiosemicarbazide deriv-atives 6a-c. Also, condensation of 5a with chloroacetic acid, methyl iodide and /or acetic anhydride yielded 7-
9, respectively. Moreover, reaction of 5a with acetylacetone, ethyl acetoacetate, diethylmalonate, ethyl cyano-acetate, chloroacetone, ethyl chloroacetate, urea, phthalic anhydride, malic anhydride and/ or different aldehy-des yielded the corresponding derivatives 10-18, respectively. Newly synthesized compounds were screened fortheir antibacterial (Staphylococcus aureus, Bacillus subtilis, Bacillus megaterium, Sarcina lutea, Klebsiellapneumoniae, Pseudomonas aeruginosa, Escherichia coli) and antifungal (Saccharomyces cerevisiae andCandida albicans) activity. The results revealed that some of novel compounds have exhibited significant bio-logical activity against the tested microorganisms.
Keywords: tetrahydronaphthalene, cyanopyridine, antimicrobial activity
475
* Corresponding author: e-mail: [email protected]

476 RASHA S. GOUHAR et al.
hoping to add some synergistic biological signifi-cance to the target molecules.
EXPERIMENTAL
All melting points are uncorrected and weretaken in open capillary tubes using Electrothermalapparatus 9100. Elemental microanalyses were car-ried out at the Microanalytical Unit, CentralServices Laboratory, National Research Centre,Dokki, Cairo, Egypt, and were found to be within ±0.5% of the theoretical values. Infrared spectra wererecorded on a Jasco FT/IR-6100 Fourier transforminfrared spectrometer using the KBr disc techniqueat the Central Services Laboratory, NationalResearch Centre, Dokki, Cairo, Egypt. 1H NMRspectra were determined by using a Jeol EX-270NMR spectrometer at the Central ServicesLaboratory, National Research Centre, Dokki,Cairo, Egypt. The mass spectra were measured witha Finnigan MAT SSQ-7000 mass spectrometer atCentral Services Laboratory, National ResearchCentre, Dokki, Cairo, Egypt. Follow-up of the reac-tions and checking of the purity of the compoundswere made by TLC on silica gel precoated alu-minum sheets (Type 60, F 254, Merck, Darmstadt,Germany) and the spots were detected by exposureto a UV lamp at 254 nm for a few seconds. Thechemical names for the prepared compounds aregiven according to the IUPAC system.
General procedure for the synthesis of 1,2-dihy-
dro-6-(1,2,3,4-tetrahydronaphthalen-6-yl)-4-sub-
stituted-2-oxopyridine-3-carbonitrile 1a,bA mixture of 6-acetyl-1,2,3,4-tetrahydronaph-
thalene (6.0 g, 0.034 mol), the appropriate aldehydenamely: 3,4-dimethoxybenzaldehyde and/or 4-fluo-robenzaldehyde (0.034 mol), ethyl cyanoacetate (3.8mL, 0.034 mol) and ammonium acetate (21.0 g,0.272 mol) in n-butanol (50 mL) was refluxed for 6h. The formed precipitate was filtered, washed withether, dried and recrystallized from acetic acid togive the title compounds 1a,b, respectively.
1,2-Dihydro-6-(1,2,3,4-tetrahydronaphthalen-6-
yl)-4-(3,4-dimethoxyphenyl)-2-oxopyridine-3-
carbonitrile (1a)
Yield 65%; m.p. 250-252OC; IR (KBr, cm-1):2930, 2850 (CH2 - tetrahydronaphthalene protons),2219 (CN), 1637 (CO); 1H NMR (DMSO-d6, δ,ppm): 1.74, 2.68 (8H, m, 4(CH2) - tetrahydronaph-thalene protons), 3.83 (6H, s, 2-OCH3), 6.98-7.23(7H, m, Ar-H and pyridone proton), 9.21 (1H, s,NH, exchangeable by D2O); MS, m/z (%): 386 [M+]
(100); Analysis: calcd. for C24H22N2O3 (386.44): C,74.59; H, 5.74; N, 7.25%; found: C, 74.89; H, 5.94;N, 7.35%.
4-(4-Fluorophenyl)-1,2-dihydro-6-(1,2,3,4-
tetrahydronaphthalen-6-yl)-2-oxopyridine-3-car-
bonitrile (8)
General procedure for the synthesis of 6-(1,2,3,4-
tetrahydronaphthalen-6-yl)-2-mercapto-4-substi-
tuted-pyridine-3-carbonitrile 2a,b
A mixture of compounds 1a,b (0.01 mol) andP2S5 (2.22 g, 0.01 mol) in pyridine (15 mL) wasrefluxed for 5 h. After cooling, the mixture waspoured onto ice/cold water and acidified withhydrochloric acid. The formed precipitate was fil-tered, washed with water several times, dried andrecrystallized from ethanol to give the title com-pounds 2a,b, respectively.
6-(1,2,3,4-Tetrahydronaphthalen-6-yl)-2-mercap-
to-4-(3,4-dimethoxyphenyl)pyridine-3-carboni-
trile (2a)
Yield 65%; m.p. 107-108OC; IR (KBr, cm-1):2925, 2852 (CH2 - tetrahydronaphthalene protons),2215 (CN); 1H NMR (DMSO-d6, δ, ppm): 1.72, 2.74(8H, m, 4(CH2) - tetrahydronaphthalene protons),3.81 (6H, s, 2-OCH3), 6.98-7.23 (7H, m, Ar-H andpyridine proton), 8.81 (1H, s, NH, exchangeable byD2O); MS, m/z (%): 402 [M+] (100); Analysis:calcd. for C24H22N2O2S (402.51): C, 71.62; H, 5.51;N, 6.96; S, 7.79%; found: C, 71.32; H, 5.01; N, 6.76;S, 7.54%.
4-(4-Fluorophenyl)-6-(1,2,3,4-tetrahydronaph-
thalen-6-yl)-2-mercaptopyridine-3-carbonitrile
(2b)
Yield 55%; m.p. 95-96OC; IR (KBr, cm-1):2930, 2850 (CH2 - tetrahydronaphthalene protons),2219 (CN); 1H NMR (DMSO-d6, δ, ppm): 1.73, 2.69(8H, m, 4(CH2) - tetrahydronaphthalene protons),6.81-7.54 (8H, m, Ar-H and pyridine proton), 8.75(1H, s, NH, exchangeable by D2O); MS, m/z (%):360 [M+] (100); Analysis: calcd. for C22H17FN2S(360.45): C, 73.31; H, 4.75; N, 7.77; S, 8.90%;found: C, 73.41; H, 4.82; N, 7.93; S, 8.75%.
General procedure for the synthesis of 2-(2-oxo-
propylthio)-6-(1,2,3,4-tetrahydronaphthalen-6-
yl)-4-substituted-pyridine-3-carbonitrile 3a,b and
ethyl 2-(3-cyano-6-(1,2,3,4-tetrahydronaphhalen-
6-yl)-4-substituted-pyridin-2-ylthio)acetate 4a,bA mixture of compounds 2a,b (0.003 mol),
anhydrous sodium carbonate (0.32 g, 0.003 mol)

Synthesis and antimicrobial evaluation of cyanopyridinyl... 477
and the appropriate halo derivatives, namely:chloroacetone and/or ethyl chloroacetate (0.003mol) in DMF (20 mL) was refluxed for 4 h. Thereaction mixture was cooled and poured ontoice/cold water and acidified with hydrochloric acid.The formed precipitate was filtered, washed withwater several times, dried and recrystallized frommethanol to give the title compounds 3a,b and 4a,b,respectively.
2-(2-Oxopropylthio)-6-(1,2,3,4-tetrahydronaph-
thalen-6-yl)-4-(3,4-dimethoxyphenyl)pyridine-3-
carbonitrile (3a)
Yield 35%; m.p. 149-150OC; IR (KBr, cm-1):2929, 2853 (CH2 - tetrahydronaphthalene protons),2215 (CN), 1702 (CO); 1H NMR (DMSO-d6, δ,ppm): 1.70, 2.71 (8H, m, 4(CH2) - tetrahydronaph-thalene protons), 2.28 (3H, s, CH3CO), 3.83 (6H, s,2-OCH3), 4.10 (2H, s, SCH2), 6.72-7.91 (7H, m, Ar-H and pyridine proton); MS, m/z (%): 458 [M+] (70),459 [M++1] (38), 73 [C2H3NS] (100); Analysis:calcd. for C27H26N2O3S (458.57): C, 70.72; H, 5.71;N, 6.11; S, 6.99%; found: C, 70.43; H, 5.91; N, 6.61;S, 7.13%.
2-(2-Oxopropylthio)-4-(4-fluorophenyl)-6-(1,2,3,
4-tetrahydronaphthalen-6-yl)pyridine-3-carboni-
trile (3b)
Yield 40%; m.p. 114-115OC; IR (KBr, cm-1):2929, 2857 (CH2 - tetrahydronaphthalene protons),2216 (CN), 1709 (CO); 1H NMR (DMSO-d6, δ,ppm): 1.69, 2.68 (8H, m, 4(CH2) - tetrahydronaph-thalene protons), 2.17 (3H, s, CH3CO), 3.79 (6H, s,2-OCH3), 4.12 (2H, s, SCH2), 6.83-7.85 (8H, m, Ar-H and pyridine proton); MS, m/z (%): 416 [M+](100); Analysis: calcd. for C25H21FN2OS (416.51):C, 72.09; H, 5.08; N, 6.73; S, 7.70%; found: C,72.31; H, 4.98; N, 6.82; S, 7.56%.
Ethyl 2-(3-cyano-6-(1,2,3,4-tetrahydronaphtha-
len-6-yl)-4-(3,4-dimethoxyphenyl)pyridin-2-
ylthio)acetate (4a)
Yield 70%; m.p. 164-165OC; IR (KBr, cm-1):2931, 2834 (CH2 - tetrahydronaphthalene protons),2214 (CN), 1725 (CO, ester); 1H NMR (DMSO-d6,δ, ppm): 1.29 (3H, t, -COOCH2CH3), 1.69, 2.72 (8H,m, 4(CH2) - tetrahydronaphthalene protons), 3.75(6H, s, 2-OCH3), 4.13 (2H, s, SCH2), 4.16 (2H, q, -COOCH2CH3), 7.05-7.99 (7H, m, Ar-H and pyridineproton); MS, m/z (%): 488 [M+] (35), 115 (C9H7)(100); Analysis: calcd. for C28H28N2O4S (488.60): C,68.83; H, 5.78; N, 5.73; S, 6.56%; found: C, 68.83;H, 5.91; N, 5.63; S, 6.68%.
Ethyl 2-(3-cyano-4-(4-fluorophenyl)-6-(1,2,3,4-
tetrahydronaphthalen-6-yl)pyridin-2-ylthio)acet-
ate (4b)
Yield 68%; m.p. 131-132OC; IR (KBr, cm-1):2921, 2830 (CH2 - tetrahydronaphthalene protons),2217 (CN), 1740 (CO, ester); 1H NMR (DMSO-d6,δ, ppm): 1.24 (3H, t, -COOCH2CH3), 1.71, 2.67 (8H,m, 4(CH2) - tetrahydronaphthalene protons), 3.78(6H, s, 2-OCH3), 4.11 (2H, s, SCH2), 4.15 (2H, q, -COOCH2CH3), 7.05-7.89 (8H, m, Ar-H and pyridineproton);; MS, m/z (%): 446 [M+] (15), 357[C22H14FN2S] (100); Analysis: calcd. forC26H23FN2O2S (446.54): C, 69.93; H, 5.19; N, 6.27;S, 7.18%; found: C, 70.28; H, 5.44; N, 6.35; S,7.23%.
General procedure for the synthesis of 2-
hydrazinyl-6-(1,2,3,4-tetrahydronaphthalen-6-
yl)-4-(substituted phenyl)pyridine-3-carbonitrile
5a,b
Method A
A mixture of compound 2a,b (0.01 mol) andhydrazine hydrate (1.0 mL, 0.02 mol) in absoluteethanol was refluxed for 4 h. After cooling theformed precipitate was filtered, dried and recrystal-lized from methanol to give the title compound 5a,b.
Method B
A mixture of compounds 4a,b (0.002 mol) andhydrazine hydrate (0.1 mL, 0.002 mol) in absoluteethanol (20 mL) was refluxed for 3 h. The formedprecipitate was filtered, dried and recrystallizedfrom dioxane to give the title compounds 5a,b,respectively.
2-Hydrazinyl-6-(1,2,3,4-tetrahydronaphthalen-6-
yl)-4-(3,4-dimethoxyphenyl)pyridine-3-carboni-
trile (5a)
Yield 88%; m.p. 139-140OC; IR (KBr, cm-1):3245, 3177 ( NH, NH2), 2935, 2855 (CH2 - tetrahy-dronaphthalene protons), 2216 (CN); 1H NMR(DMSO-d6, δ, ppm): 1.67, 2.68 (8H, m, 4(CH2) -
tetrahydronaphthalene protons), 3.78 (6H, s, 2-OCH3), 6.95-7.98 (7H, m, Ar-H and pyridine pro-ton), 8.98, 9.01 (3H, s, NHNH2, exchangeable byD2O); MS, m/z (%): 400 [M+] (32), 402 [M+ + 2](65), 370 [M+-N2H2] (100); Analysis: calcd. forC24H24N4O2 (400.47): C, 71.98; H, 6.04; N, 13.99%;found: C, 71.74; H, 6.28; N, 13.68%.
4-(4-Fluorophenyl)-2-hydrazinyl-6-(1,2,3,4-tetra-
hydronaphthalen -6-yl)pyridine-3-carbonitrile (5b)
Yield 63%; m.p. 128-129OC; IR (KBr, cm-1):3336, 3208 ( NH, NH2), 2932, 2850 (CH2 - tetrahy-
478 RASHA S. GOUHAR et al.
dronaphthalene protons), 2217 (CN); 1H NMR(DMSO-d6, δ, ppm): 1.69, 2.66 (8H, m, 4(CH2) ñtetrahydronaphthalene protons), 7.04-8.04 (8H, m,Ar-H and pyridine proton), 8.67, 9.22 (3H, s,NHNH2, exchangeable by D2O); MS, m/z (%): 358[M+] (95), 359 [M+ + 1] (30), 77 [C6H5] (100);Analysis: calcd. for C22H19FN4 (358.41): C, 73.72;H, 5.34; N, 15.63%; found: C, 73.51; H, 5.21; N,15.78%.
General procedure for the synthesis of 1-(3-
cyano-4-(4-fluorophenyl)-6-(1,2,3,4-tetrahydro-
naphthalen-6-yl)pyridin-2-yl)-4- substituted thio-
semicarbazide 6a-c
A mixture of compound 5b (0.87 g, 0.002mol), the appropriate isothiocyanate, namely:methylisothiocyanate, ethylisothiocyanate and/orphenylisothiocyanate in dry benzene (20 mL) wasrefluxed for 6 h. The solvent was evaporated underreduced pressure and the remaining solid wasrecrystallized from methanol to give the title com-pounds 6a-c, respectively.
1-(3-Cyano-4-(4-fluorophenyl)-6-(1,2,3,4-tetrahy-
dronaphthalen-6-yl)pyridin-2-yl)-4-methyl-
thiosemicarbazide (6a)
Yield 50%; m.p. 158-159OC; IR (KBr, cm-1):3372, 3256, 3151 (3NH), 2929, 2845 (CH2 - tetrahy-dronaphthalene protons), 2216 (CN); 1H NMR(DMSO-d6, δ, ppm): 1.71, 2.82 (8H, m, 4(CH2)-tetra-hydronaphthalene protons), 2.56 (3H, s, -NHCH3),7.03-7.95 (8H, m, Ar-H and pyridine proton), 8.50,8.68, 9.01 (3H, s, 3NH, exchangeable by D2O); MS,m/z (%): 399 [M+ - CH6N] (30), 358 [C22H19FN4](100); Analysis: calcd. for C24H22FN5S (431.53): C,66.80; H, 5.14; N, 16.23; S, 7.43%; found: C, 66.58;H, 5.29; N, 16.51; S, 7.57%.
1-(3-Cyano-4-(4-fluorophenyl)-6-(1,2,3,4-tetrahy-
dronaphthalen-6-yl)pyridin-2-yl)-4-ethylthio-
semicarbazide (6b)
Yield 45%; m.p. 215-216OC; IR (KBr, cm-1):3370, 3251, 3166 (3NH), 2932, 2851 (CH2 - tetrahy-dronaphthalene protons), 2214 (CN); 1H NMR(DMSO-d6, δ, ppm): 1.05 (3H, t, -NHCH2CH3),1.69, 2.78 (8H, m, 4(CH2) ñ tetrahydronaphthaleneprotons), 3.51 (3H, q, -NHCH2CH3), 7.07-8.10 (8H,m, Ar-H and pyridine proton), 8.41, 8.72, 9.21 (3H,s, 3NH, exchangeable by D2O); MS, m/z (%): 418[M+ - C2H3] (6), 401 [M+ - C2H5N] (100); Analysis:calcd. for C25H24FN5S (445.55): C, 67.39; H, 5.43;N, 15.72; S, 7.20%; found: C, 67.53; H, 5.34; N,15.60; S, 7.44%.
1-(3-Cyano-4-(4-fluorophenyl)-6-(1,2,3,4-tetrahy-
dronaphthalen-6-yl)pyridin-2-yl)-4-phenyl-
thiosemicarbazide (6c)
Yield 39%; m.p. 169-170OC; IR (KBr, cm-1):3362, 3279, 3181 (3NH), 2931, 2855 (CH2 - tetrahy-dronaphthalene protons), 2218 (CN); 1H NMR(DMSO-d6, δ, ppm): 1.71, 2.73 (8H, m, 4(CH2) ñtetrahydronaphthalene protons), 7.12-7.97 (13H, m,Ar-H and pyridine proton), 8.38, 8.64, 8.89 (3H, s,3NH, exchangeable by D2O); MS, m/z (%): 399 [M+
- C6H8N] (4), 77 [C6H5] (100); Analysis: calcd. forC29H24FN5S (493.60): C, 70.57; H, 4.90; N, 14.19; S,6.50%; found: C, 70.29; H, 4.58; N, 14.31; S,6.82%.
2-(2-Hydrazinyl-6-(1,2,3,4-tetrahydronaphtha-
len-6-yl)-4-(3,4-dimethoxyphenyl)pyridine-3-car-
boyl)acetic acid (7)
A mixture of compound 5a (2.0 g, 0.005 mol),chloroacetic acid (0.47 g, 0.005 mol) and anhydroussodium acetate (0.82 g, 0.01 mol) in acetic anhy-dride (25 mL) and glacial acetic acid (50 mL) wasrefluxed for 6 h. After cooling, the reaction mixturewas poured onto ice/cold water; the formed precipi-tate was filtered, dried, and recrystallized fromethanol to give compound 7.
Yield 58%; m.p. 129-130OC; IR (KBr, cm-1):3417 (COOH), 2925, 2853 (CH2 - tetrahydronaph-thalene protons), 2214 (CN); 1H NMR (DMSO-d6, δ,ppm): 1.68, 2.69 (8H, m, 4(CH2) - tetrahydronaph-thalene protons), 3.51 (2H, s, -CH2), 3.76 (6H, s, 2-OCH3), 6.88-8.01 (7H, m, Ar-H and pyridine pro-ton), 8.23, 8.64, 11.21 (3H, s, 2NH, OH, exchange-able by D2O); MS, m/z (%): 460 [M+ + 2] (11), 441[M+ - OH] (38), 386 [M+ - C2H2NO2] (100); Analysis:calcd. for C26H26N4O4 (458.51): C, 68.11; H, 5.72;N, 12.22%; found: C, 68.24; H, 5.61; N, 12.43%.
2-(2-Methylhydrazinyl)-6-(1,2,3,4-tetrahydro-
naphthalen-6-yl)-4-(3,4-dimethoxyphenyl)pyri-
dine-3-carbonitrile (8)
A mixture of compound 5a (0.8 g, 0.002 mol),anhydrous sodium carbonate (0.21 g, 0.002 mol)and iodomethane (0.29 mL, 0.002 mol) in DMF (20mL) was refluxed for 7 h. Then, the reaction mixturewas cooled, poured onto ice/cold water. The formedprecipitate was filtered, dried, and recrystallizedfrom acetic acid to give the title compound 8.
Yield 76%; m.p. 114-115OC; IR (KBr, cm-1):3352, 3215 (2NH), 2921, 2853 (CH2 - tetrahydro-naphthalene protons), 2216 (CN); 1H NMR (DMSO-d6, δ, ppm): 1.69, 2.72 (8H, m, 4(CH2) - tetrahy-dronaphthalene protons), 2.56 (2H, s, -CH3), 3.76(6H, s, 2-OCH3), 6.75-8.12 (7H, m, Ar-H and pyri-

Synthesis and antimicrobial evaluation of cyanopyridinyl... 479
dine proton), 8.11, 8.53 (2H, s, 2NH, exchangeableby D2O); MS, m/z (%): 414 [M+] (26), 416 [M+ + 2](76), 77 [C6H5] (100); Analysis: calcd. forC25H26N4O2 (414.50): C, 72.44; H, 6.32; N, 13.52%;found: C, 72.28; H, 6.52; N, 13.33%.
Ní-(3-cyano-6-(1,2,3,4-tetrahydronaphthalen-6-
yl)-4-(3,4-dimethoxyphenyl)pyridin-2-yl)aceto-
hydrazide (9)
A mixture of compound 5a (0.40 g, 0.001 mol)and acetic anhydride (0.11 mL, 0.001 mol) in aceticacid (10 mL) was refluxed for 6 h. The reaction mix-ture was cooled and poured onto ice/cold water. Theformed precipitate was filtered, dried and recrystal-lized to give the title compound 9.
Yield 65%; m.p. 101-103OC; IR (KBr, cm-1):3425, 3258 (2NH), 2930, 2857 (CH2 - tetrahydro-naphthalene protons), 2216 (CN), 1633 (CO); 1HNMR (DMSO-d6, δ, ppm): 1.68, 2.59 (8H, m,4(CH2) - tetrahydronaphthalene protons), 2.12 (3H,s, CH3), 3.73 (6H, s, 2-OCH3), 6.88-7.74 (7H, m, Ar-H and pyridine proton), 7.91, 8.25 (2H, s, 2NH,exchangeable by D2O); MS, m/z (%): 442 [M+] (8),415 [C25H25N3O3] (100); Analysis: calcd. forC26H26N4O3 (442.51): C, 70.57; H, 5.92; N, 12.66%;found: C, 70.41; H, 5.71; N, 12.43%.
6-(1,2,3,4-Tetrahydronaphthalen-6-yl)-4-(3,4-
dimethoxyphenyl)-2-(3,5-dimethyl-1H-pyrazol-1-
yl)pyridine-3-carbonitrile (10)
Refluxing a mixture of compound 5a (0.40 g,0.001 mol) and acetylacetone (0.10 mL, 0.001 mol)in acetic acid (15 mL) for 6 h. The formed precipi-tate after cooling was filtered, dried and recrystal-lized from acetic acid to give the title compound 10. Yield 52%: m.p. 114-115OC; IR (KBr, cm-1): 2928,2855 (CH2 - tetrahydronaphthalene protons), 2214(CN); 1H NMR (DMSO-d6, δ, ppm): 1.69, 2.71 (8H,m, 4(CH2) - tetrahydronaphthalene protons), 2.94(6H, s, 2CH3-pyrazole ring), 3.78 (6H, s, 2-OCH3),6.01 (1H, s, pyrazole proton), 6.82-8.21 (7H, m, Ar-H and pyridine proton); MS, m/z (%): 414 [M+ -
C4H2] (42), 344 [M+ - C6H6N3] (50), 55 [C4H7] (100);Analysis: calcd. for C29H28N4O2 (464.56): C, 74.98;H, 6.08; N, 12.06%; found: C, 74.73; H, 5.94; N,12.26%.
General procedure for the synthesis of com-
pounds (11-13)
A mixture of compound 5a (0.40 g, 0.001 mol)and active methylene compounds, namely: ethylacetoacetate, diethylmalonate and/or ethyl cyanoac-etate (0.001 mol) in ethanol (20 mL) containing fewdrops of piperidine was refluxed for 4 h. The formed
precipitate was filtered, dried and recrystallizedfrom methanol to give the title compounds 11-13,respectively.
2-(4,5-Dihydro-3-methyl-5-oxopyrazol-1-yl)-6-(1,
2,3,4-tetrahydronaphthalen-6-yl)-4-(3,4-dimeth-
oxyphenyl)pyridine-3-carbonitrile (11)
Yield 60%; m.p. 120-121OC; IR (KBr, cm-1):2928, 2857 (CH2 - tetrahydronaphthalene protons),2211 (CN), 1635 (CO); 1H NMR (DMSO-d6, δ,ppm): 1.69, 2.71 (8H, m, 4(CH2) - tetrahydronaph-thalene protons), 2.02 (3H, s, CH3), 2.21 (2H, s, CH2
- pyrazole proton), 3.79 (6H, s, 2-OCH3), 6.80-8.32(7H, m, Ar-H and pyridine proton); MS, m/z (%):452 [M+ - CH2] (2), 402 [C24H26N4O2] (100);Analysis: calcd. for C28H26-N4O3 (466.53): C, 72.09;H, 5.62; N, 12.01%; found: C, 72.35; H, 5.81; N,12.27%.
6-(1,2,3,4-Tetrahydronaphthalen-6-yl)-4-(3,4-di-
methoxyphenyl)-2-(3,5-dioxopyrazolidin-1-yl)
pyridine-3-carbonitrile (12)
Yield 75%; m.p. 107-108OC; IR (KBr, cm-1):3428 (NH), 2927, 2855 (CH2 - tetrahydronaphtha-lene protons), 2215 (CN); 1735, 1633 (CO cyclic);1H NMR (DMSO-d6, δ, ppm): 1.72, 2.75 (8H, m,4(CH2) - tetrahydronaphthalene protons), 3.11 (2H,s, CH2 - pyrazole proton), 3.79 (6H, s, 2-OCH3),6.95-8.42 (7H, m, Ar-H and pyridine proton), 8.69(1H, s, NH, exchangeable by D2O); MS, m/z (%):443 [C26H25N3O2] (3), 56 [C4H8] (100); Analysis:calcd. for C27H24N4O4 (468.50): C, 69.22; H, 5.16;N, 11.96%; found: C, 69.39; H, 5.41; N, 11.75%.
2-(3-Amino-4,5-dihydro-5-oxopyrazol-1-yl)-6-(1,
2,3,4-tetrahydronaphthalen-6-yl)-4-(3,4-dimeth-
oxyphenyl)pyridine-3-carbonitrile (13)
Yield 80%; m.p. 145-146OC; IR (KBr, cm-1):3386, 3124 (NH2), 2928, 2855 (CH2 - tetrahydro-naphthalene protons), 2210 (CN), 1736 (CO,cyclic); 1H NMR (DMSO-d6, δ, ppm): 1.72, 2.74(8H, m, 4(CH2) - tetrahydronaphthalene protons),2.20 (2H, s, CH2), 3.78 (6H, s, 2-OCH3), 6.95-7.98(7H, m, Ar-H and pyridine proton), 9.98 (2H, s,NH2, exchangeable by D2O); MS, m/z (%): 467 [M+](8), 402 [C24H26N4O2] (100); Analysis: calcd. forC27H25N5O3 (467.52): C, 69.36; H, 5.39; N, 14.98%;found: C, 69.61; H, 5.60; N, 14.77%.
3,4-Dihydro-6-(1,2,3,4-tetrahydronaphthalen-6-
yl)-8-(3,4-dimethoxyphenyl)-3-methyl-2H-pyri-
do[2,1-c][1,2,4]triazine-9-carbonitrile (14)
A mixture of compound 5a (0.40 g, 0.001 mol)and chloroacetone (0.10 mL, 0.001 mol) in dry

480 RASHA S. GOUHAR et al.T
able
1. A
ntim
icro
bial
act
ivity
exp
ress
ed a
s in
hibi
tion
diam
eter
zon
es in
mill
imet
ers
(mm
) of
che
mic
al c
ompo
unds
aga
inst
the
path
olog
ical
str
ains
bas
ed o
n w
ell d
iffu
sion
ass
ay.
Gra
m p
ositi
ve b
acte
ria
Gra
m n
egat
ive
bact
eria
Yea
st
Com
poun
dSt
aphy
loco
ccus
Bac
illus
Bac
illus
Sarc
ina
Kle
bsie
llaP
seud
omon
asE
sche
rich
ia
Sacc
haro
myc
esC
andi
daN
o.au
reus
subt
ilis
meg
ater
ium
lute
apn
eum
onia
e ae
rugi
nosa
coli
cere
visi
aeal
bica
nsA
TC
C 2
9213
AT
CC
6633
AT
CC
988
5A
TC
C13
883
AT
CC
2795
3A
TC
C25
922
NR
RL
Y-4
77
1a
N.A
.N
.A.
N.A
.N
.A.
N.A
.N
.A.
N.A
.21
20
2a
2022
2021
2620
2223
22
2b
2724
2920
2628
2533
32
3a
1717
1719
N.A
.N
.A.
N.A
.N
.A.
18
3b
2020
1822
2218
2021
25
4a
1720
1617
1718
1621
26
4b
17N
.A.
N.A
.16
1616
1718
20
5a
3035
2834
3335
3224
28
5b
1725
N.A
.N
.A.
3028
3229
25
6a
2522
2822
1618
1716
16
6b
1526
2829
2420
2029
23
6c
1820
1516
1919
2018
22
719
1816
1921
2020
1820
813
1814
1525
2322
2422
919
1216
2015
1413
1820
10
1914
17N
.A.
1817
1723
22
11
1715
1617
1918
1620
20
12
1717
1616
1718
1725
21
13
1517
1488
1919
1820
18
14
1716
1518
1513
1421
22
15
1815
1519
N.A
.16
1722
20
16
1813
1618
1418
1325
21

Synthesis and antimicrobial evaluation of cyanopyridinyl... 481
xylene (20 mL) was refluxed for 5 h. The formedprecipitate that separated while hot was collectedand recrystallized from ethanol to give the title com-pound 14.
Yield 78%; m.p. 122-123OC; IR (KBr, cm-1):3423 (NH), 2922, 2852 (CH2 - tetrahydronaphtha-lene protons), 2212 (CN); 1H NMR (DMSO-d6, δ,ppm): 1.13 (3H, d, CH3), 1.70, 2.67 (8H, m, 4(CH2)- tetrahydronaphthalene protons), 2.79 (2H, m, CH2
- triazine protons), 3.34 (1H, m, CH - triazine pro-ton), 3.78 (6H, s, 2-OCH3), 6.65-7.89 (7H, m, Ar-Hand pyridine proton), 8.51 (1H, s, NH, exchangeableby D2O); MS, m/z (%): 443 [M+ + 3] (8), 57 [C4H9](100); Analysis: calcd. for C27H28N4O2 (440.54): C,73.61; H, 6.41; N, 12.72%; found: C, 73.50; H, 6.61;N, 12.51%.
3,4-Dihydro-6-(1,2,3,4-tetrahydronaphthalen-6-
yl)-8-(3,4-dimethoxyphenyl)-3-oxo-2H-pyri-
do[2,1-c][1,2,4]triazine-9-carbonitrile (15)
A mixture of compound 5a (0.40 g, 0.001 mol)and ethyl chloroacetate (0.12 mL, 0.001 mol) inethanol (20 mL) was refluxed for 6 h. The formedprecipitate after cooling was filtered, dried andrecrystallized form methanol to give the title com-pound 15.
Yield 58%; m.p. 140-141OC; IR (KBr, cm-1):3448 (NH), 2928, 2852 (CH2 - tetrahydronaphtha-lene protons), 2213 (CN), 1740 (CO, cyclic); 1HNMR (DMSO-d6, δ, ppm): 1.70, 2.67 (8H, m,4(CH2) - tetrahydronaphthalene protons), 3.51 (2H,s, CH2 - triazine protons), 3.79 (6H, s, 2-OCH3),6.71-7.92 (7H, m, Ar-H and pyridine proton), 8.77(1H, s, NH, exchangeable by D2O); MS, m/z (%):429 [C26H27N3O3] (2), 59 [C4H11] (100); Analysis:calcd. for C26H24N4O3 (440.49): C, 70.89; H, 5.49;N, 12.72%; found: C, 70.62; H, 5.38; N, 12.81%.
2,3-Dihydro-5-(1,2,3,4-tetrahydronaphthalen-6-
yl)-7-(3,4-dimethoxyphenyl)-3-oxo-[1,2,4]triazo-
lo[4,3-a]pyridine-8-carbonitrile (16)
A mixture of compound 5a (0.40 g, 0.001 mol)and urea (0.01mol) was heated at 190-200OC for 6 h.After cooling, the reaction mixture was trituratedwith hot water, The formed precipitate was filtered,dried and recrystallized from ethanol to give the titlecompound 16.
Yield 38%; m.p. 203-204OC; IR (KBr, cm-1):3204 (NH), 2927, 2854 (CH2 - tetrahydronaphtha-lene protons), 2218 (CN), 1693 (CO, cyclic); 1HNMR (DMSO-d6, δ, ppm): 1.71, 2.70 (8H, m,4(CH2) - tetrahydronaphthalene protons), 3.83 (6H,s, 2-OCH3), 6.97-7.91 (6H, m, Ar-H and pyridineproton), 8.64 (1H, s, NH, exchangeable by D2O);T
able
1. c
ont.
Gra
m p
ositi
ve b
acte
ria
Gra
m n
egat
ive
bact
eria
Yea
st
Com
poun
dSt
aphy
loco
ccus
Bac
illus
Bac
illus
Sarc
ina
Kle
bsie
llaP
seud
omon
asE
sche
rich
ia
Sacc
haro
myc
esC
andi
daN
o.au
reus
subt
ilis
meg
ater
ium
lute
apn
eum
onia
e ae
rugi
nosa
coli
cere
visi
aeal
bica
nsA
TC
C 2
9213
AT
CC
6633
AT
CC
988
5A
TC
C13
883
AT
CC
2795
3A
TC
C25
922
NR
RL
Y-4
77
17a
1414
1515
2625
2729
26
18a
2016
1518
1818
1717
N.A
.
18b
1418
1616
1715
1420
18
18c
2317
1327
1818
1917
18
18d
18.
1715
1616
1617
1815
Cip
rofl
oxac
in20
2224
2025
2423
N.A
.N
.A.
Ket
ocon
azol
eN
.A.
N.A
.N
.A.
N.A
.N
.A.
N.A
.N
.A.
2322
The
exp
erim
ent w
as c
arri
ed o
ut in
trip
licat
e an
d th
e av
erag
e zo
ne o
f in
hibi
tion
was
cal
cula
ted.
N.A
. = n
ot a
ctiv
e.
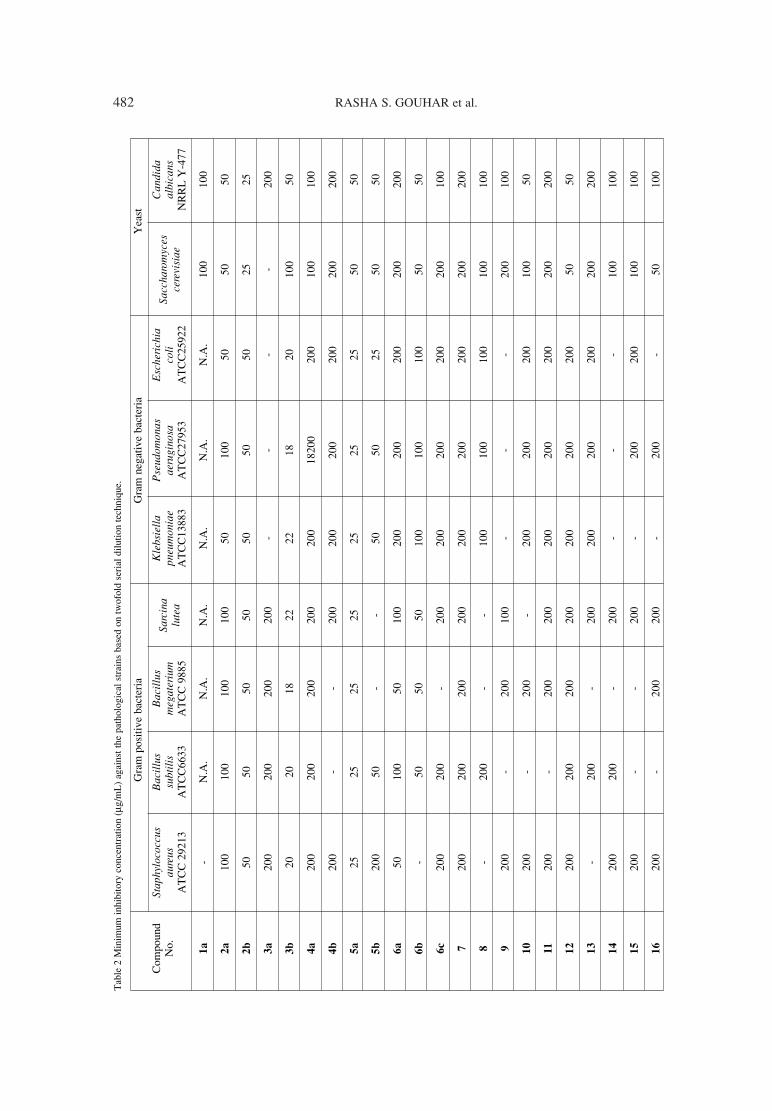
482 RASHA S. GOUHAR et al.T
able
2M
inim
um in
hibi
tory
con
cent
ratio
n (µ
g/m
L)
agai
nst t
he p
atho
logi
cal s
trai
ns b
ased
on
twof
old
seri
al d
ilutio
n te
chni
que.
Gra
m p
ositi
ve b
acte
ria
Gra
m n
egat
ive
bact
eria
Yea
st
Com
poun
dSt
aphy
loco
ccus
Bac
illus
Bac
illus
Sarc
ina
Kle
bsie
llaP
seud
omon
asE
sche
rich
ia
Sacc
haro
myc
esC
andi
daN
o.au
reus
subt
ilis
meg
ater
ium
lute
apn
eum
onia
e ae
rugi
nosa
coli
cere
visi
aeal
bica
nsA
TC
C 2
9213
AT
CC
6633
AT
CC
988
5A
TC
C13
883
AT
CC
2795
3A
TC
C25
922
NR
RL
Y-4
77
1a
-N
.A.
N.A
.N
.A.
N.A
.N
.A.
N.A
.10
010
0
2a
100
100
100
100
5010
050
5050
2b
5050
5050
5050
5025
25
3a
200
200
200
200
--
--
200
3b
2020
1822
2218
2010
050
4a
200
200
200
200
200
1820
020
010
010
0
4b
200
--
200
200
200
200
200
200
5a
2525
2525
2525
2550
50
5b
200
50-
-50
5025
5050
6a
5010
050
100
200
200
200
200
200
6b
-50
5050
100
100
100
5050
6c
200
200
-20
020
020
020
020
010
0
720
020
020
020
020
020
020
020
020
0
8-
200
--
100
100
100
100
100
920
0-
200
100
--
-20
010
0
10
200
-20
0-
200
200
200
100
50
11
200
-20
020
020
020
020
020
020
0
12
200
200
200
200
200
200
200
5050
13
-20
0-
200
200
200
200
200
200
14
200
200
-20
0-
--
100
100
15
200
--
200
-20
020
010
010
0
16
200
-20
020
0-
200
-50
100
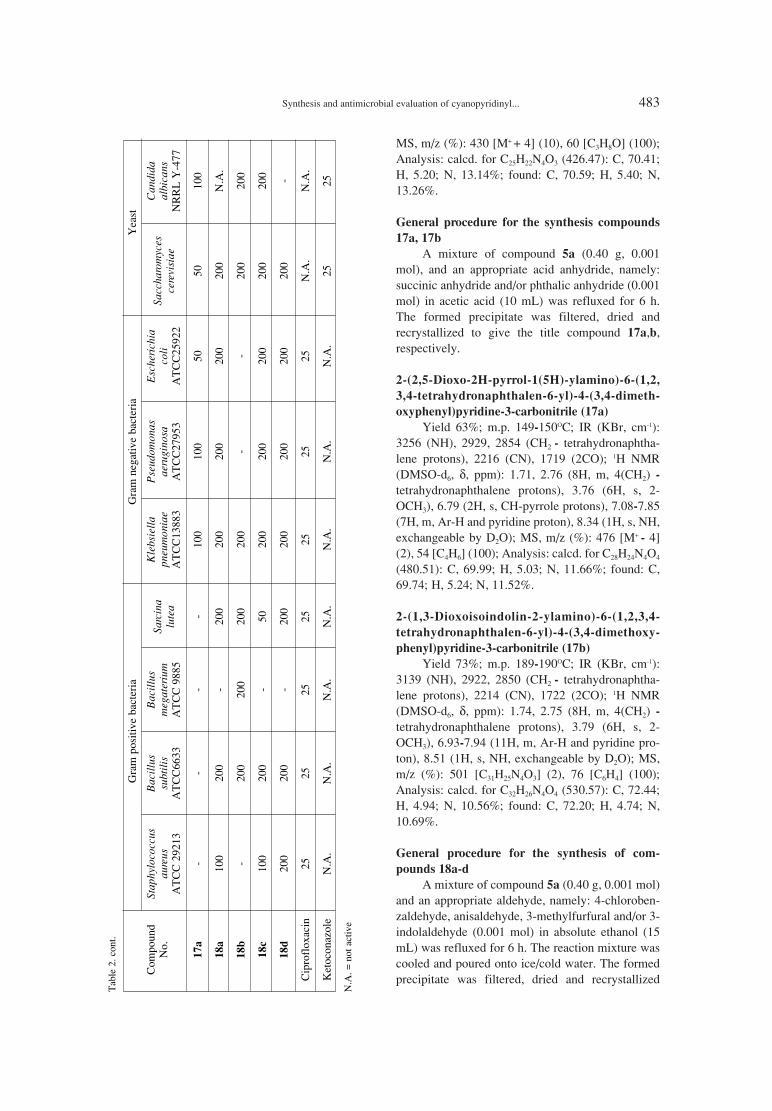
Synthesis and antimicrobial evaluation of cyanopyridinyl... 483
MS, m/z (%): 430 [M+ + 4] (10), 60 [C3H8O] (100);Analysis: calcd. for C25H22N4O3 (426.47): C, 70.41;H, 5.20; N, 13.14%; found: C, 70.59; H, 5.40; N,13.26%.
General procedure for the synthesis compounds
17a, 17b
A mixture of compound 5a (0.40 g, 0.001mol), and an appropriate acid anhydride, namely:succinic anhydride and/or phthalic anhydride (0.001mol) in acetic acid (10 mL) was refluxed for 6 h.The formed precipitate was filtered, dried andrecrystallized to give the title compound 17a,b,respectively.
2-(2,5-Dioxo-2H-pyrrol-1(5H)-ylamino)-6-(1,2,
3,4-tetrahydronaphthalen-6-yl)-4-(3,4-dimeth-
oxyphenyl)pyridine-3-carbonitrile (17a)
Yield 63%; m.p. 149-150OC; IR (KBr, cm-1):3256 (NH), 2929, 2854 (CH2 - tetrahydronaphtha-lene protons), 2216 (CN), 1719 (2CO); 1H NMR(DMSO-d6, δ, ppm): 1.71, 2.76 (8H, m, 4(CH2) -
tetrahydronaphthalene protons), 3.76 (6H, s, 2-OCH3), 6.79 (2H, s, CH-pyrrole protons), 7.08-7.85(7H, m, Ar-H and pyridine proton), 8.34 (1H, s, NH,exchangeable by D2O); MS, m/z (%): 476 [M+ - 4](2), 54 [C4H6] (100); Analysis: calcd. for C28H24N4O4
(480.51): C, 69.99; H, 5.03; N, 11.66%; found: C,69.74; H, 5.24; N, 11.52%.
2-(1,3-Dioxoisoindolin-2-ylamino)-6-(1,2,3,4-
tetrahydronaphthalen-6-yl)-4-(3,4-dimethoxy-
phenyl)pyridine-3-carbonitrile (17b)
Yield 73%; m.p. 189-190OC; IR (KBr, cm-1):3139 (NH), 2922, 2850 (CH2 - tetrahydronaphtha-lene protons), 2214 (CN), 1722 (2CO); 1H NMR(DMSO-d6, δ, ppm): 1.74, 2.75 (8H, m, 4(CH2) -
tetrahydronaphthalene protons), 3.79 (6H, s, 2-OCH3), 6.93-7.94 (11H, m, Ar-H and pyridine pro-ton), 8.51 (1H, s, NH, exchangeable by D2O); MS,m/z (%): 501 [C31H25N4O3] (2), 76 [C6H4] (100);Analysis: calcd. for C32H26N4O4 (530.57): C, 72.44;H, 4.94; N, 10.56%; found: C, 72.20; H, 4.74; N,10.69%.
General procedure for the synthesis of com-
pounds 18a-d
A mixture of compound 5a (0.40 g, 0.001 mol)and an appropriate aldehyde, namely: 4-chloroben-zaldehyde, anisaldehyde, 3-methylfurfural and/or 3-indolaldehyde (0.001 mol) in absolute ethanol (15mL) was refluxed for 6 h. The reaction mixture wascooled and poured onto ice/cold water. The formedprecipitate was filtered, dried and recrystallized
Tab
le 2
. con
t.
Gra
m p
ositi
ve b
acte
ria
Gra
m n
egat
ive
bact
eria
Yea
st
Com
poun
dSt
aphy
loco
ccus
Bac
illus
Bac
illus
Sarc
ina
Kle
bsie
llaP
seud
omon
asE
sche
rich
ia
Sacc
haro
myc
esC
andi
daN
o.au
reus
subt
ilis
meg
ater
ium
lute
apn
eum
onia
e ae
rugi
nosa
coli
cere
visi
aeal
bica
nsA
TC
C 2
9213
AT
CC
6633
AT
CC
988
5A
TC
C13
883
AT
CC
2795
3A
TC
C25
922
NR
RL
Y-4
77
17a
--
--
100
100
5050
100
18a
100
200
-20
020
020
020
020
0N
.A.
18b
-20
020
020
020
0-
-20
020
0
18c
100
200
-50
200
200
200
200
200
18d
200
200
-20
020
020
020
020
0-
Cip
rofl
oxac
in25
2525
2525
2525
N.A
.N
.A.
Ket
ocon
azol
eN
.A.
N.A
.N
.A.
N.A
.N
.A.
N.A
.N
.A.
2525
N.A
. = n
ot a
ctiv
e

484 RASHA S. GOUHAR et al.
from methanol to give the title compound 18a-d,respectively.
2-(2-(4-Chlorobenzylidene)hydrazinyl)-6-(1,2,
3,4-tetrahydronaphthalen-6-yl)-4-(3,4-dimeth-
oxyphenyl)pyridine-3-carbonitrile (18a)
Yield 48%; m.p. 111-112OC; IR (KBr, cm-1):3396 (NH), 2919, 2852 (CH2 - tetrahydronaphtha-lene protons), 2215 (CN); 1H NMR (DMSO-d6, δ,ppm): 1.71, 2.76 (8H, m, 4(CH2) ñ tetrahydronaph-thalene protons), 3.80 (6H, s, 2-OCH3), 7.01-7.98(12H, m, Ar-H, CH=N and pyridine proton), 8.60(1H, s, NH, exchangeable by D2O); MS, m/z (%):415 [M+ - C6HCl] (2), 165, 167 [C8H6ClN2] (100,31); Analysis: calcd. for C31H27ClN4O2 (523.02): C,71.19; H, 5.20; N, 10.71%; found: C, 71.38; H, 5.31;N, 10.57%.
2-(2-(4-Methoxybenzylidene)hydrazinyl)-6-(1,2,
3,4-tetrahydronaphthalen-6-yl)-4-(3,4-dimeth-
oxyphenyl)pyridine-3-carbonitrile (18b)
Yield 55%; m.p. 120-121OC; IR (KBr, cm-1):3423 (NH), 2929, 2838 (CH2 - tetrahydronaphtha-lene protons), 2214 (CN); 1H NMR (DMSO-d6, δ,ppm): 1.68, 2.61 (8H, m, 4(CH2) - tetrahydronaph-thalene protons), 3.79 (6H, s, 2-OCH3), 3.82 (3H, s,-OCH3), 7.05-8.03 (12H, m, Ar-H, CH=N and pyri-dine proton), 8.52 (1H, s, NH, exchangeable byD2O); MS, m/z (%): 506 [C31H30N4O3] (2), 77 [C6H5](100); Analysis: calcd. for C32H30N4O3 (518.61): C,74.11; H, 5.83; N, 10.80%; found: C, 74.24; H, 5.91;N, 10.62%.
2-(2-((5-Methylfuran-2-yl)methylene)hydrazin-
yl)-6-(1,2,3,4-tetrahydronaphthalen-6-yl)-4-(3,4-
dimethoxyphenyl)pyridine-3-carbonitrile (18c)
Yield 60%; m.p. 109-110OC; IR (KBr, cm-1):3422 (NH), 2921, 2851 (CH2 - tetrahydronaphtha-lene protons), 2214 (CN); 1H NMR (DMSO-d6, δ,ppm): 1.72, 2.67 (8H, m, 4(CH2) - tetrahydronaph-thalene protons), 2.22 (3H, s, -CH3), 3.79 (6H, s, 2-OCH3), 5.82-7.95 (10H, m, Ar-H, CH=N and pyri-dine proton), 8.41 (1H, s, NH, exchangeable byD2O); MS, m/z (%): 494 [M+ + 2] (2), 79 [C6H7](100); Analysis: calcd. for C30H28N4O3 (492.57): C,73.15; H, 5.73; N, 11.37%; found: C, 73.30; H, 5.55;N, 11.12%.
2-(2-((1H-indol-3-yl)methylene)hydrazinyl)-6-(1,
2,3,4-tetrahydronaphthalen-6-yl)-4-(3,4-dimeth-
oxyphenyl)pyridine-3-carbonitrile (18d)
Yield 68%; m.p. 131-132OC; IR (KBr, cm-1):3361, 3201 (2NH), 2923, 2854 (CH2 - tetrahydro-naphthalene protons), 2216 (CN); 1H NMR (DMSO-
d6, δ, ppm): 1.74, 2.67 (8H, m, 4(CH2) - tetrahy-dronaphthalene protons), 3.80 (6H, s, 2-OCH3),6.87-7.87 (13H, m, Ar-H, CH=N and pyridine pro-ton), 8.32, 9.21 (2H, s, 2NH, exchangeable by D2O);MS, m/z (%): 496 [M+ - OCH3] (2), 144 [C9H8N2](100); Analysis: calcd. for C33H29N5O2 (527.62): C,75.12; H, 5.54; N, 13.27%: found: C75.27; H, 5.62;N, 13.10%.
Antimicrobial studies
The compounds were individually testedagainst a panel of Gram positive and Gram negativebacterial pathogens, yeast and fungi (Staphylo-coccus aureus, Bacillus subtilis, Bacillus megateri-um, Sarcina lutea, Klebseilla pneumoniae, Pseudo-monas aeruginosa, Escherichia coli, Saccharomycescerevisiae and Candida albicans). Antimicrobialtests were carried out by the agar well diffusionmethod (9) using 100 µL of suspension containing 1◊ 108 CFU/mL of pathological tested bacteria and 1◊ 106 CFU/mL of yeast spread on nutrient agar (NA)and Sabouraud dextrose agar (SDA), respectively.After the media had cooled and solidified, wells (10mm in diameter) were made in the solidified agarand loaded with 100 µL of tested compound solutionprepared by dissolving 200 mg of the chemical com-pound in 1 mL of dimethyl sulfoxide (DMSO). Theinculcated plates were then incubated for 24 h at37OC for bacteria and 48 h at 28OC for fungi.Negative controls were prepared using DMSOemployed for dissolving the tested compound.(ciprofloxacin (50 mg/mL) and ketoconazole (50mg/mL)) were used as standard for antibacterial andantifungal activity, respectively. Ciprofloxacin andketoconazole were used as standards because theyhave abroad spectra antibiotic widely used. Afterincubation time, antimicrobial activity was evaluat-ed by measuring the zone of inhibition against thetest organisms and compared with that of the stan-dard. The observed zone of inhibition is presented inTable 1. Antimicrobial activities were expressed asinhibition diameter zones in millimeters (mm). Theexperiment was carried out in triplicate and the aver-age zone of inhibition was calculated.
Minimal inhibitory concentration (MIC) meas-
urement
The bacteriostatic activity of the active com-pounds (having inhibition zones (IZ) = 16 mm) wasthen evaluated using the twofold serial dilution tech-nique (10). Twofold serial dilutions of the testedcompounds solutions were prepared using the prop-er nutrient broth. The final concentration of the solu-tions were 200,100, 50, 25 µg /mL. Each 5 mL

Synthesis and antimicrobial evaluation of cyanopyridinyl... 485
received 0.1 mL of the appropriate inoculums andincubated at 37OC for 24 h for bacteria and 48 h at28OC for fungi. The lowest concentration showingno growth was taken as the minimum inhibitoryconcentration (MIC) (Table 2).
RESULTS AND DISCUSSION
Chemistry
The target compounds were synthesizedaccording to steps outlined in Schemes 1 and 2. Thekey intermediates 6-(1,2,3,4-tetrahydronaphthalen-6-yl)-2-mercapto-4-(3,4-substituted-phenyl) pyri-dine-3-carbonitrile 2a,b were prepared by the treat-ment of 1,2-dihydro-6-(1,2,3,4-tetrahydronaph-thalen-6-yl)-4-(substituted phenyl)-2-oxopyridine-3-carbonitrile 1a,b with phosphorus pentasulfide indry pyridine. Mass spectra of compounds 2a,bshowed molecular ion peak at 402 and 360, respec-tively.
Treatment of the key intermediates 2a,b withchloroacetone and/or ethyl chloroacetate producedthe corresponding derivatives 3a,b and 4a,b, respec-tively. IR spectra of compounds 3a,b showed bandsat 1702, 1709 cm-1 due to (CO) group and its 1H
NMR showed singlet signals at δ 2.28, 2.17 ppm dueto methyl group and also singlet signals at δ 4.10,4.12 ppm of methylene group. However, IR spectraof compounds 4a,b showed bands at 1725 and 1740cm-1 due to (CO) ester group and its 1H NMR spec-tra exhibited the ester group signals at δ 1.29, 4.16and 1.24, 4.13 ppm, respectively.
Condensation of 4a,b with hydrazine hydrateafforded hydrazide derivatives 5a,b and their IRspectra showed bands at 3245, 3177 and 3336, 3208cm-1, respectively, due to (NHNH2) group.Compound 5a was allowed to react with differentsubstituted isothiocyanates, namely: methyl isothio-cyanate, ethyl isothiocyanate and/or phenyl isothio-cyanate, to give the corresponding substitutedthiosemicarbazides 6a-c. 1H NMR of compound 6a
showed singlet signal at δ 2.56 ppm due to methylgroup and 6b showed signals at δ 1.05 and 3.51 ppmdue to ethyl group.
Moreover, 5a undergo reaction withchloroacetic acid to give the corresponding deriva-tive 7 and its 1H NMR showed singlet signal at δ3.51 ppm due to methylene group. Also, reaction ofcompound 5a with iodomethane gave the methylhy-drazide derivative 8. 1H NMR showed singlet signal
Scheme 1. Synthesis of hydrazide pyridines of tetrahydronaphthalene

486 RASHA S. GOUHAR et al.
at δ 2.56 ppm due to methyl group. In addition, reac-tion of 5a with acetic anhydride yielded acetohy-drazide derivative 9. 1H NMR showed singlet signalat δ 2.21 ppm due to methyl group. (Scheme 1).
The hydrazide derivative 5a is very usefulintermediate for further cyclocondensation reac-tions. Thus, cyclocondensation of 5a with activemethylene derivatives, namely; acetylacetone, ethylacetoacetate, diethylmalonate and ethyl cyanoac-etate, yielded the corresponding pyrazole deriva-tives 10-13, respectively. 1H NMR spectrum of com-pound 10 showed singlet signals at δ 2.94 and 6.01ppm due to methyl group and CH of pyrazole moi-ety. Also, 1H NMR spectrum of compound 11
showed singlet signal at δ 2.02 and 2.21 ppm due tomethyl group and CH2 of pyrazolinone moiety. IRspectrum of compound 12 showed bands at 1735and 1633 cm-1 due to the two carbonyl groups ofpyrazoldione moiety. IR spectrum of compound 13
showed band at 1736 cm-1 due to CO group. In addi-tion, cyclocondensation of 5a with chloroacetoneand/or ethyl chloroacetate gave the correspondingtriazine derivatives 14 and 15, respectively. 1HNMR spectrum of compound 14 showed doubletsignal at δ 1.13 ppm and multiple signals at δ 2.79,3.34 ppm due to CH3, CH2 and CH groups of triazinemoiety. IR spectrum of compound 15 showed bandat 1740 cm-1 due to carbonyl group of triazine moi-
ety. Also, cyclocondensation of 5a with urea afford-ed the corresponding triazole derivative 16.
Moreover, condensation of 5a with acid anhy-drides, namely: maleic anhydride and/or phthalic anhy-dride yielded pyrrole and isoindoline derivative 17a,b.respectively. A series of new Schiff bases 18a-d weresynthesized by the condensation of hydrazide deriva-tive 5a with various substituted aromatic aldehydes,namely: 4-chlorobenzaldehyde, anisaldehyde, 5-methylfurfural and/or indole-3-aldehyde. The 1H NMRspectrum of 18b showed the three methoxy groups at δ3.79 and 3.82 ppm while 1H NMR of 18c showed sig-nal at δ 2.22 ppm of methyl group of furan ring.
Antimicrobial activity
Most of the newly synthesized compoundswere evaluated for their in vitro antibacterial activi-ty against Staphylococcus aureus ATCC 29213,Bacillus subtilis ATCC6633, Bacillus megateriumATCC 9885 and Sarcina lutea as examples of Grampositive bacteria and Klebsiella pneumoniae ATCC13883, Pseudomonas. aeruginosa ATCC 27953 andEscherichia coli ATCC 25922 as examples of Gramnegative bacteria. They were also evaluated for theirin vitro antifungal activity against Saccharomycescerevisiae and Candida albicans NRRL Y-477.
Agar diffusion method was used for determi-nation of the antimicrobial activity using ciproflox-
Scheme 2. Synthesis of different heterocycles of tetrahydronaphthalene

Synthesis and antimicrobial evaluation of cyanopyridinyl... 487
acin and ketoconazole as reference drugs. Theresults were recorded for each tested compounds asthe average diameter as inhibition zones (IZ) of bac-terial or fungal growth around the discs in mm(Table 1).
Minimum inhibitory concentration (MI) meas-urements were determined for the compounds(Table 2).
According to the obtained results (Tables 1, 2),it can be noticed that the parent starting compound3,4-dimethoxyphenylpyridine 1a and its thioxopyri-dine derivative 2a produced weak to completeinsensitivity towards the tested Gram positive andGram negative bacterial strains. Also, the attach-ment of sulfur group of 2a to ketone and ethyl esterside chains 3a, 4a did not improve the antibacterialactivity. In comparison, the attachment of 4-fluo-rophenyl ring to the thioxopyridine ring in 2b
enhanced the activity of Gram positive and Gramnegative bacterial growth inhibition to be half of thatobtained by ciprofloxacin (MIC: 50, 25 µg/mL,respectively).
Broad spectrum of antibacterial activity greaterthan that obtained by the reference drugs wasobtained upon the attachment of a methyl ketoneside chain to the sulfur group of 2b to get the deriv-ative 3b (MIC 18-22 µg/mL). A noteworthyenhancement in the activity against both Gram pos-itive and Gram negative bacteria to be equal to thatobtained by ciprofloxacin was gained by hydrazi-nolysis of the parent 2a to give the hydrazine pyri-dine derivative 5a (MIC: 25 µg/mL).
At the same time, the incorporation of ahydrazide side chain to the sulfur group 5b producedsensitivity towards the tested Gram negative bacte-ria (MIC 25-50 µg/mL) but complete loss of activi-ty against Gram positive bacterial strain, while theconversion of side chain to thiosemicarbazide 6a-cenhanced the sensitivity of the compounds againstGram positive bacteria used in the experiment(MIC: 50-100 µg/mL), but unfortunately led to greatreduction of the activity towards Gram negative bac-teria.
It is noticeable that the incorporation of differ-ent heterocyclic rings to the parent 3,5-dimethoxypyridine ring such as oxadiazole, tri-azinephenyl, thiazolo, triazine, pyrazole and differ-ent substituted triazinephenyl rings did not offer anyadvantage in the antibacterial activity against bothGram positive and Gram negative bacteria.
The data obtained revealed that the listed com-pounds have weak antifungal activity except theparent 4-fluoropyridine derivative 2b, whichshowed equipotent antifungal activity to thatobtained by the reference ketoconazole (MIC: 25µg/mL).
CONCLUSION
The antimicrobial evaluation of most of thenewly prepared compounds exhibited that highbroad spectrum activity against both Gram positiveand Gram negative was gained by the parent 3,4-dimethoxypyridine derivative attached to hydrazineside chain 5a and also by the parent thioxopyridinecompound bearing 4-fluorophenyl group 2b and itsketone derivative 3b. Interestingly, 2b is the onlyderivative that exhibited dual antibacterial and anti-fungal activity.
REFERENCES
1. Akram Khan M., Miller K., Rainsford K. D.,Yong Zhou Y.: Molecules 18, 3227 (2013).
2. Singh N., Sharma U.S., Sutar N., Kumar S.,Sharma U.K.: J. Chem. Pharm. Res. 2, 691(2010).
3. Shetty N.S., Lamani R.S., Khazi I.A.M.: J.Chem. Sci. 121, 301 (2009).
4. Ates-Alagoz Z., Yildiz S., Buyukbingol E.:Chemotherapy 53, 110 (2007).
5. Mamolo M.G., Zampieri D., Falagiani V., VioL., Fermeglia M., Ferrone M., Pricl S. et al.:Arkivoc 5, 231 (2004).
6. Shah N.M., Patel M.P., Patel R.G.: J. Chem.Sci. 124, 669 (2012).
7. Patil R., Mandawad G., Sirsat S., Patil A.,Kalyankar M.: IOSR J. Pharm. 2, 137 (2012).
8. Amin K.M., El-Zahar M.I., Anwar M.M.,Kamel M.M., Mohamed M.H.: Acta Pol.Pharm. Drug Res. 66, 279 (2009).
9. Perez C., Pauli M., Bazevque P.: Acta Biol.Med. Exp. 15, 113 (1990).
10. Scott A.C.: Laboratory control of antimicrobialtherapy. In: Mackie & McCartney Practicalmedical microbiology, Collee J.G., Duguid J.P.,Fraser A.G. and Marmion B.P. Eds., 13th edn.,Vol 2, 161-181, Churchill Livingstone, Edin-burgh 1989.
Received: 2. 04. 2014


Acta Poloniae Pharmaceutica ñ Drug Research, Vol. 72 No. 3 pp. 489ñ496, 2015 ISSN 0001-6837Polish Pharmaceutical Society
Many aromatic and heterocyclic acid benzyl-amides have been synthesized in search for newanticonvulsants (1-5). Some of them have beenreported to be potent agents. Kohn et al. noticed sig-nificant role of benzyl fragment of these compounds(6, 7). They observed that electron-withdrawingsubstituents in benzyl moiety are able to increaseanticonvulsant activity (8). The benzyl fragmentcould be also distinguished in the molecule ofbiphenyl, which derivatives are pharmacologicallyactive affinity baits, chemical reactive units (9). Thebenzyl substituents change the hydrophobicity andmolecular shape of the compounds, which deter-mines their mechanism of action. Benzylamides ofaromatic and heterocyclic acids are antagonists ofexcitatory amino acids. Up to now, no univocal datahave been reported regarding the structure of thebinding sites of the receptor. Therefore, a good wayto obtain better anticonvulsants could be to modifythe structure of the active compounds obtained ear-lier, which are mother compounds. Here, the pur-pose of the study was to evaluate if the incorporation
of electron-withdrawing halogen substituent into thebenzyl ring of previously obtained pharmacological-ly active compounds is able to improve the activityof the mother compounds. The design of new anti-convulsants can be assisted by comparison of thehydrophobicity and molecular shape of the synthe-sized halogenated compound with those propertiesof the mother compounds. Therefore, log P values ofthe partition coefficient between n-octanol andwater of the compounds have been taken under con-sideration. As it was found previously, the optimallog P value of active benzylamide anticonvulsantsought to be > 0 and probably near to 3 (5). This scaleis the best compromise between water and lipidspartition of the designed anticonvulsants. Log P val-ues of the halogenated compounds probably shouldnot be excessively different from the values of themother structures. Superimposing structures of halo-genated compounds on the mother structures can, atleast theoretically, let us evaluate if the receptoraffinity of both is similar, thus providing additionalinformation of structure elements crucial for phar-
SYNTHESIS AND STUDY OF HALOGENATED BENZYLAMIDES OF SOME ISOCYCLIC AND HETEROCYCLIC ACIDS AS POTENTIAL
ANTICONVULSANTS
MARZANNA STRUPI—SKA1*, GRAØYNA ROSTAFI—SKA-SUCHAR1, ELØBIETA PIRIANOWICZ-CHABER1, MATEUSZ GRABCZUK1, MAGDALENA J”ZWENKO1,
HUBERT KOWALCZYK1, JOANNA SZUBA1, MONIKA W”JCICKA1, TRACY CHEN 2, and ALEKSANDER P. MAZUREK1,3
1Department of Drug Chemistry, Medical University of Warsaw, Banacha 1, 02-097 Warszawa, Poland2Epilepsy Branch, National Institute of Neurological Disorders and Stroke, Rockville, MA 20852, USA
3 National Medicines Institute, Che≥mska 30/34, 00-725 Warszawa, Poland
Abstract: A series of potential anticonvulsants have been synthesized. There are eight fluorobenzylamides andthree chlorobenzylamides of isocyclic or heterocyclic acids. Two not halogenated benzylamides were also syn-thesized to compare the effect of halogenation. The aim of the research performed was to evaluate whether halo-genation of the mother structure is able to improve its anticonvulsant activity. The compounds were tested inAnticonvulsant Screening Project (ASP) of Antiepileptic Drug Development Program (ADDP) of NIH.Compound 1 showed MES ED50 = 80.32 mg/kg, PI = 3.16. Compound 7 showed CKM ED50 = 56.72 mg/kg.Compound 8 showed MES ED50 = 34.23 mg/kg and scPTZ ED50 > 300 mg/kg, PI = 8.53.Compound 13 showed6Hz ED50 = 78.96, PI = 3.37. The results indicate that fluorination does not improve activity, whereas chlori-nation in our experiment even reduces it.
Keywords: anticonvulsants, chlorobenzylamides, fluorobenzylamides of isocyclic and heterocyclic acids
489
* Corresponding author: e-mail: [email protected]

490 MARZANNA STRUPI—SKA et al.
macological activity. The change of affinity couldincrease as well as decrease the pharmacologicalaction of the new synthesized compounds in com-parison to the mother structures.
EXPERIMENTAL
Chemistry
All used acids: 3-oxocyclopentanecarboxylicacid, 2-oxocyclopentaneacetic acid, coumarin-3-carboxylic acid, isoquinoline-3-carboxylic acid, 1-cyclopentenecarboxylic acid, picolinic acid N-oxide, 5-methylfurancarboxylic acid, isoquino-line-1-carboxylic acid and furan-2-carboxylic acidwere purchased from Aldrich. Other reagents asisobutyl chloroformate, N-methylmorpholine,benzylamine, 2-chlorobenzylamine, 2-fluoroben-zylamine and 4-fluorobenzylamine were supplied
by Merck. DMF and THF were from POCHGliwice.1H NMR spectra were recorded on aBruker DM 400 MHz spectrometer. Chemicalshifts were measured as δ units (ppm) relative totetramethylsilane. TLC was carried out on a 0.25mm thickness silica gel plates (Merck Kieselgel 60F-254). The spots were visualized in UV light orwith 0.3% ninhydrin in EtOH (97 : 3). The solventsystem used in TLC was CHCl3/MeOH in differentratios. HPLC was performed on a Shimadzu chro-matograph equipped with LC-10AT pump, SPD-10A UV spectrophotometer and a computer regis-trator/recorder (CHROMA POLLAB, Warszawa).The peaks were recorded at 210 nm. Elementalanalysis was performed on an ElementarAnalysensysteme GmbH ñ vario El III ElementAnalyzer. Melting points were determined in aBˆetius apparatus.
Scheme 1. Synthesis of compounds 1-13

Synthesis and study of halogenated benzylamides of some isocyclic... 491
Synthesis of amides
Compounds 1-13 were synthesized using themixed anhydrides method of peptide synthesis (10).Suitable acid (10 mmol) was dissolved in DMF (15mL) and THF (15 mL) was added. Next, N-methyl-morpholine (10 mmol, 1.1 mL) was added and themixture was stirred under nitrogen and chilled to -15OC. Isobutyl chloroformate (10 mmol, 1.3 mL)was added dropwise to keep the temperature below-15OC. Then, benzylamine or halogenated benzyl-amine (10 mmol) in THF was added in small por-tions and the reaction mixture was stirred at -15OCfor 30 min, at room temperature for 1 h. The solu-tion was concentrated in vacuo and the residue wasdissolved in EtOAc (20 mL). This solution waswashed with 20 mL portions of 1 M HCl, saturatedNaHCO3 solution and saturated NaCl solution, thendried with anhydrous MgSO4, filtered and concen-trated in vacuo. The obtained compounds were puri-fied by crystallization with EtOAc/hexane orMeOH/Et2O. All stages of the synthesis were con-trolled by TLC. The purity of the final compoundwas determined by HPLC and identity by 1H NMR.The pathway for the synthesis of the obtained com-pounds is shown in Scheme 1.
Computer calculations
The HyperChem 4.5 (Hypercube, Inc.) pro-gram was used. The semiempirical method PM 3
was applied for a single point calculation. Geometryoptimization was performed by the Polak-Ribierealgorithm. Afterward, the QSAR Properties moduleusing atomic parameters derived by Ghose et al. (11)was applied to calculate log P values as a measure ofthe hydrophobicity of the optimized structures of thecompounds. RMS Fit module was used for overlap-ping the molecular structures of the compounds.
Pharmacology
All the synthesized compounds (1-13) wereevaluated qualitatively in anticonvulsant identifica-tion system (ASP) ñ 6 Hz 32 mA and TOX tests.Compounds 1, 2 and 5-13 were evaluated also inMES test (Table 3). The MES and TOX tests wereperformed in mice after i.p. administration, accord-ing to the method described by Krall et al. (12). Theminimal clonic seizure (6 Hz 32 mA) test was usedto assess compoundís efficacy against electricallyinduced seizures but using a lower 6 Hz frequencyand longer duration time ñ 3 s. The test was accom-plished by the Barton et al. method (13). This testwas performed, because some compounds ineffec-tive in standard MES or scPTZ tests still have anti-convulsant activity in vivo. All the synthesized com-pounds (1-13) were evaluated qualitatively also inrats after i.p. and p.o. administration in MES andTOX tests (Table 4). The tests were performedaccording to the method of Krall et al. (12). Some
Table 1. Physical and analytical data of the synthesized compounds.
Compound Formula M.w.
M.p. log. P*No. OC
1 C13H15NO2 217.26 87-89 1.95
2 C14H17NO2 231.30 101-102 2.35
3 C17H13ClN2O 296.71 110-111 3.84
4 C17H12ClNO3 313.75 186-188 3.19
5 C17H13ClN2O 296.75 133-134 3.84
6 C13H14FNO 219.26 111-114 2.74
7 C13H14FNO 219.26 86-87 2.74
8 C13H11FN2O2 246.24 123-124 1.21
9 C14H16FNO2 249.30 123-125 2.49
10 C14H16FNO2 249.30 107-108 2.49
11 C13H12FNO2 233.25 74-76 0.91
12 C17H13FN2O 280.30 68-70 3.47
13 C12H10FNO2 219.22 119-120 1.35
HPLC purity of the all compounds was 100%. The elemental analyses were within ± 0.4% of the theoreticalvalue. * Hydrophobicity of the compounds is expressed as log P value calculated by a computational method.

492 MARZANNA STRUPI—SKA et al.
Table 2. 1H NMR spectra in CDCl3 of the synthesized compounds.
Compound Chemical shift in δ (ppm) in CDCl3
1 2.11-2.27 (m, 3H), 2.31-2.64 (m, 4H), 2.84-2.92 (m, 1H CH), 4.46 (d, J = 5.0 Hz 2H, CH2), 5.90(s 1H, NH), 7.26-7.35 (m, 4H).
2 1.35-1.81 (m, 4H), 2.08-2.19 (m, 2H), 2.38-2.46 (m, 1H, CH), 4.45-4.60 (m, 2H), 7.22-7.37 (m, 8H).
3 4.83 (d, J = 5 Hz, 2H, CH2), 7.22-7.26 (m, 2H, 2◊CH), 7.38-7.41 (m, 1H, CH) 7.52-7.56 (m, 1H, CH), 7.69-7.79 (m, 2H, 2◊CH), 7.87 (t, J = 4.1 Hz, 2H, 2◊CH) 8.48 (d, J = 5.7 Hz, 1H, CH), 8.79 (s, br, 1H, NH), 9.57 (d, J = 8.6 Hz, 1H, CH).
4 4.75 (d, J = 7.5 Hz, 2H, CH2), 7.22-7.26 (m, 2H), 7.35-7.46 (m, 5H), 7.64-7.70 (m, 3H), 8.39 (s, 1H, CH), 9.29 (s, br, 1H, NH).
5 4.83 (d, J = 4.7 Hz, 2H, CH2), 7.20-7.26 (m, 2H, 2◊CH), 7.40 (d, J = 9 Hz, 1H,CH), 7.50 (d, J = 9 Hz, 1H, CH), 7.71 (t, J = 6.0 Hz, 1H, CH), 7.75 (t, J = 6.0 Hz, 1H, CH),7.98-8.06 (m, 2H, 2xCH), 8.64 (s, 1H, CH), 8.69 (s br, 1H, NH), 9.16 (s, 1H, CH).
6 1.94-2.04 (m, 2H, CH2), 2.45-2.55 (m, 4H), 4.47 (d, J = 4.8 Hz, 2H, CH2), 5.88 (s br, 1H, NH), 6.56 (t, J = 5.0Hz, 1H, CH), 7.00 (t, J = 6.5 Hz 2H, CH2), 7.25-7.29 (m, 2H).
7 1.94-2.03 (m, 2H, CH2), 2.45-2.59 (m, 4H, 2◊CH2), 4.54 (d, J = 5.0, 2H, CH2), 5.97 (s br, 1H, NH), 6.55 (t, J = 6.5, 1H, CH), 7.08 (q, 2H, 2xCH), 7.23-7.30 (m, 1H, CH), 7.37 (t, J = 6.0, 1H, CH).
8 4.74 (d, J = 5.4 Hz, 2H, CH2 ), 7.0-7.13 (m, 2H, 2◊CH), 7.22-7.29(m, 1H, CH), 7.36-7.48 (m, 3H, 3◊CH), 8.24 (d, J = 6.0 Hz, 1H, CH), 8.46 (d, J = 5.5 Hz, 1H, CH), 11.6 (s br, 1H, NH).
9 1.33-1.44 (m, 1H), 1.48-1.60 (m, 1H), 1.67-1.83 (m, 3H), 2.11-2.19 (m, 2H), 2.40-2.49 (m, 1H), 2.80-2.89 (m, 1H), 3.45 (s br, 1H), 4.48-4.69 (m, 2H, CH2), 6.99-7.12 (m, 2H), 7.20-7.27 (m, 1H), 7.39-7.44 (m, 1H).
10 1.33-1.50 (m, 2H), 1.61-1.75 (m, 3H), 2.05-2.18 (m, 2H), 2.43 (q, J = 2 Hz, 1H), 2.71-2.81 (m, 1H), 3.44 (s br, 1H, NH), 4.46 (q, 2H, CH2), 6.98 (t, J = 1.Hz, 2H, CH2), 7.26-7.35 (m, 2H).
11 2.32 (s, 3H, CH3), 4.56 (d, J = 5.5 Hz, 2H, CH2), 6.09, 6.10 (dd, J = 0,6 Hz, 0.6 Hz, 1H, CH), 6.59 (s br, 1H, NH), 6.98-7.06 (m, 4H), 7.26-7.34 (m, 2H).
12 4.71 (d, J = 7.7 Hz, 2H, CH2), 7.03 (t, J = 6.0 Hz, 2H, 2◊CH), 7.35-7.40 (m, 2H), 7.68-7.81 (m, 2H), 8.01 (t, J = 5 Hz, 2H, 2◊CH), 8.57 (s br, 1H, NH), 8.65 (s, 1H, CH), 9.14 (s, 1H, CH).
13 4.58 (d, J = 6.0 Hz, 2H, CH2), 6.50-6.52 (m, 1H, CH), 6.64 (s br, 1H, NH), 7.00-7.06 (m, 2H, 2◊CH), 7.14 (d, J = 3.7 Hz, 1H, CH), 7.29-7.34 (m, 2H, 2◊CH), 7.42 (d, J = 1.5 Hz, 1H, CH).
Table 3. Anticonvulsant identification. Qualitative tests in mice, i.p.
Compound MES, 0.5 h TOX, 0.5 h 6 Hz, 0.5 h No. mg/kg prot./used mg/kg prot./used mg/kg prot./used
1 100 3/4 300 6/8 300 4/4
2 300 4/4 300 3/8 100 2/4
3 ND ND 100 0/4 100 1/4
4 ND ND 100 0/4 100 0/4
5 300 0/4 300 1/8 300 0/4
6 300 4/4 300 0/8 300 4/4
7 100 4/4 300 7/8 100 2/4
8 300 4/4 300 1/8 300 3/4
9 300 0/4 300 0/8 300 2/4
10 300 4/4 300 8/8 300 4/4
11 100 2/4 300 6/8 100 3/4
12 100 1/4 300 0/8 300 3/4
13 300 4/4 300 0/8 100 2/4
MES = maximal electroshock seizure test. 6Hz = psychomotor minimal clonic seizure test, model 32 mA (ASP).TOX = neurological tox-icity rotorod test. ND = not determined.
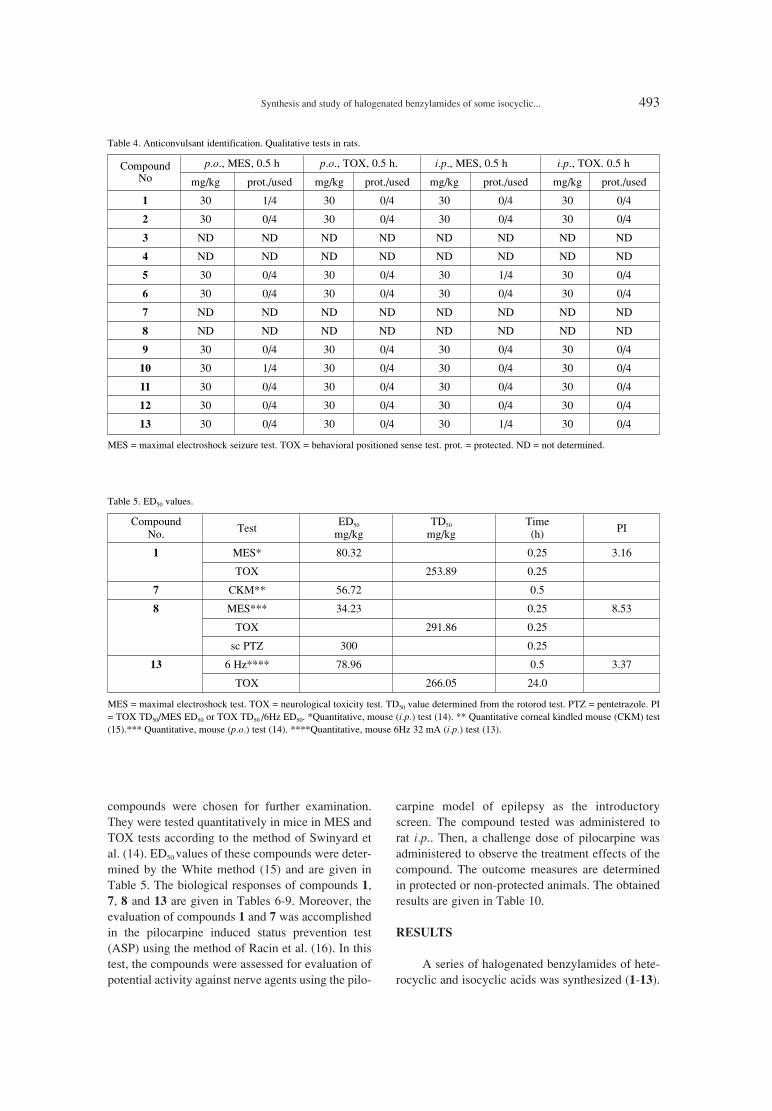
Synthesis and study of halogenated benzylamides of some isocyclic... 493
compounds were chosen for further examination.They were tested quantitatively in mice in MES andTOX tests according to the method of Swinyard etal. (14). ED50 values of these compounds were deter-mined by the White method (15) and are given inTable 5. The biological responses of compounds 1,7, 8 and 13 are given in Tables 6-9. Moreover, theevaluation of compounds 1 and 7 was accomplishedin the pilocarpine induced status prevention test(ASP) using the method of Racin et al. (16). In thistest, the compounds were assessed for evaluation ofpotential activity against nerve agents using the pilo-
carpine model of epilepsy as the introductoryscreen. The compound tested was administered torat i.p.. Then, a challenge dose of pilocarpine wasadministered to observe the treatment effects of thecompound. The outcome measures are determinedin protected or non-protected animals. The obtainedresults are given in Table 10.
RESULTS
A series of halogenated benzylamides of hete-rocyclic and isocyclic acids was synthesized (1-13).
Table 4. Anticonvulsant identification. Qualitative tests in rats.
Compound p.o., MES, 0.5 h p.o., TOX, 0.5 h. i.p., MES, 0.5 h i.p., TOX. 0.5 hNo mg/kg prot./used mg/kg prot./used mg/kg prot./used mg/kg prot./used
1 30 1/4 30 0/4 30 0/4 30 0/4
2 30 0/4 30 0/4 30 0/4 30 0/4
3 ND ND ND ND ND ND ND ND
4 ND ND ND ND ND ND ND ND
5 30 0/4 30 0/4 30 1/4 30 0/4
6 30 0/4 30 0/4 30 0/4 30 0/4
7 ND ND ND ND ND ND ND ND
8 ND ND ND ND ND ND ND ND
9 30 0/4 30 0/4 30 0/4 30 0/4
10 30 1/4 30 0/4 30 0/4 30 0/4
11 30 0/4 30 0/4 30 0/4 30 0/4
12 30 0/4 30 0/4 30 0/4 30 0/4
13 30 0/4 30 0/4 30 1/4 30 0/4
MES = maximal electroshock seizure test. TOX = behavioral positioned sense test. prot. = protected. ND = not determined.
Table 5. ED50 values.
Compound Test
ED50 TD50 Time PINo. mg/kg mg/kg (h)
1 MES* 80.32 0.25 3.16
TOX 253.89 0.25
7 CKM** 56.72 0.5
8 MES*** 34.23 0.25 8.53
TOX 291.86 0.25
sc PTZ 300 0.25
13 6 Hz**** 78.96 0.5 3.37
TOX 266.05 24.0
MES = maximal electroshock test. TOX = neurological toxicity test. TD50 value determined from the rotorod test. PTZ = pentetrazole. PI= TOX TD50/MES ED50 or TOX TD50 /6Hz ED50. *Quantitative, mouse (i.p.) test (14). ** Quantitative corneal kindled mouse (CKM) test(15).*** Quantitative, mouse (p.o.) test (14). ****Quantitative, mouse 6Hz 32 mA (i.p.) test (13).

494 MARZANNA STRUPI—SKA et al.
Physico-chemical data of the synthesized com-pounds are given in Tables 1 and 2, the results ofpreliminary pharmacological tests in Tables 3ñ10.Compound 1 showed MES ED50 = 80.32 mg/kg, PI= 3.16. Compound 7 showed in quantitative cornealkindled mouse test CKM ED50 = 56.72 mg/kg.Compound 8 showed MES ED50 = 34.23 mg/kg andscPTZ ED50 = 300 mg/kg, PI = 8.53. Compound 13
showed 6Hz ED50 = 78.96, PI = 3.37.
DISCUSSION
A series of isocyclic and heterocyclic acidsbenzylamides were previously obtained in search fornew effective anticonvulsants (1-5). Preliminaryanticonvulsant identification tests (ASP) allow todefine the structure elements of this group of com-pounds conditioning pharmacologically advanta-geous properties. It was found that 5-membered
Table 6. Biological response of 1 (mice i.p.).
Test Time (h) Dosage (mg/kg) Protected/used
MES 0.25 50 0/8
MES 0.25 75 4/8
MES 0.25 100 6/8
MES 0.25 150 8/8
scPTZ 0.25 255 2/8
TOX 0.25 150 0/8
TOX 0.25 225 2/8
TOX 0.25 260 3/8
TOX 0.25 300 8/8
MES = maximal electroshock test. TOX = neurological neurotoxicity test. PTZ = pentetrazole.
Table 7. Biological response of 7 (corneal kindled mouse).
Test Time (h) Dosage (mg/kg) Protected/used
CKM 0.5 25 0/8
CKM 0.5 50 3/8
CKM 0.5 65 5/8
CKM 0.5 100 8/8
CKM = corneal kindled mouse.
Table 8. Biological response of 8 (mice p.o.).
Test Time (h) Dosage (mg/kg) Protected/used
MES 0.25 10 0/8
MES 0.25 30 4/8
MES 0.25 50 5/8
MES 0.25 70 8/8
scPTZ 0.25 300 0/8
TOX 0.25 150 1/8
TOX 0.25 200 1/8
TOX 0.25 300 3/8
TOX 0.25 500 8/8
MES = maximal electroshock test. TOX = neurological neurotoxicity test. PTZ = pentetrazole.

Synthesis and study of halogenated benzylamides of some isocyclic... 495
structure of acid is especially useful. Substituents ofthe ring, presence of heteroatoms or double bondsdo not have a decisive influence upon the activity.However, among the benzylamides of 6-memberedacids and bicyclic 6-membered acids there were alsosome compounds with poor anticonvulsant activity.Electron-withdrawing groups on benzylamide siteare able to increase the anticonvulsant activity.Therefore, it was decided to halogenate some previ-ously obtained most active structures. Also therewere obtained six fluorinated benzylamides of iso-cyclic 5-membered acids (6, 7, 9, 10, 11 and 13) andone fluorinated benzylamide of 6-membered hetero-cyclic acid (8). Also there were obtained one fluori-nated (12) and three chlorinated (3, 4, 5) benzyl-amides of bicyclic 6-membered acid. It was decidedto synthesize two new benzylamides of isocyclicacid (1, 2) and to fluorinate them (9, 10) for com-parison of the activity. All the synthesized com-pounds were screened in qualitative tests (ASP): inmice, i.p. (MES, 6 Hz 32 mA, TOX) (Table 3) andin rats, p.o. and i.p. (MES, TOX) (Table 4). On thebasis of the preliminary results some compounds (1,7, 8 and 13) were put to further tests. There wereperformed the following tests (ASP): ED50 valuesdetermination (Table 5), biological response deter-mination (Tables 6-9), pilocarpine-induced status,and response data (Table 10). The results lead to theconclusion that the fluorination of the active mother
structure does not improve anticonvulsant activity(similar activity of compounds 6-13 and mothercompound (N-oxidepicolinic acid benzylamide (2),1-cyclopentenecarboxylic acid benzylamide (4), 2-furoic acid benzylamide (4), 5-methyl-2-furoic acidbenzylamide (4), 3-isoquinolinecarboxylic acid ben-zylamide (4), 2-oxocyclopentaneacetic acid benzyl-amide (2)). All the obtained fluorinated compoundsshow strong anticonvulsant activity and low neuro-toxicity. On the other hand chlorination of the moth-er compounds yields derivatives of decreased activ-ity or not active at all (high activity of mother com-pound - 3-isoquinolinecarboxylic acid benzylamide(4) and lack of activity of compounds 4 and 5). Theimportant property of the structure related to bio-molecular interaction is hydrophobicity of the com-pound. Its pertinent value assures a better trans-membrane transport, protein binding and receptoraffinity of the compound. The values of log P of thesynthesized halogenated compounds reported inTable 1 approach the values of the mother com-pounds: (1-cyclopentenecarboxylic acid benzy-lamide ñ 2.60 (4), 3-cyclopentenecarboxylic acidbenzylamide ñ 2.54 (4), cyclopentanocarboxylicacid benzylamide ñ 2.80 (4), 2-furoic acid benzyl-amide ñ 1.21 (5), 5-methyl-2-furoic acid benzyl-amide ñ 0.77 (5), 3-isoquinolinecarboxylic acid ben-zylamide ñ 3.33 (5), 2-oxycyclopentaneacetic acidbenzylamide ñ 2.35 (2). This confirms relations
Table 9. Biological response of 13 (6 Hz, mice, i.p).
Test Time (h) Dosage (mg/kg) Protected/used
6Hz 0.50 35 1/8
6Hz 0.50 65 4/8
6Hz 0.50 85 4/8
6Hz 0.50 150 6/8
6Hz 0.50 250 4/4
TOX 24.0 150 1/8
TOX 24.0 210 1/8
TOX 24.0 300 3/8
TOX 24.0 500 8/8
MES = maximal electroshock test. TOX = neurological neurotoxicity test. PTZ = pentetrazole
Table 10. Pilocarpine-induced status test in rats. Response data.
Compound No. Dosage (mg/kg) Time Protected/used
1 400 0.0 0/7
7 400 0.0 0/8

496 MARZANNA STRUPI—SKA et al.
among the hydrophobicity and anticonvulsant activ-ity of the compounds. However, it does not explainthe difference between the activity of fluorinatedand chlorinated structures. The molecular shape isthe major factor contributing to the receptor affinity.The test of structure overlapping was performed tostudy the space relations between the halogenatedderivatives and the active mother compounds. Theoptimized structures of the synthesized halogenatedcompounds were superimposed on the mother struc-tures. Generally, a good superimposing wasobserved. It suggests that the receptor affinity of themother and the newly synthesized compounds issimilar and therefore, pharmacological activity isalso similar, which was confirmed by the results ofpharmacological tests. However, there is no expla-nation at the moment of difference between activityof fluorinated and chlorinated structures. Among thesynthesized and tested compounds the most promis-ing are 1, 7, 8 and 13. The PI values of these com-pounds is enclosed in limits 8.53 and 3.16. For com-parison ñ PI values of known anticonvulsant drugs:valproic acid is 6.0 (MES ED50 = 425.1 mg/kg, TD50
= 243.0), phenobarbital is 6.7 (MES ED50 = 9.1mg/kg, TD50 = 6.7 mg/kg). What deserves particularattention is very low neurotoxicity of these fourcompounds, similar to valproic acid, but much lowerthan phenobarbital (1 ñ TD50 = 253.89 mg/kg, 7 ñTD50 = 312.04 mg/kg, 8 ñ TD50 = 291.86 mg/kg and13 - TD50 = 266.05 mg/kg) (Table 5). High anticon-vulsant activity and low neurotoxicity also showbiological response of these compounds (Table 6-9).Considering the structure-activity relationship it isworth observing that three promising compoundsare derivative of 5-membered acids (1, 7, 13) andthree (7, 8, 13) are fluorinated benzylamides. Thisobservation is worth consideration in the course ofnew anticonvulsant designing.
Acknowledgments
This investigation was supported in part byWarsaw Medical University, National ScienceCentre (Grant 2011/01/B/NZ4/01065) and NationalInstitute of Neurological Disorders and Stroke(NINDS). The authors would like to thank Prof.Ryszard Paruszewski for the co-operation andenabling us to conduct pharmacological studies atthe National Institute of Neurological Disorders andStroke, within the programme of the AnticonvulsantScreening Project (ASP).
REFERENCES
1. Paruszewski R., StrupiÒska M., Stables J. P.,åwiπder M., Czuczwar S., Kleinrok Z., TurskiW.: Chem. Pharm. Bull. 49, 629 (2001).
2. Paruszewski R., StrupiÒska M., RostafiÒska-Suchar G., Stables J.P.: Protein Pept. Lett. 10,475 (2003).
3. Paruszewski R., StrupiÒska M., RostafiÒska-Suchar G., Stables J.P.: Protein Pept. Lett. 12,701 (2005).
4. StrupiÒska M., RostafiÒska-Suchar G., StablesJ.P., Paruszewski R.: Acta Pol. Pharm. DrugRes. 66, 155 (2009).
5. StrupiÒska M., RostafiÒska-Suchar G.,Pirianowicz-Chaber E., Stables J.P., Jiang J.,Paruszewski R.: Acta Pol. Pharm. Drug Res. 70,681(2013).
6. Salome-Grosjean E., Ki Duk Park, Morieux P.,Swendiman R., DeMarco E., Stables J.P., KohnH.: J. Med. Chem. 53, 1288 (2010).
7. King A. M., SalomÈ Ch., Dinsmore J., SalomÈ-Grosjean E., De Ryck M., Kaminski R., ValadeA., Kohn H.: J. Med. Chem. 54, 4815 (2011).
8. King A. M., SalomÈ Ch., SalomÈ-Grosjean E.,De Ryck M., Kaminski R., Valade A., StablesJ.P., Kohn H.: J. Med. Chem. 54, 6417 (2011).
9. Park Ki Duk., Yang Xiao-Fang., Lee Hyosung.,Dustrude E. T., Wang Yoying., Khanna R.,Kohn H.: ACS Chem. Neurosci. 4, 463 (2013).
10. Vaughan J.R. Jr., Osdato R.L.: J. Am. Chem.Soc. 74, 676 (1952).
11. Ghose A.K., Prichett A., Crippen G.M.: J.Comput. Chem. 9, 80 (1988).
12. Krall R.L., Penry J.K., White B.G., KupferbergH.J., Swinyard E.: Epilepsia 19, 409 (1978).
13. Barton M.E., Klein B.D., Wolf H.H., WhiteH.S.: Epilepsy Res. 47, 217 (2001).
14. Swinyard E.A., Woodhead J.H., White H.S.,Franklin M.R: Antiepileptic Drugs, 3rd edn.,pp. 85-102, Raven Press, New York 1989.
15. White H.S.: Epilepsia 44 (Suppl. 7), 2 (2003).16. Racine R.J.: Electroencephalogr. Clin.
Neurophysiol. 32, 281 (1972).
Received: 26. 05. 2014

Acta Poloniae Pharmaceutica ñ Drug Research, Vol. 72 No. 3 pp. 497ñ506, 2015 ISSN 0001-6837Polish Pharmaceutical Society
The World Health Organisation (WHO) report-ed that 300 million people would suffer diabetesmellitus (DM) by the year 2025 (1). The disease isconsidered as important public health problem,especially in developing and 3rd world countriesdue to inadequate treatment (2).
Although herbal medicines have long beenused effectively in treating many diseases through-out the world, the mechanisms of most of the herbalsused have not been defined. Many traditional planttreatments for diabetes are also used, but most of theevidence for their beneficial effects is anecdotal (3).Ginger (Zingiber officinale) has been used as a spicefor over 2000 years. Its root and the obtainedextracts contain polyphenol compounds: 6-gingeroland its derivatives, which have high antioxidantactivity (4). Gingerís high antioxidant value has
proved highly effective with its ability to scavenge anumber of free radicals and protect cell membranelipids from oxidation in a dose dependent manner(5). As in traditional medicine, rhizomes of gingerplants are consumed by women during ailment, ill-ness and confinement. Ginger oil has been found tobe an inhibitor of cyclooxygenase and lipoxygenaseactivities (6).
The medicinal properties of ginger were attrib-uted to many active compounds in ginger. Themajor constituents in Zingiber officinale are the pun-gent vanilloids, gingerol, paradol, shogaols andzingerone (7). The antioxidant, antitumor, and anti-inflammatory pharmacologic effects of ginger weremainly attributed to these constituents (7).
Ginger acts as a hypolipidemic agent in cho-lesterol-fed rabbits (8). Also, it was reported (9) that
NATURAL DRUGS
HEMATOLOGICAL AND IMMUNOBIOCHEMICAL STUDY OF GREEN TEA AND GINGER EXTRACTS IN EXPERIMENTALLY INDUCED
DIABETIC RABBITS
AHMED ELKIRDASY1,3*, SAAD SHOUSHA2, ABDULMOHSEN H. ALROHAIMI3
and M. FAIZ ARSHAD4
1Department of Biochemistry, Faculty of Veterinary Medicine, Menoufia University (Sadat branch), Egypt2Department of Physiology, Faculty of Veterinary Medicine, Benha University, 13736 Moshtohor, Egypt
3Department of Biomedical Science, 4Department of Pharmaceutical Science, College of Pharmacy, Shaqra University, Al Dawadimi, Saudi Arabia
Abstract: The present study was designed to investigate the effects of the extract of green tea and/or ginger onsome hematological and immunobiochemical profiles in alloxan-induced diabetic rabbits. The results revealedthat treatment of diabetic animals with extract of green tea and/or ginger elevated the decreased HDL-c andLDL-c but significantly decreased triglycerides, the elevated glucose and GOT concentrations. The result alsodisplayed a non-significant increase in the levels of CRP and fibrinogen. The experiment also revealed that theelevated MDA and GSH level fell down to the normal control group. The result also showed that after greentea and/or ginger extract treatment, the lowered RBC, WBC counts, PCV, percentage of neutrophils wereincreased and the elevated MCV, MCH, and MCHC of diabetic rabbits were decreased to normal levels. Thus,the overall results may indicate that green tea and/or ginger extracts have a significant hypoglycemic effect indiabetic rabbits. In addition, the extracts may be capable of improving hyperlipidemia, the impaired kidneyfunction and hemogram in alloxan-induced diabetic rabbits.
Keywords: alloxan, ginger, green tea, hematology, immunobiochemical
Abbreviations: Hb - hemoglobin, PCV - packed cell volume, RBC - red blood cell, WBC - white blood cell,MCV - mean corpuscular volume, MCH - mean corpuscular hemoglobin, MCHC - mean corpuscular hemo-globin concentration
497
* Corresponding author: e-mail: [email protected]

498 AHMED ELKIRDASY et al.
ginger treatment significantly decreased both serumcholesterol and triglycerides. In addition, gingerdecreased low density lipoprotein-cholesterol(LDL-cholesterol), very low density lipoprotein-cholesterol (VLDL-cholesterol) and triglycerideslevels in apolipoprotein-E deficient mice (10).Furthermore, ethanolic extract of ginger preventedhypercholesterolemia and development of athero-sclerosis in cholesterol-fed rabbits (11). It was found(12) that the ethanolic extract of ginger significantlyreduced serum total cholesterol and triglyceridesand increased the high density lipoprotein-choles-terol (HDL-cholesterol) levels; also, the extract canprotect tissues from lipid peroxidation and exhibit asignificant lipid lowering activity in diabetic rats.The study (13) revealed that serum and liver choles-terol decreased when ginger was administered tohypercholesterolemic rats.
Green tea is one of four types of tea (white,green, black, and oolong) that come from the plantCamellia sinensis. White tea is the least processedform of tea, while black tea leaves are fermented.Green tea leaves are steamed, not fermented andhence preserve more polyphenols (14). The benefi-cial effects of green tea are attributed to the polyphe-nols, particularly the catechins, which make up to30% of the dry weight of green tea leaves. These cat-echins are present in higher quantities in green teathan in black or oolong tea, because of differences inthe processing of tea leaves after harvest (15).
Green tea is a widely-consumed beverage and,for centuries, has been regarded to possess signifi-cant health-promoting effects (16). The health-pro-moting effects of green tea are mainly attributed toits polyphenol content. Green tea is a rich source ofpolyphenols, especially flavanols and flavonols,which represent approximately 30% dry weight ofthe fresh leaves (16). Catechins are the predominantflavanols and are mainly comprised of epigallocate-chin gallate (EGCG), epigallocatechin (EGC), epi-catechin gallate (ECG), and epicatechin (EC) (17).
Hematological and biochemical analyses aftertreatment with plant extracts in experimental ani-mals are among the important methods of assessingthe safety and toxicity of these plant extracts in ani-mals and human being as well. Earlier studies havebeen done for investigating the effect of plantextracts on hematology and biochemistry of experi-mental animals but none has been done for investi-gating the effect of combined extracts of both greentea and ginger in rabbits. Therefore; we measuredsome hematological parameters for evaluation of theeffect of the extract of green tea and/or ginger in dia-betic-induced rabbits.
EXPERIMENTAL
Animals
One month before the study, the animals weretreated against endo- and ecto-parasites and coc-cidiosis. Fifty (50) adult male rabbits of the NewZealand white strain (weighing between 1100 - 1800g) were selected and kept for about 14 days foracclimatization. All animals were housed in stain-less cages under standard laboratory conditions(temperature: 22.5 + 3.58OC; relative humidity: 50 ±20%; air ventilation: 10ñ15 times per hour; artificiallighting: 12 h per day), and were allowed free accessto normal balanced (standard) diet purchased fromCairo company (Commercial pelleted food con-tained a minimum of 88% dry matter, minimum15% crude protein, maximum 17% cellulose, maxi-mum 10% crude ash and minimum 2300 kcal/kgmetabolic energy) and to water via an automaticwater supply system. The animals received humancare according to the criteria outlined in the ìGuidefor the Care and Use of Laboratory Animalsî pre-pared by the National Academy of Sciences andpublished by the National Institutes of Health(NIH).
Preparation of plant extracts
Ginger extractionFresh rhizomes of ginger roots purchased from
ordinary market were washed, peeled and 10 gweighed out and mashed with mortar and pestle.This was then extracted with 0.1 liter of distilledwater and boiled for 5 min at 100OC. The extract wasfiltered and administered 1 mL/kg orally (30).
Green tea extractionFifteen grams of tea leaves were soaked in 500
mL of boiling water for 30 min and were then fil-tered. Extracts were prepared fresh daily (31). Thetested plants were used in aqueous extracts at con-centration of 0.2 g/mL by soaking these plants inboiling water. After 5 min, each extract was filteredand the filtrate was orally administered to rabbits ata temperature of 37 ± 1OC. This filtrate was provid-ed to rabbits as their sole source of drinking water.
Experimental protocol
Fifty (50) adult male rabbits used in this studywere divided into five experimental groups, eachgroup consisted of 10 animals: Group 1 (G1): (con-trol group), normal animals without treatment (stan-dard); Group 2 (G2): diabetic group (diabetesinduced by alloxan) without any treatment; Group 3(G3): diabetic animals treated with green tea extract;

Hematological and immunobiochemical study of green tea and... 499
Group 4 (G4): diabetic animals treated with gingerextract; Group 5 (G5): diabetic animals treated withcombined extract of both green tea and ginger.
Aqueous extracts of green tea and/or gingerwere administered orally to rabbits daily using agastric tube at dose rate of 1 mL/100 g body weightper day for 3 weeks (32). The control groups (nor-mal and diabetic) were orally administered onlywith the same volume of isotonic NaCl.
Female rabbits were not used in our experi-ments to avoid the effect of female reproductivehormones on the measured parameters.
Induction of diabetesThe most common method to induce diabetes
is using phloridzin (alloxan) or streptozotocin.Considering the insensitivity of rabbits to streptozo-tocin, alloxan was used to induce diabetes in thisstudy. Alloxan causes extensive fl cell destruction inthe pancreas during 18 to 24 h after injection, whichleads to hyperglycemia. The reason for alloxanísselective toxicity is its structural resemblance to glu-cose and its mechanism of effect is producing freeradicals since it can be deactivated by anti-oxidants.At the start of the experiment; the animals in the lat-ter four groups were injected intravenously in theear vein with 150 mg/kg of 10% alloxan (alloxanmonohydrate, Sigma Chemicals Co., Egypt) dis-solved in 10% solution in normal saline to inducediabetes. The control group was injected only withthe same volume of isotonic NaCl as the diabeticgroups received. Normal range of blood glucose inNew Zealand white rabbit is ranged between 4.2-10.4 mmol/L (75-189 mg/dL with an average of 115mg/dL) (33). Animals with blood glucose levels ≥200 mg/dL were included in the study (34). Alloxaninduces diabetes through destructing Langerhansislands of the pancreas. Therefore, a large amount ofinsulin is released from the pancreas cells after theinjection. In order to prevent hypoglycemic shock,during the first 24 h after the alloxan injection, therabbits received 10% dextrose instead of water (35,36). Blood glucose levels were assayed 3 days afteralloxan treatment to determine which animals hadbecome diabetic and the degree of hyperglycemia.
Collection of blood samples At the end of the experimental period (3
weeks), blood samples were collected from experi-mental animals through the ear vein into a set oflabeled sterile bottles containing K3-EDTA forhematological parameters determination with care-ful considerations to avoid hemolysis during sam-pling and transfer. Another set of tubes without K3-
EDTA was used to collect blood, immediately cov-ered, left to clot and centrifuged at 4000 ◊ g for 15min at room temperature for separation of serumthat will be used for immunobiochemical parametersassays.
Immunobiochemical parametersThe levels of serum triglycerides, HDL-choles-
terol and LDL-cholesterol were estimated accordingto methods described in (37). Lipid peroxidation(malondialdehyde concentration, MDA) andreduced blood glutathione (GSH) concentrationwere determined according to the methods of (38).Glucose level was measured by the methoddescribed by (39). Aspartate aminotransferase(AST; SGOT) and alanine aminotransferase (ALT;SGPT) were measured using commercial kits.
Immunoglobulins were measured using themethod of (40). C-reactive protein (CRP) was meas-ured using the method of (41). All other chemicalsused were of analytical reagent grade.
Hematological parametersThe packed cell volume (PCV) was measured
by the microhematocrit centrifuge (40). Hemoglobin(Hb) concentration was determined by thecyanomethemoglobin technique (42). The red bloodcells (RBCs) and white blood cells (WBCs) count-ing methods were based on the dilution of obtainedblood with diluting fluids (Hayem & Turke) inRBCs and WBCs counting pipettes (42). Individualcells were then counted in the counting chamber(hemocytometer). Giemsaís staining method wasused for the differential count of WBCs.
Statistical analysis
Data were statistically analyzed by one-wayanalysis of variance followed by Duncantís test (PC-stat computer program). Finally, least significantdifference (L.S.D) was used to test the differenceamong treatments. Results were considered statisti-cally significant when p was ≤ 0.05.
RESULTS
As shown in Figures 1, 2, alloxan producedsignificant hyperlipidemic action, where a signifi-cant (p ≤ 0.05) increase was recorded in the levelsof plasma triglycerides and LDL-c when comparedwith normal group, but HDL-c level was signifi-cantly (p ≤ 0.05) decreased. However, post-treat-ment with extract of green tea and/or ginger ame-liorated the hyperlipidemic action of alloxan onlipid profile by changing either up or down the

500 AHMED ELKIRDASY et al.
level to be normal or near the normal in case ofHDL-c and LDL-c but decreasing significantly (p≤ 0.05) the level of triglycerides. In case of post-treatment by oral administration of both green teaand ginger extracts, the level of triglyceridesdecreased significantly (p ≤ 0.05) more than theeffect of post-treatment with oral administration ofeither green tea or ginger extract alone as shown inFigure 1.
Serum glucose concentration increased signifi-cantly (p ≤ 0.05) in diabetic rabbits but treatment ofdiabetic rabbits with extract of green tea and/or gin-
ger decreased the elevated glucose concentrationsignificantly (p ≤ 0.05); however, glucose concen-trations were still significantly higher (p ≤ 0.05) thanthose of the control group as shown in Figure 3.
Highly significant (p ≤ 0.05) increase in bothGPT and GOT was recorded in diabetic group com-pared to normal control group. Post-treatment ofdiabetic animals with extract of green tea or gingerreturned their level to its normal level again.However, post-treatment of diabetic animals withextract of both green tea and ginger increased GOTsignificantly but not GPT as shown in Figure 4.
Figure 1. Plasma triacylglycerols in normal control, diabetic and diabetic treated animals. Values are the mean ± SEM. * p < 0.05 vs.control group (G1) and á p < 0.5 vs. diabetic group (G2)
Figure 2. Plasma HDL-c and LDL-c levels in normal, diabetic and diabetic treated animals. Values are the mean ± SEM. * p < 0.05 vs.control group (G1) and á p < 0.5 vs. diabetic group (G2)

Hematological and immunobiochemical study of green tea and... 501
Regarding to MDA and GSH, alloxan-induced diabetic animals showed significantincrease in MDA and a significant (p ≤ 0.05)decrease in GSH levels compared to their equiva-lent levels in normal control animals as shown inFigure 5. However, post-treatment of diabetic ani-mals with extract of either green tea or gingerresulted in significant (p ≤ 0.05) increase in MDA
as an indicator of lipid peroxidation process, whilepost-treatment of diabetic animals with extract ofboth green tea and ginger reduced significantly (p≤ 0.05) the level of MDA returning it to its normalcontrol level. In case of GSH, post-treatment ofalloxan-induced diabetic animals with extract ofgreen tea and/or ginger return GSH level to its nor-mal control animals.
Figure 3. Serum glucose levels in normal, diabetic and diabetic treated animals. Values are the mean ± SEM. * p < 0.05 vs. controlgroup (G1) and á p < 0.5 vs. diabetic group (G2)
Figure 4. Serum AST and ALT levels in normal, diabetic and diabetic treated animals. Values are the mean ± SEM. * p < 0.05 vs. con-trol group (G1) and á p < 0.5 vs. diabetic group (G2)

502 AHMED ELKIRDASY et al.
Regarding CRP and fibrinogen, alloxan-induced diabetic animals showed significant (p ≤0.05) increase in the levels of CRP and fibrinogen,however, post-treatment of diabetic animals withextract of green tea and/or ginger showed slight butnot significant (p ≤ 0.05) increase in the levels ofCRP and fibrinogen as shown in Figure 6.
Regarding immunoglobulins, alloxandecreased significantly IgG, IgM, and IgA com-pared to their levels in normal control group, asshown in Figure 7. Post-treatment of diabetic ani-
mals with either extract of green tea or ginger alonedecreased significantly (p ≤ 0.05) the levels ofimmunoglobulins. However, post-treatment of dia-betic animals with a mixture extract of both greentea and ginger decreased significantly (p ≤ 0.05) theimmunoglobulins but in a lesser degree than groupspost-treated with extract of either green tea or gingeralone, as shown in Figure 7.
As shown in Table 1, the results revealed thatthe RBC and WBC counts, PCV and neutrophil per-centage decreased significantly (p ≤ 0.05), while
Figure 5. Plasma MDA and GSH levels in normal, diabetic and diabetic treated animals. Values are the mean ± SEM. * p < 0.05 vs.control group (G1) and á p < 0.5 vs. diabetic group (G2)
Figure 6. Plasma CRP and fibrinogen levels in normal, diabetic and diabetic treated animals. Values are the mean ± SEM. * p < 0.05 vs.control group (G1) and á p < 0.5 vs. diabetic group (G2)

Hematological and immunobiochemical study of green tea and... 503
MCV, MCH, and MCHC increased significantly (p≤ 0.05) in alloxan-induced diabetic rabbits com-pared to normal control animals. Green tea and/orginger extracts treatment increased (p ≤ 0.05) thelowered RBC and WBC counts, PCV and neutrophilpercentage in diabetic rabbits. However, green teaand/or ginger extracts treatment decreased the ele-vated MCV, MCH, and MCHC of diabetic rabbits tonormal level. The other parameters as percentagesof lymphocytes, monocytes, eosinophils andbasophils showed non significant changes amongnormal and treated groups.
DISCUSSION
In the present study, statistical analysisrevealed that alloxan-induced diabetic rabbitsshowed significant reduction as shown in the levelsof serum triglycerides and LDL-c, but serum HDL-c level statistically increased (Figs. 1 and 2).However, post-treatment of diabetic animals withgreen tea or ginger extract ameliorated the lipid low-ering action of alloxan, but in case of post-treatmentwith combination of green tea and ginger extracts,the level of triglycerides decreased significantly (p ≤
Figure 7. Plasma immunoglobulins concentrations in normal, diabetic and diabetic treated animals. Values are the mean ± SEM. * p <0.05 vs. control group (G1) and á p < 0.5 vs. diabetic group (G2)
Table 1. Comparative hematological values of normal control (G1), diabetic (G2) and diabetic treated animals (G3, G4, G5). Values areexpressed as the mean ± SD. Means in the same row with different superscripts significantly differ (p < 0.05). Number of rabbits in eachgroup = 10.
Parameter G1 G2 G3 G4 G5
PCV (%) 37.00 ± 2.9a 29 ± 2.5b 33 ± 2.8c 32 ± 2.9c 36 ± 3.2a
Hb (g/dL) 12.45 ± 0.9a 12 ± 1.1b 12.2 ± 1.2b 12.4 ± 1.1a 12.47 ± 0.9a
RBCs (◊106 /mm3) 5.72 ± 0.4a 4.1 ± 0.3b 5.2 ± 0.1c 5.4 ± 0.2a 5.6 ± 0.2a
MCV (µ3) 64.46 ± 5.4a 70.73 ± 4.9b 63.46 ± 5.1a 59.26 ± 5.8c 64.29 ± 5.2a
MCH (pg) 21.6 ± 0.7a 29.27 ± 1.2b 23.46 ± 1.5a 23 ± 1.2a 22.26 ± 0.9a
MCHC (%) 33.65 ± 1.8a 41.37 ± 1.5b 37 ± 1.8c 38.75 ± 1.3c 34.64 ± 0.8a
WBCs (◊103 /mm3) 5.4 ± 0.5a 3.1 ± 0.9b 4.4 ± 0.6c 4.8 ± 0.8d 5.3 ± 0.6a
Neutrophils (%) 30 ± 1.3a 25 ± 1.5b 29 ± 1.3a 28 ± 1.2a 33 ± 1.3c
Lymphocytes (%) 61 ± 2.3a 63 ± 2.1a 61 ± 1.8a 62 ± 1.7a 60 ± 1.4a
Monocytes (%) 4 ± 0.3a 5 ± 0.4a 4 ± 0.6a 3 ± 0.5a 4 ± 0.3a
Eosinophils (%) 3 ± 0.2 4 ± 0.1 3 ± 0.1 4 ± 0.1 2 ± 0.2
Basophils 2 ± 0.1 3 ± 0.1 3 ± 0.1 3 ± 0.1 1 ± 0.1
PCV = packed cell volume; Hb = hemoglobin; RBC = red blood cell count; WBC = white blood cell count; MCV = mean corpuscular vol-ume, MCH = mean corpuscular hemoglobin, MCHC = mean corpuscular hemoglobin concentration.

504 AHMED ELKIRDASY et al.
0.05) more than the effect of post-treatment withgreen tea or ginger extract alone. These findings arein agreement with earlier studies including (9, 12)and others. It was concluded that the hypocholes-terolemic effect of ginger or green tea could havepossibly resulted from the inhibition of cellular cho-lesterol biosynthesis after the consumption of theextract (10). Furthermore, it was reported (18) thatthe reduction of cellular cholesterol biosynthesis isassociated with increased activity of the LDL recep-tor, which in turn leads to enhanced removal of LDLfrom blood, resulting in reduced serum or plasmacholesterol concentration. In our study, we canattribute this reduction in most lipid parameters tothe severe lipolysis caused by both extracts to over-come the effect of insulin deficiency.
Referring to Figure 3, the alloxan induced dia-betic treated groups (G3, G4 and G5) showed sig-nificant decrease (p ≤ 0.05) in the level of glucose incomparison with diabetic untreated group (G2). Inthe present investigation, ginger and green teaextracts caused significant hypoglycemic effect indiabetic rabbits. Such a phenomenon of hypo-glycemic response with green tea extract has alreadybeen reported (19). Figure 3 showed a significantincrease in blood glucose levels in diabetic rabbitsbecause of the destruction of pancreatic β cells byalloxan. The hypoglycemic effect of gingerincreased gradually and was observed to be maximalat the end in group G5 when we used the twoextracts together. The decrease in blood glucose lev-els was due to the antidiabetic compounds of gingerand different types of catechins present in green tea.
Regarding the effect of green tea and/or gingerextracts in alloxan-induced diabetic rabbits on theoxidant status and liver function enzymes; the pres-ent investigation showed that there were significantdecreases (p ≤ 0.05) in lipid peroxidation and ele-vated plasma total antioxidant capacity and bloodreduced glutathione concentration in the treatedgroups 3, 4 and 5 in comparison with the diabeticgroup 2 (Figs. 4 and 5). This finding strongly con-firms the antioxidant properties of ginger reported inprevious investigations. Ginger has been reported tohave a lowering effect on lipid peroxidation byinfluencing the enzymatic blood level of superoxidedismutase, catalase, and glutathione peroxidase(20). It has been also shown that ginger reduces cel-lular oxidation, scavenge superoxide anion andhydroxyl radicals. Ginger free phenolic and gingerhydrolyzed phenolic fractions exhibit free radicalscavenging activity. Depletion of tissue GSH levelsenhances cellular damage caused by oxidative stress(21). Significant depletion of GSH (p < 0.05) in dia-
betic rats suggests its increased utilization againstreactive oxygen species (22). However, green teaand ginger treatment in diabetic rabbits reversed theGSH to normal levels, what shows that ginger has anantioxidant property. The antioxidative activity ofgreen tea and ginger was attributed to scavengingsuperoxide anion and hydroxyl radicals by somephenols of ginger and catechins in green tea.Theoretically, our results may be due to the presenceof many antioxidant compounds, phenolic ketonederivatives, catechins and volatile oils present inginger and green tea.
Regarding the liver function enzymes, asshown in Figure 4, there were significant decreases(p ≤ 0.05) in the activity of mean values of GOT andGPT activity in treated groups 3, 4 and 5 in compar-ison to group 2. These results go with those showedearlier (23) and attributed this disturbance inenzyme activity to lipid peroxidation produced as aresult of diabetes. In the present work, the normal-ization of enzyme activity may be due to the effectthat comes from the usage of the green tea and gin-ger extracts which leads to a lowering effect of freeradicals on the cell membrane of liver cells. Theseresults go with those given previously from GSHand MDA (38).
Statistically, as showed in Figure 6, fibrinogenand CRP both showed significant decrease (p ≤0.05) in the treated groups 3, 4 and 5 when com-pared with diabetic group 2. The mean values ofboth fibrinogen and CRP showed significantincrease (p ≤ 0.05) in comparison with the controlone. These findings come in line with that stated in(24) and (25). The obtained data clarify plateletinhibition (PI) found in the diabetic patient byrevealing a significant interaction in elevated plasmafibrinogen in the presence of DM. In this investiga-tion, the effect of green tea and ginger extractadministration lead to decrease of inflammatoryresponse caused by DM on endothelial cells. Thiswas very clear in Figure 6, especially in group 5, dueto the usage of both green tea and ginger extracts.This may be attributed to antiplatelet effect of dif-ferent phenols and catechins present in both greentea and ginger.
Immunological status of the animals underexperiment is shown in Figure 7. The statisticalanalysis of the obtained data revealed that there wasa significant decrease (p ≤ 0.05) in the mean valuesof immunoglobulins in diabetic group 2 in compari-son with the control group 1. Administration ofgreen tea and ginger extracts led to significantincrease (p ≤ 0.05) in treated groups 3, 4 and 5. Theobtained results come in accordance with that stated

Hematological and immunobiochemical study of green tea and... 505
in (26). Theoretically, the obtained data can beattributed to fact that the ginger phenols and tea cat-echins may possess immunostimulant effects andthis point needs further investigation, which may beour future research point.
Referring to Table 1 in the present study,which indicated that treatment with extracts of greentea and/or ginger might ameliorate some disturbedhematological parameters of diabetic rabbits, it hasbeen suggested that anemia occurrence in DM is dueto the increased non-enzymatic glycosylation ofRBC membrane proteins, which correlates withhyperglycemia (27). Oxidation of these glycosylatedmembrane proteins and hyperglycemia in DMcaused an increase in the production of lipid perox-ides causing hemolysis of RBC.
Hematological indices are indicators andreflection of the effects of dietary treatments on ani-mals in terms of the quality of feed ingested andnutrients available to the animal to meet its physio-logical requirements. The values of hemoglobin(Hb), an iron-containing conjugated protein that per-forms the physiological function of transportingoxygen and carbon dioxide, which didnít show anysignificant changes in diabetic or diabetic treatedgroups compared with those on the control dietgroup, suggest that the animals didnít suffereddepressed respiratory capability at any group indi-cating that the oxygen-carrying capacity of theblood of the animals are not affected either in dia-betic or diabetic treated groups. Thus, increasedRBC count of green tea and/or ginger treated dia-betic rabbits could be due to the lowered lipid per-oxide level in RBC membrane leading to adecreased susceptibility of RBC to hemolysis. Sincenon-enzymatic glycosylations of membrane proteinscorrelate with hyperglycemia (27), it might be saidthat green tea and ginger extract produced theireffect by decreasing the elevated glucose concentra-tion in green tea and ginger extract treated diabeticrabbits. However, more studies by measuring theRBC fragility, and serum folic acid, iron, cobalt,vitamin B12 and calcium levels are needed to demon-strate the exact mechanism of action of green teaand ginger extracts on increased RBC count of dia-betic rabbits. Therefore, our results suggest that theextracts of green tea and ginger stimulate the syn-thesis (erythropoiesis) and concentration of erythro-cytes till normalizing RBC in anemic diabetic rab-bits. The corresponding statistical decrease in thePCV (measure of the volume of blood consisting ofsolid cells) of the diabetic animals and its normaliz-ing with green tea or ginger extract treatment sug-gest their role in erythropoiesis. Taken together, the
results of RBC, Hb and PCV suggest that theextracts of green tea and ginger possess antioxidantproperties and help in RBC membrane stabilizationby binding to proteins and carbohydrates which arecomponents of RBC membrane and therefore mayprevent breakdown of RBC membrane and antago-nize the anemic effect of alloxan.
Neutrophils ingest and kill bacteria and havebeen called the bodyís first line of defense againstbacterial infections (28). It has been suggested thatthe bodyís defense mechanism against infectionswas disturbed due to the disturbed neutrophil func-tion in diabetes (29). In this experiment, we demon-strated that treatment of diabetic rabbits with greentea and ginger extract increased the lowered neu-trophil percentage of WBC to the control level. Thisresult indicated that green tea and/or ginger treat-ment might also increase the defense mechanism ofthe body against infections in diabetic rabbits. Asmentioned above, it was found that RBC countincreased to control level in green tea and/or gingerextract treated diabetic rabbits. Therefore, return ofblood indices (MCV, MCH, MCHC) in diabetictreated rabbits could be due to a normalized RBCcount in these rabbits. From the hematologicalresults, it is apparent that oral administration ofgreen tea and/or ginger extract might decrease thediabetes-induced disturbances of hematologicalparameters in alloxan-induced diabetic rabbits.
Data of the present study revealed that dailytreatment with green tea and ginger extracts marked-ly improves hematological, immunobiochemical sta-tuses of rabbits with alloxan-induced diabetes. Inconclusion, our study suggests that green tea and gin-ger extracts if taken together may have more benefi-cial effects in diabetes as they may have synergisticaction, thus holding the hope of a new generation ofanti-diabetogenic drugs. However, comprehensivechemical and pharmacological research is required tofind out the exact mechanism of green tea and gingerfor their antidiabetogenic effect and to identify theactive constituent(s) responsible for their effect.
REFERENCES
1. Pradeepa R., Mohan V.: Ind. J. Med. Res. 121,116 (2002).
2. Djrolo F., Houngbe G., Auddia B., Addia K.,Avinadje M., Monterio B.: Med. Afrique Noire45, 538 (1998).
3. Al-Aboudi A., Afifi F.U.: Pharm. Biol. 49, 221(2011).
4. Bartley J., Jacobs A.: J. Sci. Food Agric. 80,209 (2000).

506 AHMED ELKIRDASY et al.
5. Srivastava K.V., Mustafa T.: Med. Hypotheses39, 342 (1992).
6. Flynn D.L., Rafferty M.F., Boctor A.M.:Prostaglandins Leukot. Med. 24, 195 (1986).
7. Zick S., Djuric M.R., Litzinger A., NormolleD., Alrawi S., Feng M., Brenner D.: CancerEpidemiol. Biomarkers Prev. 17, 1930 (2008).
8. Bhandari U., Grover J.K.: Int. J. Diabetes 6, 95(1998).
9. Akhani S.P., Vishwakarma S.L., Goyal R.K.: J.Pharm. Pharmacol. 56, 101 (2004).
10. Fuhrman B., Roseblate M., Hayek T., ColemanR., Aviram M.: J. Nutr. 130, 1124 (2000).
11. Bhandari U., Sharma J.N., Zafar R.: J.Ethnopharmacol. 61, 167 (1998).
12. Bhandari U., Kanojia R., Pillai K.K.: J.Ethnopharmacol. 97, 227 (2005).
13. Gujaral S., Bhumra H., Swaroop M.: Nutr. Rep.Int. 17, 183 (1978).
14. Zaveri N.: Life Sci. 78, 2073 (2006). 15. Klaus S., Pultz S., Thˆne-Reineke C., Wolfram
S.: Int. J. Obes. 29, 615 (2005). 16. Balentine D.A., Wiseman S.A., Bouwens L.C.:
Crit. Rev. Food Sci. Nutr. 37, 693 (1997).17. Sano M., Tabata M., Suzuki M., Degawa M.,
Miyase T, Maeda-Yamamoto M.: Analyst 126,816 (2001).
18. Elshater A.A., Muhammad M., Salman A.,Mahrous M.A.M.: Egypt Acad. J. Biol. Sci. 2,153 (2009).
19. Kumar B., Gupta S.K., Nag T.C., Srivastava S.,Saxena R.: Ophthal. Res. 47,103 (2012).
20. Ahmed R.S., Seth V., Banerjee B.D.: Ind. J.Exp. Biol. 38, 604 (2000).
21. Siddaraju M., Dharmesh S.: Mol. Nutr. FoodRes. 51, 324 (2007).
22. Tachi Y., Okuda Y., Bannai C., Bannai S.,Shinohara M. et al.: Life Sci. 69, 1039 (2001).
23. Davi G., Falco A., Patrono C.: Antioxid. Red.Signal. 7, 256 (2005).
24. Ang L., Palakodeti V., Khalid A., Tsimikas S.,Idrees Z. et al.: J. Am. Coll. Cardiol. 52, 1052(2008).
25. Setorki S., Asgary S., Eidi A., Rohani A.H.,Khazaei M.: Lipids Health Dis. 9, 10 (2010).
26. Mackay I.R.: West. J. Med. 174 118 (2001).27. Kennedy L., Baynes J.W.: Diabetologia 26, 93
(1984). 28. Ganong W.F.: Review of medical physiology.
15th edn., Lange Medical Publications, Connec-ticut 1991.
29. Yenigun M.: Cardiovascular diabetes. IstanbulUniversity Printing House, Istanbul 1997.
30. Okonta J.M., Uboh M., Obonga W.O.: Indian J.Pharmacol. Sci. 70, 230 (2008).
31. Ahmida M.H., Buzogaya M.H.: J. Appl. Sci.Res. 5, 1709 (2009).
32. Mohamed M., Elseweidy A.E., Abd El-Baky E.,Ahmed A.: Res. J. Med. Sci. 515, 2 (2009).
33. Dimitrova S.S., Georgiev I.P., Kanelov I.N.,Iliev Y.I., Tanev S.I., Georgieva T.M.: J. Vet.Med. 3, 161 (2008).
34. Bruce K.: Diabetes 35, 217 (1986).35. Shahidi I., Hossein Z.H.: Iran. J. Diabet. Lipid.
2, 6 (2001). 36. Kwon M.J., Song Y.S., Choi M.S.: Life Sci. 72,
2953 (2003).37. Wieland H., Seidel D.: J. Lipid Res. 24, 904,
(1983). 38. Sedlak J., Lindsay R.H.: Anal. Biochem. 25,
192 (1968).39. Trinder P.: Ann. Clin. Biochem. 6, 24 (1969).40. Granfors K.: J. Clin. Microbiol. 9, 336 (1979). 41. Yamamoto S, Tagata K, Nagahata H, Ishikawa
Y, Morimatsu M, Naiki M.: Vet. Immunol.Immunopath. 30, 329 (1992).
423. Dacie JV., Lewis SM .Practical Haematology.8th edn., p. 49, Longman Group Ltd., HongKong 1994.
Received: 21. 12. 2013

Acta Poloniae Pharmaceutica ñ Drug Research, Vol. 72 No. 3 pp. 507ñ515, 2015 ISSN 0001-6837Polish Pharmaceutical Society
Plant extracts, especially essential oils, havebeen employed in pharmaceutical, agronomic, food,cosmetic, and perfume industries due to severalreported biological properties. From among 3000,approximately 300 isolated oils are commonly used.The main methods to obtain essential oils from theplant materials are steam or water distillation, coldexpression or dry distillation. (1-3).
The composition of essential oil (EO), evenwithin one specie, depends on many factors such asgrowing conditions, time and place of the collectionof raw material, drying and storage. The method ofdetermination also has an impact on the qualitativeand quantitative analysis of chemical compoundspresent in the tested EO. Methods for assessing thecomposition of essential oils can be broadly dividedinto two research directions. The solid phasemicroextraction (SPME) method analyzes the com-position of the volatile compounds around the plant(4, 5). SPME is a preliminary analysis that requiresfurther action in order to obtain the essential oil in
the form that can be applied. The most commonmethod for obtaining the essential oil from the plantmaterial is distillation. Most often it is carried outusing glass Clevenger-type or Deryng apparatus.Both devices are recommended pharmacopoeialapparatuses for determining the essential oil content,the former one is described by the EuropeanPharmacopoeia (6) and the latter by the PolishPharmacopoeia (7).
The volatile composition of the essential oilsfrom different parts of the Mutelins purpurea Thell.has been studied earlier (8, 9). However, there is nodetailed information about the effect of chosen dis-tillation apparatus on types of isolated compounds.The objective of this study was to compare theeffectiveness of Deryng and Clevenger-type appara-tus in isolation of various types of components ofessential oil from the Mutelins purpurea Thell. flow-ers.
The present research is a continuation of stud-ies comparing essential oils extraction in different
EFFECTIVENESS OF THE DERYNG AND CLEVENGER-TYPE APPARATUSIN ISOLATION OF VARIOUS TYPES OF COMPONENTS OF ESSENTIAL OIL
FROM THE MUTELINA PURPUREA THELL. FLOWERS
TOMASZ BAJ1*, ELWIRA SIENIAWSKA1, RADOSLAW KOWALSKI2,3, MAREK WESOLOWSKI4
and BEATA ULEWICZ-MAGULSKA4
1Department of Pharmacognosy with Medicinal Plant Unit, Medical University of Lublin, 1 Chodüki St., 20-093 Lublin, Poland
2Department of Analysis and Food Quality Assessment, Faculty of Food Science and Biotechnology,University of Life Sciences in Lublin, 8 Skromna St., 20-704 Lublin, Poland
3Institute of Agrophysics, Polish Academy of Sciences, 4 Doúwiadczalna St., 20-290 Lublin, Poland4Department of Analytical Chemistry, Medical University of GdaÒsk,
107 Al. Gen. J. Hallera, 80-416 GdaÒsk, Poland
Abstract: In this study, both qualitative and quantitative analyses of chemical composition of M. purpureaessential oil obtained in the Deryng and Clevenger-type apparatuses were compared. As a result, content ofvolatile compounds were: 785.67 mg/mL and 833.33 mg/mL in the oil obtained in the Deryng (D-EO) andClevenger-type apparatuses (C-EO), respectively. The major components of both essential oils from M. pur-purea were: a-pinene, sabinene, myrcene, (Z)-sesquisabinene hydrate, (E)-sesquisabinene hydrate, and a-bis-abolol. The correlation coefficients values are not determined by the differences in the concentrations of thecomponents resulting from the application of two different methods of distillation.
Keywords: essential oil, hydrodistillation, Deryng apparatus, Clevenger-type apparatus, Mutellina purpurea
507
* Corresponding author: e-mail: [email protected]

508 TOMASZ BAJ et al.
apparatuses. In an earlier work it was shown thatthere are differences in the percentage of the chemi-cal composition in the essential oils of sage (10). Asthe authors found, these differences may result fromdifferent times of EO distillation in the Deryng andClevenger-type apparatuses. In the present paper,the same distillation time was applied to obtain theM. purpurea EO in both apparatuses. This couldhave an impact on the content of the identified com-pounds, as was evidenced by the high correlationcoefficients.
EXPERIMENTAL
Plant material
M. purpurea flowers were collected in theBotanical Garden of the Medical University inLublin in June 2010. The voucher specimen hasbeen deposited at the Herbarium of the Departmentof Pharmacognosy, Medical University in Lublin(ES032011M).
Isolation procedure
The fresh plant material (50.0 g) was placed ina round-bottomed flask and 500 mL distilled waterwas added. Hydrodistillation was performed simul-taneously for 3 h by means of the Deryng apparatusand the Clevenger-type apparatus. The obtained oilswere dried over anhydrous sodium sulfate andstored at 4OC before the GC analysis. Analyses wererepeated three times.
Chemical analysis of essential oil
GC/MS and GC/FID conditionsThe gas chromatograph Varian 450-GC with
the type triple quadrupole Varian 320-MS was used.The analytes were separated on a 30 m ◊ 0.25 mmVF-5ms capillary column coated with a 0.25 µmfilm of 5% phenyl methylpolysiloxane, and wereinserted directly into the ion source of the MS. Thesplit injection 1 : 100 was used for the samples. Thecolumn oven temperature was programmed at4OC/min from an initial temperature of 50OC (heldfor 1 min) to 250OC, which was held for 10 min. Theinjection temperature was 250OC and the injectionvolume was 1 µL. Helium (99.999%) was used ascarrier gas at a flow rate of 0.5 mL/min. The ioniz-ing electron energy was 70 eV and the mass rangescanned was 40-1000 m/z with 0.8 s/scan. Manifoldtemp. was 45OC, transfer line temp. was 289.5OC andthe ion source temp. was 271.2OC.
The range of concentrations of constituents out-lier in this group GC Varian 3800 (Varian, USA)equipped with a CP-8410 auto-injector and a 30 m ◊
0.25 mm DB-5 column (J&W Scientific, USA), filmthickness 0.25 µm, carrier gas - helium 0.5 mL/min,injector and detector FID temperatures of 260OC; splitratio 1 : 100; injection volume 5 µL. A temperaturegradient was applied (50OC for 1 min, then incre-mented by 4OC/min to 250OC, 250OC for 10 min).
Qualitative and quantitative analysis of essentialoils
The qualitative analysis was carried out on thebasis of MS spectra, which were compared with thespectra of the NIST/EPA/NIH Mass SpectralLibrary Search Program (11) and with the dataavailable in the literature (12, 13). The identity ofthe compounds was confirmed by their retentionindices (14), taken from the literature (12, 13) andour own data for standards (α-pinene, p-cymene,limonene, γ-terpinene, linalool, (E)-caryophyllene,caryophyllene oxide).
The quantitative analysis was performed bymeans of the internal standard addition method(alkanes C12 and C19) according to previouslydescribed procedures (15). Essential oil was diluted1000 times using n-hexane to achieve 1 mL volume,then 1 mg of C12, and 1 mg C19 was added into thediluted oil. Samples so prepared were subjected toGC-MS and GC-FID determinations. The quantita-tive analysis was performed on the basis of calibra-tion curves plotted to find the dependence betweenthe ratio of the peak area for the analyte to the areafor internal standard (Aanalyte : Ai.s.) vs. the analyteconcentration (Canalyte), for α-pinene, p-cymene,limonene, γ-terpinene, linalool, (E)-caryophyllene,caryophyllene oxide, in the appropriate concentra-tion range (15). The following alkanes were appliedas internal standards: C12 (for compounds withretention index < 1300, α-pinene, p-cymene, γ-ter-pinene, linalool); and C19 (for compounds withretention index > 1300, (E)-caryophyllene,caryophyllene oxide). The contents of the analyzedsubstances were read from the achieved calibrationcurves, the data for which originated from peakareas for M. purpurea oil components and internalstandard peak areas from GC separation. The finalresult took into account all dilutions during thewhole analytical procedure.
Statistical analysis
All calculations were done using a Statistica7.1 (StatSoftÆ, KrakÛw, Poland) software. Averagevalues were calculated. The results are expressed asthe mean ± SD. The chemical composition of theoils was evaluated by Wilcoxon signed-rank test andthe sign test.

Effectiveness of the Deryng and Clevenger-type apparatus in isolation of... 509
Table 1. Comparison of the composition of M. purpurea flowers essential oil obtained by means of the Deryng and Clevengerís type appa-ratus.
Concentration in the oil2 (mg/mL)Compound RIexp
1
DERYNG +/- SD CLEVENGER +/- SD
Monoterpenes
α-thujene 932 1.16 0.25 1.49 0.28
α-pinene 939 76.60 3.40 105.83 2.65
camphene 954 8.58 0.32 11.01 0.16
sabinene 975 189.90 6.33 161.11 4.53
β-pinene 980 13.83 0.96 12.56 0.16
myrcene 989 70.16 1.54 65.76 1.28
limonene 1028 26.26 2.27 30.06 0.59
β-phellandrene 1030 9.76 0.82 4.56 0.12
(Z)-b-ocimene 1033 7.58 0.36 8.10 0.18
(E)-b-ocimene 1044 18.25 0.26 18.78 0.02
γ-terpinene 1056 10.84 0.11 4.04 0.02
terpinolene 1082 2.41 0.02 1.19 0.10
Total 435.33 424.49
Oxygenated monotrpenes
(Z)-sabinene hydrate 1068 1.69 0.07 1.40 0.07
linalool 1095 1.00 0.14 1.39 0.00
(E) sabinene hydrate 1098 1.11 0.11 1.27 0.00
(Z)-p-menth-2-en-1-ol 1122 0.76 0.12 1.05 0.06
terpinen-4-ol 1182 12.89 0.87 6.21 0.48
carvacrol methyl ether 1242 1.88 0.40 1.06 0.02
lavandulyl acetate 1287 1.66 0.05 1.32 0.01
bornyl acetate 1290 4.61 0.20 2.64 0.14
Total 25.60 16.34
Sesquiterpenes
β-elemene 1393 19.73 2.84 15.51 0.35
(E)-caryophyllene 1427 11.43 0.06 20.28 0.71
γ-elemene 1436 0.28 0.04 0.65 0.13
(E)-α-bergamotene 1440 0.12 0.02 0.31 0.01
(Z)-β-farnesene 1460 5.20 0.24 6.03 0.28
α-humulene 1467 1.01 0.16 1.52 0.16
β-acoradiene 1489 0.50 0.16 0.59 0.07
germacrene D 1495 11.50 0.20 20.00 0.93
α-selinene 1503 0.23 0.04 0.31 0.01
bicyclogermacrene 1510 11.75 0.08 13.10 0.60
β-bisabolene 1515 0.38 0.02 0.36 0.04
germacrene A 1521 10.50 0.95 7.18 0.03
δ-amorphene 1531 1.15 0.15 1.10 0.05
β-sesquiphellandrene 1554 0.74 0.06 0.77 0.04
germacrene B 1571 6.89 1.24 10.06 0.21
viridiflorene 1605 0.20 0.03 0.53 0.03
Total 81.61 98.30

510 TOMASZ BAJ et al.
RESULTS AND DISCUSSION
The obtained content of volatile compoundswere: 785.67 mg/mL and 833.33 mg/mL in the oilobtained in the Deryng (D-EO) and Clevenger-typeapparatuses (C-EO), respectively. In both essentialoils 58 identical compounds were identified. Thequantitative analysis revealed differences betweenthe methods. Table 1 shows the qualitative andquantitative comparison of the components of theessential oils obtained by means of two methods.
Composition of essential oils obtained in Deryng
and Clevenger-type apparatuses
The dominant components of D-EO weresabinene > α-pinene > myrcene > (E)-sesqui-
sabinene hydrate > (Z)-sesquisabinene hydrate > α-bisabolol. In the case of C-EO the sequence wassimilar. Only myrcene content differed quantitative-ly. The structures and the quantitative comparison ofthe major essential oils components are shown inFigs. 1 and 2.
Analyzing the groups of chemical compoundspresent in the oils obtained in both apparatuses, itshould be noted that in both cases monoterpeneswere predominant: D-EO 55.4% (435.33 mg/mL),and C-EO 50.1% (424.49 mg/mL). The lowestamount was recorded for oxygenated monoterpenes:D-EO 3.3% (25.60 mg/mL), and C-EO 2.0% (16.34mg/mL).
A high amount of sabinene and α-pinene in theessential oils is characteristic of Apiaceae family
Table 1. cont.
Concentration in the oil2 (mg/mL)Compound RIexp
1
DERYNG +/- SD CLEVENGER +/- SD
Oxygenated sesquiterpenes
sesquicineole 1525 1.04 0.42 1.32 0.10
(Z)-sesquisabinene hydrate 1564 54.59 1.38 63.06 0.93
spathulenol 1588 6.73 0.07 12.10 0.16
caryophyllene oxide 1593 0.87 0.07 2.91 0.14
(E)-sesquisabinene hydrate 1598 67.76 1.13 75.79 1.55
β-atlantol 1624 1.03 0.17 1.34 0.02
1-epi-cubenol 1638 1.80 0.18 1.72 0.01
α-acorenol 1647 8.79 0.49 8.80 0.22
epi-α-muurolol 1658 1.46 0.61 1.88 0.07
β-acorenol 1666 2.39 0.14 2.23 0.06
α-cadinol 1671 4.34 0.17 5.10 0.03
neo-intermedeol 1675 1.54 0.20 1.50 0.04
β-bisabolol 1685 12.42 0.39 12.16 0.32
bulnesol 1691 0.90 0.10 1.30 0.10
α-bisabolol 1703 37.20 1.17 56.59 0.62
(Z)-farnesol 1712 6.97 0.55 8.09 0.27
(Z)-α-bisabolene epoxide 1726 0.23 0.04 0.75 0.01
Total 210.06 256.64
Aromatic compounds
p-cymene 1024 16.87 0.75 15.34 0.26
m-cresol 1071 1.34 0.57 2.26 0.08
methyl eugenol 1404 1.38 0.18 1.49 0.22
2.5-dimethoxy-p-cymene 1418 1.30 0.10 2.19 0.04
Total 20.89 21.28
1 ñ retention time on the column VF - 5 ms. 2 ñ concentration of the compound in the sample (mg) on the basis of the internal standard com-parison.

Effectiveness of the Deryng and Clevenger-type apparatus in isolation of... 511
(16). The dominant components were sabinene andα-pinene. In our study, sabinene and α-pinene, con-tent were 189.9 and 76.60 mg/mL, respectively, inthe Deryng, and 161.11 and 105.83 mg/mL, respec-tively, in the Clevenger-type apparatus, confirmingthe literature data on the chemotaxonomic charac-teristics of Apiaceae family.
According to the European Pharmacopoeia (6)and the Polish Pharmacopoeia VI (7) an essential oilis the plant extract obtained just by distillationprocesses, like hydrodistillation, with the exceptionof the Citrus sp. peel oil, which is isolated by coldexpression. When other isolation techniques areemployed, other designations, such as volatiles or
Figure 1. Structures of main compounds of essential oils of M. purpurea flowers
Figure 2. Comparison of the main components of essential oils from M. purpurea received by means of the Deryng and Clevenger-typeapparatus
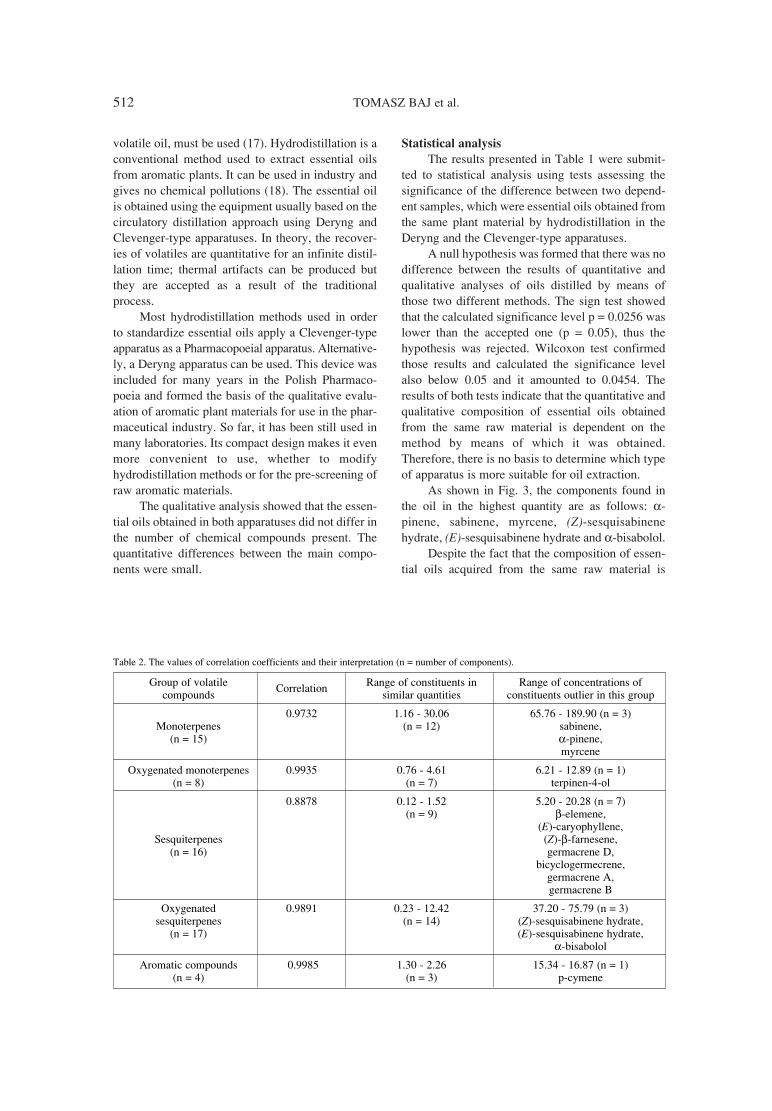
512 TOMASZ BAJ et al.
volatile oil, must be used (17). Hydrodistillation is aconventional method used to extract essential oilsfrom aromatic plants. It can be used in industry andgives no chemical pollutions (18). The essential oilis obtained using the equipment usually based on thecirculatory distillation approach using Deryng andClevenger-type apparatuses. In theory, the recover-ies of volatiles are quantitative for an infinite distil-lation time; thermal artifacts can be produced butthey are accepted as a result of the traditionalprocess.
Most hydrodistillation methods used in orderto standardize essential oils apply a Clevenger-typeapparatus as a Pharmacopoeial apparatus. Alternative-ly, a Deryng apparatus can be used. This device wasincluded for many years in the Polish Pharmaco-poeia and formed the basis of the qualitative evalu-ation of aromatic plant materials for use in the phar-maceutical industry. So far, it has been still used inmany laboratories. Its compact design makes it evenmore convenient to use, whether to modifyhydrodistillation methods or for the pre-screening ofraw aromatic materials.
The qualitative analysis showed that the essen-tial oils obtained in both apparatuses did not differ inthe number of chemical compounds present. Thequantitative differences between the main compo-nents were small.
Statistical analysis
The results presented in Table 1 were submit-ted to statistical analysis using tests assessing thesignificance of the difference between two depend-ent samples, which were essential oils obtained fromthe same plant material by hydrodistillation in theDeryng and the Clevenger-type apparatuses.
A null hypothesis was formed that there was nodifference between the results of quantitative andqualitative analyses of oils distilled by means ofthose two different methods. The sign test showedthat the calculated significance level p = 0.0256 waslower than the accepted one (p = 0.05), thus thehypothesis was rejected. Wilcoxon test confirmedthose results and calculated the significance levelalso below 0.05 and it amounted to 0.0454. Theresults of both tests indicate that the quantitative andqualitative composition of essential oils obtainedfrom the same raw material is dependent on themethod by means of which it was obtained.Therefore, there is no basis to determine which typeof apparatus is more suitable for oil extraction.
As shown in Fig. 3, the components found inthe oil in the highest quantity are as follows: α-pinene, sabinene, myrcene, (Z)-sesquisabinenehydrate, (E)-sesquisabinene hydrate and α-bisabolol.
Despite the fact that the composition of essen-tial oils acquired from the same raw material is
Table 2. The values of correlation coefficients and their interpretation (n = number of components).
Group of volatile Range of constituents in Range of concentrations ofcompounds
Correlation similar quantities constituents outlier in this group
0.9732 1.16 - 30.06 65.76 - 189.90 (n = 3)Monoterpenes (n = 12) sabinene,
(n = 15) α-pinene,myrcene
Oxygenated monoterpenes 0.9935 0.76 - 4.61 6.21 - 12.89 (n = 1)(n = 8) (n = 7) terpinen-4-ol
0.8878 0.12 - 1.52 5.20 - 20.28 (n = 7)(n = 9) β-elemene,
(E)-caryophyllene,Sesquiterpenes (Z)-β-farnesene,
(n = 16) germacrene D,bicyclogermecrene,
germacrene A,germacrene B
Oxygenated 0.9891 0.23 - 12.42 37.20 - 75.79 (n = 3)sesquiterpenes (n = 14) (Z)-sesquisabinene hydrate,
(n = 17) (E)-sesquisabinene hydrate,α-bisabolol
Aromatic compounds 0.9985 1.30 - 2.26 15.34 - 16.87 (n = 1)(n = 4) (n = 3) p-cymene

Effectiveness of the Deryng and Clevenger-type apparatus in isolation of... 513
dependent on the distillation method, a high value ofthe correlation coefficient (r = 0.9732) can be foundbetween the concentrations of the compounds inboth oils. The following equation y = 1.4794 +0.9515 x describes this relationship. It suggests that
both groups of results are highly correlated and onlya few components of the oils differ significantly inconcentration.
The next step of comparing the composition ofthe essential oil obtained in both apparatuses was
Figure 3. Correlation between the content of compounds of essential oils obtained in the Deryng and Clevenger-type apparatus from M.purpurea flowers. (a) α-bisabolol, (b) (Z)-sesquisabinene hydrate, (c) myrcene, (d) (E)-sesquisabinene hydrate, (e) α-pinene, (f) sabinene
Figure 4. Correlation between the content of sesquiterpenes obtained in the Deryng and Clevenger-type apparatus from M. purpureaflowers

514 TOMASZ BAJ et al.
determination of the relationship between the groupsof identified compounds.
Table 2 shows the relationship between thegroups of components of essential oils obtained dur-ing the distillation process in the both apparatuses.
The linear relationship for all groups presents avery similar picture: a large number of componentsgrouped in the lowest concentration range, then acluster with the highest concentration of one or threecomponents. For sesquiterpenes, seven componentswith higher concentrations are grouped in a widerange of concentrations (see Fig. 4).
The highest correlation coefficients wereobtained for the following two groups: aromaticcompounds (n = 4, r = 0.9985) and oxygenatedmonoterpenes (n = 8, r = 0.9935). However, bothgroups are characterized by two features:● a small number of components,● one component at a concentration exceeding
several times the average concentration of theother ingredients in the group.
In this situation, the differences in the concen-trations of other constituents resulting from the appli-cation of two different methods of distillation have anegligible effect on the value of the correlation coef-ficients. They have very small values comparing tothe component with an extreme concentration value.
Slightly lower values of correlation coeffi-cients were obtained for the following two groups:oxygenated sesquiterpenes (n = 17, r = 0.9891) andmonoterpenes (n = 15, r = 0.9732). They containthree ingredients in terms of concentrations, from afew to several times exceeding the average concen-tration of the other ingredients in the group. Threecomponents which give direction of the correlationreduce its value.
The lowest value of the correlation coefficientwas obtained for sesquiterpenes (n = 16, r = 0.8878).Regardless of the method of the oil production, theconcentrations of 9 components are located in a nar-row range of values, thus creating the initial sectionof the linear relationship. The direction of the linearrelationship gives 7 other components present in awide concentration range from a few to severaltimes exceeding the average concentration of theother ingredients in the group. The result of a lack ofa single component at a high concentration compar-ing to the other ingredients is that the direction ofthe correlation is given by a few components. Thedispersion of their concentrations reduces the valueof the correlation coefficient.
The correlation coefficients values are notdetermined by the differences in the concentrationsof the components resulting from the application of
two different methods of distillation. They are deter-mined by the individual components at concentra-tions much higher than the average concentration ofthe other ingredients in the group. They give the cor-relation direction, and the fewer such components inthe group, the higher the value of the correlationcoefficient is achieved.
The present work is a detailed analysis of theessential oils content and it reflects the impact of theconstruction of the apparatus on the composition ofthe essential oil, but the differences can be accept-able for future biological research. Hydrodistillationin the Deryng and Clevenger-type apparatuses yield-ed 10.09 mL/kg and 16.80 mL/kg (dry weight) ofessential oil, respectively. Applying the same condi-tions it was possible to obtain 60.1% more essentialoil in a Clevenger apparatus. Analyzing the quanti-tative composition of both essential oils it cannot besaid that the differences between individual com-pounds were proportional. The oil obtained in aDeryng appaeatus was abundant in monoterpeneswhereas the dominant group in a Clevenger-typeapparatus were sesquiterpenes. The statistical analy-sis suggests that both groups of essentials oils arehighly correlated and only a few components of theoils differ significantly in concentration.
REFERENCES
1. Handa S.S., Khanuja S.P.S., G. Longo, RakeshD.D.: Extraction Technologies for Medicinaland Aromatic Plants. International Centre ForScience and High Technology, Trieste 2008.
2. Rubiolo P., Sgorbini B., Liberto E., Cordero C.,Bicchi C.: Flavour Fragr. J. 25, 282 (2010).
3. Cardoso-Ugarte G.A., Ju·rez-Becerra G.P.,Sosa-Morales M.E., LÛpez-Malo A.: JMPEE47, 63 (2013).
4. Murat Ch., Gourrat K., Jerosh H., Cayot N.:Food Chem. 135, 913 (2012).
5. Prakash Om, Rout P.K., Chanotyia C.S., MisraL.N.: Ind. Crop Prod. 37, 195 (2012).
6. European Pharmacopoeia 6.0., Vol. 1, Councilof Europe, Strasbourg Cedex 2007.
7. Polish Pharmacopoeia, Vol. VI, PTFarm,Warszawa 2002 (in Polish).
8. Sieniawska E., Baj T., Kowalski R., GlowniakK.: Rec. Nat. Prod. 2014. (In press).
9. Sieniawska E., Baj T., Ulewicz-Magulska B.,Wesolowski M., Glowniak K.: Biochem. Syst.Ecol. 49, 125 (2013).
10. Baj T., Ludwiczuk A., Sieniawska E., Skalicka-Woüniak K., Widelski J., ZiÍba K., GlowniakK.: Acta Pol. Pharm. Drug Res. 70, 35 (2013).
Effectiveness of the Deryng and Clevenger-type apparatus in isolation of... 515
11. NIST/EPA/NIH Mass Spectral Library withSearch Program: Data Version, NIST 08,Software Version 2.0f, National Institute ofStandards and Technology 2005.
12. Joulain D., Konig W.A.: The Atlas of SpectralData of Sesquiterpene Hydrocarbons, E.B.Verlag, Hamburg 1998.
13. Adams R.P.: Identification of Essential OilCompounds by Gas Chromatography/Quadrupole Mass Spectroscopy, AlluredPublishing Corp., Carol Stream, IL 2001.
14. Van Den Dool H., Kratz P.D.: J. Chromatogr.11, 463 (1963).
15. Kowalski R., Wawrzykowski J.: Flavour Fragr.J. 24, 69 (2009).
16. Evergetis E., Michaelakis A., HaroutounianS.A.: Essential Oils of Umbelliferae (Apiaceae)Family Taxa as Emerging Potent Agents forMosquito Control, in Integrated PestManagement and Pest Control - Current andFuture Tactics, Larramendy, M.L., Soloneski S.Eds., InTech, Rijeka 2012.
17. Zhu M., Li E., He H.: Chromatographia 68, 603(2008).
18. Huang B., Lei Y., Tang Y., Hang J., Qin L., LiuJ.: Food Chem. 125, 268 (2011).
Received: 7. 02. 2014


Acta Poloniae Pharmaceutica ñ Drug Research, Vol. 72 No. 3 pp. 517ñ525, 2015 ISSN 0001-6837Polish Pharmaceutical Society
Narcotics available on illegal market oftencontain psychoactive plant material. In many casesthis material derives from species illegal in particu-lar country. Plant material is usually in fine-cut orpowdered form, thus difficult to identify. For suchfragmented material classic taxonomical identifica-tion methods using anatomical and morphologicalfeatures of the plant cannot be employed (1). Forplants, in which psychoactive compound is species-specific, identification includes botanical and phyto-chemical analysis. Identity of Salvia divinorumEpling et J·tiva-M. (Lamiaceae) and Mitragyna spe-ciosa Korthals (Rubiaceae) can be confirmed bydetection of secondary metabolites, salvinorin A andmitragynine, respectively (2). In a case where thepsychoactive compound is not specific to the partic-ular species, such as N,N-dimethyltryptamine forPsychotria viridis RuÌz et PavÛn (Rubiaceae) (3),unambiguous determination whether a test materialis derived from an illegal plant, may be problematic.
The biggest problem, however, like in case of Caleazacatechichi Schlechtendal (Asteraceae), is theidentification of the plant, in which no psychoactivesubstance or the other marker was found (4).
The aim of the study is to develop a methodenabling for identification of plant species con-trolled according to Polish law, based on their chem-ical characteristics without the need for determina-tion of specific compounds. Chemometric tech-niques have such potential. They allow building aclassification model, in which objects are groupedaccording to their taxonomic assignment of thespecies. The data on which the model is constructedderived from the characteristics of the plant. Thefeatures used in this technique may consist ofmicromorphological (5, 6), chemical (7-9) or ele-mental composition of plant (10). Identification ofspecies using chemometric techniques is becomingmore and more popular, but so far it has not beenused for the assessment of illegal plant products.
APPLICATION OF CHEMOMETRICS FOR IDENTIFICATION OF PSYCHOACTIVE PLANTS
ANNA PAULINA KOWALCZUK1*, ANNA £OZAK1, MONIKA KILJAN1, KRYSTYNA M TRAK1
and JORDAN KORDIAN ZJAWIONY2
1National Medicines Institute, Che≥mska 30/34, 00-725 Warszawa, Poland2Department of Pharmacognosy and Research Institute of Pharmaceutical Sciences, School
of Pharmacy, The University of Mississippi, University MS 38677, USA
Abstract: Drug market changes dynamically causing many analytical challenges for police experts. Amongillicit substances there are synthetic designer products but also herbal material. Plant material is usually in fine-cut or powdered form, thus difficult to identify. For such fragmented material classic taxonomical identifica-tion methods using anatomical and morphological features of the plant cannot be employed. The aim of thestudy was to develop an identification method of the powdered material with employment of multidimension-al data analysis techniques. Principal Component Analysis (PCA) was chosen as a method of data exploration.The study was conducted on four plants controlled in Poland: Salvia divinorum, Mitragyna speciosa, Psychotriaviridis and Calea zacatechichi. The compatibility of grouping features of selected species was compared in twovariants: chemical and elemental composition. In a first variant, GC-MS chromatograms of extracts were ana-lyzed and in the second, elements composition with the AAS and the ICP-MS techniques. The GC-MS method,based on the qualitative interpretation of results, allows for clear differentiation of samples with regard to theirspecies affiliation. Even the plants belonging to the same family Rubiaceae, P. viridis and M. speciosa formedhomogeneous and clearly separated clusters. Additionally, the cluster analysis was performed, as a method con-firming sample grouping.
Keywords: narcotic plants, chemometrics, identification, gas chromatography, elements
517
* Corresponding author: e-mail: [email protected], tel. 22 841 06 23 (383)

518 ANNA PAULINA KOWALCZUK et al.
Table 1. Mineralization parameters of sample preparation for ASA and ICP-MS analyses.
Step Time of Time of Microwave
heating (s) cooling (s) power (W)
1 120 120 87.5
2 120 600 157.5
3 120 120 210.0
4 120 600 245.0
5 120 120 280.0
6 300 600 315.0
Table 2. Conditions of the F-AAS method.
Element Flame typeAnalyte wavelength Internal Working range
[nm] standard [mg/L]
Ca Nitrous oxide/acetylene 422.7 yes 0.25 ñ 1.25
Fe Air/acetylene 248.3 no 0.5 ñ 6
K Air/acetylene 766.5 no 0.1 ñ 1.0
Mg Air/acetylene 285.2 yes 0.1 ñ 0.5
Na Air/acetylene 589.0 no 0.25 ñ 1.0
Zn Air/acetylene 213.9 no 0.1 ñ 1.0
Table 3. Eigenvalues of the principal components obtained from GC-MS results.
Eigenvalues % of the total Accumulated Accum. - % of the
variance eigenvalues total variance
1 52.26088 18.02099 52.2609 18.0210
2 43.31437 14.93599 95.5752 32.9570
3 32.18627 11.09871 127.7615 44.0557
4 22.84326 7.87699 150.6048 51.9327
5 16.63155 5.73502 167.2363 57.6677
6 15.22790 5.25100 182.4642 62.9187
7 14.41694 4.97136 196.8812 67.8901
8 13.27539 4.57772 210.1566 72.4678
9 12.03532 4.15011 222.1919 76.6179
10 11.25389 3.88065 233.4458 80.4985
11 9.38060 3.23469 242.8264 83.7332
12 8.02784 2.76822 250.8542 86.5015
13 7.24924 2.49974 258.1034 89.0012
14 7.11811 2.45452 265.2216 91.4557
15 5.60138 1.93151 270.8229 93.3872
16 4.69090 1.61755 275.5138 95.0048
17 3.97270 1.36990 279.4865 96.3747
18 3.68404 1.27036 283.1706 97.6450
19 3.36614 1.16074 286.5367 98.8058
20 2.18997 0.75516 288.7267 99.5609
21 1.27333 0.43908 290.0000 100.0000

Application of chemometrics for identification of psychoactive plants 519
The specific aims of this study is to use the chemo-metric techniques to identify narcotic plants in theirpowdered form. The study was conducted on fourplants controlled in Poland: S. divinorum, M. spe-ciosa, P. viridis and C. zacatechichi. We comparedthe compatibility of grouping features of selectedspecies in two variants: chemical and elementalcomposition. In a first variant, GC-MS chro-matograms of extracts were analyzed and in the sec-ond, elements composition using AAS (Ca, Fe, K,Mg, Na, Zn) and the ICP-MS techniques (Ag, Al, B,Ba, Be, Cd, Ce, Co, Cr, Cs, Cu, Dy, Eu, Ga, Gd, Hg,Li, Mn, Mo, Nd, Ni, Pb, Pr, Rb, Sb, Sm, Sr, U, V).Choosing the right test, with data characterizing thematerial according to the taxonomic assignment ofthe species, distinct clusters can be obtained. Theoptimal grouping allows for the construction of theclassification model as a new tool for plant materialidentification in forensic laboratories.
EXPERIMENTAL
Plant materials
The examined products were purchased fromthe Internet. According to the providerís declarationthe investigated material was: dried shredded leavesof Salvia divinorum from Mexico - four samples S;dried leaves of Psychotria viridis from Hawaii -sample P(H), two samples from Brazil ñ P(B) andthree samples from Peru ñ P(P); dried shredded orpowdered leaves of Mitragyna speciosa fromThailand ñ three samples M(T) and three samplesfrom Bali ñ M(B); and dried shredded herb of Caleazacatechichi from Mexico ñ five samples C.
Reagents and materials
Methanol, chloroform, ethyl acetate, dichloro-methane and hexane pure p.a. were purchased fromPOCH (Poland). Deionized water was obtained with
Table 4. PC1. PC2 and PC3 values obtained from GC-MS results corresponding to the plant samples: S ñ S.divinorum; P(H) ñ P. viridis from Hawaii; P(B) ñ P. viridis from Brazil; P(P) ñ P. viridis from Peru; M(T) ñ M.speciosa from Thailand; M(B) ñ M. speciosa from Bali and C ñ C. zacatechichi.
Sample PC1 PC2 PC3
S 0.4738 1.9206 0.3141
S 0.4596 1.8023 0.3572
S 0.5656 1.9082 0.2824
S 0.4685 2.2157 0.5758
P(H) 0.4896 -0.5476 -1.2652
P(B) 0.4669 -0.4627 -1.1980
P(B) 0.4532 -0.4247 -1.1696
P(P) 0.4964 -0.0875 -1.4251
P(P) 0.5246 -0.1882 -1.1493
P(P) 0.4716 -0.3891 -1.2706
P(P) 0.4170 -0.3511 -1.5186
M(T) 0.6054 -0.8545 1.2147
M(T) 0.5585 -0.6953 1.0609
M(T) 0.6610 -0.8655 1.1713
M(B) 0.5683 -0.8936 1.1969
M(B) 0.6053 -0.8676 1.1051
M(B) 0.6461 -0.9753 1.3668
C -2.1012 -0.0014 0.3661
C -1.8771 -0.1466 0.1522
C -1.9034 0.0014 0.0370
C -1.5961 -0.1167 -0.0250
C -1.4535 0.0192 -0.1790

520 ANNA PAULINA KOWALCZUK et al.
Figure 1. PC1, PC2 and PC3 scores for GC-MS results according to the species: S ñ S. divinorum; P(H) ñ P. viridis from Hawaii; P(B) ñP. viridis from Brazil; P(P) ñ P. viridis from Peru; M(T) ñ M. speciosa from Thailand; M(B) ñ M. speciosa from Bali and C ñ C. zacate-chichi
Table 5. Eigenvalues of the principal components obtained from elemental composition.
Eigenvalues % of the total Accumulated Accum. - % of the
variance eigenvalues total variance
1 10.67761 30.50745 10.67761 30.5075
2 5.66157 16.17591 16.33918 46.6834
3 3.88256 11.09304 20.22174 57.7764
4 3.75177 10.71934 23.97351 68.4957
5 2.50624 7.16069 26.47975 75.6564
6 2.35411 6.72603 28.83386 82.3825
7 1.24418 3.55479 30.07804 85.9373
8 1.15646 3.30418 31.23450 89.2414
9 0.89630 2.56085 32.13080 91.8023
10 0.82497 2.35705 32.95577 94.1593
11 0.50425 1.44071 33.46002 95.6000
12 0.40901 1.16861 33.86903 96.7686
13 0.34960 0.99886 34.21863 97.7675
14 0.26917 0.76906 34.48780 98.5366
15 0.20557 0.58735 34.69337 99.1239
16 0.10717 0.30621 34.80054 99.4301
17 0.08818 0.25195 34.88873 99.6821
18 0.05438 0.15537 34.94311 99.8375
19 0.02698 0.07707 34.97008 99.9145
20 0.01904 0.05440 34.98913 99.9689
21 0.01087 0.03107 35.00000 100.0000

Application of chemometrics for identification of psychoactive plants 521
deionizating filter system Water PRO PS fromLabanco (Kansas City, USA). Membrane filtersChromafil Pet-45/25 from Macherey-Nagel GmbH& Co.KG (Germany).
ICP-MS and AAS reagents: stock solution IV-ICPMS-71A: Ag, Al, As, B, Ba, Be, Cd, Ce, Co, Cr,Cs, Cu, Dy, Eu, Ga, Gd, Mn, Nd, Ni, Pb, Pr, Rb, Se,Sm, Sr, Tl, U, V in 10.00 µg/mL from InorganicVentures (USA); standard solution of: Ca, Fe, Hg,In, K, Li, Mg, Mo, Na, Sb, Zn in 1000 µg/mL fromMerck (Germany); nitric acid of ICP grade fromMerck (Germany); lanthanum nitrate of AAS gradefrom Merck (Germany); redistilled water withNanopure Diamond UV system from Barnstead.Argon 99,999%, nitrous oxide and acetylene min.99,6% from Air Products.
Apparatus
GC-MS Agilent GC7890A+5975C VLMSDinstrument from Agilent Technologies (USA); ICP-MS spectrometer Thermo Electron X Series II fromThermo Electron Corporation (USA); AAS SolaarM6 from Thermo Elemental; hollow cathode lamps:Ca-HCL, Fe-HCL, K-HCL, Mg-HCL, Na-HCL andZn-HCL; microwave decomposition unit UniCleverfrom Plazmatronika-Service (Poland); vibratory
grinder with mill made of corundum from Testchem(Poland) were used
Sample preparation
For GC-MS analysis, powdered dried plantmaterial (0.5 g) was extracted with 5.0 mL ofmethanol (MeOH), ethyl acetate (EA),dichloromethane (DCM), chloroform (TCM) andhexane (H) in an ultrasound bath for 30 min and fil-tered through membrane filters.
For ICP-MS and AAS methods, dried plantmaterial was ground in vibratory grinder and the lostof drying in 105OC was determined. One gram sampleweights were placed in Teflon crucibles and 5 mL ofnitric acid was added. The digestion using microwaveenergy in a closed system was performed in a six-stepsystem. Mineralized solutions were transferred to vol-umetric flasks and filled up to 100.0 mL with water.Mineralization parameters are presented in Table 1.
Methods
GC-MS GC-MS was performed with a 5% phenyl-
methylpolysiloxane capillary column HP-5MS (30 m◊ 0.25 mm i.d.; film thickness, 0.25 µm; Agilent J&WScientific (USA). The temperature program consisted
Figure 2. PC1, PC2 and PC3 scores for elemental composition according to the species: S ñ S. divinorum; P(H) ñ P. viridis from Hawaii;P(B) ñ P. viridis from Brazil; P(P) ñ P. viridis from Peru; M(T) ñ M. speciosa from Thailand; M(B) ñ M. speciosa from Bali and C ñ C.zacatechich
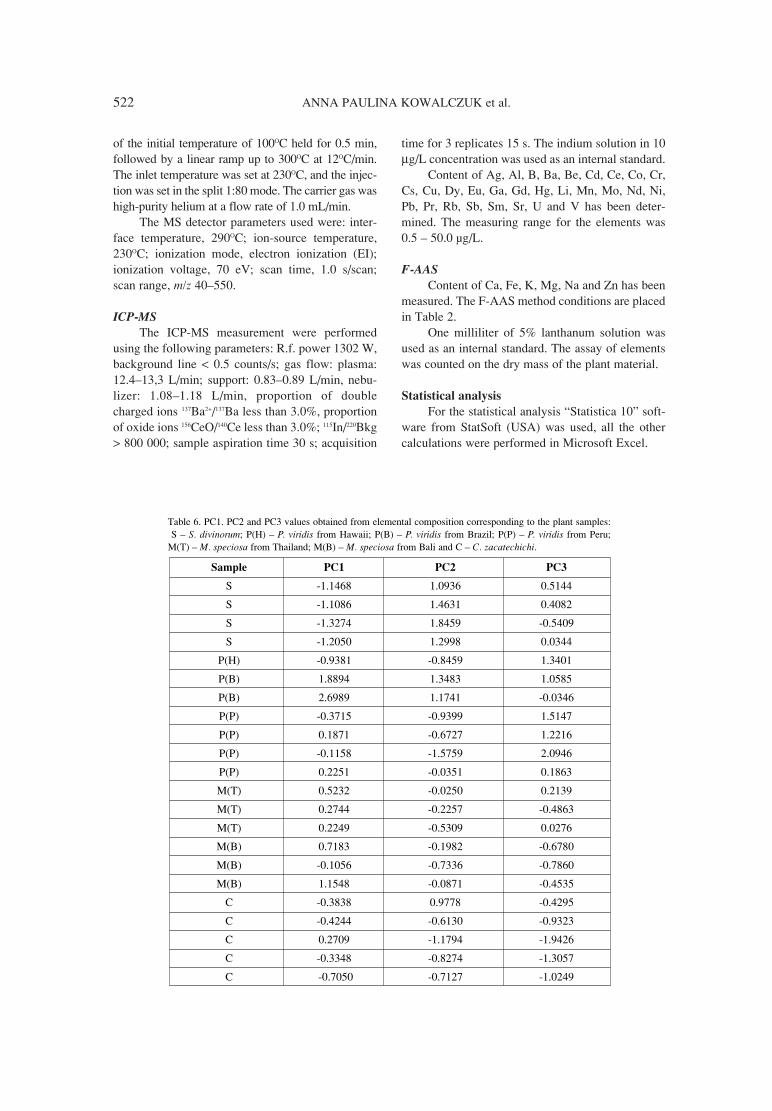
522 ANNA PAULINA KOWALCZUK et al.
of the initial temperature of 100OC held for 0.5 min,followed by a linear ramp up to 300OC at 12OC/min.The inlet temperature was set at 230OC, and the injec-tion was set in the split 1:80 mode. The carrier gas washigh-purity helium at a flow rate of 1.0 mL/min.
The MS detector parameters used were: inter-face temperature, 290OC; ion-source temperature,230OC; ionization mode, electron ionization (EI);ionization voltage, 70 eV; scan time, 1.0 s/scan;scan range, m/z 40ñ550.
ICP-MS The ICP-MS measurement were performed
using the following parameters: R.f. power 1302 W,background line < 0.5 counts/s; gas flow: plasma:12.4ñ13,3 L/min; support: 0.83ñ0.89 L/min, nebu-lizer: 1.08ñ1.18 L/min, proportion of doublecharged ions 137Ba2+/137Ba less than 3.0%, proportionof oxide ions 156CeO/140Ce less than 3.0%; 115In/220Bkg> 800 000; sample aspiration time 30 s; acquisition
time for 3 replicates 15 s. The indium solution in 10µg/L concentration was used as an internal standard.
Content of Ag, Al, B, Ba, Be, Cd, Ce, Co, Cr,Cs, Cu, Dy, Eu, Ga, Gd, Hg, Li, Mn, Mo, Nd, Ni,Pb, Pr, Rb, Sb, Sm, Sr, U and V has been deter-mined. The measuring range for the elements was0.5 ñ 50.0 µg/L.
F-AAS Content of Ca, Fe, K, Mg, Na and Zn has been
measured. The F-AAS method conditions are placedin Table 2.
One milliliter of 5% lanthanum solution wasused as an internal standard. The assay of elementswas counted on the dry mass of the plant material.
Statistical analysis
For the statistical analysis ìStatistica 10î soft-ware from StatSoft (USA) was used, all the othercalculations were performed in Microsoft Excel.
Table 6. PC1. PC2 and PC3 values obtained from elemental composition corresponding to the plant samples:S ñ S. divinorum; P(H) ñ P. viridis from Hawaii; P(B) ñ P. viridis from Brazil; P(P) ñ P. viridis from Peru;
M(T) ñ M. speciosa from Thailand; M(B) ñ M. speciosa from Bali and C ñ C. zacatechichi.
Sample PC1 PC2 PC3
S -1.1468 1.0936 0.5144
S -1.1086 1.4631 0.4082
S -1.3274 1.8459 -0.5409
S -1.2050 1.2998 0.0344
P(H) -0.9381 -0.8459 1.3401
P(B) 1.8894 1.3483 1.0585
P(B) 2.6989 1.1741 -0.0346
P(P) -0.3715 -0.9399 1.5147
P(P) 0.1871 -0.6727 1.2216
P(P) -0.1158 -1.5759 2.0946
P(P) 0.2251 -0.0351 0.1863
M(T) 0.5232 -0.0250 0.2139
M(T) 0.2744 -0.2257 -0.4863
M(T) 0.2249 -0.5309 0.0276
M(B) 0.7183 -0.1982 -0.6780
M(B) -0.1056 -0.7336 -0.7860
M(B) 1.1548 -0.0871 -0.4535
C -0.3838 0.9778 -0.4295
C -0.4244 -0.6130 -0.9323
C 0.2709 -1.1794 -1.9426
C -0.3348 -0.8274 -1.3057
C -0.7050 -0.7127 -1.0249

Application of chemometrics for identification of psychoactive plants 523
The Principal Component Analysis was carriedout in two variants, on GS-MS fingerprints obtainedfrom the plant extracts and on the elemental compo-sition of the plants. GC-MS results formed a datamatrix composed on 290 variables and 22 cases. Incase of the elements assay, the data matrix was com-posed on 35 variables and 22 cases.
Using PCA algorithm for calculations, the con-sistent grouping of objects, in both cases, has beenachieved and no rotation has been applied.
RESULTS AND DISCUSSION
Species identification of illegal fragmentedplant material is a challenging task. Taxonomicresearch based only on part of the plant is impossi-ble to be performed. Therefore, it seems that theonly effective method of identification may be theuse of micromorphological examination combinedwith phytochemical analysis (11). If the substanceresponsible for psychoactive activity of the plant isknown, especially if it is a specific compound, thespecies identity of the material can be established.Two plants, S. divinorum and M. speciosa containactive markers, salvinorin A and mitragynine,respectively. In case of P. viridis, the psychoactivecompound, DMT, is not specific to the species anddoes not allow the material identification. In C.zacatechichi, no psychoactive substance has beenrecognized so far, and no specific compounds havebeen isolated.
The aim of the study was to develop an identi-fication method of the powdered material withemployment of multidimensional data analysis tech-niques. Principal component analysis (PCA) waschosen as a method of data exploration. It is a pro-cedure that uses orthogonal transformation ofobservable variables into a new set of uncorrelatedvariables (called components). PCA does notinvolve variable reduction, and the total variance ofvariables is equal to the sum of variances of princi-pal components (12). Although it would be worth-while to use the cluster analysis (CA) for variablegrouping, our final aim is that the suggested solutionfrom the principal component space be comple-mented with subsequent cases in the future. Thecluster analysis was performed additionally, as amethod confirming sample grouping.
A GC-MS studies of the following extractswere performed: methanol, ethyl acetate, dichloro-methane, chloroform and hexane, obtained from S.divinorum, P. viridis, M. speciosa and C. zacate-chichi. Ten retention times corresponding to thelargest peak areas were selected from each chro-
matogram. Each peak represented a single com-pound corresponding to mass. Retention times of allthe peaks were introduced as variables. The samplewas characterized on the basis of the presence orabsence of a given compound in the extract. As aresult, a matrix having 290 columns and 22 rowscontaining discrete data was obtained. In the exam-ined set, numerous statistically significant correla-tions at the significance level of p = 0.001 wereobserved. In order to interpret the results, the princi-pal component analysis was performed. Ten princi-pal components (1-10, Table 3) describing 80% ofthe total number of variances were used for furthercalculations. The number of principal componentsfor interpretation was selected on the basis of theCattellís criterion (13), with the assumption that20% of the given data variance may be omitted withno difference to significant information contained inthe data. Principal component: PC1, PC2 and PC3values obtained from GC-MS results correspondingto each of the plant sample are presented in Table 4.
On the basis of the analysis of certain factorscores value, it was found out that already threefirst components allow effective differentiationbetween samples of various species. The first prin-cipal component PC1 allows isolation of C. zacat-echichi samples, the second component PC2species S. divinorum and the third component PC3differentiates between the species M. speciosa andP. viridis (Fig. 1).
The PCA of the element composition was per-formed on the basis of the content of the followingmetals in the samples: Ag, Al, B, Ba, Be, Cd, Ce,Co, Cr, Cs, Cu, Dy, Eu, Ga, Gd, Hg, Li, Mn, Mo,Nd, Ni, Pb, Pr, Rb, Sb, Sm, Sr, U and V. In theexamined set, numerous statistically significant cor-relations at the significance level of p = 0.001 wereobserved. In order to interpret the results, the princi-pal component analysis preceded by data standardi-zation was performed. Eight principal components(1-8, Table 5) describing 90% of the total number ofvariances and meeting the Kaiser criterion wereused for further calculations (14). Principal compo-nent: PC1, PC2 and PC3 values obtained from ele-mental composition corresponding to each of theplant sample are presented in Table 6.
The first principal component PC1 differenti-ates between S. divinorum samples and P. viridiscoming from Brazil (Fig. 2). The species S. divino-rum and P. viridis from Hawaii revealed smallamount of lanthanides and a relatively high calciumlevel, whereas a high level of lanthanides in P.viridis samples from Brazil clearly grouped theseobjects in a separate cluster. Thus, within one P.

524 ANNA PAULINA KOWALCZUK et al.
viridis species, two completely different levels ofthese metals were observed. The second principalcomponent PC2 differentiates a group comprising S.divinorum and P. viridis from Brazil versus P viridisfrom Hawaii and Peru and C. zacatechichi. S. divi-
norum and P. viridis samples from Brazil, in contrastto the second group, contain a larger amount of Na,K, Zn, Mo, U and V, and small amounts of Sr (Fig.2). The third principal component, PC3 allows iso-lation of the P. viridis group on the basis of a higher
Figure 3. Dendrograms for hierarchical clustering of chemical variables according to the GC-MS chromatograms
Figure 4. Dendrograms for hierarchical clustering of elemental composition

Application of chemometrics for identification of psychoactive plants 525
content of Be, Mg, Cr and a low content of Cu andCd. This component differentiates between P. viridisand C. zacatechichi (Fig. 2).
The aim of the work was to assess the possibil-ity of using the ICP-MS and GC-MS methods com-bined with a chemometric analysis for identificationof plant narcotics. Sample grouping agreeing withthe species affiliation was observed for the results ofthe GC-MS analysis. Due to low availability of thematerial, caused by its illegal status, it was impossi-ble to accomplish a model, but the obtained resultsconfirmed the usefulness of PCA for the narcoticplant recognition.
PCA of the results obtained from the ICP-MSand AAS analysis did not lead to formation of clus-ters representing a single species. This results fromthe fact that the content of elements in a plantdepends on numerous factors. They involve the typeof soil and environmental conditions, such as pre-cipitation. In case of endemic plants such as S. divi-norum, the elemental composition of all the sampleswas the same. The biggest differences in elementscontent were observed in P. viridis, since the sam-ples came from different places: Hawaii, Brazil andPeru.
The GC-MS method, based on the qualitativeinterpretation of results, allows for clear differentia-tion of samples with regard to their species affilia-tion. Even the plants belonging to the same family -P. viridis and M. speciosa, formed homogeneous andclearly separated clusters. HCA results presented indendrograms confirmed that the study of chemicalcomposition is more effective for grouping than thestudy of elemental composition (Figs. 3 and 4).
CONCLUSIONS
Object grouping, and ultimately a classifica-tion model based on the analysis of principal com-ponents may be used as a tool for identification ofplant narcotics. The method of statistical interpreta-tion of results obtained in the GC-MS analysis ofplant-derived extracts presented in this study is analternative for complex identification proceduresinvolving microscopic methods and phytochemicalanalysis. Creating a model based on the elementalcomposition seems to be pointless, due to depend-ence of the element content of the plant on environ-mental conditions. However, such a model may beuseful for determining the place of origin of theplant material.
The results of this study are an important startin creating a model allowing identification of select-ed narcotic plants, but they have to be supportedwith more samples. A good solution may be to initi-ate cooperation between forensic laboratories inorder to provide data and then to use methods basedon the chemometric analysis.
Acknowledgment
This work was supported by National ScienceCenter in KrakÛw, Poland under the grant No.0240/B/P01/2011/40.
REFERENCES
1. Zuba D., Byrska B., Maciow M.: Anal. Bioanal.Chem. 400, 119 (2011).
2. Babu K.M., McCurdy C.R., Boyer E.W.: Clin.Toxicol. (Phila) 46, 146 (2008).
3. Blackledge R.D., Charlotte M.T.: Microgram J.18 (2003).
4. Ch. R‰tch.: The Encyclopedia of PsychoactivePlants. Ethnopharmacology and Its Application.Park Street Press, Rochester, Vermont 2005.
5. LakuöiÊ B., LakuöiÊ D., JanËiÊ R., StevanoviÊB.: Flora 201, 108 (2006).
6. �vstedal D.O., Mjaavatten O.: Plant Syst. Evol.18, 21 (1992).
7. Zhao Y., Sun J., Yu L.L., Chen P.: Anal.Bioanal. Chem. 405, 4477 (2013).
8. Dale L.M., Thewis A., Boudry C.H., Rotar I.,Pacurar F.S., Abbas O., Dardenne P. et al.:Talanta 116, 149 (2013).
9. Sun J., Chen P.: Anal. Bioanal. Chem. 399,1877 (2011).
10. Lahner B., Gong J., Mahmoudian M., SmithE.L., Abid K.B., Rogers E.E., Guerinot M.L. etal.: Nat. Biotechnol. 21, 1215 (2003).
11. Kowalczuk A.P., £ozak A., Zjawiony J.K.:Forensic Sci. Int. 233, 238 (2013).
12. Stanisz A.: in Accessible course of statisticsusing STATISTICA PL on examples from med-icine. Volume 3. Multivariate analysis. StatsoftPolska, KrakÛw 2007.
13. Astel A., Obolewski K., Skorbi≥owicz E.,Skorbi≥owicz M.: Desalin. Water Treat. doi:10.1080/19443994.2014.887491, (2014).
14. Astel A.M., Chepanova L., Simeonov V.: WaterAir Soil Pollut. 216, 375 (2011).
Received: 15. 05. 2014


Acta Poloniae Pharmaceutica ñ Drug Research, Vol. 72 No. 3 pp. 527ñ538, 2015 ISSN 0001-6837Polish Pharmaceutical Society
Diclofenac sodium is a nonsteroidal anti-inflammatory drug (NSAID) that it used for thetreatment of rheumatic diseases, minor and mediumpain, and post surgery analgesia in medicine.Patients who are given formulations of diclofenac orother NSAIDs as a therapeutic strategy often sufferfrom the gastrointestinal tract complications (1-3).In order to decrease the adverse effects or toincrease the therapeutic analgesic effect, diclofenacwas orally administered in composed tablets com-prising also misoprostol (4) and topically in a for-mulation comprising e.g., a spasmolytic agent -papaverine hydrochloride (5). In the literature canbe found reports of a separate administration ofdiclofenac and papaverine for the relief of pain inpatients with renal colic (6, 7). There are no reportsof a formulation comprising diclofenac sodium andpapaverine hydrochloride in a composed dosageform, therefore, we decided to prepare tablets con-sisting of DIC and PAP for oral administration foranalgesic effect. Next, the tablets comprising thetwo drugs were patented (8).
In the literature, there are no reports regard-ing the relationship of pharmacokinetic parame-ters between DIC and PAP. Diclofenac is almost
completely absorbed after oral administration, itis subjected to first-pass metabolism so that about50% of the drug reaches the systemic circulationin the unchanged form. More than 99% is boundto plasma proteins, primarily to albumin (3, 9,10). Diclofenac exhibits a terminal half-life of 1-2 h (3, 9). Metabolism of diclofenac is mediatedby both glucuronidation and oxidative biotrans-formation (11). The oxidative metabolism ofdiclofenac is catalyzed by two enzymes of thecytochrome P450 family, namely CYP2C9 andCYP3A4 (12). Diclofenac is metabolized to 4í-hydroxydiclofenac and 5-hydroxydiclofenac, 3í-hydroxydiclofenac and 4í,5-dihydroxydiclofenac(13, 14). They are then excreted in the form ofglucuronide and sulfate conjugates, mainly in theurine (about 60%) but also in the bile (about 35%)and less than 1% is excreted as unchangeddiclofenac (3).
Papaverine is completely absorbed by the gas-trointestinal tract and metabolized principally by theliver. Papaverine in about 90% bound to plasma pro-teins. The biological half-life is reported to bebetween 1 and 2 h (3). The major route of biotrans-formation is O-demethylation to the corresponding
PHARMACEUTICAL TECHNOLOGY
PHARMACOKINETICS OF DICLOFENAC SODIUM AND PAPAVERINEHYDROCHLORIDE AFTER ORAL ADMINISTRATION OF TABLETS
TO RABBITS
REGINA KASPEREK1, £UKASZ ZIMMER1, WOJCIECH JAWIE—2 and EWA POLESZAK1
1Chair and Department of Applied Pharmacy, Medical University of Lublin, Chodüki St. 1, 20-093 Poland2Department of Pharmacokinetics and Physical Pharmacy, Jagiellonian University of KrakÛw, Poland
Abstract: Non-compartmental pharmacokinetic analysis of diclofenac sodium (DIC) and papaverinehydrochloride (PAP) after oral administration of composed tablets to rabbits was developed. HPLC method fordetermination of DIC and PAP in rabbit plasma was developed and validated. Chromatographic separation ofDIC, PAP and the IS was achieved on a Zorbax SB C18 5-µm column (150 mm ◊ 4.6 mm) using methanol-water (55 : 45, v/v) as mobile phase at a flow rate of 0.8 mL/min. Pharmacokinetic analysis showed that oraladministration of a tablet composed of DIC and PAP do not change the pharmacokinetic parameters such asMRT, MAT, Cl and bioavailability of the active substances compared with single administration of DIC andPAP after single dose.
Keywords: pharmacokinetics, diclofenac sodium, papaverine hydrochloride, rabbits, HPLC
527
* Corresponding author: e-mail: [email protected]; phone: 48 81 742 37 65, fax 48 81 742 38 08

528 REGINA KASPEREK et al.
phenolic metabolites (15). Several phenolic metabo-lites have been identified: 4í-desmethylpapaverine(which predominantes in most cell systems), 6-desmethylpapaverine, 7í-desmethylpapaverine,4í,6-didesmethylpapaverine and 3í-desmethylpa-paverine (16-18). Papaverine is excreted in theurine, almost entirely as glucuronide-conjugatedphenolic metabolites (3).
To test the pharmacokinetics and bioavailabil-ity of DIC and PAP given in a single formulation,it was necessary to develop a method for determi-nation of DIC and PAP in rabbit plasma.According to the literature, several HPLC methodsusing different clean-up procedures, includingdirect injection, protein precipitation (19-21),solid-phase extraction (SPE) (22), liquid-liquidextraction (LLE) (23-26) and column switching(27) with UV (24-29), fluorimetric (20) or electro-chemical detection (30) HPTLC (31) and HPLC-MS/MS (32), GC-MS (33, 34) were applied todetermine diclofenac in animal or human plasma.Papaverine hydrochloride in biological fluids wasassayed using HPLC (35-37), GLC (38), and GC(39) methods.
There are no data about pharmacokinetics ofdiclofenac sodium and papaverine hydrochlorideafter administration in composed formulation andthere is no HPLC method for simultaneous determi-nation of diclofenac sodium and papaverinehydrochloride levels in plasma. Therefore, the aimof this study was to examine the pharmacokineticsof DIC and PAP after oral administration of com-posed tablets to rabbits and develop and validate theHPLC method.
EXPERIMENTAL
Reagents and chemicals
Diclofenac sodium (DIC) was produced byCaesar and Loretz, GmbH, Hilden, Germany,papaverine hydrochloride (PAP) was purchasedfrom Galfarm PPH, Cefarm Lublin, Poland, andphenacetin (IS) from POCh Gliwice, Poland.Polyvinylpyrrolidone K 22 (PVP), mannitol (M) andpotato starch (PS) were the products of Merck,Germany. Chloroform was obtained from POChGliwice, Poland. Methanol and water (HPLC grade)were purchased from Merck, Germany and otherreagents were of analytical grade.
Preparation of tablets
Composition and preparation of tablets (T)containing DIC and PAP were described in thepatent (8). Tablets containing only one substance,DIC (T-DIC) or PAP only (T-PAP), were obtainedin the same manner as described in this patent, butcomposition contained only one active substance.
One dose of tablets (T) consists of 50 mg DIC,20 mg PAP and excipients such as 70 mg PVP, 70mg M and 90 mg PS to obtain 300 mg of weight.One dose of tablets (T-DIC) consists of 50 mg DICand excipients to obtain 280 mg of weight. One doseof tablets (T-PAP) consists of 20 mg PAP and excip-ients to obtain 250 mg of weight.
Tablets were obtained by direct compression ofgranules, which were previously prepared by wetgranulation method. Granules were obtained bymixing and wetting of the powders with PVP solu-tion until a mass of suitable consistency wasobtained. Then, the wet mass was granulated using a
Table 1. Physical properties of prepared tablets.
Test Results
T T-DIC T-PAP
Weight (mg)mean SD
300.54 ± 2.45 281.32 ± 1.55 249.68 ± 1.87
Thickness(mm) SD
4.02 ± 0.02 3.85 ± 0.01 3.8 ± 0.02
Disintegrationtime (min) SD
7 ± 2.5 6 ± 1.5 5 ± 2.1
Hardness (kG/mm2),SD
0.105 ± 0.01 0.1 ± 0.01 0.105 ± 0.03
Friability (%) 0.09 0.22 0.16
Drug content(%) DIC, SD 99.08 ± 1.17 100.04 ± 3.93 (%) PAP, SD 100.05 ± 1.76 97.35 ± 1.23

Pharmacokinetics of diclofenac sodium and papaverine hydrochloride... 529
rotary granulator (Erweka, Germany) and a 1.6 mmmesh screen. Granules were dried in a hot air oven(Memmert INB-500) at 40OC for 1 h. The driedgranules (moisture 3-5%) were sieved through a 1.6mm mesh screen. The tablets were obtained fromthese granules in a press tableting machine (Erweka,Germany) with 9 mm concave punches.
Physical properties of tablets
The tablets were tested as per standard proce-dure for weight variation (n = 20), thickness (n =20), hardness (n = 6), friability (n = 20), disintegra-tion time (n = 6) and drug content (n = 10) (Table 1).
Weight uniformity testFor each formulation, twenty tablets were
selected randomly and weighed together and theirmean weight was calculated. Next, they were indi-vidually weighed using a weighing balance (OhausAV 513C, USA).
Tablet dimensionsTablet diameter and thickness were measured
using a Vernier Caliper (Digital Caliper 0-150 mm,Comparator).
Hardness testHardness of tablet was determined by using an
Erweka tablet hardness tester (Erweka, Germany).
Friability testAn Erweka friabilator (Erweka, Germany) was
used for the test. Twenty tablets were weighed, sub-jected to attrition at 25 rpm for 4 min and reweighedafterwards. The percentage loss in weight equivalentto friability was calculated from the equation below:Friability (%) = (loss in weight/initial weight) ◊ 100.
Disintegration timeDisintegration time was measured by using an
Erweka apparatus (Germany). Each of six tabletswas put into a basket-rack in a vessel and was cov-ered with a disk. After the apparatus had been turnedon, the disintegration time of the tablets wasobserved.
Drug content analysis Ten tablets from each series were selected at
random, weighed together and the mean weight wasdetermined. The tablets were crushed together andweighed exactly 300 mg (T), 280 mg (T-DIC) or250 mg (T-PAP), when in powder form (n = 6), dis-solved in methanol in a 50 mL volumetric flask, fil-tered using the Whatman filter and appropriately
diluted with methanol. Drug content of DIC andPAP were analyzed by HPLC method published inearlier report (40).
Chromatographic conditions
The chromatographic separation of DIC, PAPand the IS (phenacetin) was achieved with a PerkinElmer 200 HPLC system consisting of the 200 seriespump, the 200 series autosampler equipped with a200 µL loop, the 200 series UV/VIS detector, the200 series vaccum degasser and a Zorbax SB C18 5-µm column (150 ◊ 4.6 mm, Agilent, USA).
The mobile phase consisted of methanol andwater (55 : 45, v/v), and the flow rate was 0.8mL/min. The injection volume was 100 µL. The UVdetection wavelengths at maximum absorbance ofDIC and PAP at 280 nm and 238 nm, respectively,were chosen. The samples were injected twicebecause the Perkin Elmer 200 HPLC system enableda detection for only one wavelength.
Calibration standardsStock solutions of DIC (250 µg/mL) and PAP
(100 µg/mL) were prepared in mobile phase solution(methanol-water, 55 : 45, v/v) and stored at 4OCwrapped in aluminum foil. The working solutions atconcentrations of 0.5, 1.25, 2.5, 5, 12.5, 25 and 50µg/mL of DIC and 0.5, 1, 2, 5, 10, 20, 40 and 60µg/mL of PAP were prepared by serial dilution ofDIC or PAP stock solutions in mobile phase. The ISworking solution (20 µg/mL) was also prepared bydilution of the IS stock solution (100 µg/mL) withmobile phase.
The calibration standards were obtained byappropriate dilution of working solutions withmobile phase. The calibration standards were pre-pared on the same day at concentrations of 0.05,0.125, 0.25, 0.5, 1.25, 2.5 and 5 µg/mL of DIC and0.05, 0.1, 0.2, 0.5, 1, 2, 4 and 6 µg/mL of PAP, byspiking 1 mL blank rabbit plasma with 100 µL ofDIC or PAP working solutions and 100 µL of ISworking solution.
Sample and calibration standard preparationBriefly, a 1 mL of blank rabbit plasma, spiked
plasma (calibration standard sample) or pharmaco-kinetic study plasma sample was initially spikedwith 100 µL of IS working solution and then 1.5 mLof 1 M hydrochloric acid was added. The mixturewas shaken for the period of 10 min. To the obtainedmixture, 3 mL of chloroform was added, shaken for10 min and centrifuged at 3600 rpm for 10 min. Thesupernatant was separated and evaporated to drynessunder nitrogen gas. The residue was reconstituted

530 REGINA KASPEREK et al.
with 400 µL of mobile phase and 100 µL aliquot ofresulting solution was injected into HPLC appara-tus. The samples setting into the vials were immedi-ately assayed. Having obtained a chromatogram at awavelength of 280 nm, 100 µL of the aliquot wasinjected once again and assayed at a wavelength of238 nm for the assay of DIC and PAP, respectively.
Selectivity The selectivity of the method was tested by
comparing the chromatograms of blank plasma con-trols from six rabbits with that of plasma spiked withDIC, PAP and IS.
SensitivityThe calibration standard at the lowest concen-
tration, yielding a precision with relative standarddeviations (RSD) less than 20% and accuracy with-in 20% of the nominal concentration, was consid-ered to be the lower limit of quantification.
Calibration curveCalibration standards at concentrations of 0.05,
0.125, 0.25, 0.5, 1.25, 2.5 and 5 µg/mL of DIC and0.05, 0.1, 0.2, 0.5, 1, 2, 4 and 6 µg/mL of PAP (n =2) were freshly prepared as described above andassayed on the same day. This assay was repeatedfor five consecutive days with freshly prepared cali-bration standards. The subsequent five calibrationcurves (y = ax + b), represented by the plots of thepeak area of DIC to IS or PAP to IS (y) versus theconcentration of the calibration standards (x), weregenerated and obtained by linear least-squaresregression as the mathematical model.
Accuracy and precisionIn order to validate the intra-day accuracy and
precision, the samples of DIC (0.05, 0,25, 1.25 and5 µg/mL) and PAP (0.05, 0.2, 2, 6 µg/mL) werefreshly prepared and analyzed on the same day (n =5). To validate the inter-day accuracy and precision,the intra-day accuracy and precision assay wasrepeated for three consecutive days. Data are pre-sented in Table 2.
Accuracy was calculated by comparing theaverage concentration found to the known concen-tration, and was expressed in percentage as relativeerror. Precision was evaluated by calculating theRSD of measured concentrations at each level.
RecoveryThe extraction recoveries of DIC and PAP
from rabbit plasma at levels (0.05, 0.25, 1.25 and 5µg/mL of DIC and 0.05, 0.2, 1, 4 µg/mL of PAP)were determined by comparing mean peak area ofDIC/IS or PAP/IS samples to that of unextractedDIC or PAP standards in mobile phase at equivalentDIC or PAP level spiked with IS and expressed inpercentage, respectively.
Stability of samplesShort-term stability of plasma samples was
examined by supplementing blank plasma withappropriate amounts of working solutions of DICand PAP to obtain 0.05, 0.25, 1.25, 5.0 µg/mL ofDIC and 0.05, 0.2, 2.0, 6.0 µg/mL of PAP. Eachsample was analyzed at room temperature for 48 h(every 4 h), including their residence time in anautosampler.
Table 2. Intra- and inter-day validation of the method (precision and accuracy) (n = 5).
Intra-day Inter-day
Added FoundPrecision
Accuracy FoundPrecision
Accuracyconcentration concentration
(% RSD)(relative concentration
(% RSD)(relative
(µg/mL) (µg/mL) error, %) (µg/mL) error, %)
DIC
0.05 0.0477 7.6 4.6 0.0464 5.9 7.2
0.25 0.2395 3.3 4.2 0.2368 4.0 5.3
1.25 1.1588 4.4 7.3 1.1738 2.1 6.1
5 4.6752 4.5 6.5 4.8122 1.7 3.8
PAP
0.05 0.0474 8.7 5.2 0.0482 7.6 3.6
0.2 0.1954 3.4 2.3 0.1952 4.5 2.4
2 1.8463 2.3 7.7 1.8823 5.2 5.9
6 5.4871 7.0 8.5 5.6401 4.8 6.0

Pharmacokinetics of diclofenac sodium and papaverine hydrochloride... 531
The long-term freezer stability of DIC and PAPin rabbit plasma was assessed by analysis after 30days of storage at -20OC. The concentration of thestability of the samples (0.05, 0.25, 1.25, 5.0 µg/mLfor DIC and 0.05, 0.2, 2.0, 6.0 µg/mL for PAP) wascompared to the mean of back-calculated values forthe standards at the appropriate concentration fromthe first day of the long term stability testing.
The long-term freeze-thaw stability of theactive substances at concentrations 0.05, 0.25, 1.25,5.0 µg/mL for DIC and 0.05, 0.2, 2.0, 6.0 µg/mL forPAP in plasma was analyzed in triplicate after 1, 2and 30 days of storage at -20OC.
Pharmacokinetic study
AnimalsThe experiments were carried out on randomly
selected male Berg rabbits weighing 2.5-3.0 kg, pur-chased from the licensed breeder (Lisowski,Parczew, Poland). The animals were kept in cages(one per cage) on a 12-hour day/night cycle withfree access to food and water. Each experimentalgroup consisted of 9-12 animals. The experimentalprotocol was approved by the Local EthicsCommittee at the Medical University of Lublin(license number 36/2007). All procedures were per-formed in compliance with the requirements ofEuropean convention for the protection of vertebrateanimals used for experimental and other scientificpurposes (ETS123, 1991).
Administration and samplingBefore the experiment, the rabbits were fasted
for the period of 12 h but water was available. On the first day of the test, the rabbits were divid-
ed into four groups and each group consisted of threeanimals. DIC and PAP used for intravenous adminis-tration were separately dissolved in sterile apyrogenicsaline. The first group of animals was given a singleintravenous injection of sterile apyrogenic physiologi-cal saline (as negative control), the second group wasadministered DIC at a dose of 12.5 mg/kg body weight(b.w.), the third group was injected with PAP at a doseof 5 mg/kg b.w. and the fourth group with DIC (12.5mg/kg b.w.) and PAP (5 mg/kg b.w.). Intravenousadministration was performed in the marginal ear veinof the rabbits at a volume of 0.5 mL/kg b.w. with ster-ile disposable syringes and needles.
The next day, other rabbits were divided intothree groups and each group consisted of three ani-mals. The first group was orally administered atablet with DIC (12.5 mg/kg b.w.), the second groupwas given a tablet with PAP (5 mg/kg b.w.) and thethird group a tablet composed of DIC (12.5 mg/kg
b.w.) and PAP (5 mg/kg b.w.). The tablets wereadministered via an orogastric tube with 100 mL ofwater. Blood samples were withdrawn from the earvein at different time intervals: 0, 0.5, 1, 2, 3, and 4h. These intervals were chosen because the biologi-cal half-time of DIC and PAP is 1-2 h (3). Inhumans, dogs and pigs the terminal elimination half-lives (t1/2‚) of diclofenac have been reported to rangefrom 1.1 to 2.4 h (9, 41, 42). The blood was collect-ed into heparinized tubes. Plasma was separated andstored at -20OC till the analysis was carried out. Allof the plasma samples were analyzed within a weekafter the separation.
After a lag period of 10 days, the animals werecrossed over and the experiments were repeated.Finally, DIC and PAP were administered intra-venously and orally in single and composed prepa-rations six times (n = 6). The experiment was carriedout at room temperature. All preparations wereadministered in the morning.
Calculations and statistics
The non-compartmental pharmacokineticanalysis of DIC and PAP concentrations in plasmaversus time data were calculated using WinNonlin1.1 software. The plasma concentration ñ time pro-files following a single i.v. or p.o. doses were notadequately fitted with a compartmental model.
Statistical analysis was carried out using SAS9.1.3 (SAS Institute, Cary, NC, USA). The dataobtained were subjected to statistical analysis usingone-way ANOVA and Studentís t-test and a p valueof < 0.05 was considered as statistically significant.
RESULTS AND DISCUSSION
HPLC method development
Different mobile phases were used to deter-mine either DIC or PAP in biological fluids byHPLC (23-28, 34-36). There is no mobile phase forsimultaneous determination of DIC and PAP in bio-logical matrices. In our previous study (40) onsimultaneous determination of DIC and PAP incomposed tablets, the HPLC method with a mobilephase (methanol-water, 60 : 40, v/v) was developed.Bearing those studies in mind, we tried to achieve aproportion of solvents with an optimized separationof the active substances. It was not easy because thesolubility of DIC and PAP is different (3). Variousproportions of methanol-water solvents in mobilephase for determination of DIC in human plasma byHPLC method can be found in the literature (30,43). In our study, methanol-water (55 : 45, v/v) wasselected as the mobile phase for determination of

532 REGINA KASPEREK et al.
Figure 1. Representative chromatograms of: (A1) DIC (4 µg/mL), PAP (2 µg/mL) and phenacetin (IS) (6 µg/mL) standards at 280 nm and(A2) at 238 nm; (B1) blank rabbit plasma at 280 nm; (B2) blank rabbit plasma at 238 nm; (C1) rabbit plasma sample at 0.5 h after oraladministration of composed tablet comprising DIC and PAP and spiked with IS at 280 nm and (C2) at 238 nm; (D1) DIC for LLOQ; (D2)PAP for LLOQ
A1 B1
A2 B2
C1 D1
C2 D2

Pharmacokinetics of diclofenac sodium and papaverine hydrochloride... 533
DIC and PAP in rabbit plasma because of its verysimple composition, and clear baseline separation ofDIC, PAP and IS was obtained (Fig. 1).
A number of NSAIDs have been used as aninternal standard for the analysis of DIC from thebiological matrices (19, 21, 31). Several substances
were tested as IS. There were very poor baselineseparations of ibuprofen, naproxen, ketoprofen orindomethacin from DIC under the experimental con-ditions used in the present study. However, usingphenacetin, clear line separation was achieved.Phenacetin seemed to be the most appropriate drug
Table 3A. Stability of DIC in rabbit plasma samples.
Short-term stability (48 h) in an autosampler
Concentration of DIC (µg/mL)
0.05 0.25 1.25 5.0
Mean 0.055 0.2402 1.37 5.31
SD 0.0013 0.0029 0.0351 0.0922
CV (%) 2.36 1.21 2.56 1.74
Long-term freezer stability (30 days)
Concentration of DIC (µg/mL)
0.05 0.25 1.25 5
Mean 0.048 0.2576 1.29 5.15
SD 0.0019 0.0057 0.0521 0.2138
CV (%) 3.96 2.21 4.04 4.15
Long-term freeze-thaw stability after three cycles (-20OC, 30 days)
Concentration of DIC (µg/mL)
0.05 0.25 1.25 5
% of the initial conc. of DIC after 30 days
97.43 98.32 97.12 98.89
SD 2.14 1.68 1.89 2.21
CV (%) 0.02 0.02 0.02 0.02
Table 3B. Stability of PAP in rabbit plasma samples.
Short-term stability (48 h) in an autosampler
Concentration of PAP (µg/mL)
0.05 0.2 2.0 6.0
Mean 0.053 0.2073 2.09 6.25
SD 0.001 0.0034 0.0321 0.0822
CV (%) 1.89 1.64 1.54 1.32
Long-term freezer stability (30 days)
Concentration of PAP (µg/mL)
0.05 0.2 2.0 6.0
Mean 0.0512 0.2155 2.11 6.17
SD 0.0023 0.0098 0.0821 0.2492
CV (%) 4.49 4.55 3.89 4.04
Long-term freeze-thaw stability after three cycles (-20OC, 30 days)
Concentration of PAP (µg/mL)
0.05 0.2 2.0 6.0
% of the initial conc. of PAP after 30 days
98.32 99.03 95.78 98.16
SD 2.5 1.98 2.08 2.41
CV (%) 0.03 0.02 0.02 0.02

534 REGINA KASPEREK et al.
in the present assay and was chosen because it isstable and does not endogenously exist in plasma.Moreover, it did not interfere with the rabbit plasmasample and it was well separated from DIC andPAP.
Liquid-liquid extraction method was used forsample preparation. When it comes to extractingDIC from plasma after the acidification of the sam-ple, hexane-isopropanol at different ratios (44, 45),acetonitrile (19, 46), and dichloromethane (30) weredescribed in the literature. In our study, chloroformwas used as solvent for extraction after acidificationof plasma sample, because DIC and PAP are solublein acidic medium and IS in chloroform. This solventwas adopted due to its high extraction efficiency andlittle interference.
HPLC method validation
SelectivityNo interference of endogenous and extraneous
peaks with DIC, PAP and IS at their respectiveretention times at two wavelengths (RTDIC = 2.87min, RTIS = 4.77 min and RTPAP = 13.15 min at 280nm and RTPAP = 13.14 min, RTIS = 4.76 min, RTDIC
= 2.85 min at 238 nm) in blank rabbit plasma wasobserved, as shown in Figure 1.
SensitivityThe LLOQ of DIC and PAP in 1 mL rabbit
plasma was observed to be 0.05 µg/mL.
The limit of detection (LOD) for DIC amount-ed to 0.015 µg/mL and for PAP to 0.02 µg/mL,based on a signal to noise ratio > 3.
Linearity of calibration curveThe method has a good linearity over the range
of 0.05-5 µg/mL for DIC and 0.05-6 µg/mL for PAP.The mean regression equation from five replicatecalibration curves was y = 0.1927 (± 0.0415) x +0.0011 (± 0.00062) for DIC and y = 0.1449 (±0.0267) x + 0.0033 (± 0.0017) for PAP. The squareroot of mean correlation coefficient (r2) was 0.9974for DIC and 0.9986 for PAP.
Precision and accuracyThe intra- and inter-day precision and accuracy
validation with samples of DIC and PAP are pre-sented in Table 2. In the range of 0.05-5 µg/mL DIC,the intra- and inter-day assay precision (RSD) variedfrom 3.3 % to 7.6% and from 1.7% to 5.9%, respec-tively. The intra- and inter-day accuracy (relativeerror) ranged from 4.2% to 6.5% and from 3.8% to7.2%, respectively.
In the range of 0.05-6 µg/mL PAP, the intra-and inter-day assay precision (RSD) varied from2.3% to 8.7% and from 4.5% to 7.6%, respectively.The intra- and inter-day accuracy (relative error)ranged from 2.3% to 8.5% and from 2.4% to 6.0%,respectively. The RSD of intra- and inter-day vari-ability was less than 10%, which is within the limit
Table 4. Pharmacokinetic parameters of DIC and PAP in single or composed formulations administered intravenously or orally.
Intravenous Oral
Parameters Single Composed Single Composed
DIC PAP DIC PAP DIC PAP DIC PAP
AUC0→∞
(h∑mg/L)(mean n =
83.88 ± 18.78 21.46 ± 5.71 80.34 ± 12.54 22.24 ± 4.65 24.32 ± 5.57 4.12 ± 1.02 21.52 ± 4.36 3.77 ± 0.66
6, ± SD)
MRT (h)(mean n = 1.30 ± 0.45 0.96 ± 0.33 1.32 ± 0.30 1.56 ± 0.38 2.68 ± 0.66 1.82 ± 0.19 2.16 ± 0.71 2.14 ± 0.306, ± SD)
CL (L/h)(mean n = 0.49 ± 0.13 0.78 ± 0.23 0.49 ± 0.07 0.74 ± 0.21 0.51 ± 0.09 0.79 ± 0.18 0.49 ± 0.11 0.72 ± 0.206, ± SD)
MAT (h)(mean n = 0.72 ± 0.20 0.86 ± 0.43 1.03 ± 0.83 0.76 ± 0.276, ± SD)
F(mean n = 0.30 ± 0.07 0.21 ± 0.11 0.28 ± 0.08 0.18 ± 0.076, ± SD)
Pharmacokinetic parameters of DIC and PAP, administered intravenously and orally showed no statistically significant difference betweensingle or composed formulations (p > 0.05).

Pharmacokinetics of diclofenac sodium and papaverine hydrochloride... 535
A1 B1
C1 D1
C2 D2
A2
B2
Figure 2. Mean plasma concentration-time profile (n = 6) for DIC and PAP in rabbit plasma after an intravenous (i.v.) or oral (p.o.)administration of single (DIC, PAP) or composed (DIC*, PAP*) formulations

536 REGINA KASPEREK et al.
of acceptability (± 15%) (24). These results indicatethat this method had good precision and accuracy.
RecoveryThe mean extraction recoveries of DIC were
found to be 95.78% ± 2.98 of 0.05-5 µg/mL, PAP93.09% ± 3.29 of 0.05-6 µg/mL and IS 95.93% ±1.38 of 5-20 µg/mL, respectively. The recoverieswere not dependent on the concentration and conse-quently resulted in good linearity of the calibrationcurves.
Evaluation of stability of samplesStock solutions of DIC (250 µg/mL), PAP (100
µg/mL) and IS (100 µg/mL), and working solutionsof DIC, PAP and IS were observed to be over 99%of the nominal concentrations after 5 days of storageat 4OC, compared with freshly prepared solutions.Similarly, working solutions of DIC, PAP and ISwere over 99 % of the nominal concentrations after20 days of storage at -20OC.
Short-term stability of active substances inplasma were investigated at room temperature for 48h. After the storage, the coefficients of variation(CV, %) values varied from 1.21 to 2.56 for DICsolutions and from 1.32 to 1.89 for PAP concentra-tions.
Long-term freezer stability of plasma samples(after 30 days of storage at -20OC) CV values foranalyzed DIC samples: 0.05, 0.25, 1.25, 5.0 µg/mLamounted to 3.96, 2.21, 4.04 and 4.15%, respective-ly. PAP (CV) values amounted to 4.49, 4.55, 3.89and 4.04% for concentrations: 0.05, 0.2, 2.0, 6.0µg/mL, respectively.
After storage in long-term freeze-thaw stabilityfor three cycles (-20OC, 30 days) the drugs wereregarded as stable if more than 90% was intact at theend of the study period. The amount of the initialconcentration of DIC and PAP remaining after thistime was: 97.43 ± 2.14%, 98.32 ± 1.68%, 97.12 ±1.89%, 98.89 ± 2.21% for DIC concentrations of0.05, 0.25, 1.25 and 5.0 µg/mL, respectively, and98.32 ± 2.5%, 99.03 ± 1.98%, 95.78 ± 2.08% and98.16 ± 2.41% for PAP concentrations of 0.05, 0.2,2.0 and 6.0 µg/mL respectively.
The results from the stability tests (Tables 3 Aand B) indicated that DIC and PAP were stableunder the conditions studied.
Pharmacokinetic study
The mean plasma concentration-time profilesof DIC and PAP are shown in Figure 2. The phar-macokinetic parameters of DIC and PAP were cal-culated by non-compartmental analysis and are pre-
sented in Table 4. More than 99% of diclofenac isbound to plasma proteins (3, 9) and papaverine isabout 90% (3), therefore, we expected changes inthe pharmacokinetic parameters of substances aftertheir co-administration. As compared with the phar-macokinetic parameters, such as AUC0→∞, MRT andCL of DIC or PAP administered intravenously andorally, after single dose there was no statisticallysignificant difference between single or compoundformulations (p > 0.05). The MAT of DIC and PAPadministered as single or compound formulationswere calculated to be over 1 h and these MAT val-ues presented no statistically significant differencebetween the formulations (p > 0.05). Similarly, afterthe oral administration of DIC to the rabbits, themean MAT was equal to 1.24 h (47). Diclofenacpenetrates to synovial fluid where concentrationsmay persist even when in plasma concentrationsfall. Diclofenac is metabolized by cytochrome P450by phase I hydroxylation and by phase II conjuga-tion with glucuronic acid and the amino acid taurine.Diclofenac is extensively metabolized in camels aswell as in humans, goats and cattle, and this appearsto be mediated by cytochrome P450 2C subfamily(48, 49).
Drug-protein binding has an influence on thedistribution equilibrium of drugs. Only the free,non-protein bound fraction of drug can leave the cir-culatory system and diffuse into tissue. The equilib-rium between free drug can be maintained over arelatively long period of time because of the disso-ciation of the drug-protein complex. The transportfunction of plasma proteins is of importance fordrugs of low solubility in water. Plasma proteinbinding is of significant influence on the distributionequilibrium if the drug is polar and therefore diffus-es slowly into tissue. If, in addition, such a substancehas a high affinity for plasma proteins, displacementfrom its protein binding sites may result in a changeof distribution equilibrium and an altered pharmaco-logic response (50).
The AUC0→∞ values of DIC or PAP after intra-venous injection were higher than after oral admin-istration. It was shown that bioavailability of (F)DIC and PAP after oral administration wasdecreased to over 30% for DIC and 20% for PAP,but for some rabbits bioavailability amounted toover 43% for both DIC and PAP. When DIC is oral-ly administered, it is almost completely absorbeddue to the fact that it is subject to first-pass metabo-lism. In this way about 50% of the drug reaches thesystemic circulation in the unchanged form (3).
The metabolic tracts of both of the substancesshowed that it is possible that a simultaneous admin-
Pharmacokinetics of diclofenac sodium and papaverine hydrochloride... 537
istration of DIC and PAP has no influence on theirpharmacokinetics.
In our study, oral administration of a tablet com-prising DIC and PAP did not change the main phar-macokinetic parameters of the active substances aftersingle dose. Similarly, administration of diclofenacand misoprostol in one composed tablet did notchange the pharmacokinetics of these two drugs (4).
CONCLUSION
Tablets comprising DIC and PAP were preparedand all of tablets fulfilled pharmacopoeal require-ments such as average weight, hardness and assay ofdrug content. A HPLC-UV method with LLE extrac-tion was developed and validated for the quantitativedetermination of DIC and PAP in rabbit plasma. TheLLOQ of the method was 0.05 µg/mL and the sensi-tivity was compared with previously reported HPLC-UV methods using LLE (21) and protein precipitation(19). The proposed method was successfully appliedto determination of DIC and PAP, after injection andoral administration to rabbits, for use in pharmacoki-netic study. A non-compartmental pharmacokineticanalysis showed that oral administration of composedtablet comprising DIC and PAP did not change themain pharmacokinetic parameters such as MRT,MAT, CL and bioavailability of active substancescompared with a single administration of DIC andPAP after single dose.
REFERENCES
1. Davies N.M., Saleh J.Y., Skjodt N.M.: J.Pharm. Pharm. Sci. 3, 137 (2000).
2. Wallace J.L., Del Soldado P.: Fundam. Clin.Pharmacol. 17, 11 (2003).
3. Martindale: The Complete Drug Reference.37th edn., The Pharmaceutical Press, London2011.
4. Karim A., Smith M.: Scand. J. Rheumatol.Suppl. 96, 37 (1992).
5. Smith D.A.: US Patent No. 5. (1999).6. Snir N., Moskovitz B., Nativ O., Margel D.,
Sandovski U., Sulkes J., Livne P. M., LifshitzD.A.: J. Urol. 179, 1411 (2008).
7. Yencilek F., Aktas C., Goktas C., Yilmaz C.,Yilmaz U., Sarica K.: Urology 72, 987 (2008).
8. Kasperek R.: Polish Patent No. P 380847(2010).
9. Willis J.V., Kendall M.J., Flinn R.M., ThornhillD.P., Welling P.G.: Eur. J. Clin. Pharmacol. 16,405 (1979).
10. Fowler P.D., Shadforth M.F., Crook P.R., JohnV.A.: Eur. J. Clin. Pharmacol. 25, 389 (1983).
11. Tang W.: Curr. Drug Metab. 4, 319 (2003).12. Tang W., Stearns R.A., Bandiera S.M., Zhang
Y., Raab C., Braun M.P., Dean D.C. et al.: DrugMetab. Dispos. 27, 365 (1999).
13. Leemann T., Transon C., Dayer P.: Life Sci. 52,29 (1993).
14. Zweers-Zeilmaker W.M., Horbach G.J.,Witkamp R.F.: J. Vet. Pharmacol. Ther. 21, 154(1998).
15. Belpaire F.M., Bogaert M.G., Rossel M.T.:Xenobiotica 5, 413 (1975).
16. Belpaire F.M., Bogaert M.G.: Xenobiotica 5,421 (1975).
17. Rosazza J.P., Kammer M., Youel L.:Xenobiotica 7, 133 (1977).
18. Wilen G., Ylitalo P.: J. Pharm. Pharmacol. 34,264 (1982).
19. El-Sayed Y.M., Abdel-Hameed M.E., SuleimanM.S., Najib N.M.: J. Pharm. Pharmacol. 40, 727(1988).
20. Moncrieff J.: J. Chromatogr. 577, 185 (1992).21. Rigato H.M., Moreno R.A., Orpinelli E.Z., Borges
B.C., Sverdloff C.E., Pedrazzoli J. Jr., BorgesN.C.: Int. J. Clin. Pharmacol. Ther. 47, 132 (2009).
22. Millership J.S., Hare L.G., Farry M., CollierP.S., McElnay J.C., Shields M.D., Carson D.J.:J. Pharm. Biomed. Anal. 25, 871 (2001).
23. Roskar R., Kmetec V.: J. Chromatogr. B Ana-lyt. Technol. Biomed. Life Sci. 788, 57 (2003).
24. Kaphalia L., Kaphalia B.S., Kumar S., KanzM.F., Treinen-Moslen M.: J. Chromatogr. BAnalyt. Technol. Biomed. Life Sci. 830, 231(2006).
25. Nasir F., Iqbal Z., Khan A., Ahmad L., Shah Y.,Khan A. Z., Khan J. A., Khan S.: J.Chromatogr. B Analyt. Technol. Biomed. LifeSci. 879, 3434 (2011).
26. Kumar S.V., Rudresha G., Gurav S., ZainuddinM., Dewang P., Kethiri R.R., Rajagopal S.,Mullangi R.: Biomed. Chromatogr. 27, 203(2013).
27. Lee H.S., Jeong C.K., Choi S.J., Kim S.B., LeeM.H., Ko G.I., Sohn D.H.: J. Pharm. Biomed.Anal. 23, 775 (2000).
28. Davarani S.S., Pourahadi A., Nojavan S.,Banitaba M.H., Nasiri-Aghdam M.: Anal.Chim. Acta 722, 55 (2012).
29. Yilmaz B., Asci A., Palabiyik S.S.: J.Chromatogr. Sci. 49, 422 (2011).
30. Chmielewska A., Konieczna L., Plenis A., Bie-niecki M., Lamparczyk H.: Biomed. Chroma-togr. 20, 119 (2006).

538 REGINA KASPEREK et al.
31. Lala L.G., D'Mello P.M., Naik S.R.: J. Pharm.Biomed. Anal. 29, 539 (2002).
32. Kim E., Ahn B., Noh K., Kang W., Gwak H.S.:J. Sep. Sci. 35, 2219 (2012).
33. Wasfi I.A., Hussain M.M., Elghazali M.,Alkatheeri N.A., Abdel Hadi A.A.: Vet. J. 166,277 (2003).
34. Yilmaz B.: Chromatographia 71, 549 (2010).35. Shaaya A.N., Kraus C., Bauman D.H., Ritschel
W.A.: Methods Find. Exp. Clin. Pharmacol. 14,373 (1992).
36. Wiczling P., Kaliszan R.: J. Chromatogr. A.1217, 3375 (2010).
37. Shamsipur M., Fattahi N.J.: J. Chromatogr. BAnalyt. Technol. Biomed. Life Sci. 879, 2978(2011).
38. Kanto J., Iisalo E., Manell D., M‰ntyl‰ R.: Int.J. Clin. Pharmacol. Biopharm. 17, 375 (1979).
39. Paul B.D., Dreka C., Knigh E.S., Smith M.L.:Planta Med. 62, 544 (1996).
40. Kasperek R.: Acta Pol. Pharm. Drug Res. 65,403 (2008).
41. Tsuchiya T., Terakawa M., Ishibashi K.,Noguchi H., Kato R.: Arzneimittelforschung30, 1650 (1980).
42. Oberle R.L., Das H., Wong S.L., Chan K.K.,Sawchuk R.J.: Pharm. Res. 11, 698 (1994).
43. Blagbrough I.S., Daykin M.M., Doherty M.,Pattrick M., Shaw P.N.: J. Chromatogr. 578,251 (1992).
44. Hinz B., Hug A. M., Fotopoulos G., Gold M.S.:Int. J. Clin. Pharmacol. Ther. 47, 643 (2009).
45. Jantratid E., De Maio V., Ronda E., MattavelliV., Vertzoni M., Dressman J.B.: Eur. J. Pharm.Sci. 37, 434 (2009).
46. Pathan A.R., Karwa M., Pamidiboina V.,Deshattiwar J.J., Deshmukh N.J., Gaikwad P.,Mali S.V. et al.: Inflammopharmacology 18,157 (2010).
47. Said S.A., Sharaf A.A.: Arzneimittelforschung31, 2089 (1981).
48. Sioufi A., Pommier F., Boschet F., Godbillon J.,Lavoignat D., Salliere D.: Biopharm. DrugDispos. 15, 441 (1994).
49. Riess V.W., Schmid K., Botta L., Kobayashi K.,Moppert J., Schneider W., Sioufi A. et al.:Arzneimittelforschung 36, 1092 (1986).
50. Ritschel W.A., Kearns G.L.: Handbook of BasicPharmacokinetics, 7th edn., American Pharma-cists Association, Washington 2009.
Received: 7. 09. 2014

Acta Poloniae Pharmaceutica ñ Drug Research, Vol. 72 No. 3 pp. 539ñ549, 2015 ISSN 0001-6837Polish Pharmaceutical Society
Liquisolid systems (LSS) formulation repre-sents a new, innovative and promising method in theproduction of solid dosage forms with enhanced invitro dissolution rate and improved in vivo bioavail-ability of poorly soluble drugs. The basic principleof LSS formulation lies in sorption of a drug in liq-uid state onto specific carriers and coating materials,resulting in formation of apparently dry, free-flow-ing and readily compressible powder (1). The activeingredients are in liquisolid systems in a similarstate as in soft gelatin capsules filled by a liquiddrug (non-volatile liquid vehicle is used to dissolvethe solid drug and the final preparation does notinvolve drying or evaporation process) (2). It is wellestablished that these formulations show higher andmore consistent bioavailability than conventionaloral dosage forms because the active ingredient isalready dissolved.
Properties of carriers, such as specific surfacearea (SSA) and liquid absorption capacity, are themost important factors in the formulation ofliquisolid systems because they allow incorporation
of a greater amount of the drug in liquid state (3, 4).Therefore, the selection of a carrier mainly dependson its specific surface area, liquid adsorption capac-ity, flowability and compressibility (5).
In the past, colloidal silica (SSA ñ 200 m2/g)(6) was used as a carrier material to prepare thepredecessors of liquisolid systems called ìPowderedSolutionsî. However, these preparations did nothave suitable properties facilitating their compres-sion into tablets (5). Compression enhancers such asmicrocrystalline cellulose were added to powderedsolutions to increase the compressibility of the for-mulation. Nevertheless, product properties werenever standardized to comply with industrialrequirements (7). In modern liquisolid system for-mulations, colloidal silica is used as a coating mate-rial absorbing the excessive liquid from the carrierand thus ensuring good flowability of the createdadmixture (8).
To date, the most commonly used carrier inLSS has been the microcrystalline cellulose (MCC)with SSA about 1.18 m2/g (9). It has been used to
EVALUATION OF SORPTIVE PROPERTIES OF VARIOUS CARRIERSAND COATING MATERIALS FOR LIQUISOLID SYSTEMS
BARBORA VRANÕKOV¡ and JAN GAJDZIOK*
Department of Pharmaceutics, Faculty of Pharmacy, University of Veterinary and Pharmaceutical Sciences,PalackÈho 1/3, Brno 612 42, Czech Republic
Abstract: The basic principle of liquisolid systems formulation lies in the conversion of the drug in a liquidstate into an apparently dry, free-flowing and readily compressible powder by its blending (or spraying) withspecific carriers and coating materials. The selection of the most suitable carrier and coating material dependsespecially on their values of flowable liquid retention potential (Φ), which is defined as the maximum mass ofliquid that can be retained per unit mass of powder material, while maintaining an acceptable flowability. Thepresented work focused on the determination of the maximum amount of propylene glycol (PG), which can beretained by several selected carriers and coating materials while maintaining acceptable flow properties of theliquisolid powder blend. Granulated forms of magnesium aluminometasilicates (NeusilinÆ US2 and NeusilinÆ
NS2N), dibasic calcium phosphate (FujicalinÆ) and microcrystalline cellulose (AvicelÆ PH 101) were tested dueto their frequent use. Powdered forms of magnesium aluminometasilicate (NeusilinÆ UFL2) and colloidal silica(AerosilÆ 200) were used as common coating materials. From the evaluation of liquisolid mixtures with differ-ent amounts of liquid, it could be observed that 1 g of NeusilinÆ US2, NeusilinÆ UFL2, NeusilinÆ NS2N,AerosilÆ 200, FujicalinÆ and AvicelÆ PH 101 can retain 1.00, 0.97, 0.54, 0.04, 0.25 and 0.12 g of propylene gly-col, respectively, while maintaining acceptable flowing properties for further processing.
Keywords: liquisolid systems, flowable liquid retention potential, carrier, coating material, aluminometasili-cates, microcrystalline cellulose, AerosilÆ, NeusilinÆ, FujicalinÆ
539
* Corresponding author: e-mail: [email protected]; phone: +420 541562869; fax: +420 549240589

540 BARBORAVRANÕKOV¡ and JAN GAJDZIOK
prepare liquisolid tablets containing bromhexinehydrochloride (10), ezetimibe (11), flutamide (12),nifedipine (13), valsartan (14), etc. A frequent use ofMCC in liquisolid system formulation is caused byits long-term utilization in pharmaceutical industry,low price, good stability and availability in differentparticle sizes and moisture grades (15). Moreover, inprevious studies it was shown that carriers otherthan MCC, e.g., lactose (SSA ñ 0.35 m2/g) (9), sor-bitol (SSA ñ 0.37 m2/g) (9) and starch (SSA ñ 0.60m2/g) (9), were required in higher amounts for theconversion of a drug in liquid state into dry, non-adherent and free-flowing powdered form (16). Thiswas attributed to a higher specific surface area ofMCC (16). However, on the market, there are avail-able several substances with extremely large SSAand significantly higher liquid absorption capacity,such as magnesium aluminometasilicates, anhy-drous dibasic calcium phosphate, mesoporous sili-cates, etc. (17, 18).
The first of them FujicalinÆ is a syntheticspherically agglomerated anhydrous dibasic calciumphosphate. The unique production process ofFujicalinÆ consists of a restricted crystal growth ofanhydrous dibasic calcium phosphate followed byspray drying of aqueous dispersion of these micro-crystals. Thereby, porous spherical particles con-taining microcrystals of anhydrous dicalcium phos-phate are obtained (19). Its high specific surface area(40 m2/g), porosity and ability to adsorb up to 1.2mL/g (17) of liquid while remaining the dry, freeflowing and compressible powder makes FujicalinÆ
a suitable carrier for liquisolid system preparations.This fact was proved by Hentzschel et al. (3), whoused FujicalinÆ to prepare LSS containing toco-pherol acetate as a model drug.
NeusilinÆ, an amorphous form of magnesiumaluminometasilicate, is commercially available in11 various grades, which differ in their forms (pow-der, granules), bulk densities, water content, particlesizes and pHs (neutral, alkaline) (20). The applica-tion of synthetic magnesium aluminometasilicateshas been an objective of several studies. Theirabsorption properties were used in tobacco industry,for example, where they were added to cigarette fil-ters as aldehyde sorbents (especially formaldehyde)(21). In pharmaceutical technology, they have beenused as carriers for solid dispersions to improve thedrug dissolution or to granulate oily formulationsand to increase the formulation stability (22). Basedon its use as an excipient in various formulations, upto 1.05 g NeusilinÆ can be used in oral formulationsper day (23). Moreover, alkaline grades of NeusilinÆ
are approved as antacid active ingredients with a
maximum dosage of 4 g/day (23). In liquisolid sys-tems, NeusilinsÆ can be used as carriers (granulatedform) and also as coating materials (powderedform). NeusilinsÆ are able to retain a greater amountof a drug in its liquid state than MCC. Disintegrationof tablets containing NeusilinÆ as a carrier is slowerbecause of its poor disintegration properties (24).Recently, NeusilinÆ US2 represents the most com-monly used carrier for LSS formulations from thegroup of magnesium aluminometasilicates (3, 24). Itis prepared by spray drying and thus provides a highporosity, very large SSA (up to 300 m2/g), high liq-uid adsorption capacity (up to 3.4 mL/g), and anti-caking and flow enhancing properties (20, 25).
Mesoporous silicates were originally devel-oped to be applied as molecular sieves (26). In phar-maceutical technology, they were initially used forthe controlled drug delivery (27-29). According totheir extremely large specific surface area (up to1500 m2/g), large pore size and pore volume (30),ordered mesoporous silicates show a high potentialin the preparation of liquisolid systems. Chen et al.(31) used hollow mesoporous silicas (HMS) as car-riers for an insoluble drug carbamazepine dissolvedin PEG 400. A significant improvement of the drugloading and dissolution rate demonstrated that HMScould form good reservoirs for drug solutions toenhance the dissolution of poorly water-solubledrugs (31).
This work is focused on the determination ofcapability of several selected carriers and coatingmaterials to absorb propylene glycol by determiningtheir flowable liquid retention potential for this sol-vent. A granulated form of magnesium alumi-nometasilicates (NeusilinÆ US2, NeusilinÆ NS2N),dibasic calcium phosphate (FujicalinÆ) and micro-crystalline cellulose (AvicelÆ PH 101) were used ascarrier materials. A powdered form of magnesiumaluminometasilicate (NeusilinÆ UFL2) and colloidalsilica (AerosilÆ 200) were used as coating materials.Different amounts of propylene glycol were addedto carriers/coating materials and flow properties ofliquisolid mixtures were evaluated. The flowableliquid retention potential was calculated as a liq-uid/solid mass ratio of the blend with angle of slidecorresponding to 33∞ (4, 32).
MATERIALS AND METHODS
Materials
Magnesium aluminometasilicates (NeusilinÆ
US2, NeusilinÆ NS2N and NeusilinÆ UFL2) andanhydrous dibasic calcium phosphate (FujicalinÆ)were kindly gifted by Fuji Chemical Industry Co.,
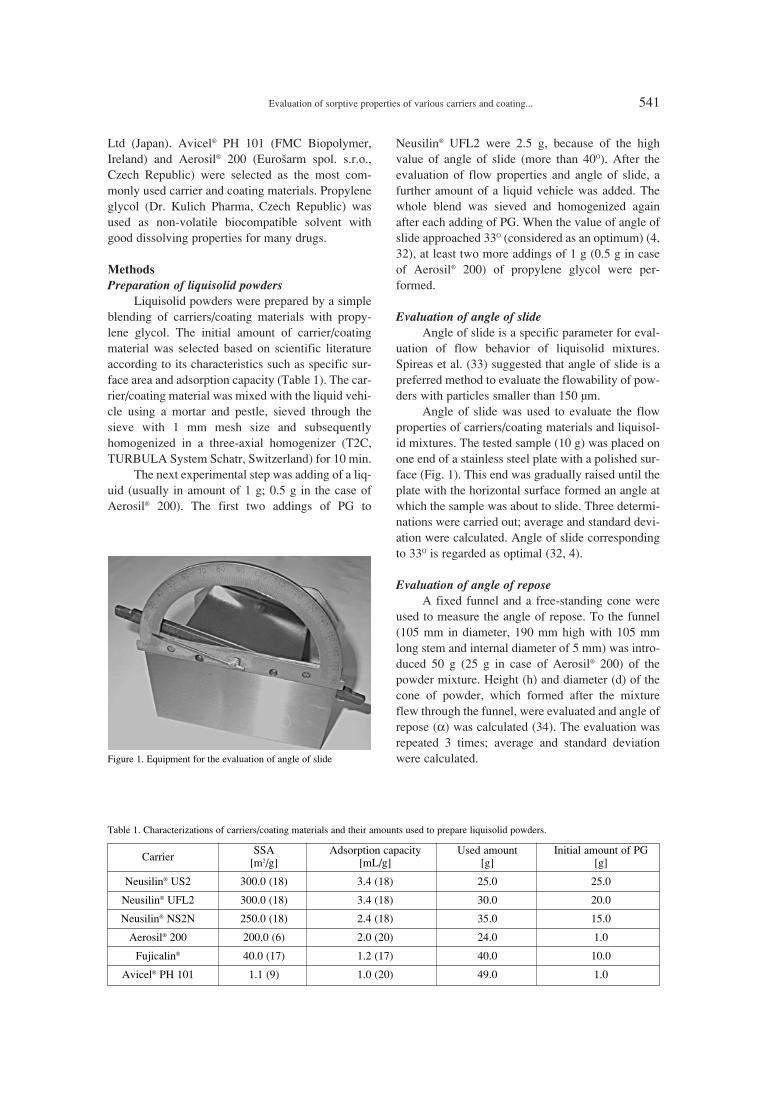
Evaluation of sorptive properties of various carriers and coating... 541
Ltd (Japan). AvicelÆ PH 101 (FMC Biopolymer,Ireland) and AerosilÆ 200 (Euroöarm spol. s.r.o.,Czech Republic) were selected as the most com-monly used carrier and coating materials. Propyleneglycol (Dr. Kulich Pharma, Czech Republic) wasused as non-volatile biocompatible solvent withgood dissolving properties for many drugs.
Methods
Preparation of liquisolid powders Liquisolid powders were prepared by a simple
blending of carriers/coating materials with propy-lene glycol. The initial amount of carrier/coatingmaterial was selected based on scientific literatureaccording to its characteristics such as specific sur-face area and adsorption capacity (Table 1). The car-rier/coating material was mixed with the liquid vehi-cle using a mortar and pestle, sieved through thesieve with 1 mm mesh size and subsequentlyhomogenized in a three-axial homogenizer (T2C,TURBULA System Schatr, Switzerland) for 10 min.
The next experimental step was adding of a liq-uid (usually in amount of 1 g; 0.5 g in the case ofAerosilÆ 200). The first two addings of PG to
NeusilinÆ UFL2 were 2.5 g, because of the highvalue of angle of slide (more than 40O). After theevaluation of flow properties and angle of slide, afurther amount of a liquid vehicle was added. Thewhole blend was sieved and homogenized againafter each adding of PG. When the value of angle ofslide approached 33O (considered as an optimum) (4,32), at least two more addings of 1 g (0.5 g in caseof AerosilÆ 200) of propylene glycol were per-formed.
Evaluation of angle of slideAngle of slide is a specific parameter for eval-
uation of flow behavior of liquisolid mixtures.Spireas et al. (33) suggested that angle of slide is apreferred method to evaluate the flowability of pow-ders with particles smaller than 150 µm.
Angle of slide was used to evaluate the flowproperties of carriers/coating materials and liquisol-id mixtures. The tested sample (10 g) was placed onone end of a stainless steel plate with a polished sur-face (Fig. 1). This end was gradually raised until theplate with the horizontal surface formed an angle atwhich the sample was about to slide. Three determi-nations were carried out; average and standard devi-ation were calculated. Angle of slide correspondingto 33O is regarded as optimal (32, 4).
Evaluation of angle of reposeA fixed funnel and a free-standing cone were
used to measure the angle of repose. To the funnel(105 mm in diameter, 190 mm high with 105 mmlong stem and internal diameter of 5 mm) was intro-duced 50 g (25 g in case of AerosilÆ 200) of thepowder mixture. Height (h) and diameter (d) of thecone of powder, which formed after the mixtureflew through the funnel, were evaluated and angle ofrepose (α) was calculated (34). The evaluation wasrepeated 3 times; average and standard deviationwere calculated.
Table 1. Characterizations of carriers/coating materials and their amounts used to prepare liquisolid powders.
Carrier SSA Adsorption capacity Used amount Initial amount of PG
[m2/g] [mL/g] [g] [g]
NeusilinÆ US2 300.0 (18) 3.4 (18) 25.0 25.0
NeusilinÆ UFL2 300.0 (18) 3.4 (18) 30.0 20.0
NeusilinÆ NS2N 250.0 (18) 2.4 (18) 35.0 15.0
AerosilÆ 200 200.0 (6) 2.0 (20) 24.0 1.0
FujicalinÆ 40.0 (17) 1.2 (17) 40.0 10.0
AvicelÆ PH 101 1.1 (9) 1.0 (20) 49.0 1.0
Figure 1. Equipment for the evaluation of angle of slide

542 BARBORAVRANÕKOV¡ and JAN GAJDZIOK
Evaluation of flowability (flow through the orifice)The total of 50 g (25 g in the case of AerosilÆ
200) of the tested powder sample without compact-ing was introduced into a dry stainless steel funnelwith a closed bottom opening (diameter 25 mm)(MEDIPO, Czech Republic according to Eur. Ph.).The bottom opening of the funnel was unblockedand the time the entire sample needed to flow out ofthe funnel was measured. Three measurements werecarried out; average and standard deviation werecalculated.
Tapped and bulk density measurementsA required amount of the liquisolid powder
was introduced into a dry calibrated cylinder with-out compacting. The powder was carefully leveledand unsettled apparent volume V0 was recorded.Bulk density was calculated in compliance with Ph.Eur. 8 (34).
The cylinder was fixed to the base (SVM 102,ERWEKA GmbH, Germany). After 10, 500 and1250 taps the corresponding volumes V10, V500 andV1250 were marked. Tapped volumes were used tocalculate the tapped density, compressibility index(CI) and Hausner ratio (HR) (34).
Determination of the flowable liquid retention
potential (ΦΦ-value)
Carrier/coating material (amount shown inTab. 1) was mixed with varying amount of propy-lene glycol, sieved through the sieve with mesh size1 mm and homogenized in three-axial homogenizerfor 10 min. Thereafter, flow properties of theseliquisolid mixtures were evaluated. The liquid/solidmass ratio (m/m) of blends with angle of slide cor-responding to 33O was regarded as the Φ-value(Equation 1) of the excipient.
mmaxΦ = ññññññ (1)Q
where mmax is the maximum amount of liquid thatcan be retained per unit mass of the powder materi-al (Q) while maintaining acceptable flowability.
RESULTS AND DISCUSSION
Experimental part of the presented work aimedat the determination of the maximum amount ofpropylene glycol (PG), which can be retained byseveral selected carriers and coating materials whilemaintaining acceptable flow properties of theliquisolid powder blend. Granulated form of magne-sium aluminometasilicates (NeusilinÆ US2 andNeusilinÆ NS2N), dibasic calcium phosphate(FujicalinÆ) and microcrystalline cellulose (AvicelÆ
PH 101) were used as carrier materials. A powderedform of magnesium aluminometasilicate (NeusilinÆ
UFL2) and colloidal silica (AerosilÆ 200) were eval-uated as coating materials. According to the scien-tific literature dealing with liquisolid systems (2,35), angle of slide was selected as the main parame-ter determining flow properties of liquisolid pow-ders. Liquisolid blends with angle of slide close to33O were used to calculate the liquid retention poten-tial (Φ-value, equation 1). In the case when moresimilar values of angle of slide close to 33O wereobtained for different mixtures with variousamounts of propylene glycol, other parameters, suchas angle of repose, flowability, compressibilityindex (CI) and Hausner ratio (HR) were taken underconsideration as auxiliary evaluation parameters.
Evaluation of blank carriers and coating materials
The evaluation of NeusilinÆ US2 flow proper-ties (Table 2) implied that experimentally measuredvalues of angle of slide (35.67 ± 0.58O) were higherthan the required angle of 33O (32, 36). The valuesof angle of repose of 29.66 ± 0.92O were similar tothe value presented by the manufacturer (30.00O)
Table 2. Flow properties of carriers/coating materials.
Carrier/coating Angle of slide Angle of repose Flowability CImaterial [O]
SD[O]
SD[s/50 g]
SD[%]
HR
NeusilinÆ US2 35.67 0.58 29.66 0.92 6.21 0.45 10.59 1.11
NeusilinÆ NFL2 39.33 0.58 41.47 0.67 75.16 3.18 24.75 1.33
NeusilinÆ NS2N 37.17 0.76 25.87 0.49 7.30 2.19 13.27 1.15
AerosilÆ 200 47.00 2.00 NA NA 8 NA 25.00 1.33
FujicalinÆ 23.33 0.76 25.77 0.46 1.16 0.04 6.67 1.07
AvicelÆ PH 101 48.43 1.53 36.25 0.39 8 NA 24.21 1.32
NA = not available.

Evaluation of sorptive properties of various carriers and coating... 543
(20) and indicated excellent flow properties. Otherparameters, e.g., compressibility index (10.59%),Hausner ratio (1.11) and flowability (6.21 ± 0.45s/50 g) referred to its acceptable flow character (34). From Table 2 it is clear that NeusilinÆ UFL2showed, due to its powder form, worse characteris-tics of flow in comparison to granulated forms ofaluminometasilicates (NeusilinÆ US2 and NeusilinÆ
NS2N). This phenomenon is well established alsofor other excipients (e.g., lactose, calcium sulfate,mannitol, etc.) (37, 38). Blank NeusilinÆ UFL2(NeusilinÆ UFL2 without propylene glycol) alsoshowed higher values of angle of slide (39.33 ±0.58O) than optimal 33O. Experimentally measuredvalues of angle of repose (41.47 ± 0.67O) were lowerthan the angle presented by the manufacturer(45.00O) (18) and values of flowability (75.16 ± 3.18s/50 g), CI (24.75%) and HR (1.33) indicated pass-able flow properties of this material (34).
NeusilinÆ NS2N also showed higher values ofangle of slide (37.17 ± 0.76O) in comparison to therecommended value of 33O. However other parame-ters (Table 2), such as angle of repose (25.87 ±0.49O), flowability (7.30 ± 2.19 s/50 g), CI (13.27%)and HR (1.15) implied its excellent/good characterof flow (34).
It was not possible to measure angle of reposeand flowability of AerosilÆ 200 because of its adhe-sion to the surface of funnels and cohesion of porouslightweight particles. CI = 25.00% and HR = 1.33indicated passable flow properties of AerosilÆ 200(34). Angle of slide was 47.00 ± 2.00O, i.e., the sec-ond highest value obtained among the tested materi-als (Table 2).
Evaluation of flow properties of FujicalinÆ
implied its excellent character of flow (Table 2).
Experimentally measured values of angle of repose(25.77 ± 0.46O) and compressibility index (6.67%)were lower than values presented by the manufac-turer (29.50O and 15.10%) (17). FujicalinÆ, due to itsagglomerated character (spray drying preparation),also showed excellent flowability (1.16 ± 0.04) andlow value of angle of slide (23.33 ± 0.76O).
Among the selected carriers/coating materials,AvicelÆ PH 101 showed the highest value of angleof slide (48.43 ± 1.53O). Experimentally measuredvalues of angle of repose (36.25 ± 0.39O) were sim-ilar to the value given by Nada et al. (38.00) (39).Flowability of this type of MCC could not be meas-ured and values of CI (24.21%) and HR (1.32) cor-responded to passable character of flow (34).
Mixture of NeusilinÆ US2 with propylene glycol
From Figure 2 it could be observed that theincreasing amount of propylene glycol decreasedangle of slide of NeusilinÆ US2/PG mixtures. Theblend containing 25 g of PG had the value of angleof slide closest to 33O (32.83 ± 0.29O). Other param-eters of this liquisolid blend, such as angle of repose(24.63 ± 2.14O), flowability (2.57 ± 0.26 s/50 g), CI(10.20%) and HR (1.11) also complied with require-ments for powders with excellent flow properties(Table 3).
From the evaluation of flow properties it isobvious that the increasing amount of propyleneglycol deteriorated angle of repose and flowabilityof liquisolid blend (Table 3). The results impliedthat adding of liquid initially decreased values ofangle of repose from 24.63 ± 0.00O (25 g PG) to22.50 ± 0.00 (26 g PG). However, subsequentadding of propylene glycol increased its values up to29.70 ± 1.78O (blend with 29 g of PG).
Figure 2. Angle of slide of NeusilinsÆ /PG mixtures. The dashed line indicates the desired angle of slide 33O

544 BARBORAVRANÕKOV¡ and JAN GAJDZIOK
The flowability of liquisolid mixture ofNeusilinÆ US2 and PG (maximum value of 3.86 ±0.04 s/50 g in sample with 29 g of sorbed PG) wasenhanced in comparison to flowability of blankNeusilinÆ US2 (6.21 ± 0.45 s/50 g). As can beobserved from Table 3, values of flowabilityincreased from 2.57 ± 0.26 s/50 g (mixture with 25 gof PG) to 3.86 ± 0.04 s/50 g (mixture containing 29g of PG). This deterioration of powder flow proper-ties could be explained by the oversaturation of car-rier with higher amounts of sorbed liquid vehicle.
Compressibility index and Hausner ratio(Table 3) implied the same tendency as angle ofrepose (Table 3). Initially the values decreased butafter adding more PG they increased again. The val-ues correspond to powders with good/excellent flowproperties (34).
The flowable liquid retention potential (Φ-value) of NeusilinÆ US2 mixed with PG was calcu-lated (Equation 1) as the ratio of amount of liquidvehicle (25 g) and weight of carrier (25 g) and isequal to 1.00 (Fig. 3). This experimentally measured
Φ-value is four times higher than that given by Shahet al. (40). In their study, angle of repose was usedas the main parameter for the evaluation of powderflow properties, which could have caused the signif-icant differences between values of flowable liquidretention potential (40).
Mixture of NeusilinÆ UFL2 with propylene glycol
Adding of 20 g of PG to NeusilinÆ UFL2increased the angle of slide from 39.33 ± 0.58O to 47.00± 2.65O. The subsequent adding of propylene glycoldecreased the mixture values to 34.33 ± 0.58O (29 g ofPG), as shown in Figure 2. However, further additionsof liquid vehicle increased the values of angle of slideagain. Mixture containing 29 g of PG showed angle ofslide 34.33 ± 0.58O, which was the closest value to 33O,regarded as optimum. Other parameters of this liquisol-id powder sample, such as angle of repose (47.70 ±0.50O), CI (25.56) and HR (1.34) referred to passable orpoor character of flow (34) (Table 4).
Based on the evaluation of angle of repose,compressibility index and Hausner ratio (Table 4),
Table 3. Flow properties of NeusilinÆ US2 and PG mixtures.
Amount of PG Angle of reposeSD
FlowabilitySD
CIHR
[g] [%]** [O] [s/50 g] [%]
25 100 24.63 2.14 2.57 0.26 10.20 1.11
26 104 22.50 0.00 2.86 0.27 9.38 1.10
27 108 24.47 0.46 3.43 0.54 12.50 1.14
28 112 26.85 0.13 3.30 0.26 13.83 1.16
29 116 29.70 1.78 3.86 0.04 14.13 1.16
* Sample with most suitable properties is written in bold. ** In relation to the carrier material.
Table 4. Flow properties of NeusilinÆ UFL2 and PG mixtures.
Amount of PG Angle of reposeSD
FlowabilitySD
CIHR
[g] [%]** [O] [s/50 g] [%]
20.0 66.7 41.17 0.45 8 NA 23.76 1.31
22.5 75.0 42.70 0.98 8 NA 27.55 1.38
25.0 83.3 43.53 0.29 8 NA 27.08 1.37
26.0 86.7 44.47 0.29 8 NA 26.04 1.35
27.0 90.0 42.03 0.29 8 NA 25.53 1.34
28.0 93.3 36.77 0.64 8 NA 22.89 1.30
29.0 96.7 42.70 0.50 8 NA 25.56 1.34
30.0 100.0 38.67 0.65 8 NA 19.10 1.24
31.0 103.3 34.80 0.70 8 NA 20.88 1.26
32.0 106.7 38.67 0.65 8 NA 22.45 1.29
* Sample with most suitable properties is written in bold. ** In relation to the coating material. NA = not available.

Evaluation of sorptive properties of various carriers and coating... 545
there was observed no obvious dependence on theamount of propylene glycol added to NeusilinÆ
UFL2. All the measured values were in the rangegiven by Ph. Eur. 8.0 for fair, passable or poor pow-der flow properties. The flowability of PG/NeusilinÆ
UFL2 mixtures could not be evaluated. The insuffi-cient character of flow is caused by the presence ofNeusilinÆ UFL2 in its powdered form (18).
The Φ-value for the NeusilinÆ UFL2 mixedwith PG was calculated as the ratio between theamount of liquid vehicle (29 g) and weight of carri-er (30 g) and was equal to 0.97 (Fig. 3).
Mixture of NeusilinÆ NS2N with propylene glycol
From Figure 2 it is clear that the angle of slidedecreased with the increasing amount of propyleneglycol in PG/NeusilinÆ NS2N mixtures. The mixturecontaining 19 g of PG showed the value of angle of
slide (33.67 ± 1.16O) closest to 33O. The mixturesíangle of repose (35.99 ± 2.05O) referred to fair flowproperties and values of CI (21.28%) and HR (1.27)implied passable character of powder flow (34).
Evaluation of flow properties implied that theincreasing amount of propylene glycol deterioratedangle of repose, flowability, CI and HR of liquisol-id blend (Table 5).
The flowable liquid retention potential was cal-culated for the mixture containing 19 g of propyleneglycol. The Φ-value for Neusilin NS2N is equal to0.54 (Fig. 3).
Mixture of AerosilÆ 200 with propylene glycol
Figure 4 and Table 6 imply that mixing ofAerosil 200 with propylene glycol improved flowproperties of liquisolid mixtures. Values of angle ofslide decreased after adding 2 g of PG to 29.00 ±
Figure 3. Flowable liquid retention potential (Φ-value) of carriers/coating materials
Figure 4. Angle of slide of AerosilÆ 200, FujicalinÆ and AvicelÆ PH 101 mixtures with PG. The dashed line indicates the desired angle ofslide 33O

546 BARBORAVRANÕKOV¡ and JAN GAJDZIOK
0.50O. Mixture containing 1 g of PG revealed theclosest value (32.00 ± 0.50O) to the optimal angle ofslide of 33O. Other parameters, such as CI (15.29%)and HR (1.18) referred to powders with good char-acter of flow (34).
Angle of repose could not be evaluated.Flowability (Table 6) of liquisolid blends wasimproved by adding of propylene glycol.Polyethylene glycol could act as a lubricant (41) andhence enhance flowability of powder samples.
Values of CI and HR (Table 6) increased withthe increasing amount of PG. Additions of PGcaused deterioration of its flow properties from goodto fair character of flow.
The Φ-value for the AerosilÆ 200 mixed withPG was calculated as the ratio of amount of liquidvehicle (1 g) and weight of carrier (24 g) and isequal to 0.042 (Fig. 3). This experimentally meas-ured value is significantly lower than valuesdescribed in literature (1.5 (42) and 3.31 (43)). Thisdifference could have been caused by poor homo-geneity of the liquisolid blend prepared by simpleblending. Higher homogeneity of mixtures could bereached by spraying propylene glycol ontocarrier/coating material in the fluid bed equipment.
Mixture of FujicalinÆ with propylene glycol
Evaluation of angle of slide (Fig. 4) impliedthat adding of propylene glycol increased its valuesin comparison to angle of slide of blank FujicalinÆ.Mixture containing 10 g of PG had the closest valueof angle of slide (32.83 ± 0.29O) to the recommend-ed 33O. The angle of repose (29.70 ± 2.97O), flowa-bility (1.03 ± 0.09 s/50 g), CI (8.24%) and HR (1.09)of this liquisolid powder sample also met the require-ments for powders with excellent flow properties.
Adding of propylene glycol also had a negativeeffect on values of angle of repose (Table 7). Themeasured values increased up to 32.60 ± 1.39O (mix-ture containing 12 g of PG). The lowest angle ofrepose (27.30 ± 1.21O) had the liquisolid blend with11 g of PG.
Evaluation of flowability (Table 7) impliedthat mixing of FujicalinÆ with a liquid vehicledecreased its values. The flowability enhancingcould be caused by filling of irregularities on carri-ersí surface with propylene glycol (44).
Values of CI and HR (Table 7) increased afteradding PG. However, all values were in the rangegiven by Ph. Eur. 8.0 for excellent character of pow-der flow.
Table 5. Flow properties NeusilinÆ NS2N and PG mixtures.
Amount of PG Angle of reposeSD
FlowabilitySD
CIHR
[g] [%]** [O] [s/50 g] [%]
15 42.9 28.61 0.81 9.31 0.55 16.49 1.20
16 45.7 31.97 0.87 10.65 0.69 16.84 1.20
17 48.6 33.91 1.44 12.34 0.31 20.00 1.25
18 51.4 36.38 3.40 11.40 0.44 20.21 1.25
19 54.3 35.99 2.05 10.37 0.24 21.28 1.27
20 57.1 35.34 070 9.48 0.27 22.58 1.29
21 60.0 40.11 0.71 8.12 0.96 21.11 1.27
* Sample with most suitable properties is written in bold. ** In relation to the carrier material.
Table 6. Flow properties of AerosilÆ 200 and PG mixtures.
Amount of PG Angle of reposeSD
FlowabilitySD
CIHR
[g] [%]** [O] [s/50 g] [%]
1.0 4,2 NA NA 45.31 0.81 15.29 1.18
1.5 6,3 NA NA 24.81 3.31 16.25 1.19
2.0 8,3 NA NA 24.45 2.63 17.95 1.22
* Sample with most suitable properties is written in bold. ** In relation to the coating material. NA = not available.

Evaluation of sorptive properties of various carriers and coating... 547
The flowable liquid retention potential (Φ-value) of FujicalinÆ mixed with PG was calculatedas the ratio of amount of liquid vehicle (10 g) andweight of carrier (40 g) and was equal to 0.25 (Fig.3).
Mixture of AvicelÆ PH 101 with propylene glycol
From Figure 4 it is obvious that adding ofpropylene glycol to AvicelÆ PH 101 initiallydecreased the values of angle of slide. Mixtures con-taining 3-6 g of PG revealed similar values of angleof slide, i.e., about 35.00O. Subsequent adding ofpropylene glycol increased angle of slide up to48.67 ± 1.53O (mixture with 8 g of PG), which couldbe explained by the oversaturation of microcrys-talline cellulose with propylene glycol. The valueclosest to 33O had the mixture containing 6 g ofsorbed PG (34.83 ± 0.29O). The angle of repose(31.37 ± 3.23O) and flowability (3.63 ± 0.52 s/50 g)of this liquisolid blend referred to a good characterof flow and its values of CI (17.72%) and HR (1.22)corresponded to fair flow properties (34).
Mixing AvicelÆ PH 101 with an increasingamount of PG implied that adding of a liquid vehi-cle initially had a negative effect on mixturesí angle
of repose. The angle of repose values (Table 8)increased after adding PG up to 36.97 ± 1.31O (blendcontaining 4 g of PG) and then, after further addingof PG decreased to 31.37 ± 3.23O (6 g of PG).However, subsequent adding of PG increased angleof repose up to 40.10 ± 0.69O again (8 g of PG). Thefinal deterioration of flow properties could havebeen caused by the oversaturation of carrier particleswith PG.
Evaluation of flowability implied similar phe-nomenon as the angle of repose. Initially, the meas-ured values decreased and then after adding morepropylene glycol increased again. The lowest valueof flowability (3.07 ± 0.34 s/50 g) showed theliquisolid powder containing 4 g of PG.
Compressibility index and Hausner ratioimplied the same tendency as flowability and angleof repose. Their values corresponded to powderswith fair/passable flow properties (34).
The flowable liquid retention potential (Φ-value) for AvicelÆ PH 101/PG admixture was calcu-lated as the ratio of amount of liquid vehicle (50 g)and weight of carrier (6 g) and is equal to 0.12 (Fig.3). This experimentally measured Φ-value is almostsimilar to those presented in scientific literature for
Table 7. Flow properties of FujicalinÆ and PG mixtures.
Amount of PG Angle of reposeSD
FlowabilitySD
CIHR
[g] [%]** [O] [s/50 g] [%]
10 25.0 29.70 2.97 1.03 0.09 8.24 1.09
11 27.5 27.30 1.21 0.95 0.05 10.23 1.11
12 30.0 32.60 1.39 1.10 0.07 10.59 1.12
* Sample with most suitable properties is written in bold. ** In relation to the coating material.
Table 8. Flow properties of AvicelÆ PH 101 and PG mixtures.
Amount of PG Angle of reposeSD
FlowabilitySD
CIHR
[g] [%]** [O] [s/50 g] [%]
1 2 35.53 1.68 7.46 0.41 21.96 1.28
2 4 37.83 0.96 5.64 3.26 18.67 1.23
3 6 35.45 0.92 3.07 0.12 18.18 1.22
4 8 36.97 1.31 3.07 0.34 16.22 1.19
5 10 34.80 6.70 3.08 0.25 15.79 1.19
6 12 31.37 3.23 3.63 0.52 17.72 1.22
7 14 35.25 1.53 4.95 0.67 17.02 1.21
8 16 40.10 0.69 6.03 0.40 16.47 1.20
* Sample with most suitable properties is written in bold. ** In relation to the carrier material.

548 BARBORAVRANÕKOV¡ and JAN GAJDZIOK
AvicelÆ PH 101 (0.16) (42, 45) and AvicelÆ PH 102(0.16) (33, 43).
CONCLUSION
In the technique of liquisolid systems formu-lation, carrier and coating materials play dominantroles in an effort to obtain dry forms of powderfrom a drug in liquid state, which are suitable forfurther processing. Previously, it was observed thata high specific surface area and adsorption capaci-ty of carriers and coating materials allowed incor-poration of a greater amount of liquid. The evalua-tion of flowable liquid retention potential shouldconstitute the main parameter when selecting themost suitable carrier/coating material for formula-tion of liquisolid systems. From the obtainedresults it could be concluded that 1 g of NeusilinÆ
US2, NeusilinÆ UFL2, NeusilinÆ NS2N, AerosilÆ
200, FujicalinÆ and AvicelÆ PH 101 can retain 1.00,0.97, 0.54, 0.04, 0.25 and 0.12 g of propylene gly-col, respectively, while maintaining suitable flow-ing properties for further processing.Experimentally measured values of flowable liquidretention potential implied that there are availablecarriers with greater absorption capacity in com-parison to the most commonly used microcrys-talline cellulose. Magnesium aluminometasilicates(NeusilinsÆ) promised a high potential as carriersand coating materials in the preparation of liquisol-id systems.
REFERENCES
1. Javadzadeh Y., Siahi M.R., Asnaashari S.,Nokhodchi A.: Acta Pharm. 57, 99 (2007).
2. Tiong N., Elkordy A A.: Eur. J. Pharm.Biopharm. 73, 373 (2009).
3. Hentzschel C M., Sakmann A., Leopold C.S.:Drug. Dev. Ind. Pharm. 37, 1200 (2011).
4. Karmarkar A.B., Gonjari I.D., Hosmani A.H.:Expert Opin. Drug. Deliv. 7, 1227 (2010).
5. Kavitha K., Lova Raju K.N.S., Ganesh N.S.,Ramesh B.: Der Pharmacia Lettre 3, 71 (2011).
6. Javadzadeh Y., Jafari-Navimipour B.,Nokhodchi A.: Int. J. Pharm. 341, 26 (2007).
7. Kulkarni A.S., Aloorkar N.H., Mane M.S., GajaJ.B.: Int. J. Pharm. Sci. Nanotechnol. 3, 7950(2010).
8. Gavali S.M., Pacharane S.S., Sankpal S.V.,Jadhav K.R., Kadam V.J.: Int. J. Res. Pharm.Chem. 1, 705 (2011).
9. Nokhodchi A., Hentzschel C.M., Leopold C.S.:Expert Opin. Drug Deliv. 8, 191 (2011).
10. Gubbi S., Jarag R.: Res. J. Pharm. Technol. 2,382 (2009).
11. Khanfar M., Sheikh S.M., Hawari R.: Pharm.Dev. Technol. 18, 417 (2013).
12. Elkhodairy A.K., Samy M.W.: Lett. Drug Des.Discov. 9, 336 (2012).
13. Panda A., Biyani D. M.: Am. J. Pharmtech. Res.3, 686 (2013).
14. Chella N., Shastri N., Tadikonda R.R.: ActaPharm. Sin. B 2, 502 (2012).
15. Rowe R.C., Sheskey P.J., Owen S.C.:Handbook of Pharmaceutical Excipients,Pharmaceutical Press, London 2006.
16. Javadzadeh Y., Shariati H., Movahhed-DaneshE., Nokhodchi A.: Drug. Dev. Ind. Pharm. 35,243 (2009).
17. Fuji Chemical Industry Co., Ltd.: http://www.harke.com/fileadmin/images/pharma/Broschu-eren/Fuji_Fujicalin_Brochure_SEP2011.pdf(accessed 15.1.2014).
18. Fuji Chemical Industry Co., Ltd.: http://www.neusilin.com (accessed 15.1.2014).
19. Hentzschel C. M., Sakmann A., Leopold C.S.:Pharm. Dev. Technol. 17, 649 (2012).
20. Fuji Chemical Industry Co., Ltd.: http://www.harke.com/fileadmin/images/pharma/Broschu-eren/Fuji_Neusilin.pdf (accessed 20.1.2014).
21. Taniguchi H.: EP 2540174 A1, 2013.22. Krupa A., Majda D., Jachowicz R., Mozgawa
W.: Thermochim. Acta 509, 12 (2010).23. Sander C., Holm P.: AAPS PharmSciTech 10,
1388 (2009).24. Hentzschel C.M., Alnaief M., Smirnova I.,
Sakmann A., Leopold C.S.: Eur. J. Pharm.Biopharm. 80, 130 (2011).
25. Khanfar M., Fares M.M., Salem M.S., QandilA.M.: Micropor. Mesopor. Mat. 173, 22 (2013).
26. Vialpando M., Backhuijs F., Martens J.A., Vanden Mooter G.: Eur. J. Pharm. Biopharm. 81,190 (2012).
27. Wu Z., Jiang Y., Kim T., Lee K.: J. Control.Release 119, 215 (2007).
28. Ukmar T., Planinöek O.: Acta Pharm. 60, 373(2010).
29. Vallet-Regi M., Ramila A., del Rea R.P., PÈrez-Pariente J.: Chem. Mater. 13, 308 (2001).
30. Zhu W., Wan L., Zhang C., Gao Y., Zheng X.,Jiang T., Wang S.: Mater. Sci. Eng. C. Mater.Biol. Appl. 34, 78 (2014).
31. Chen B., Quan G., Wang Z., Chen J., Wu L., XuY., Li G., Wu C.: Powder Technol. 240, 48 (2013).
32. Karmarkar A.B., Gonjari I.D., Hosmani A.H.,Dhabale P.N., Bhise S.B.: Int. J. Health. Res. 2,45 (2009).

Evaluation of sorptive properties of various carriers and coating... 549
33. Spireas S.S., Jarowski C.I., Rohera B.D.:Pharm. Res. 9, 1351 (1992).
34. European Pharmacopoeia 8.0.: http://online6.edqm.eu/ep800 (accessed 1.2.2014)
35. Elkordy A.A., Essa E.A., Dhuppad S., Jammi-qumpula P.: Int. J. Pharm. 434, 122 (2012).
36. Elkordy A.A., Tan X.N., Essa E.A.: Eur. J.Pharm. Biopharm. 83, 203 (2013).
37. Bolhuis G.K., Zuurman K.: Drug Dev. Ind.Pharm. 21, 2057 (1995).
38. Takano K., Nishii K., Mukoyama A., IwadateY., Kamiya H., Horio M.: Powder Technol.122, 212 (2002).
39. Nada A.H., Graf E.: Eur. J. Pharm. Biopharm.46, 347 (1998).
40. Shah C.V., Patel H.K., Shah V.H., UpadhyayU.M.: Int. J. Pharm. Sci. Res. 3, 2741 (2012).
41. Hersh M., Lentine C.V.: US 4620974 A, 1985.42. Kaur M., Bala R., Arora S.: Int. Res. J. Pharm.
4, 156 (2013).43. Sathali A.A.H., Deepa C.: Int. J. Res. Pharm.
Sci. 4, 238 (2013).44. Zhou Q., Denman J.A., Gengenbach T., Das S.,
Qu L., Zhang H., Larson I. et al.: J. Pharm. Sci.100, 3421 (2011).
45. Khanfar M., Salem M.S., Kaddour F.: Pharm.Dev. Technol. 19, 103 (2014).
Received: 19. 03. 2014


Acta Poloniae Pharmaceutica ñ Drug Research, Vol. 72 No. 3 pp. 551ñ558, 2015 ISSN 0001-6837Polish Pharmaceutical Society
The pharmacotherapy of the child population,which is non-homogenous, occasionally requires theusage of medicinal products initially registered foradults. Enabling the dosage of a manufactured pedi-atric medicinal product, meant for various bodyweights, would result in producing many differentdoses of the medicine formulation. As following, thetechnological development, the registration processand the multi-dose manufacturing, appear as non-profitable for the manufacturer (1). This is a reasonfor many medicines, efficient in child treatment,remaining unavailable in an appropriate dose andformulation. Lack of availability, of either themedicinal product intended to be used for children,or such in a dose which is fitting for the individualchildís needs, results in physicians administeringmedicines meant for the adult.
As an example of such practice, the adminis-tration of a manufactured tablet in a dose for adults,
requires its adjustment to the childís needs, and thesplitting of it into smaller portions. Commonly prac-tised is splitting a tablet into two or four parts by thepatient or their carer.
Tablets containing perforations are especiallymeant for such a case. The method, however, is notwholly precise and should be practised neither withstrong agents and a narrow therapeutic index, norwith tablets possessing a notably small diameter.Each part of the split tablet may have a differentmass, which is in turn connected to specific, albeitvarying, contents of the agent.
Another method aimed at adjusting the dose tothe childís needs is that of preparing divided pow-ders for an internal use, compounded from conven-tional tablets. The aforementioned are preparedbased on the doctorís prescription, by authorizedindividuals, in the pharmaceutical conditions suchas the formula room, employing usage of the appro-
EVALUATION OF CASES WITH THE USAGE OF COMMERCIALLY AVAILABLE TABLETS IN THE PEDIATRIC FORMULA
ELØBIETA KURIATA1* and WIES£AW SAWICKI2
1 Voivodeship Farmaceutical Inspectorate in Olsztyn, Poland 2 Chair and Department of Physical Chemistry, Faculty of Pharmacy with Subfaculty of Laboratory
Medicine, Medical University of GdaÒsk
Abstract: Lack of availability, of either the medicinal product intended to be used for children, or such in adose which is fitting for the individual childís needs, results in physicians administering medicines meant forthe adult. The target of the thesis was to evaluate the cases with the usage of commercially avaible conventionaltablet-formulated medicinal products intended for the adult in the pediatric formula. The subjects of the evalu-ation were the form of the pediatric drug, prepared from commercially available tablets and capsules, as wellas the legitimacy of their usage in the treatment of the pediatric population. One hundred and fifty-four pre-scriptions filled in community pharmacies of Warminsko-Mazurskie Voivodeship in 2011 were chosen. A totalof 5805 divided powders in starch capsules were prepared. The prescribing practice included 6 groups of man-ufactured medicinal products in the form of conventional tablets, containing as follows: anti-hypertensive med-icines (ACE inhibitors ñ enalapril, captopril, ramipril, loop diuretics ñ furosemide, potassium sparing diureticsñ spironolactone, fl-adrenolytics ñ propranolol, α- and β-adrenolytics ñ carvedilol), medicines for heart failure(foxglove glycosides ñ digoxin, methyldigoxin), anti-clotting medicines (acetylsalicylic acid), peristalsis stim-ulating agents (metoclopramide), antibacterial medicines (furagin), and dopaminergic (carbidopa-levodopa).The only compounded forms ordered by the physicians were divided powders for an internal use. Starch cap-sules for powder preparation provided the only ëpackageí for the dose of the compounded powder, which afterpouring, solving or suspending in water was administered to children. Such a shift of the form, between an oraltablet and divided powder for an internal use, did not cause a change in the method of administration. The infor-mation on indications and the way of dosage for children, inserted in the Summary of Product Characteristics,enables the administration which follows the registered indications, despite the shortage of an appropriate dosein the pharmaceutical market. In contrast, an absence of the information regarding the indications and a dosagefor children in the Summary of Product Characteristic, results in an off-label administration, in case of a child.
551
* Corresponding author: e-mail: [email protected]

552 ELØBIETA KURIATA and WIES£AW SAWICKI
priate scales and utensils. A correct calculation ofthe amount of tablets to be used for the powder is avital question. Such a calculation is achieved in rela-tion to a declared amount of the agent in a singletablet. Medicinal substances can be blended withneutral excipients, equipped with filling properties.An increase in the powder mass results, as the usedmedicinal substance is applied in very small doses.The ready powders are then placed in starch or hardgelatin capsules, as well as in paper sachets. Such amethod, however, cannot be used to split modifiedrelease tablets. The situation in question could leadto the change of the absorption site and the bio-availability of the medicinal substance.
The following way of the dose adjustment topediatric needs is solving or suspending the sub-stance (powdered tablet or the content of a capsule)in either a solvent or a dispersing solution.
This is how we achieve liquid forms of drugswhich seem to be the most appropriate oral formulaaddressed to the new-born, infants and younger chil-dren. The pharmaceutical market currently offersready liquid bases, featured with various flavorsacceptable to the childís palate.
The disadvantage of this form is a low physico-chemical stability of the medicinal substance; ahigher, compared with powders, probability of for-mula incompatibility occurrence; and the growth ofmicrobes in the aqueous surrounding.
Each medicinal product to be marketed in theEU should have complete and up-to-date informa-tion before obtaining marketing authorization. Thisincludes the information for patients (PatientísLeaflet) as well as the information for healthcareproviders (Summary of Product Characteristics) andlabeling (2). Such are the registration documents ofthe medicinal product manufacturer, necessary to itsmarketing.
The Summary of the Product Characteristicscontains i.a. the following information: the name ofthe medicinal product; its qualitative and quantita-tive composition, pharmaceutical form, and thera-peutic indications; its posology, and the method ofadministration for adults and, where necessary, forchildren (3). The dosage is specified for eachmethod of administration. The European Comissionrecommends that if the product is indicated in thepediatric population, posology recommendationsshould be given for each of the relevant subsets. Theage limits should reflect the benefit-risk assessmentof the available documentation for each subset. Ifthe product is indicated in children and no adequatepediatric formulation can be developed, detailedinstructions on how to obtain an extemporaneous
preparation should be included in the section dedi-cated to special precautions for the disposal of aused medicinal product, with a cross-reference inthe section for posology and method of administra-tion (4).
The target of the thesis was to evaluate thecases with the usage of commercially available con-ventional tablet-formulated medicinal productsintended for the adult in the pediatric formula.
The subjects of the evaluation were the form ofthe pediatric drug, prepared from commerciallyavailable tablets and capsules, as well as the legiti-macy of their usage in the treatment of the pediatricpopulation.
EXPERIMENTAL
The study consisted of the analysis and theevaluation of the compounded drug prescriptions,filled in community pharmacies of Warminsko-Mazurskie Voivodeship in 2011.
The preliminary study embraced 1699 pedi-atric prescriptions, filled in sixteen community phar-macies. For a further evaluation, the prescriptionswith the usage of manufactured tablets meant foradults were chosen. One hundred and fifty-four pre-scriptions met the above criteria, which constituted9% of all pediatric prescriptions. One hundred andfifty-four compounded drugs in the form of dividedpowders for an internal use, in the number placedbetween 20 and 40 per script, were a result of theaforementioned prescriptions. A total of 5805 divid-ed powders in starch capsules were prepared. Theprescriptions for children, containing manufacturedtablets, were filled in six pharmacies. This constitut-ed 37.5% of all pharmacies embraced within thestudy.
RESULTS
Based upon the body of the actual prescription,the authorized personnel, masters of pharmacy orpharmaceutical technicians, prepared divided pow-ders for an internal use.
The preparation of the powders utilized tech-nological processes such as crushing the tablet orpouring the content of a hard capsule and powderingin a mortar; thorough blending with an excipient;proper weighing; and finally, placing into starchcapsules with the diameter of 14 mm (No. 2) or of16 mm (No. 3).
The amount of the excipient used as filler wasestimated depending upon the preference of theactual person compounding the medicine. Most

Evaluation of cases with the usage of commercially available tablets... 553
commonly it occurred to hesitate between 0.1 and0.2 g of dextrose or lactose per unit of powder. Thenext step took place already in the household condi-tions, and consisted of emptying the starch capsulesfrom the mixture powder by the childrenís carers,and stirring or solving it in a small amount of wateror milk, and then administering it orally to a child.
The prescribing practice included 6 groups ofmanufactured medicinal products in the form ofconventional tablets, containing as follows: anti-hypertensive medicines (ACE inhibitors ñ enalapril,captopril, ramipril, loop diuretics ñ furosemide,potassium sparing diuretics ñ spironolactone, β-adre-nolytics ñ propranolol, α- and β-adrenolytics ñcarvedilol), medicines for heart failure (foxgloveglycosides ñ digoxin, methyldigoxin), anti-clottingmedicines (acetylsalicylic acid), peristalsis stimulat-ing agents (metoclopramide), antibacterial medi-cines (furagin), and dopaminergic (carbidopa-lev-odopa). Additionally, according to the doctorísorder, one of the two excipients were subsequentlyadded to each powder: lactose or dextrose.
The thesis gives both, the analysis and estimateof the following data: the place of the prescribingpractice, the doctorís speciality, the patientís age,the content of the compounded drug, its amount andits form. Table 1 shows which of the substances theevaluated amount of pediatric powders contained.
In some patients a few substances were appliedat the same time. Each of them was prescribed sep-arately and placed in separate starch capsules. The
following combinations of the medicinal substanceswere reported:● captopril, carvedilol, spironolactone, β-methyl-
digoxin● enalapril, propranolol● digoxin, captopril, spironolactone● captopril, spironolactone
The childrenís ages varied from 2 weeks up to4 years. The prescribing practice were applied byphysicians of the specialities as given: pediatrician,cardiologist, neo-natologist, family doctor, pulmo-nologist, general practitioner and the non-specialityphysician delivering their service within the hospitalward, the outpatient clinic and the hospice homecare.
In all studied cases, the same formula of thecompounded drug was prepared ñ divided powdersfor an internal use in starch capsules, in the numberbetween 20 and 40. For preparation of the com-pounded drugs were used manufactured medicinalproducts - ordinary, non-modified release tablets.Moreover, there were used hard capsules filled witha medicinal substance and excipients, as well ashydrophilic membrane tablets ñ helpful with swal-lowing and covering up an unpleasant flavor, in caseof the latter.
The recommended dosages of active medicineswere contained in the Summary of ProductCharacteristics for each of the following: CaptoprilJelfa (2008), Captopril Polfarmex (2008), Enarenal(2007), Axtil (2009), Spironol (2010), Verospiron
Table 1. The occurrence of the medicinal substance in the evaluated amount of compounded pediatric pow-ders.
Medicinal Amounts of % powderssubstance powders (n = 5.805)
Captopril 1870 32.21%
Carbidopa-levodopa 700 12.06%
Spironolactone 660 11.37%
Carvedilol 520 8.96%
β-Methyldigoxin 440 7.58%
Acetylsalicylic acid 365 6.29%
Propranolol 360 6.20%
Enalapril 300 5.17%
Metoclopramide 200 3.45%
Ramipril 160 2.76%
Digoxin 120 2.07%
Furosemide 80 1.38%
Furagin 30 0.52%

554 ELØBIETA KURIATA and WIES£AW SAWICKI
(2009), Furosemidum (2008), Propranolol (2008),Carvedilol (2011), Digoxin Teva (2008), Bemecor(2008), Acesan (2010), Metoclopramid (2008),Furaginum (2008), Nacom mitte (2008).
The outcomes of the prescription analysisreferred to the ordered medicinal substance; thechildís age, the way of dosage of the compoundeddrugs and the medicinal products used for theirpreparation, are shown in Table 2.
Hypotensive medicines
Amongst ACE inhibitors only captopril is rec-ommended by the manufacturer to be used with
infants and children. Admittedly, there is no manu-factured medicinal product in an appropriate dose;the producer, however, gives a thorough descriptionof the pediatric dosage in the registration docu-ments. Captopril is recommended for children withan initial dose of 0.3 mg/kg b.w. and in case of chil-dren with kidney dysfunction, preterm infants,newly born and infants with an initial dose of 0.15mg/kg b.w..
The recommended dosage of enalapril is 2.5mg for children with body weight between 20 and50 kg. The medicine is not recommended for thenew-born, children and young people with
Table 2. The most frequently prescribed active substances including pharmacological groups, childís age, dosage and commercial medic-inal products used to prepare analyzed powders.
Active substance Childís age Dosage Medicinal product used
Hypotensive drugs
0.1-0.65 mgEnalapril 1 - 28 months 2 times daily Enarenal 5 mg ◊ 30 tab.
1 or 2 powders3 times daily
Captopril 2 ñ 48 months 1, 2, 3 mg Captopril 12.5 mg ◊ 30 tab. 1, 2 or 3 times daily
Ramipril 5.5 ñ 8 months 0.3 mg Axtil 2.5 mg ◊ 30 tab.1 or 2 times daily
Furosemide 18 months 2.5 mg Furosemid 40 mg ◊ 30 tab.2 times daily
Spironolactone 2 ñ 12 months 2.0-3.0 mg Spironol 25 mg ◊ 20 tab.,1 or 2 times daily Verospiron 50 mg ◊ 30 cap.
Propranolol 6 ñ 12 months 3.0 mg Propranolol 40 mg ◊ 50 tab.3 times daily
Carvedilol 2 - 7 months 0.1 or 0.2 mg Carvedilol 6.25 mg ◊ 30 tab. 2 or 3 times daily
Cardiac drugs
Digoxin 2 ñ 3 months 0.015 mg Digoxin 0.1 mg ◊ 30 tab. 2 times daily
β-Methyldigoxin 2 ñ 7 months 0.01 mg Bemecor 0.1 mg ◊ 30 tab. 2 times daily
Anti-clotting drugs
Acetylsalicylic acid 6 ñ 17 months 15 mg Acesan 30 mg ◊ 60 tab. once daily
Peristalsis stimulating drugs
Metoclopramide 3 years 6 months 2.5 mg Metoclopramid 10 mg ◊ 50 tab. hydrochloride 2 times daily
Antibacterial drugs
Furagin 10 months 10 mg Furaginum 50 mg ◊ 30 tab. once daily
Antiparkinsonism drugs
Carbidopa-levodopa 4 years 10 mg Nacom mitte 2.3 times daily
Evaluation of cases with the usage of commercially available tablets... 555
glomerular filtration rate (GFR) < 30 mL/1.73 m2.In the studied cases the medicine was given to chil-dren of the age from 2 weeks up to 28 months. Thedosage was determined by the manufacturer basedupon the body weight of the child. In contrast, theinformation about the childís weight was not givenin the prescription which is the basis for preparationof a compounded drug. The manufacturer oframipril does not recommend the usage in cases ofchildren and young people below the age of 18 inrelation to the lack of enough safety and efficacydata.
In the evaluated prescriptions for preparationof a compounded drug, one used spironolactone oftwo manufacturers. The descriptions from the regis-tration documents of both vary subtly as for theusage in children. One of the producers recommendsthe usage for children and young people below 18with a saturating dose of 2ñ3 mg/kg b.w. in 1-4divided doses and one maintaining dose of 1-1.5mg/kg b.w. The medicine is possible to crush andthen administer with fluid. While the other manu-facturer restricts only to a short description: 3.0mg/kg b.w. once or in two divided doses.
According to the registration documents,furosemide cannot be applied in children who arenot capable of swallowing a tablet. In this case, thedosage places between 1 mg and 3 mg/kg b.w. onceevery 24 h. One must not apply the doses larger than40 mg per 24 h independently from the childís bodymass.
α-Adrenolytics as well as α- and β-adrenolyt-ics were represented by propranolol and carvedilol.The former is recommended for children above 6 atthe dose of 20 mg 2-3 times daily. The manufactur-er of the latter shows the lack of experience in usageof the drug in case of children and young people.
Cardiac drugs
Digoxin is recommended to be used withinfants and children. The manufacturer did not mar-ket the pediatric dose, however, they neverthelessdescribed thoroughly the way of dosage in the regis-tration documents - for infants and children up to 2years old a saturating dose 20-35 µg/kg b.w., with amaintaining dose 5-9 µg/kg b.w., for children 2-12years old a saturating dose of 10ñ15 µg/kg b.w., witha maintaining one 3-5 µg/kg b.w..
It was observed that in the case of the otherchild the doctor ordered β-methyldigoxin. The pro-ducer of this medicine in the registration documentsdoes not give any information referring to the safetyor unsafeness of the usage with children. The dosageof this drug is related to the adult group only.
Anti-clotting drugs
Acetylsalicylic acid should not be used forchildren up to 12 years in case of viral infectionsbecause of the possibility of Reyeís syndromeoccurrence.
Peristalsis stimulating drugs
Metoclopramide hydrochloride should not beapplied for children below 15 years of age.
Antibacterial drugs
The indications for the application of furaginrefer to children over 2 up to 14 in a dose of 5 mg to7 mg/b.w. 24 h in 2-3 divided doses. A tablet can becrushed and stirred with milk. In case of childrenbelow 2 the dose has to be estimated directly by thephysician.
Antiparkinsonism drugs
Complex medicines consisting of carbidopaand levodopa are not recommended for patientsbelow 18 years since there is not sufficient dataregarding either the safety or the efficacy in infantsand children.
DISCUSSION
One of the vital issues of the thesis was verify-ing and evaluating the way the pharmaceutical mar-ket responds to the needs of pediatric pharmacother-apy when faced with the shortage of appropriateforms and doses of a medicinal product. Deducedfrom the literature the usage of such drug forms assuppositories and per rectum fluids is recommendedfor the new-born and infants. Starting from the one-month-old liquid forms are preferable, along withthose of tablets, granulates or powders which can beadministered with drinks or food (1). The research-es conducted in 16 European countries in 2003showed that the methods of preparing a pediatricform and dose varied depending upon the countrywhere the compounded drug was prepared. InDenmark, England, Ireland, Norway and Sweden,liquid forms seem to be preferable. The majority ofsuch are drops, solutions, suspensions, emulsionsand sirups (5, 6).
There are still many countries in Europe wherepharmacists prepare their own sirups and suspend-ing vehicles due to low cost, local availability, andthe policy. Contamination is more likely to occur ina poorly-preserved preparation when a single stor-age container is placed in and out of refrigeration formultiple sampling during the intended in-use shelflife of an extemporaneous preparation. The use of

556 ELØBIETA KURIATA and WIES£AW SAWICKI
commercially available vehicles is recommended(7). For oral liquids in European formulary practice,the universal, commercial suspending vehicles areused (for example: OraÆ-products). Such consist ofsuitable preservatives (methylparaben, potassiumsorbate) and flavors, and allow to spare time forpreparing formulation, to mask an unpleasant tasteand to provide the conditions which make the prepa-ration more stable (8).
There are several studies concerning the stabil-ity of medicinal substance in a liquid vehicle whichwere conducted in the USA and in Europe. Oralpediatric liquids with propranolol, prepared fromtablets in a simple sirup with sorbitol and glycerolwith no preservative remained stable for at least 35days, stored either at 25OC or 4OC. Oral pediatric liq-uids with enalapril maleate, prepared from tablets ina raspberry sirup or 85% orthophosphoric acid solu-tion, remained stable for at least 30 days, stored at25OC or 4OC. All suspensions contained methylhydroxybenzoate 0.2% as a preservative (8, 9).
Even if no microbial or fungal growth wasobserved in the non-preserved medium, there is alack of any reliable evidence regarding its microbio-logical stability. Therefore, a storage time exceeding14 days should be avoided (8, 9).
In Belgium, Croatia, France, Sweden andSwitzerland, hard gelatine capsules are a preferredform, whose structure consists of two cylindricalparts, both with rounded ends (5, 6). A powderedsubstance is placed in one and closed with the fittingother. These capsules are usually intended to beswallowed as a whole; however, in case of infantsand young children, one should open a capsule andhaving its content mixed with a small amount of liq-uid, administer as a drink (6). In Italy, Finland,Scotland and Portugal, the most commonplace aredivided powders (5, 10). Such are packed in papersachets. All substances, after being powdered andweighed, are put into small, folded paper bags, everysingle one of which is treated as a unit dose of thedrug. The medicine is administered after solving thecontent in water, milk or other fluid.
In the group of prescriptions, reviewed in thethesis, the only form of a compounded drug pre-scribed by physicians were divided powders for aninternal use. Such powders were prepared with theusage of starch capsules. This form is intended to beswallowed as a whole, which makes it inappropriatefor infants and young children. In the referred cases,the aforementioned had to be taken as a specific unitdose ëpackageí in order to be administered to chil-dren, after mixing with drink as a liquid suspensionor a solution.
In the actual pharmaceutical formula, the usedmedicinal products were only non-modified releasetablets and plain capsules. After micronization of atablet, or the content of a hard gelatine capsule, thepowders were stirred with an excipient, lactose ordextrose.
The size of the crushed grains of the powderplays a crucial role in the stability of the medicinalsubstance, among others upon its photochemical sta-bility. The smaller the size of the grains, the morerapidly the photo-degradation rate constant grows.Facing that fact, the usage of lactose was desirable.Lactose is easily prone to a free radicals attack. Mostlikely, it acts as a free radicals transmitter in order toinhibit the medicinal substance degradation (11).
It should be noted that pharmacy-compounded,divided powders, enabled the application of thepediatric doses which are not manufactured by thepharmaceutical industry. The shift of the form ofmedication did not change the method of adminis-tration, as in all the cases the drug was to be takenorally.
The other analyzed issue was the legitimacy ofthe usage of the medicinal products being a subjectof the study in the treatment of the child population.The manufacturers of medicinal products areobliged in the registration process to prepare theSummary of the Product Characteristics intended formedical personnel, as well as the patientís leaflet,both containing i.a. indications, precautions and theway of dosage of the product. In case of thosemedicinal products which are in the registrationdocuments intended and precisely described as forthe dosage for children, there is no doubt pertainingto their usage. This refers to medicinal products con-taining captopril, spironolactone, digoxin and fura-gin. Such group may also include furosemide. Themanufacturer does not, however, recommend thedrug in case of children who have problems withswallowing a tablet. Although it does appear moreprofitable for the patients to administer the medi-cine, in the form of divided powders that areprocessed into a liquid form in the household condi-tions by the childís carer. In such a situation, there isno barrier with swallowing the tablet. The appropri-ate dosage for children was determined by the man-ufacturer as ranging from 1 to 3 mg/kg b.w.
The problem occurs in case of the pediatricusage of those medicinal products which are notindicated for children, or do not have an appropriatedose. The treatment beyond the indications given inthe Summary of the Product Characteristics isnamed as ëoff-labelí. Prescribing an ëoff-labelí med-icine results in accepting responsibility for the effect

Evaluation of cases with the usage of commercially available tablets... 557
of its action. A physician can prescribe an ëoff-labelídrug beyond the medical experiment and clinical tri-als procedures only if the aforementioned physiciandoes not expect the possibility of such constitutingan illegal act, or does not intend the extension of themedical knowledge (to discover or to prove theeffect of the drug), and the efficacy of the hithertoapplied methods appears to be insufficient (12).
The usage of off-label drugs in the pediatricpopulation is known worldwide. The off-label med-icines are applied first and foremost during hospitaltreatment. For instance, based upon the studies car-ried out in France among 989 hospitalised patients,it was revealed that 56% of children had one or moreoff-label status medicines prescribed (13).
Whereas, the Brazilian research conductedupon 61 patients had demonstrated that 27.7% of theprescribed drugs for infants were off-label medica-tion (14). Parallel with these was the Palestinianstudy, where 35.3% of 387 hospitalized children hadthe drugs of the same as the aforementioned statusprescribed (15).
The preparation of off-label drugs in commu-nity pharmacies is most commonly connected withpost-hospital treatment and a necessity for continu-ing hospital-ordained pharmacotherapy.
In the literature, there are four cases of drugusage beyond the strictly registration-adhered indi-cations (16):1. The usage of a medicinal product in a way which
is not mentioned in the registration documents.2. The usage of a drug following the registered indi-
cations in patients for whom there is no dosagedetermined.
3. The usage of a drug in an indication that is notmentioned in the registration documents, but ofwhich there is reliable data warranting its safetyand efficacy.
4. The usage of a drug in a new indication which isnot mentioned in the registration document, butof which there is scientific-based evidence war-ranting its efficacy and safety.
Enalapril (3 cases), propranolol, metoclo-pramide and acetylsalicylic acid were applied in thepatients for whom there is no dosage determined.The registration-related indications of enalaprildosage refer to the childís body weight and recom-mend the dose of 2.5 mg for a child of 20ñ50 kg b.w.The data in the prescription give only the childísage, and they should not be compared with thechildís body weight; however, the assumption of atwo-week- or one-month -old child whose bodyweight is at least 20 kg does not seem to be accept-able. In the registration documents the manufacturer
did not take into consideration children with thebody weight below 20 kg. Propranolol is recom-mended for children above the age of 6. The drug,however, has been administered to a patient between6 and 12 months old. Metoclopramide should not beused with children below the age of 15. The medi-cine, though, was administered to a 4-year-old child.The registration documents of acetylsalicylic aciddo not contain the dosage for children. The otherremaining substances i.e., ramipril, carvedilol,methyldigoxin and carbidopa-levodopa do not haveregistration indications applying to the treatment ofchildren.
In the aforementioned situations, the medicineswhich were administered to children had an ëoff-labelí status. In cases of some indications, the PolishMinistry of Health accepts the usage of ëoff-labelídrugs and refunds their cost. Since 2012, the off-label medicines have been mentioned in the list ofreimbursed drugs, including the range of their out-of-registration indications which are embraced withthe reimbursement. Amongst the off-label drugsaccepted by the Ministry of Health for childrenbelow 18 are those described in the thesis:carvedilol, ramipril, carbidopa-levodopa, propra-nolol and enalapril (17).
CONCLUSION
Ordaining and preparing compounded drugs incommunity pharmacies created the possibility ofadjusting the doses of medicinal substances, con-tained in manufactured medicinal products intendedfor the adult, to individual needs of the children. Theonly compounded form ordered by the physicianswere divided powders for an internal use. The ordi-nation of any other pediatric form was not observed.Starch capsules for powder preparation provided theonly ëpackageí for the dose of the compoundedpowder, which after pouring, solving or suspendingin water was administered to children. The additionof lactose to the content of the compounded drugmay contribute to the growth of photo-stability ofthe medicinal substance received via micronizationof a ready medicinal product. Such a shift of theform, between an oral tablet and divided powder foran internal use, did not cause a change in the methodof administration. The information on indicationsand the way of dosage for children, inserted in theSummary of Product Characteristics, enables theadministration which follows the registered indica-tions, despite the shortage of an appropriate dose inthe pharmaceutical market. In contrast, an absenceof the information regarding the indications and a

558 ELØBIETA KURIATA and WIES£AW SAWICKI
dosage for children in the Summary of ProductCharacteristic, results in an off-label administration,in case of a child.
REFERENCES
1. Madanecka A., Sznitowska M.: Forum Medy-cyny Rodzinnej 3, 6 (2009) (Polish).
2. Dzioba £., StaÒczak A.: Acta Pol. Pharm. DrugRes. 69, 341 (2012).
3. European Commission Directive 2001/83/EC,6th November 2001.
4. European Comission Guideline on Summary ofProduct Characteristics. Revision 2, (2009).
5. Brion F., Nunn AJ., Rieutord A.: Acta Paediatr.,92, 486 (2003).
6. Helin-Tanninen M.: http://epublications.uef.fi/pub/urn_nbn_fi_uef-20100060/urn_ nbn_fi_uef-20100060.pdf
7. Ghulam A., Keen K., Tulen K., Chi-Kei WongI., Long P.F.: Ann. Pharmacother., 41, 857(2007).
8. Muúko M., Sznitowska M.: Acta Pol. Pharm.Drug Res. 70, 137 (2013).
9. Sosnowska K., Winnicka K., Czajkowska-Koúnik A.: Acta Pol. Pharm. Drug Res. 66, 321(2009)
10. Teixeira de Barros C.M., Almeida A.J.: EJHPPractice, 14, 26 (2008).
11. JamrÛgiewicz M., JasiÒska K., Sawicki W.:Farm. Pol. 68, 858 (2012) (Polish).
12. Kanturski J., Prokuratura i Prawo, 10, 94 (2012)(Polish).
13. Chalumeau M., Treluyer J.M., Salanave B.,Assathiany R., Cheron G., Crocheton N. et al.:Arch. Dis. Child. 83, 502 (2000).
14. Carvalho C.G., Ribeiro M.R., Bonilha M.M.,Fernandez Jr. M., Procianoy R.S., Silveira R.C.:Journal of Pediatria, 88, 6 (2012).
15. Khdour M.R., Hallak H.O., Shabían K.A.A.,AlShahed Q.N., Hawwa A.F., McElnay J.C; Int.J. Clin. Pharm. 33, 650 (2011).
16. Zajdel J.: Przegl. Lek. 68, 33 (2011) (Polish).17. Reimbursement list (2012): http://www2.mz.
gov.pl/wwwmz/index?mr=m111111&ms=&ml=pl&mi=&mx=0&mt=&my=0&ma=031339
Received: 8. 04. 2014

Acta Poloniae Pharmaceutica ñ Drug Research, Vol. 72 No. 3 pp. 559ñ567, 2015 ISSN 0001-6837Polish Pharmaceutical Society
Mucoadhesion has been defined as interfacialforce interactions between polymeric materials andmucosal tissues. Significant attention has been paidto the design of novel drug delivery systems withability to prolong the residence time of dosage formsas well as sustain drug release and consequentbioavailability (1-4). Various routes of administra-tion such as ocular, nasal, buccal, vaginal and rectal,make mucoadhesive drug delivery systems anattractive and flexible dosage form.
While several synthetic and natural polymershave been investigated extensively for this purpose (2,5), the use of natural polymers for pharmaceuticalapplications is attractive because they are readily avail-able and economical, non-toxic, potentially biodegrad-able and with few exceptions, also biocompatible.Also, plant resources, if cultivated or harvested in asustainable manner, can provide a renewable supply ofraw materials. Natural polymers have been successful-ly employed to formulate solid, liquid and semi-soliddosage forms and are specifically useful in the designof modified release drug delivery systems (5, 6).
Many synthetic polymers such as polyacrylicacid (PAA), polymethacrylic acid, cellulose deriva-tives, polyethylene oxide have been used as
mucoadhesive drug carriers. However, these areassociated with undesirable mucosal irritation andhence, the need for the development of natural poly-mers as bioadhesive drug delivery systems (7, 8).Controlled release drug delivery technology mini-mizes the frequency of administration by keepingthe drug in therapeutic window for a longer period,improves patient compliance and reduces drugwastage by optimizing the efficacy of drugs (9, 10).However, controlled release technology generally isinadequate and incapable of increasing gastric resi-dent time of drugs (11, 12).
Cedrela odorata (Meliaceae) is a widely dis-tributed tropical plant and produces a clear gum. Thepolysaccharide isolated from the C. odorata, con-tains galactose, arabinose and rhamnose as neutralsugars and uronic acid residues. These sugar acidsare represented by glucuronic acid and its 4-O-methyl derivative. The cationic composition of theash showed the presence of calcium and magnesiumpredominantly (13). The flow behavior of C. odora-ta dispersion under steady shear is highly non-Newtonian and is characterized by the lack of a low-shear limiting Newtonian viscosity plateau even atvery low shear rates (14).
RELEASE AND MUCOADHESION PROPERTIES OF DICLOFENAC MATRIXTABLETS FROM NATURAL AND SYNTHETIC POLYMER BLENDS
MICHAEL A. ODENIYI1,2*, NASIR H. KHAN2 and KOK K. PEH2
1 Department of Pharmaceutics & Industrial Pharmacy, University of Ibadan, Ibadan, Nigeria2 Department of Pharmaceutical Technology, School of Pharmaceutical Sciences, Universiti Sains Malaysia,
11800 Minden, Penang, Malaysia
Abstract: The delayed release and mucoadhesive properties of Cedrela gum and hydroxypropylmethylcellu-lose blend in diclofenac sodium tablet formulations were evaluated. Tablets were prepared by direct compres-sion and the crushing strength and detachment force were found to increase from 74.49 ± 1.22 to 147.25 ± 2.57N and 0.302 ± 0.36 to 1.141 ± 0.05 N from low to high level of polymers, respectively. The release kinetics fol-lowed Korsmeyer-Peppas release and the n varied between 0.834 and 1.273, indicating that the release mecha-nism shifts from Fickian to super case I (anomalous release). The drug release profile fits a pulsatile-release pat-tern characterized by a lag time followed by a more or less rapid and complete drug release. The Cedrela gum-hydroxypropylmethylcelluse blend tablets delayed diclofenac release for 2 h and sustained the release for 12 h.The polymer blend delayed drug release in the 0.1 M HCl simulating gastric environment and subsequentrelease pH 6.8 phosphate buffer.
Keywords: Cedrela gum, delayed release, ducoadhesion matrix, polymer blend, release mechanism
559
* Corresponding author: e-mail:[email protected]; phone: +234-7088194371

560 MICHAEL A. ODENIYI et al.
Cedrela gum has been found to be effective asa suspending agent (15), a carrier for theophiline inmicrocapsule formulation (16) and as a binder intablet formulations at relatively low concentrationswith potential bioadhesive properties (17). Cedrelagum hydrates quickly and hence cannot form astrong gel to retard drug release, while hydroxy-propyl methylcellulose forms firm gel but do nothydrate quickly (18, 19). Further, while the mucoad-hesive properties of HPMC have been found to beonly moderate, the gum displays significant adhe-sive potential in a tablet formulation (17). Hence, ablend of HPMC and Cedrela gum is being investi-gated in order to overcome the limitations of theindividual polymers. The initial drug burst releaseobserved with formulations incorporating HPMCwould be controlled by the strong binding propertiesof the natural gum while the subsequent drug releaseand matrix integrity maintained by the firm gelformed by HPMC.
Diclofenac sodium (DS), a widely used non-steroidal anti-inflammatory drug that exhibits anti-rheumatic, analgesic, osteoarthritis, and anti-pyreticactivities, was chosen as the model drug. It has ashort half-life in plasma of one to two hours.
MATERIALS AND METHODS
Materials used in this study include diclofenacsodium (Unique Chemicals, Gujarat, India), Cedrelagum (obtained from the incised trunk of Cedrelaodorata (Meliaceae) tree, Botanical Gardens,University of Ibadan, Ibadan, Nigeria, hydroxy-propyl methylcellulose (MethocelÆ K100M,Colorcon, UK), Tablettose (Meggle Pharma,Germany), Aerosil (Uitgest, Holland), magnesiumstearate (R&M Chemicals, Essex, UK). Materialswere used as received. Other reagents were of ana-lytical grade.
Preparation of gum
Cedrela gum was extracted from the incisedtrunk of Cedrela odorata from the Botanical Garden,University of Ibadan (Ibadan, Nigeria) and authenti-cated at the Department of Botany Herbarium,University of Ibadan (UIH-22378), and purifiedusing previous methods (17). Briefly, the exudatewas hydrated in 0.5 : 95.5 (v/v) CHCl3/water mix-ture for five days with intermittent stirring; extrane-ous materials were removed by straining through amuslin cloth. The gum was precipitated from solu-tion with absolute ethanol. The precipitated gumwas filtered, washed with diethyl ether, and thendried in hot air oven at 40OC for 18 h. The gum waspulverized using a laboratory blender, sieved andthe size fraction < 170 µm was used for the study.
Formulation design and matrix tablet preparation
The formulation design for the matrix tablets isgiven in Table 1. Cedrela gum was evaluated at 10,30 and 50 mg while HPMC K100M was evaluatedat 10, 20 and 30 mg in the tablet formulations.
Study of interaction between Cedrela gum and
diclofenac sodium
Fourier transform infrared (FTIR) spec-troscopy (on Model 2000 Perkin ElmerSpectroscopy, USA apparatus) was carried out tocheck the compatibility of the drug and excipients inthe final formulation. The IR spectra of the sampleswere obtained using KBr discs that were preparedwith hydraulic press after careful grinding of a smallamount of each sample with KBr. The spectral widthwas 400ñ4,000 cm-1. Each spectrum was acquired byperforming 32 scans.
Preparation of matrix tablets
Matrix tablets were produced by weighting,screening, and mixing the excipients through a 40-
Table 1. Formulation design for diclofenac sodium matrix tablets (in mg).
Ingredient F1 F2 F3 F4 F5 F6 F7 F8 F9
Diclofenac sodium 200 200 200 200 200 200 200 200 200
Cedrela gum 10 30 50 10 30 50 10 30 50
HPMC 10 10 10 20 20 20 30 30 30
Tabletosse 176 156 136 166 146 126 156 136 116
Aerosil 2 2 2 2 2 2 2 2 2
Magnesium stearate 2 2 2 2 2 2 2 2 2
Total (mg) 400 400 400 400 400 400 400 400 400

Release and mucoadhesion properties of diclofenac matrix tablets... 561
mesh sieve, to which the active ingredient wasadded and mixed thoroughly. Bulk density andtapped density of the powder blend was determinedwith graduated cylinders according to USP guide-lines. Hausner ratio and Carrís index were deter-mined to assess the flow property and compressibil-ity of the powder blend (20). The powders werecompressed using a tabletting machine (ManestyMachine Ltd., England) fitted with round, concavefaced, 10 mm diameter punches and dies. The com-pression force was 1 tonne.
Evaluation of tablets
Twenty tablets were powdered individuallyand a quantity equivalent to 100 mg of diclofenacsodium was accurately weighed and extracted with asuitable volume of pH 6.8 phosphate buffer. Eachextract was filtered through Whatman filter paperNo. 41 (Whatman Paper Limited, UK) and analyzedspectrophotometrically (Hitachi U2000, Tokyo,Japan) at 276 nm after sufficient dilution.
The matrix tablets were also evaluated forcrushing strength using a hardness tester (ErwerkaAapparatebau GmbH, Germany), friability (ErwekaAapparatebau GmbH, Germany), weight variation
using analytical balance (Citizen CY 200), andthickness using digital micrometer gauge (Mitutoyo,Japan).
Determination of ex vivo mucoadhesive strength
Mucoadhesion testing was conducted ex vivousing freshly incised cow intestine from a slaughterhouse. Measurements were made with a TextureAnalyser (TA-XT2i, Stable Micro Systems, Surrey,UK). Each tablet was attached to the base of an alu-minium probe (using double-sided adhesive tape)fixed to the mobile arm of the texture analyzer. Thetablet was lowered at a rate of 0.1 mm/s until contactwith the intestine was made. A contact force of 0.25N was maintained for 5 min, after which the probewas withdrawn from the intestine at a rate of 0.1m/s. The peak detachment force (N) was recorded asa measure of bioadhesion (21, 22). Triplicate deter-minations were made with typically a coefficient ofvariation (cv) of < 5 %.
Drug release
The in vitro drug dissolution study was carriedout in 900 mL of 0.1 M HCl at 37.0 ± 0.5OC for thefirst one hour and pH 6.8 phosphate buffer for 11 h,
Table 2. Micromeritic properties of powder blends of the various formulations.
Formulation code
F1 F2 F3 F4 F5 F6 F7 F8 F9
Bulk density (g/cm3) 0.476 0.435 0.455 0.417 0.455 0.385 0.385 0.370 0.385
Tapped density (g/cm3) 0.625 0.588 0.625 0.625 0.556 0.526 0.556 0.526 0.556
Carrís index (%) 23.810 26.087 27.273 33.333 18.182 26.923 30.769 29.630 30.769
Hausnerís ratio 1.313 1.353 1.375 1.500 1.222 1.368 1.444 1.421 1.444
Table 3. Physical characteristics and bioadhesive properties of matrix tablets.
Formulation Diameter Thickness Crushing Friability Drug content Peak detachmentcode (mm) (mm) strength (N) (%) (%) force (N)
F1 10.0 ± 0.05 5.26 ± 0.03 74.49 ± 1.22 0.12 ± 0.01 98.42 ± 1.63 0.304 ± 0.24
F2 10.0 ± 0.03 5.27 ± 0.01 85.31 ± 1.43 0.01 ± 0.03 98.03 ± 1.54 0.302 ± 0.36
F3 10.0 ± 0.04 5.20 ± 0.06 113.29 ± 2.21 0.01 ± 0.01 98.51 ± 2.39 1.236 ± 0.13
F4 10.0 ± 0.01 5.30 ± 0.04 90.65 ± 0.14 0.01 ± 0.01 98.45 ± 2.18 0.740 ± 0.04
F5 10.0 ± 0.05 5.28 ± 0.03 147.25 ± 2.57 0.01 ± 0.01 98.83 ± 1.39 1.017 ± 0.08
F6 10.0 ± 0.03 5.28 ± 0.01 109.76 ± 1.32 0.01 ± 0.01 99.26 ± 1.17 0.499 ± 0.05
F7 10.0 ± 0.01 5.29 ± 0.02 97.12 ± 1.54 0.01 ± 0.02 99.62 ± 1.54 0.963 ± 0.02
F8 10.0 ± 0.05 5.28 ± 0.01 103.93 ± 2.11 0.00 ± 0.01 98.58 ± 2.23 0.989 ± 0.03
F9 10.0 ± 0.01 5.21 ± 0.02 132.01 ± 3.27 0.00 ± 0.01 98.79 ± 1.93 1.141 ± 0.05

562 MICHAEL A. ODENIYI et al.
using USP basket method at a stirring speed of 100rpm. Samples were withdrawn and immediatelyreplaced with an equal volume of fresh dissolutionmedium at predetermined intervals. The sampleswere filtered using a 0.45 µm membrane filter andthe amount of drug released was determined usingUV spectrophotometer (Hitachi U2000, Tokyo,Japan) at 276 nm.
Mechanism of drug release
Drug release from tablet formulations may fol-low either zero order kinetics which describes thesystems where the drug release rate is independentof its concentration (23), first order kinetics wherethe release rate is concentration dependent (24), orHiguchiís model in which the release of drugs frominsoluble matrix as a square root of time-dependentprocess based on Fickian diffusion (25). TheHixson-Crowell cube root law describes the releasefrom systems where there is a change in surface areaand diameter of particles or tablets (26). However,in order to determine the mechanism of drug releasefrom the formulation, release data may be fitted inKorsmeyer et al. (27) equation (Equation 1):
Log (Mt/Mf) = Log k + nLog t (1)This equation describes drug release behavior
from polymeric systems. Mt is the amount of drugrelease at time t, Mf is the amount of drug releaseafter infinite time; k is a release rate constant incor-porating structural and geometric characteristics ofthe dosage form and n is the diffusional exponentindicative of the mechanism of drug release (27, 28).For a cylinder shaped matrix the value of n = 0.45indicates Fickian (case I) release; > 0.45 but < 0.89for non-Fickian (anomalous) release; and > 0.89
indicates super case II type of release. Case II mech-anism refers to the erosion of the polymer andanomalous transport (non-Fickian) refers to a com-bination of both diffusion and erosion controlleddrug release (29).
The mean dissolution time (MDT), was pro-posed by Mˆckel and Lippold (30), as providing amore accurate drug release rate that the tx%. Theequation is used to characterize drug release ratefrom the dosage form and the retarding efficiency ofthe polymer. Values of MDT can be calculated fromdissolution data using the equation:
MDT = (n/n + 1)k -1/n (2)where n is the release exponent and k is release rateconstant. A higher value of MDT indicates a higherdrug retaining ability of the polymer (31).
Statistical analysis
Statistical analysis was carried out usingStudentsí t-test and ANOVA, p value lower or equalto 0.05 was considered the limit of significance.
RESULTS AND DISCUSSION
No significant shifts or reduction in the inten-sity of FTIR bands of diclofenac sodium wasobserved in the physical mixture with the gum.Characteristic peaks present in the FT-IR spectrumof Cedrela gum and HPMC K100M appeared in thespectra of the physical mixture with diclofenac sodi-um indicating the absence of any chemical interac-tion between the drug and the excipients (Fig. 1).
The micromeritic properties of the formula-tions are given in Table 2. There was no substantialdifference in the bulk and tapped densities of all the
Figure 1. FTIR spectra of Cedrela gum, diclofenac sodium and physical mixture of gum and drug

Release and mucoadhesion properties of diclofenac matrix tablets... 563
Figure 2. Cumulative release of diclofenac sodium from batches F1 to F9. Each point represents the mean ± SD (n = 3)
formulations. Table 2 shows that compressibilityindex was highest for batch F4 (containing Cedrelagum/HPMC at ratio 1 : 2) and lowest for F5 (con-taining Cedrela gum/HPMC at ratio 3 : 2). The flowproperty was determined by Hausner ratio (1.22-1.50) and Carrís index (18.18-33.33%). Carrís com-pressibility index is an indication of the compress-ibility and flowability of a powder, and is also adirect measure of the propensity of a powder to con-solidate when undergoing vibration, shipping andhandling (6). Also, Hausnerís ratio, presented inTable 2, is an indication of the flowability of pow-ders. Formulation F5 had the lowest value (1.2) andhence the highest flowability, while F4 (1.5) hadpoor flow properties.
The tablets produced from the powder blendshad uniform thickness, low friability and a highdegree of content uniformity (Table 3). This indi-cates that the direct compression method is suitablefor preparing matrix tablets of DS. The assayed con-
tent of DS in the various formulations variedbetween 98.03 and 99.62% (mean 98.83%) whilethe friability of the batches complied with BritishPharmacopoeia (Table 3).
The crushing strength values, a measure of thehardness of tablets, are presented in Table 3. Thehardness of the tablets increased proportionally withthe amount of polymers in the formulation due totheir binding properties. Formulations containinghigher amounts of the natural gum contributed agreater effect to the crushing strength of the matrixtablets than HPMC (p < 0.001). This agrees with theprevious study by Odeniyi et al. (17) using Cedrelagum as a binder in ibuprofen tablet formulations bywet granulation process. The results show that thebond forming property of the gum is not dependenton process of tablet formulation but increases withavailability of binding surfaces provided withincreasing polymer concentration. An additiveeffect could further be observed, as formulation F9
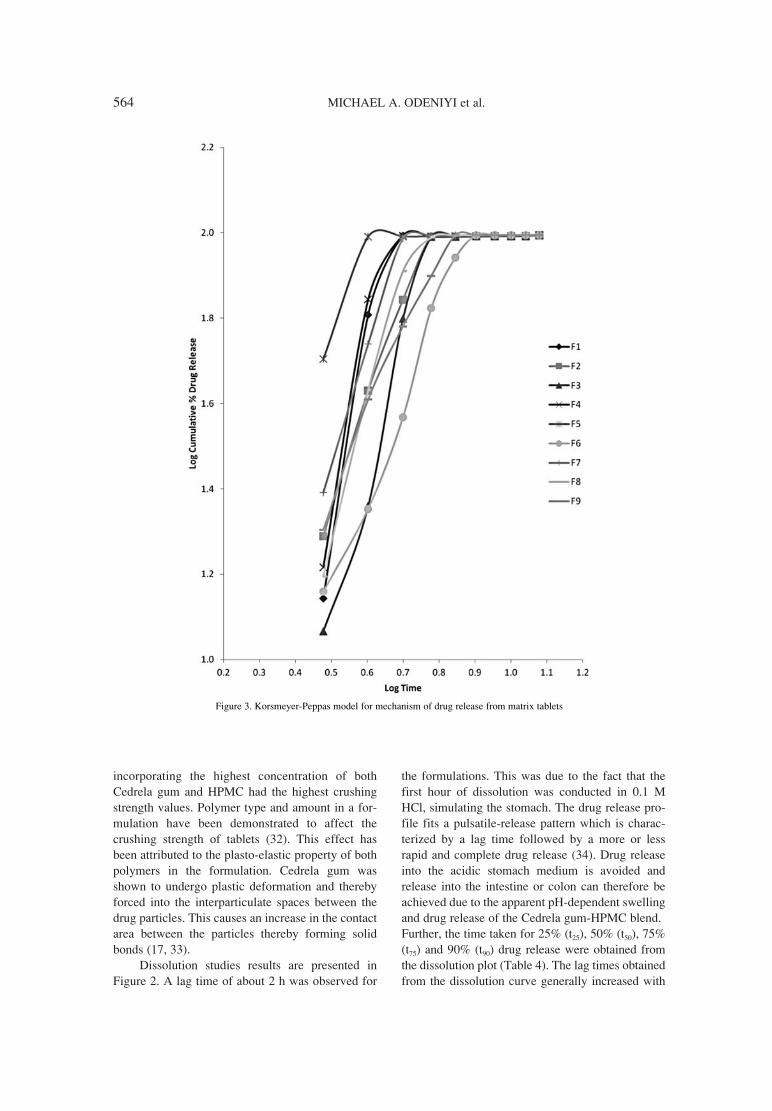
564 MICHAEL A. ODENIYI et al.
incorporating the highest concentration of bothCedrela gum and HPMC had the highest crushingstrength values. Polymer type and amount in a for-mulation have been demonstrated to affect thecrushing strength of tablets (32). This effect hasbeen attributed to the plasto-elastic property of bothpolymers in the formulation. Cedrela gum wasshown to undergo plastic deformation and therebyforced into the interparticulate spaces between thedrug particles. This causes an increase in the contactarea between the particles thereby forming solidbonds (17, 33).
Dissolution studies results are presented inFigure 2. A lag time of about 2 h was observed for
the formulations. This was due to the fact that thefirst hour of dissolution was conducted in 0.1 MHCl, simulating the stomach. The drug release pro-file fits a pulsatile-release pattern which is charac-terized by a lag time followed by a more or lessrapid and complete drug release (34). Drug releaseinto the acidic stomach medium is avoided andrelease into the intestine or colon can therefore beachieved due to the apparent pH-dependent swellingand drug release of the Cedrela gum-HPMC blend. Further, the time taken for 25% (t25), 50% (t50), 75%(t75) and 90% (t90) drug release were obtained fromthe dissolution plot (Table 4). The lag times obtainedfrom the dissolution curve generally increased with
Figure 3. Korsmeyer-Peppas model for mechanism of drug release from matrix tablets

Release and mucoadhesion properties of diclofenac matrix tablets... 565
polymer concentration. Higher values were observedto correlate with increase proportion of the polymersin the formulations. At higher polymer loading, theviscosity of the polymer gel increases and this resultsin ineffective diffusion of the drug (35). Cedrela gumat highest concentration (formulation F6) modulatedthe release profile giving a sigmoidal curve whencompared with other formulations. With furtherincrease in HPMC concentration, a thicker gel isformed, which inhibits water penetration and result-ing in significant increase in tx values.
MDT values are also given in Table 4. Theyranged between 3.03 ñ 5.18 h and increased withpolymer loading. A positive correlation wasobserved (0.873) between MDT and t90.
The dissolution data were best fitted to theKorsmeyer-Peppas equation (Fig. 3) with correla-tion coefficient of 0.96 ñ 0.99. The n values for allthe formulations ranged from 0.01 to 0.87 (Table 5).This shows that the release mechanism for all the
formulations, except F6 and F9, was Fickian (case I)release. Solute diffusion, polymeric matrix swellingand material degradation have been suggested to bethe main driving forces for solute transport fromdrug containing polymeric matrices. Fickian diffu-sion, based on Fickís law of diffusion, refers to thesolute transport process in which the polymer relax-ation time is much greater than the characteristicsolvent diffusion time. This mechanism is associat-ed with solute concentration gradient, the diffusiondistance, and degree of swelling (36). It has beenshown that the presence of monovalent ions like Na+
or K+ tend to reduce swelling and increase rate ofdrug release from matrix tablets (36). However, forformulations incorporating the high amounts ofCedrela gum and high and intermediate amounts ofHPMC K100M (F6 and F9) (Table 5), the n valueswere > 0.45 but < 0.89 indicating anomalous trans-port (non-Fickian) which is a combination of bothdiffusion and erosion controlled drug release (29).
Table 4. Dissolution parameters of matrix tablets.
Formulation t25% t50% t75% t90% MDT Lag timecode (h) (h) (h) (h) (h) (h)
F1 3.358 3.818 4.116 4.257 3.739 2.000
F2 3.023 3.487 5.297 7.585 4.186 2.313
F3 4.000 4.045 4.797 6.893 4.537 2.878
F4 4.000 4.000 4.000 4.010 3.653 2.000
F5 3.000 3.000 3.000 3.134 3.031 1.346
F6 3.425 4.874 7.169 8.936 5.183 2.917
F7 3.000 3.080 4.051 6.343 3.710 2.000
F8 4.000 4.000 4.108 5.446 4.091 2.345
F9 2.014 4.473 7.137 8.806 4.411 2.529
Table 5. In vitro release kinetics of matrix tablets.
Formulation Zero-order First-order Higuchi Hixson-Crowell Korsmeyer-Peppascode r2 k0 r2 k1 r2 KH r2 KHC N r2 K
F1 0.825 10.736 0.866 0.270 0.908 37.716 0.894 0.076 0.012 0.994 97.047
F2 0.883 10.408 0.885 0.239 0.946 37.447 0.916 0.067 0.265 0.970 60.078
F3 0.875 10.199 0.848 0.220 0.933 38.879 0.882 0.063 0.141 0.980 77.441
F4 0.820 10.784 0.869 0.277 0.907 37.924 0.897 0.078 0.017 0.991 97.439
F5 0.762 11.110 0.887 0.333 0.876 36.946 0.910 0.094 0.021 0.999 93.847
F6 0.923 9.634 0.860 0.188 0.960 36.675 0.896 0.054 0.527 0.958 34.867
F7 0.840 10.756 0.881 0.271 0.923 37.770 0.910 0.076 0.158 0.976 74.401
F8 0.868 10.512 0.874 0.245 0.935 37.990 0.906 0.069 0.070 0.989 87.699
F9 0.918 10.207 0.903 0.224 0.965 37.356 0.934 0.063 0.867 0.994 13.663

566 MICHAEL A. ODENIYI et al.
The values of peak detachment force, which isa measure of mucoadhesive strength, of the tabletformulations are presented in Table 3. The valuesrange from 0.302 to 1.141 N. Mucoadhesivestrength was observed to increase with amount ofpolymer in the tablet formulations (p < 0.05). Thehighest value was observed in the formulation F9incorporating the highest levels of the two polymers.Increasing the amount of polymers provided moreadhesive sites and polymer chains for interpenetra-tion with mucin. This will consequently increase theadhesion strength of the formulations (37). The highadhesion value obtained with the polymers in thiscase could be due to increase in hydrogen bondingeffects (38).
CONCLUSION
Mucoadhesive and delayed release matrixtablets of diclofenac sodium were obtained by using ablend of Cedrela gum and hydroxypropyl methylcel-lulose (MethocelÆ K100M). The inclusion ofhydroxypropyl methylcellulose, in the matrix tabletsof diclofenac sodium led to increase in the mechani-cal, release retarding and mucoadhesive properties ofCedrela gum in the matrix tablets. Drug release waspulsatile-like and was dependent on the amount andtype of matrixing agent The kinetics of drug releasewas explained by Korsmeyer-Peppas model. A blendof polymers by varying the proportions of Cedrelagum and hydroxypropyl methylcellulose could beused to formulate targeted and delayed release tablets.
Acknowledgments
The authors are grateful to TWAS, The WorldAcademy of Sciences and Universiti Sains Malaysiafor the TWAS-USM Postdoctoral Fellowship grant-ed to M.A. Odeniyi.
Declaration of interest
The authors report no conflicts of interest. Theauthors alone are responsible for the content andwriting of this paper.
REFERENCES
1. Edsman K., Hagerstrom H.: J. Pharm.Pharmacol. 57, 3 (2005).
2. Grabovac V., Guggi D., Bernkop-Schnurch. A.:Adv. Drug Deliv. Rev. 57, 1713 (2005).
3. Harding S. E.: Biochem. Soc. Trans. 31, 1036(2003).
4. Smart J. D.: Adv. Drug Deliv. Rev. 57, 1556(2005).
5. Emeje M., Olaleye O., Isimi C., Fortunak J.,Byrn S., Kunle O., Ofoefule S.: Biol. Pharm.Bull. 33, 1561 (2010).
6. Kalu V.D., Odeniyi M.A., Jaiyeoba K.T.: Arch.Pharm. Res. 30, 884 (2007).
7. Adriaens E., Ameye D., Dhondt M.M.M.,Foreman P., Remon J.P.: J. Control. Release 88,393 (2003).
8. Ameye D., Musa D., Foreman P., Remona J.P.:Int. J. Pharm. 301, 170 (2005).
9. Bomma R., Swamy Naidu R.A., Yamsani M.R.,Veerabrahma K.: Acta Pharm. 59, 211 (2009).
10. Peltola J., Coetzee C., Jimenez F., LitovchenkoT., Ramaratnam S., Zaslavaskiy L., Lu Z. et al.:Adv. Drug Deliv. Rev. 48, 139 (2001).
11. Longer M.A., Ching H.S., Robinson J.R.: J.Pharm. Sci. 74, 406 (1985).
12. Arora G., Malik K., Rana, V., Singh, I.: ActaPol. Pharm. Drug Res. 69, 725 (2012).
13. Gonzalez de Troconis N., Martinez M., Leon dePinto G.. Bhasas A.: Ciencia 9, 235 (2001).
14. Rincon F., Munoz J., de Pinto G.L., AlfaroM.C., Calero N.: Food Hydrocolloids 23, 1031(2009).
15. Ayorinde J.O., Odeniyi M.A.: Int. J. Pharm.Pharm. Technol. 1, 47 (2012).
16. Odeniyi M.A., Babalola, A.O., Ayorinde J.O.:Braz. J. Pharm. Sci. 49, 95 (2013).
17. Odeniyi M.A., Takeuchi H.: Ars Pharmaceutica55, 30 (2014).
18. Darig T., Fassihi R.J.: Pharm. Sci. 86, 1092(1997).
19. Gohel M.C., Parikh R.K., Nagori S.A., JenaD.G.: AAPS PharmSciTech. 10, 62 (2009).
20. Pharmaceutics, the science of dosage formdesign. Aulton M.E. Ed., Churchill Livingstone,Oxford 2005.
21. Peh K.K., Wong C.F.: J. Pharm. Pharm. Sci. 2,53 (1999).
22. Thirawong N., Nunthanid J., Puttipipatkh-achorn S., Sriamornsak P.: Eur. J. Pharm.Biopharm. 67, 132, (2007).
23. Quantitative calculations in pharmaceuticalpractice and research. Hadjiioannou T.P.,Christian G.D., Koupparis M.A. Eds., VCHPublishers Inc., New York 1993.
24. Bourne D.W. Pharmacokinetics, in Modernpharmaceutics. 4th edn., Banker G.S., RhodesC.T., Eds., Marcel Dekker Inc., New York 2002.
25. Higuchi T.: J. Pharm. Sci. 52, 1145 (1963).26. Hixson A.W., Crowell J.H.: Ind. Eng. Chem.
Res. 23, 923 (1931).

Release and mucoadhesion properties of diclofenac matrix tablets... 567
27. Korsmeyer R.W., Gurny R., Doelker E., BuriP., Peppas N.A.: J. Pharm. Sci. 15, 25 (1983).
28. Roni M.A., Kibria G., Jalil R.: Indian J. Pharm.Sci. 71, 252 (2009).
29. Sharma H.K., Lahkar S., Nath L.K.: ActaPharm. 63, 209 (2013).
30. Mˆckel J., Lippold B.C.: Pharm. Res. 10, 1066(1993).
31. Linder D., Lippold B.C.: Pharm. Res. 12, 1781(1995).
32. Ayorinde J.O., Itiola, O.A.: Arch. Pharm. Res.33, 395 (2010).
33. Odeniyi M.A., Jaiyeoba K.T.: Farmacia 57, 157(2009).
34. Bussemer T., Otto I., Bodmeier R.: Crit. Rev.Ther. Drug Carrier Syst. 18, 433 (2001).
35. Gao P., Skoug J.W., Nixon P.R., Ju T.R.,Stemm N.L., Sung K.C.: J. Pharm. Sci. 85, 732(1996).
36. Fu Y., Kao W.J.: Expert Opin. Drug Deliv. 7,429 (2010).
37. Kalu V.D., Odeniyi M.A., Jaiyeoba, K.T.: Eastand Central African J. Pharm. Sci. 9, 46 (2006).
38. Singh B., Chakkal S.K., Ahuja N.: AAPSPharmSciTech. 7, E3 (2006).
Received: 16. 05. 2014


Acta Poloniae Pharmaceutica ñ Drug Research, Vol. 72 No. 3 pp. 569ñ578, 2015 ISSN 0001-6837Polish Pharmaceutical Society
Multicompartment dosage forms, such asmicroparticles, provide high surface area of drugrelease and short diffusion way, which in the conse-quence enables improvement of therapeutic efficacyand reduction of drug toxicity (1). One of theadvanced methods used in microparticles productionis spray drying. Spray drying is a one-step process,which depends on spraying a solution, emulsion orsuspension in a stream of drying gas - compressed airor nitrogen. Increased contact area between the phas-es leads to an intensive exchange of heat and almostimmediate removal of the solvent to form dry parti-cles. Parameters of the process, e.g., atomizationdevices, drying chambers, aspirator and feed rate,drying temperature, spray air flow and properties ofthe material affect the characteristics of the driedproduct. Properly selected parameters allow to obtaindry particles with desired properties (2).
One of the polymers used for preparation ofmicroparticles is sodium alginate (ALG), whichcommonly occurs in seaweed. It is a heteropolysac-charide composed of monomers of β-D-mannuronicacid and α-L-guluronic acid. ALG possesses a num-ber of advantages: non-toxicity, biocompatibilityand biodegradability. In addition, mucoadhesive
properties of this polymer can increase the residencetime of the dosage form and in the consequenceimprove the drug bioavailability (3ñ5).
Metronidazole (MT) is synthetic, chemothera-peutic drug, which is a derivative of nitroimidazole.Its activity includes strictly anaerobic bacteria andprotozoa. Mechanism of MT action involves thepenetration of bacterial cells in the process of pas-sive diffusion and generation of active product in thereduction of the nitro group, which causes damageof cellular DNA (6, 7). MT is one of the most effec-tive drugs in the eradication of Helicobacter pylori,which resides mainly in the gastric mucosa and is anetiologic factor in the development of the gastritis,gastric ulcer and gastric carcinoma (8). MT is alsowidely used to treat trichomoniasis ñ the most com-mon nonviral sexually transmitted disease, whichaffects about 170 million people a year and is causedby the protozoan Trichomonas vaginalis (9).Registered preparations with MT include tablets fororal or vaginal administration, gels, creams andintravenous dosage forms. However, multicompart-ment sustained release forms with MT, which couldprovide greater uniformity and reproducibility of thedelivered dose, are not available (10), therefore the
EVALUATION OF ALGINATE MICROSPHERES WITH METRONIDAZOLEOBTAINED BY THE SPRAY DRYING TECHNIQUE
MARTA SZEKALSKA, KATARZYNA WINNICKA*, ANNA CZAJKOWSKA-KOåNIK, KATARZYNA SOSNOWSKA and ALEKSANDRA AMELIAN
Department of Pharmaceutical Technology, Faculty of Pharmacy, Medical University of Bia≥ystok,KiliÒskiego 1, 15-089 Bia≥ystok, Poland
Abstract: In the present study, nine formulations (F1-F9) of alginate microspheres with metronidazole wereprepared by the spray drying technique with using different drug : polymer ratio (1 : 2, 1 : 1, 2 : 1) and differ-ent sodium alginate concentration (1, 2, 3%). The obtained microspheres were characterized for size, morphol-ogy, drug loading, ζ potential and swelling degree. Mucoadhesive properties were examined using texture ana-lyzer and three different models of adhesive layers ñ gelatin discs, mucin gel and porcine vaginal mucosa. Invitro drug release, mathematical release profile and physical state of microspheres were also evaluated. Theobtained results indicate that sodium alginate is a suitable polymer for developing mucoadhesive dosage formsof metronidazole. The optimal formulation F3 (drug : polymer ratio 1 : 2 and 1% alginate solution) was char-acterized by the highest metronidazole loading and sustained drug release. The results of this study indicatepromising potential of ALG microspheres as alternative dosage forms for metronidazole delivery.
Keywords: metronidazole, sodium alginate, microspheres, spray drying technique, mucoadhesive properties
569
* Corresponding author: e-mail: [email protected]; phone: 48 85 7485615

570 MARTA SZEKALSKA et al.
objective of this study was to prepare MT loadedALG mucoadhesive microspheres by the spray dry-ing technique. The effect of the drug : polymer ratioand concentration of ALG solution on the propertiesof prepared microspheres was evaluated. Theobtained microspheres (formulations F1-F9) werecharacterized for size, morphology, drug loading,entrapment efficiency, swelling properties and ζpotential. Mucoadhesive properties of the micros-pheres were examined by using texture analyzer andthree different models of adhesive layer: gelatindiscs, mucin gel and porcine vaginal mucosa. Thephysical state of microspheres was determined bydifferential scanning calorimetry. The in vitro drugrelease and mathematical modeling of MT releasewere also evaluated.
EXPERIMENTAL
Materials
Metronidazole (MT) was purchased fromAmara (KrakÛw, Poland). Sodium alginate (ALG)low viscosity (a viscosity of 2% solution: 100-300cP) was purchased from Sigma Aldrich (Steinheim,Germany). Potassium dihydrogen phosphate, sodi-um hydroxide, hydrochloric acid, sodium chloride,potassium hydroxide, calcium hydroxide, lacticacid, acetic acid, glycerol, urea and glucose wereobtained from Chempur (Piekary ålπskie, Poland).Water was distilled and passed through a reverseosmosis system Milli-Q Reagent Water System(Billerica, MA, USA). Mucin type II from porcinestomach and gelatin type B from bovine skin was
purchased from Sigma Aldrich (Steinheim,Germany). Porcine vaginal mucosa from large whitepigs weighting ≈ 200 kg was obtained from the vet-erinary service (TuroúÒ Koúcielna, Poland). Sampleswere stored at -20OC and before the experiment weredefrosted and cut into 5 mm in diameter and 2 mmthick pieces.
Preparation of microspheres
Microspheres were produced using B¸chi MiniSpray Dryer B-290 (B¸chi, Flawil, Switzerland). Inorder to choose the optimal parameters of spray dry-ing to obtain product of the desired properties, anumber of tests were conducted and the experimen-tal parameters of the process were set as follows:inlet temperature 150OC, aspirator flow 37 m3/h,feed flow 5 mL/min, spray flow 600 L/h.Microspheres (F1ñF9) were prepared by using dif-ferent drug : polymer ratio (1 : 1, 1 : 2, 2 : 1) and dif-ferent concentrations of sodium alginate (1, 2, 3%)(Table 1).
Evaluation of microspheres
Morphology and particle size distributionMeasurements of the particle size and mean
diameter of microspheres were performed using anoptical microscope equipped with a camera (MoticBA400, Wetzlar, Germany) and ZetasizerNanoZS90 (Malvern Instruments, Malvern, UnitedKingdom). Morphology of the microspheres formu-lation F3 (with the highest MT loading) was addi-tionally examined by scanning electron microscope(SEM) (Hitachi S4200, Tokyo, Japan).
Table 1. Characteristics of MT loaded ALG microspheres (formulation F1ñF9).
Drug: ζ potential Production Encapsulation Percent Meanpolymer (mV) yield efficiency loading diameterFormulation
ratio (%) (%) (%) (µm)
1% ALG solution
F1 1:2 - 61.33 ± 9.71 51.15 ± 1.81 92.80 ± 2.32 35.88 ± 1.16 0.74 ± 0.04
F2 1:1 - 66.80 ± 9.53 46.92 ± 1.25 94.52 ± 2.13 51.19 ± 1.38 1.51 ± 0.13
F3 2:1 - 71.93 ± 7.92 42.49 ± 1.42 91.07 ± 1.91 62.17 ± 1.89 1.91 ± 0.15
2% ALG solution
F4 1:2 - 65.60 ± 9.74 44.69 ± 1.22 76.28 ± 2.96 34.81 ± 1.34 2.27 ± 0.13
F5 1:1 - 66.80 ± 8.32 40.25 ± 1.76 86.36 ± 2.65 39.52 ± 2.48 2.24 ± 0.14
F6 2:1 - 72.77 ± 9.21 31.04 ± 1.88 88.31 ± 3.19 51.43 ± 1.71 1.29 ± 0.19
3% ALG solution
F7 1:2 - 67.77 ± 8.91 35.59 ± 1.17 85.69 ± 3.29 34.94 ± 1.51 2.95 ± 0.15
F8 1:1 - 66.87 ± 8.46 38.18 ± 1.36 89.40 ± 2.74 44.86 ± 2.26 3.96 ± 0.16
F9 2:1 -70.57 ± 8.02 30.68 ± 1.62 79.31 ± 2.15 47.70 ± 2.44 1.84 ± 0.13

Evaluation of alginate microspheres with metronidazole... 571
HPLC analysis of MTThe concentration of MT was determined by
the HPLC system Agilent Technologies 1200equipped with a G1312A binary pump, a G1316Athermostat, a G1379B degasser and a G1315Bdiode array detector (Agilent, Waldbronn,Germany). Data collection and analysis were per-formed using Chemstation 6.0 software. Isocraticseparation was achieved on a Zorbax EclipseXDBñC18, 4.6 ◊ 150 mm, 5 µm column (Agilent,Waldbronn, Germany). Mobile phase was acetoni-trile : 0.01 M phosphate buffer pH 4.7 (15 : 85, v/v),the flow rate was 1.0 mL/min and UV detection wasperformed at a wavelength of 319 nm (11). Thecolumn temperature was maintained at 25OC. Forinjection into the HPLC system, 20 µL of samplewas used. All reagents used for analysis wereHPLC grade. The retention time of MT was 3.0 minand retention factor (k) was 2. Retention factor (k)was determined by using the formula: k = tR ñ t0 / t0,
where tR ñ retention time of the analyte on the col-umn, t0 ñ retention time of a non-retained com-pound (12). Standard calibration curve was linearover the range of 1ñ100 µg/mL with the correlationcoefficient (R2) 0.999.
Determination of MT loading, encapsulation effi-ciency and production yield
MT loading in the microspheres was deter-mined by dissolving an accurately weighted amountof microspheres (20 mg) in 10 mL of distilled waterand agitating for 24 h at 150 rpm in a water bath(13). After filtration through 0.45 µm celluloseacetate (CA) Millipore filters (Billerica, MA, USA),concentration of MT was determined by HPLCmethod. Each sample was analyzed in triplicate. Themean drug encapsulation efficiency was calculatedby formula:
EE = Qa / Qt ◊ 100where EE ñ percentage of encapsulation efficiency,Qa ñ actual drug content, Qt ñ theoretical drug con-tent.
The percentage yield of MT in the ALGmicrospheres was determined by using the formula:
Y = Wm / Wt ◊ 100where Y ñ percentage production yield, Wm ñ weightof microspheres and Wt ñ theoretical weight of drugand polymer (13).
ζζ potentialζ potential measurements were performed
using a Zetasizer NanoZS90 (Malvern Instruments,Malvern, United Kingdom).
Swelling propertiesSwelling properties of microspheres were
examined in modified simultaneous vaginal fluid(SVF) pH 4.2 or in 0.1 M HCl pH 1.2. SVF was pre-pared by dissolving sodium hydroxide, hydrochloricacid, sodium chloride, potassium hydroxide, calci-um hydroxide, lactic acid, acetic acid, glycerol, glu-cose and urea in water and adjusted to pH 4.2 byusing 0.1 M HCl (14). Microspheres (20 mg) wereplaced in beakers containing 25 mL of medium andstirred at 100 rpm at 37 ± 1OC. The microsphereswere periodically weighted at predetermined timeinterval until a constant weight was obtained. Theswelling ratio (SR) was calculated by using the fol-lowing formula:
SR = (Ws ñ Wo)/Wowhere Wo ñ initial weight of microspheres and Ws ñweight of microspheres after swelling (15).
Mucoadhesive propertiesEvaluation of mucoadhesiveness was per-
formed using TA.XT.Plus Texture Analyser (StableMicro Systems, Godalming, United Kingdom) andthree different models of adhesive layers: gelatindiscs, mucin gel and porcine vaginal mucosa.Experimental parameters of the process were chosenduring preliminary tests and set as follows: pretestspeed 0.5 mm/s, test speed 0.1 m/s, contact time 180s, post test 0.1 mm/s, applied force 1 N. Gelatindiscs were prepared by pouring 30% w/w aqueoussolution into a Petri dish. Layer of mucin was pre-pared by absorbing of 10% mucin gel on a discswith cellulose fiber (5 mm in diameter). Tests wereconducted at 37 ± 1OC. Each adhesive layer wasadhered to an upper probe and moisturized withSVF. Mucoadhesive properties were determined asmaximum detachment force (Fmax) and work ofmucoadhesion (Wad) ñ calculated from the areaunder the force versus distance curve and expressedin µJ.
In vitro MT release MT release profiles were obtained according to
the modified USP method using dissolution basketapparatus (Erweka Paddle Dissolution tester typeDT 600HH, Heusenstamm, Germany). The receptorcompartment was filled with 500 mL of modifiedsimulated vaginal fluid (SVF) (pH 4.2) or 0.1 MHCl (pH 1.2) to provide sink conditions. All formu-lations of microspheres (containing 250 mg of MTfor study in 0.1 M HCl or 500 mg of MT for studyin SVF) were suspended in dissolution medium andstirred at 50 rpm at 37 ± 1OC for 8 h. Samples were

572 MARTA SZEKALSKA et al.
withdrawn and filtered through 0.45 µm CAMillipore filters (Billerica, MA, USA) at predeter-mined time intervals and replaced with fresh disso-lution medium (16). The amount of released MTwas analyzed by HPLC method (as described earli-er). The studies were carried out in triplicate.
Mathematical modeling of MT release profileMT release data were analyzed according to
zero order kinetic, first order kinetic, Higuchi modeland KorsmeyerñPeppas equation to characterizemechanism of the drug release. Constants of releasekinetics and regression coefficients (R2) were calcu-lated from the slope of plots by linear regressionanalysis.
Zero order kinetic describes formula:Qt = Qo + Kot
where Qt is the amount of drug dissolved in time t,Qo ñ the initial amount of drug in the solution, andKo ñ the zero order release constant.
First order kinetic formula:log Qt = log Qo + kt/2.303
where Qt is the amount of drug released in time t, Qo
ñ the initial amount of the drug in the solution and kñ the first order release constant.
Higuchi model describes equation:Q = kHt1/2
where Q is cumulative amounts of the drug releasedat time t and kH ñ the Higuchi dissolution constant.
Korsmeyer-Peppas model is expressed by thefollowing equation:
Mt / M8 = ktn
where Mt and M8 are amounts of the drug released attime t and infinite time, k is the constant incorporat-ing structural and geometrical characteristics and n ñdiffusion release exponent used to interpretation ofdiffusion release mechanism (17, 18).
Differential scanning calorimetric studiesDifferential scanning calorimetric (DSC) analy-
sis of MT, ALG and formulation F3 of microspheres(with the highest drug loading) was performed usingan automatic thermal analyzer system (DSCTEQ2000, TA Instruments, New Castle, DE, USA).Each sample was precisely weighted (5 mg) andplaced in sealed aluminium pans. An empty pan wasused as a reference. Temperature calibrations wereperformed using indium and zinc as standard. Sampleswere heated from 25 to 230OC at scanning rate of10OC/min under nitrogen flow of 20 mL/min (19).
Statistical analysisQuantity variables were expressed as the mean
and standard deviation. Statistical analysis was per-
formed using nonparametric Kruskal-Wallis test andconducted by using STATISTICA 10.0 software.Differences between groups were considered to besignificant at p < 0.05.
RESULTS AND DISCUSSION
Frequently encountered problems with conven-tional dosage forms are differences in bioavailabili-ty, relatively short residence time in the gastroin-testinal tract and possibility of irritation caused bylocal drug release (20, 21). In contrast, multicom-partment dosage forms due to the high surface areaoffer numerous advantages, which include reductionof individual differences in bioavailability,improved efficacy and reduced toxicity (22). Drugabsorption in the stomach is a complex processwhich depends on physiological factors: pH, pres-ence of food, peristalsis and stomach emptying. Inacidic fluid, the sodium alginate is converted to theinsoluble, swelling alginic acid. Application of ALGto obtain mucoadhesive microspheres with MTcould prolong residence time in the stomach andimprove effectiveness in the eradication of H. pylori(23, 24). MT is also one of the most effective drugsfor common vaginal infections ñ bacterial vaginosisand trichomoniasis. However, the currently avail-able traditional vaginal delivery systems with MThave limitations. ALG, as anionic polymer withmucoadhesive properties, could prolong residencetime of the dosage form in the site of application andin the consequence improve therapeutic efficacy ofMT (25, 26).
Characteristics of ALG microspheres with MT
In the present study, MT loaded microsphereswere successfully prepared by the spray dryingmethod using sodium alginate as polymer matrix.Spray drying technique is relatively simple to carryout, however obtaining the product with desiredproperties is a complex process, which depends onseveral factors. The optimal spray drying processparameters included: inlet temperature 150OC, aspi-rator flow 37 m3/h, feed flow 5 mL/min, spray flow600 L/h. The characteristics of microspheresobtained using different drug : polymer ratio anddifferent concentration of ALG solution are shownin Table 1. The mean diameter of microspheresranged from 0.74 ± 0.04 µm (F1) to 3.96 ± 0.16 µm(F8). The minimum drug loading was observed informulations F1, F4, F7, when drug : polymer ratiowas 1 : 2. Maximum drug loading was in formula-tion F3 (drug : polymer ratio 2 : 1, 1% ALG solu-tion). The encapsulation efficiency ranges from

Evaluation of alginate microspheres with metronidazole... 573
76.28 ± 2.96% (F4) to 94.52 ± 2.13% (F2) (Table 1).The increase in the drug : polymer ratio resulted inan improvement of MT percent loading, but entrap-ment efficiency was slightly decreased, which couldbe caused by the insufficient amount of ALG tocover MT particles completely. The results obtainedfrom tests performed with an optical microscopeindicated that all formulations of microspheres hadspherical shape, smooth surface and did not aggre-gate (Fig. 1). The morphology of microspheres for-mulation F3 (with the highest MT loading) exam-ined by scanning electron microscopy (SEM) isshown in Figure 2.
ζζ potential
The stability of many systems is directly relat-ed to the magnitude of their ζ potential. In general,if the value of this parameter is more negative or
more positive, the system is more stable.Conversely, if the microspheres ζ potential is rela-tively closer to zero, the particles have a tendency toaggregate. All performed formulations of micros-pheres possessed negative ζ potential with valuefrom -61.33 ± 9.71 to -72.77 ± 9.21 mV (Table 1).The negative charge of the microparticle surface ismainly a result of the negative charge of ALG and -CH2-CH2-OH group of MT (27). ALG is anionicpolymer with carboxyl and sulfate functionalgroups, which give rise to an overall negative chargeat pH values exceeding the pKa of the polymer. Itwas also observed that value of ζ potentialdecreased with an increased amount of loaded MT.
Swelling and mucoadhesive properties
Swelling is the first step in the formation ofbonds between polymer and mucous membrane and
Table 2. Mucoadhesive properties of formulations F1-F9.
Type of adhesive layer
Formulation Gelatin Mucin Porcine vaginal mucosa
Fmax [N] Wad [µJ] Fmax [N] Wad [µJ] Fmax [N] Wad [µJ]
F1 0.12 ± 0.91 79.77 ± 0.17 0.22 ± 1.15 113.30 ± 0.41 0.19 ± 0.96 134.90 ± 0.36
F2 0.15 ± 1.10 89.23 ± 0.15 0.18 ± 0.98 112.50 ± 0.23 0.20 ± 1.15 136.43 ± 0.28
F3 0.23 ± 0.90 119.87 ± 0.45 0.27 ± 1.51 163.70 ± 0.52 0.15 ± 1.98 141.57 ± 0.25
F4 0.12 ± 0.91 86.00 ± 0.15 0.22 ± 1.85 104.60 ± 0.24 0.20 ± 1.91 175.30 ± 0.19
F5 0.18 ± 0.82 152.00 ± 0.26 0.31 ± 0.89 158.30 ± 0.82 0.23 ± 1.34 207.37 ± 0.65
F6 0.21 ± 0.58 153.80 ± 0.45 0.32 ± 1.67 183.83 ± 0.26 0.24 ± 0.67 262.27 ± 0.88
F7 0.11 ± 1.71 62.93 ± 0.14 0.11 ± 1.90 140.30 ± 0.24 0.14 ± 1.92 145.57 ± 0.19
F8 0.22 ± 1.23 100.60 ± 0.52 0.21 ± 1.56 138.30 ± 0.77 0.25 ± 1.35 160.23 ± 0.31
F9 0.24 ± 0.98 136.50 ± 0.49 0.19 ± 0.89 148.90 ± 1.10 0.28 ± 0.59 179.27 ± 0.28
Fmax ñ Maximum detachment force. Wad ñ Work of adhesion
Table 3. Models of MT release from formulations F3, F6 and F9 in SVF or 0.1 M HCl.
Zero order First orderHiguchi model
Korsmeyer-Peppas Formulation kinetics kinetics model
R2 K0 R2 KI R2 KH R2 KKP n
SVF (pH 4.2)
F3 0.354 7.188 0.973 0.323 0.748 10.00 0.976 0.424 0.191
F6 0.564 8.969 0.995 0.260 0.881 20.82 0.956 0.412 0.205
F9 0.477 8.408 0.959 0.293 0.791 17.37 0.909 0.404 0.184
0.1 M HCl (pH 1.2)
F3 0.805 12.75 0.918 0.372 0.936 40.07 0.956 0.675 0.525
F6 0.771 12.14 0.957 0.353 0.925 36.89 0.954 0.633 0.463
F9 0.792 11.85 0.982 0.281 0.927 37.01 0.955 0.662 0.511

574 MARTA SZEKALSKA et al.
in the creating a spatial network with adhesive prop-erties (28). As it is shown in Figure 3A, in micros-pheres examined in modified SVF, an initial rapid
rise of swelling ratio (SR) in the first 30 min in allformulations was observed. The maximum swellingwas observed in formulation F4. It was also notedthat MT : ALG ratio had significant effect on SR.Formulations with higher MT loading and lowerALG content (F3, F6 and F9) were characterized bylower swelling ability (Fig. 3A). Due to the fasterconversion of sodium alginate to the insolublealginic acid in more acidic pH, the rise of SR inmicrospheres evaluated in 0.1 M HCl was signifi-cantly weaker (Fig. 3B).
Mucoadhesive properties were investigatedusing TA.XT.Plus Texture Analyser and gelatindiscs, mucin gel and porcine vaginal mucosa as dif-ferent adhesive layers. Porcine vaginal mucosamodel is often used to reflect behavior of dosageforms in vivo because of its similarity to humanmucosa in terms of histology, ultrastructure andcomposition (29). It was found that all formulationswere characterized by mucoadhesive properties(Table 2). ALG swells and facilitates the adhesiveinteractions with mucosa and contributes to the for-mation of a cohesive layer. The numerous carboxylfunctional groups of ALG can form hydrogen bondswith mucin molecules, thus producing some adhe-sive force and electrostatic interactions betweenpolymer and adhesive layer (30, 31). Unexpectedly,higher work of adhesion was observed in formula-tions with lower amount of ALG (F3, F6 and F9).
In vitro MT release and mathematical models of
release profile
In vitro release of MT was examined from for-mulations F3, F6, F9 (with the highest MT loading)in SVF (pH 4.2) or in 0.1 M HCl (pH 1.2) (Fig. 4).In SVF, after 0.5 h of the study, significant burstrelease of MT was observed (75.76 ± 3.76%, 55.32± 4.17% and 61.26 ± 3.91% of MT was released
Figure 1. Microscopic images of microspheres: F1 (A), F2 (B), F3(C), F4 (D), F5 (E), F6 (F), F7 (G), F8 (H) and F9 (I) under mag-nification 100◊
Figure 2. SEM images of microspheres formulation F3 under magnification 10 000◊ (A), 20000◊ (B)

Evaluation of alginate microspheres with metronidazole... 575
from F3, F6 and F9, respectively) and drug was con-tinuously released up to 4 h (Fig. 4A). Contrary, in0.1 M HCl there was no burst effect, MT release wassignificantly slower (80% of MT was released after3 h) and sustained up to 6 h (Fig. 4B). Sustained MTrelease in 0.1 M HCl is caused by the higher (atacidic pH) conversion of sodium alginate to theinsoluble alginic acid.
Mechanism of MT release from obtainedmicrospheres was analyzed according to variousmathematical models: zero order kinetic, first orderkinetic, Higuchi model and KorsmeyerñPeppasequation to find out the coefficient of correlation
(R2) and n value (Table 3). In Korsmeyer-Peppasmodel, n is the release exponent and provides infor-mation about mechanism of the drug release fromdifferent geometry. When n takes a value of 0.43, itindicates diffusion mechanism, n = 0.85 - indicatesswelling-controlled release, n between 0.43 and 0.85ñ mechanism of drug release, which includes bothphenomena (anomalous transport) (18). In all for-mulations examined in SVF, the obtained n valueswere below 0.43 indicating diffusion as MT releasemechanism. Interestingly, in 0.1 M HCl solution,value of n was above 0.43 indicating anomaloustransport based on both diffusion and swelling con-
Figure 3. Swelling ratio (SR) of microspheres formulations F1-F9 in SVF (pH 4.2) (A) and in 0.1 M HCl (pH 1.2) (B)

576 MARTA SZEKALSKA et al.
trolled release. In all formulations, the highest valueof R2 was observed in first order kinetic model,which indicates that MT release was concentrationdependent (Table 3).
Differential scanning calorimetric studies
The physical state of MT inside ALG micros-pheres was assessed by thermal analysis. DSC ther-mograms of MT, ALG and microspheres of formu-
lation F3 (with the highest drug loading) are shownin Figure 5. Under the experimental conditions,endothermic peak of sodium alginate close to108.25OC was found indicating glass transition ofthe polymer, and MT exhibited a sharp endothermicpeak at 163.45OC, corresponding to the meltingpoint of pure MT. In thermogram of microspheresF3 sharp peak of MT was observed, suggesting thatdrug was stable within the polymer matrix (32).
Figure 4. MT release from formulations F3, F6 and F9 in SVF (pH 4.2) (A) and 0.1 M HCl (pH 1.2) (B

Evaluation of alginate microspheres with metronidazole... 577
CONCLUSIONS
The obtained data suggest that ALG micros-pheres with MT can be successfully prepared by thespray drying technique. MT release and mucoadhesiveproperties of the microspheres can be altered by vary-ing the drug : polymer ratio and concentration of poly-mer. The optimal formulation of microspheres ñ F3 ischaracterized by the highest MT loading and sustainedMT release (up to 4 h in SVF and up to 6 h in 0.1 MHCl). All microspheres possess swelling and mucoad-hesive properties. The results of this study indicatepromising potential of ALG microspheres as alterna-tive dosage forms for MT delivery. Preparation andevaluation of gelatin capsules containing ALG micros-pheres with MT and tableting these microspheres isunderway and will be described in a due course.
Acknowledgments
This study was conducted with the use ofequipment purchased by Medical University ofBia≥ystok as part of the OP DEP 2007-2013, PriorityAxis I.3, contract No. POPW.01.03.00-20-008/09and supported by Medical University of Bia≥ystokgrant (134-15546F).
REFERENCES
1. Park K., Yeo Y.: in Encyclopedia of pharma-ceutical technology. Swarbrick J. Ed., p. 2315,Informa Healthcare, New York 2007.
2. Cal K., Sollohub K.: J. Pharm. Sci. 99, 575(2010).
3. Nair L.S., Laurencin C.T.: Adv. Biochem. Eng.Biotechnol. 102, 47 (2006).
4. Sachan N.K., Pushkar S., Jha A.: J. Pharm. Res.2, 1191 (2009).
5. T�nnesen H.H., Karlsen J.: Drug Dev. Ind.Pharm. 28, 621 (2002).
6. Castelli M., Malagoli M., Ruberto A.I., BaggioA., Casolari C., Cermelli C., Bossa M.R. et al.:J. Antimicrob. Chemother. 40, 19 (1997).
7. PÈlissier M.A., Marteau P., Pochart P.: Dig.Dis. Sci. 52, 40 (2007).
8. Feldman M., Peterson W.L.: West J. Med. 159,555 (1993).
9. Cudmore S.L., Delgaty K.L., Hayward-McClelland S.F., Petrin D.P., Garber G.E. Clin.Microbiol. Rev. 17, 783 (2004).
10. DrugBank Database (Internet), University ofAlberta, Canada. Available from:http://www.drugbank.ca/drugs/DB00916(Accessed on 06 May 2014).
11. Suyagh M.F., Iheagwaram G., Kole P.L.,Millership J., Collier P., Halliday H., McElnayJ.C.: Anal. Bioanal. Chem. 397, 687 (2010).
12. Crea F., De Robertis A., De Stefano C.: Anal.Chim. Acta 436, 333 (2001).
13. Arica B., Alis S.C., Iilla P.A.T., Durlu N.T.,Akar N.C., Kas H.S., Hincal A.A.: J.Microencapsul. 2, 153 (2005).
14. Owen D.H., Katz D.F.: Contraception 59, 91(1999).
Figure 5. DSC thermograms of MT, ALG and microspheres of formulation F3

578 MARTA SZEKALSKA et al.
15. Y¸ksel N., DinÁ E., Onur F., Baykara T.:Pharm. Dev. Technol. 3, 115 (1998).
16. SzymaÒska E., Winnicka K.: Acta Pol. Pharm.Drug Res. 69, 509 (2012).
17. Costa P., Sousa Lobo J.M.: Eur. J. Pharm. Sci.13, 123 (2001).
18. Siepmann J., Peppas N.A.: Adv. Drug Deliv.Rev. 48, 139 (2001).
19. Mazurek-Wπdo≥kowska E., Winnicka K.,Czajkowska-Koúnik A., Czyøewska U., MiltykW.: Acta Pol. Pharm. Drug Res. 70, 787 (2013).
20. Whitehead L., Fell J., Collett J., Sharma H.L.,Smith A.M.: J. Control. Release 55, 3 (1998).
21. Lee J.H., Park T.G., Choi H-K.: J.Microencapsul. 16, 715 (1999).
22. Xin C., Li-Hong W., Jing Y., Yang Y., Yue Y.,Qi-Fang W., San-Ming L.: Pharm. Dev.Technol. 6, 1346 (2013).
23. Dixit N.: J. Curr. Pharm. Res. 7, 6 (2011).24. Kawashima Y., Niwa T., Takeuchi H., Hino T.,
Itoh Y.: J. Pharm. Sci. 81, 135 (1992).
25. Boddupalli B.M., Mohammed Z.N.K., NathR.A., Banji D.: J. Adv. Pharm. Tech. Res. 1,381 (2010).
26. Valenta C.: Adv. Drug Deliv. Rev. 57, 1692(2005).
27. Lam A., Rivera A.: Micropor. Mesopor. Mat.91, 181 (2006).
28. Shaikh R., Raj Singh T.R., Garland M.J.,Woolfson A.D., Donnelly R.F.: J. Pharm.Bioallied. Sci. 3, 89 (2011).
29. Squier C.A., Mantz M.J., Schlievert P.M.,Davis C.C.: J. Pharm. Sci. 97, 9 (2008).
30. Walewijk A., Cooper-White J.J., Dunstan D.E.:Food Hydrocolloids 22, 91 (2008).
31. Cu�a M., Alonso M.J., Torres D.: Eur. J.Pharm. Biopharm. 51, 199 (2001).
32. Soares J.P., Santos J.E., Chierice G.O.,Cavalheiro E.T.G.: Eclet. QuÌm. 2, 53 (2004).
Received: 17. 05. 2014

Acta Poloniae Pharmaceutica ñ Drug Research, Vol. 72 No. 3 pp. 579ñ585, 2015 ISSN 0001-6837Polish Pharmaceutical Society
Chronic pain represents one of the most impor-tant problems. This is a common unpleasant sensoryand emotional experience associated with actual orpotential tissue damage. For instance, it has beenestimated that 10-13% of the general population inEurope, are being disabled by persistent pain.Conventionally, analgesic treatment is accom-plished by three principal drug groups: nonsteroidalanti-inflammatory drugs (NSAIDs), opioids, andlocal anesthetics, administered through differentroutes and modalities (1). Pain relief can beachieved and adverse effects minimized by a combi-nation of analgesics (2). Analgesics are comple-mented with co-analgesic (adjuvant) drugs, special-ly in pain of inflammatory and neuropathic type (1,3, 4). In the case of neuropathic pain, treatment withopioids may be of limited efficacy and combinationwith co-analgesics is necessary (4ñ8).
Co-analgesic drugs are defined as drugs thathave a primary indications other than pain but areanalgesic in some painful conditions or are capableof decreasing the side effects of analgesic drugs (4).Co-analgesics can also be defined as drugs that have
weak or non-existent analgesic action when admin-istered alone, but can enhance analgesic actionswhen co-administered with known analgesic agents(4). Such combinations increase analgesia withoutincreasing the dose of analgesics, and therefore, canreduce the incidence of adverse effects (4). Thecombined treatment with the two types of drugs atdoses much lower than therapeutic doses may be ofgreat value in pain therapy (9).
Co-analgesic drugs include antidepressants,antipsychotics, anticonvulsants, antiarrhythmics,corticosteroids and others (4, 8, 10). Efficacy ofthese drugs depends on the type of pain, its patho-physiology, clinical status and adequacy of painintervention. There has been an increase in the num-ber of these drugs and they now play an importantrole in the management of chronic pain (10).
In chronic pain, antidepressants are an essentialpart of the therapeutic strategy in addition to classi-cal analgesics (3, 8, 10). These drugs belong to thegroups of tetracyclic antidepressants (TeCAs)(amoxapine, maprotiline), tricyclic antidepressants(TCAs) (amitriptyline, doxepin, imipramine), selec-
PHARMACOLOGY
THE EFFECT OF SEROTONIN 5-HT1A, 5-HT2 RECEPTOR LIGANDS, KETOPROFEN AND THEIR COMBINATION IN MODELS OF
INDUCED PAIN IN MICE
MA£GORZATA ZYGMUNT1*, GRAØYNA CH£O—-RZEPA2 and JACEK SAPA1
1Department of Pharmacological Screening, Chair of Pharmacodynamics, 2Department of MedicinalChemistry, Jagiellonian University, Medical College, 9 Medyczna St., PL 30-688 KrakÛw, Poland
Anstract: The present study was carried out to investigate the effects of the 7-(3-chlorophenyl)piperazinylalkylderivatives of 8-alkoxypurine-2,6-dione (compounds 1-4) in two animal models of induced pain and to com-pare their effects with ketoprofen and with their combination. All experiments were performed on albino mice.Mice were evaluated for their responsiveness to noxious stimuli using: the hot-plate test and the phenylbenzo-quinone- induced writhing test. All compounds showed analgesic activity only in the writhing test. The anal-gesic activities of compounds 3 and 4 were similar to ketoprofen. The compounds slightly increased the anal-gesic effect of ketoprofen when used in combination in the visceral type of pain. The possible mechanisms ofthe antinociceptive effect of these compounds are thought to involve the activation of analgesic effect mediat-ed by the serotonergic pathways or combination of this mechanism with other important mediators playing arole in pain modulation.
Keywords: analgesic activity, serotonergic receptors, writhing test, xanthine derivatives
579
* Corresponding author: e-mail:[email protected]

580 MA£GORZATA ZYGMUNT et al.
tive serotonin reuptake inhibitors (SSRIs), serotoninand noradrenaline reuptake inhibitors (SNRIs)(duloxetine, venlafaxine, milnacipran), and atypicalantidepressants (bupropion, trazodone, mirtazapine,nefazodone), (3, 8). Antidepressants effective inchronic pain act via different mechanisms as can beseen in Table 1, (3, 10). However, other mechanismshave also been suggested..
Antidepressants are commonly used to treat thefollowing chronic pain conditions: arthritis, centralpain syndrome, fibromyalgia, low back pain,migraines, nerve damage from diabetes (diabetic neu-ropathy) (8, 11). Their effectiveness is best document-ed for painful diabetic neuropathy. On the other hand,some clinical data suggest that headache can occurafter prolonged use of amitriptyline in patients withdepression but without pain symptoms (3). The expla-nation of this phenomenon requires further research.
The analgesic potency of antidepressant drugshas been suggested to result from the inhibition ofmonoamine reuptake in the central nervous system,which consequentially leads to an increased activityof the antinociceptive descending pathways (3). Theantidepressants have an analgesic effect that may be,at least partly, independent of their effect on depres-sion (3). The dose necessary to achieve optimalanalgesia is usually lower than that required for anti-
depressant therapy, which may suggest separation ofanalgesic and antidepressant effect (3).
The present study is, therefore, intended toinvestigate the analgesic potential of 7-(3-chlo-rophenyl)piperazinylalkyl derivatives of 8-alkoxy-purine-2,6-dione, used alone or in combination withketoprofen in two models of induced pain in mice,representing different types of pain stimuli. Our pre-vious study demonstrated a potent antidepressant-like activity of several derivatives of 8-alkoxy-purine-2,6-dione in the forced swimming test inmice and showed their strong affinity for the 5-HT2
and 5-HT1A receptors (12).
EXPERIMENTAL
Chemistry
The structures of the investigated compounds1ñ4 are presented in Table 2. Compounds 1ñ4 weresynthesized by nucleophilic substitution of previ-ously obtained 7-chloroalkyl-8-alkoxy-1,3-dimeth-yl-3,7-dihydropurine-2,6-diones with the appropri-ate phenylpiperazines in the presence of K2CO3. Thesynthesis and physicochemical data of compounds1ñ4 were described elsewhere (13). The investigat-ed compounds were pharmacologically tested ashydrochloride salts.
Table 1. The mechanism of action of antidepressants effective for chronic pain (3, 11).
Group Drugs Mechanisms
AmitriptylineTCA Doxepin 5-HT > NE reuptake
Imipramine inhibition
TeCA Amoxapine NE and 5-HT reuptakeinhibition
CitalopramFluoxetine 5-HT > NE reuptake
SSRI Paroxetine inhibition Sertraline
Fluvoxamine
DuloxetineSNRI Venlafaxine 5-HT NE > DA reuptake
Milnacipran inhibition
Bupropion DA NE reuptake inhibition5-HT2 receptor blockade
Trazodone 5-HT reuptake inhibitionAtypical a2-NE and 5-HT2 presynaptic
antidepressant Mirtazapine agonist; 5-HT2/3 receptorblockade
Nefazodone 5-HT2 receptor blockade5-HT reuptake inhibition
TCA - tricyclic antidepressants, TeCA - tetracyclic antidepressants, SSRI - selective serotonin reuptakeinhibitors, SNRI - serotonin and noradrenaline reuptake inhibitors; NE - noradrenaline, DA - dopamine, HT -hydroxytryptamine.

The effect of serotonin 5-HT1A, 5HT2 receptor ligands, ketoprofen and... 581
Animals
The experiments were carried out on male albi-no-Swiss mice (body weight 20-26 g). The animalswere housed in constant temperature facilitiesexposed to 12 : 12 h light-dark cycle and maintainedon a standard pellet diet, tap water was ad libitum.Control and experimental groups consisted of six toeight animals each. The investigated compoundswere administered intraperitoneally (i.p.) as a sus-pension in 0.9% NaCl.
Statistical analysis
The statistical significance was calculatedusing Studentís t-test. Differences were consideredstatistically significant at p ≤ 0.05.
Methods
The writhing syndrome testMice were treated with 0.25 mL of 0.02%
phenylbenzoquinone solution 30 min after i.p.
administration of the investigated compound or thevehicle. Then, the mice were placed individually inglass beakers and 5 min were allowed to elapse.After that period, each animal was observed for 10min and the number of characteristic writhes wascounted. The control group was given i.p. 0.9%NaCl. The analgesic effect of the tested substanceswas determined by a decrease in the number ofwrithes observed (14). The ED50 values and theirconfidence limits were estimated by the method ofLitchfield and Wilcoxon (15).
The hot plate testIn the hot plate test, mice were treated i.p.
either with the test compound or the vehicle 30 minbefore placing the animal on a hot plate apparatus(Hot Plate 2A Type Omega) with the temperaturecontrolled at 55-56OC. The time elapsing until theanimal licks its hind paws or jumps is recordedusing a stop-watch (16). The ED50 values and their
Table 2. Structure and binding affinity data for serotonin 5-HT1A and 5-HT2 receptors of the investigated compounds.
Ki (nM) ± SEM Compound R n R1
5-HT1A 5-HT2
1 C3H7 2 m-Cl 15 ± 1a 28 ± 2a 2 C2H5
2 C3H5 2 m-Cl 12 ± 2a 15 ± 1a
3 C2H5 1 m-Cl 190 ± 28a 23 ± 2a
4 C3H7 1 m-Cl 288 ± 18a 25 ± 2a
a Data taken from ref. (12).
Table 3. The influence of the investigated compounds and ketoprofen on the pain reaction in the ìwrithingsyndromeî test in mice.
CompoundDose Mean number of
mg/kg writhings ± SEM
Control 30.5 ± 0.7
1 5 8.7 ± 0.8**
2 5 9.3 ± 0.2**
3 5 4.7 ± 0.6***
4 5 3.9 ± 0.4***
Ketoprofen 5 1.9 ± 0.1***
Data are presented as the means ± SEM of 6-8 mice per group. The results were analyzed by Studentís t-test.** p < 0.01,*** p < 0.001 vs. control.

582 MA£GORZATA ZYGMUNT et al.
confidence limits were estimated by the method ofLitchfield and Wilcoxon (15).
RESULTS
Analgesic activity in the writhing syndrome test
All xanthine derivatives were tested in thewrithing test. In this test, pain was induced by injec-tion of an irritant (such as phenylbenzoquinone) intothe peritoneal cavity of mice. In this test, the inves-tigated compounds (1ñ4) administered at a dose 5mg/kg, showed significant analgesic properties(Table 3). Ketoprofen was a drug of reference in thisassay. The mean number of writhing responses inthe vehicle-treated mice was 30.5. The strongestanalgesic effect was observed for compounds 3 and4. Compound 3 injected i.p. at a dose 5 mg/kg bodyweight, reduced the number of writhes in responseto an irritating stimulus by 84.6%. Administration ofcompound 4 at a same dose, produced a strong anal-gesic effect (inhibition by 87.2%). Compound 1
reduced the number of abdominal writhings by71.4% with respect to the control group, while com-pound 2 statistically significantly diminished thenumber of abdominal constrictions by 69.5%, ascompared to the 0.9% NaCl-pretreated animals.
In this model of pain, each drug was used aloneto test its analgesic effect, and in combination withketoprofen (at the dose 5 mg/kg) to look for a possi-ble potentiation of its analgesic effect.
The combination of the investigated compound3 and ketoprofen produced a slightly higher effect inthe writhing test, compared to each of them usedalone (reduction of the number of writhes by96.8%), (Table 4). The combination of the investi-gated compound 4 and ketoprofen also produced aslightly higher effect in the writhing test, comparedto each of them used alone (reduction by 97.6%). Asregards compound 2 and ketoprofen, this combina-
tion also increased the analgesic activity in thewrithing test (95.5% increase versus 69.5 and93.7%, respectively), (Table 4). Compound 1 andketoprofen reduced the number of writhes inresponse to an irritating stimulus by 95.2%. Thiscombination produced higher effect in the writhingtest, compared to compound 1 (71.4%) and ketopro-fen (93.7) used alone.
Hot plate test
As demonstrated in Table 5, in the hot platetest the investigated compounds 1-4 did not exertedan analgesic activity at the dose of 5 mg/kg bodyweight. Morphine, which was a drug of reference inthis assay, showed a high antinociceptive potency.
DISCUSSION AND CONCLUSION
Serotonin (5-hydroxytryptamine, 5-HT), likenoradrenaline, is believed to be one of importantmodulators of painful stimulus transmission whilespinal serotonergic receptors play an important rolein the inhibition of nociceptive reaction connectedwith the release of stimulatory amino acids and sub-stance P (17). Many types and subtypes of 5-HTreceptors were identified in the CNS, however, onlyfour of them - 5HT1-4 were found in the spinal cord(17). When administered intrathecally, 5-HT had anantinociceptive effect in acute pain models. In theperiphery, 5-HT was shown to produce analgesicresponse in pain accompanying inflammatoryprocess.
Animal studies demonstrated antinociceptiveaction of serotonin via spinal 5-HT receptors in thewrithing test. Analgesic action of different sub-stances in that test could result from their effect onthe serotonergic system (18) probably mediated by5-HT2 and 5-HT3 receptors. It was abolished byantagonists of these receptors (ketanserin, cyprohep-
Table 4. The influence of the combination of the investigated compounds and ketoprofen on pain reaction inthe ìwrithing syndromeî test in mice.
CompoundDose Mean number of
mg/kg writhings ± SEM
Control 31.5 ± 2.6***
1 + Ketoprofen 5 1.5 ± 0.8***
2 + Ketoprofen 5 1,4 ± 0.2***
3 + Ketoprofen 5 1.0 ± 0.1***
4 + Ketoprofen 5 0.8 ± 0.1***
Data are presented as the means ± SEM of 6ñ8 mice per group. The results were analyzed by Studentís t-test.*** p < 0.001 vs. control.

The effect of serotonin 5-HT1A, 5HT2 receptor ligands, ketoprofen and... 583
tadine, ondansetron). The 5HT1 receptors seemed toplay a less important role in this model of pain andtheir antagonists did not abolish nociceptive actionof agonists. The role of 5HT1A receptors in thermalpain models is unclear (17). It appears that 5HT1A
receptors do not play a role in the hot plate test andantinociceptive action in this test can result from thestimulation of serotonin type 3 and probably 2receptors.
Summarizing, the problem of implication ofspecific serotonin receptor subtypes in different ani-mal models of pain is very complex and deservesfurther clarification (19, 20). It should be remem-bered that the role of serotonin in the CNS and itsreceptor-mediated actions, including analgesiceffect, are closely connected with other neurotrans-mitter systems (19, 20).
Animal studies revealed analgesic potential ofantidepressant drugs which is partly mediated byserotonin receptors but can also stem from complexinteractions between serotonergic, adrenergic andopioid systems (21). Due to their antinociceptiveactions, some antidepressant drugs can be used asco-analgesics (3, 10, 11). Trazodone which present-ed a weak activity of a serotonin reuptake inhibitorand 5-HT2A receptor antagonist, also showed anal-gesic activity in animal studies (22) but the clinicaltrials did not confirm its beneficial effects in chron-ic pain (3).
In our previous studies, all investigated com-pounds were demonstrated to be highly active 5-HT2A receptor ligands. Compounds 3 and 4 showed8.3- and 11.5-fold stronger affinity for 5-HT2 recep-tor than for 5-HT1A whereas compounds 1 and 2
were found to be highly active 5-HT1A receptor lig-ands. On the other hand, several derivatives of 8-
alkoxypurine-2,6-dione revealed a potent antide-pressant-like activity in the forced swimming test inmice (12). In our study, the most potent effect in theforced swimming test was produced by compounds3 and 4 (12). The investigated compounds exhibiteda similar mechanism of action as trazodone (23).Perhaps it was because of the combination of theweak activity of a serotonin reuptake inhibitor and a5-HT2A receptor antagonist.
Pain is often associated with inflammatoryconditions. Non-steroidal anti-inflammatory drugs(NSAIDs) are the most commonly used analgesicagents. NSAIDs are clinically effective because theyalleviate pain and inflammation (24-26) Thus, theNSAID (ketoprofen) was selected in the presentstudy as a standard drug to be co-administered withthe tested compounds (1ñ4), 7-(3-chlorophen-yl)piperazinylalkyl derivatives of 8-alkoxypurine-2,6-dione.
The aim of the first stage of our studies was todetermine analgesic activity of the test compoundsand ketoprofen in the writhing test and the hot platetest.
7-(3-Chlorophenyl)piperazinylalkyl deriva-tives of 8-alkoxypurine-2,6-dione were adminis-tered at a dose of 5 mg/kg, because, as previousstudies have shown, it was the lowest used dose thatdid not reduce the motility of animals (12). Higherdoses of 10-30 mg/kg significantly decreased mobil-ity. Therefore, this dose was used in order to excludefalse-positive results in the tests assessing analgesicactivity.
The analgesic activities of the 7-(3-chlorophenyl)piperazinylalkyl derivatives of 8-alkoxypurine-2,6-dione 1ñ4 were measured usingthe phenylbenzoquinone-induced writhing syn-
Table 5. The influence of the investigated compounds and ketoprofen on the pain reaction in the hot plate testin mice.
CompoundDose Time of reaction to
mg/kg ain stimulus (s) ± SEM
Control 30.0 ± 2.4
1 5 27.2 ± 1.3
2 5 29.2 ± 3.0
3 5 31.6 ± 2.2
4 5 28.3 ± 1.6
Morphine 5 50.2 ± 0.7 **
Ketoprofen 5 19.2 ± 3.1
Data are presented as the means ± SEM of 6ñ8 mice per group. The results were analyzed by Studentís t-test.** p < 0.01 vs. control.

584 MA£GORZATA ZYGMUNT et al.
drome test. This test consists in intraperitonealinjection of the chemical irritant followed by subse-quent counting of ìwrithesî, i.e., characteristic con-tractions of abdominal muscles accompanied by ahind limb extensor motion. This test detects periph-eral analgesic activity; however, some psychoactiveagents (including clonidine and haloperidol) alsoshow activity in this test. Compounds with anti-inflammatory properties, such as NSAIDs show asignificant activity in this assay, viz. they abolish thereflex stimulated by the administration of an irritat-ing substance, like phenylbenzoquinone
All tested compounds 1ñ4 demonstrated a sta-tistically significant analgesic activity in this testwith compounds 3 and 4 revealing the highest(similar to ketoprofen) potency. However, theobserved effect was not stronger than that of keto-profen alone at the same dose. It is probable thatanalgesic activity of the test compounds is mediat-ed by 5-HT2 receptors because they bound severaltimes more strongly to 5-HT2 than to 5-HT1A recep-tors. It was additionally confirmed by the fact thatanalgesic activity of different substances in thewrithing test could result from the stimulation of 5-HT2 receptors while 5-HT2 played a less importantrole (18, 27).
Peripheral 5-HT2 and presynaptic 5-HT1A
receptors have been clearly shown to be involved in5-HT-induced hyperalgesia (27). On the other hand,it is not excluded that 5-HT1A receptors also playeda role in this effect. In order to clarify the mecha-nism of action, we planned to determine analgesicactivity of the test compounds, given together withantagonists of serotonin receptors. In addition, theinvolvement of serotonin receptors in the analgesiceffect was supported by the fact that 5-HT whenapplied peripherally, was a potent proinflammatoryand noxious agent, which caused hyperalgesia bothin humans and rodents (27). 5-HT, released fromplatelets, mast cells, and basophils in injured orinflamed tissues, may play a role in inflammatorychemical milieu. Hyperalgesia, which is the majorsymptom of inflammation and tissue injury, proba-bly caused by the phenylbenzoquinone, was theresult of sensitization of nociceptors by a variety ofinflammatory mediators. 5-HT is one of these medi-ators; indeed it has been shown be able to sensitizeperipheral nerve fibers to other inflammatory medi-ators, such as bradykinin (27).
Next, we determined analgesic activity of thetest compounds in another model of pain, namelythe hot plate test. None of the tested xanthine deriv-atives prolonged the reaction time to a thermal stim-ulus. The proven activity in the writhing test with
the concomitant lack of activity in the hot plate testindicates rather peripheral than central mechanismof analgesic action of the test compounds.
The next stage of research aimed to determinewhether the test compounds, shown previously topossess antidepressant activity (12), can be used asco-analgetics. To answer this question, the com-pounds were tested for analgesic activity in thewrithing test when administered in combinationwith ketoprofen.
The compounds slightly enhanced the anal-gesic effect of ketoprofen in the writhing test whengiven together.
In summary, compounds 1-4 were found tohave analgesic effect when given alone, however,their effects differed in dependence on the painmodel used. The analgesic activities were observedonly in the writhing test. The strongest effect (simi-lar to ketoprofen) was shown by compounds 3 and4. The possible mechanism of the antinociceptiveeffect of these compounds is thought to involve theactivation of an analgesia mediated by serotonergicpathways or a combination of this mechanism withother important mediators playing a role in painmodulation. The compounds slightly enhanced theanalgesic effect of ketoprofen in the writhing testwhen given in combination.
REFERENCES
1. Capmourteres E.M., Finkel D.: Vertex 13, 100(2002).
2. Ciuffreda M.C., Tolva V., Casana R., GnecchiM., Vanoli E., Spazzolini C., Roughan J.,Calvillo L: PloS One 9, e95913 (2014).
3. Mika J., Zychowska M., Makuch W., RojewskaE., Przew≥ocka B.: Pharmacol. Rep. 65, 1611(2013).
4. Khan M.I., Walsh D., Brito-Dellan N.: Am. J.Hosp. Palliat. Care 28, 378 (2011).
5. Suski M., Bujak-Gizycka B., Madej J., KackaK., Dobrogowski J., Woron J., Olszanecki R.,Korbut R.: Basic Clin. Pharmacol. Toxicol. 107,680 (2010).
6. Hardy J.R., Spruyt O., Quinn S.J., Devilee L.R.,Currow D.C.: Intern Med. J. 44, 586 (2014).
7. Cleary J.F.: J. Palliat. Med. 10, 1369 (2007). 8. Mellbye A., Svendsen K., Borchgrevink P.C.,
Skurtveit S., Fredheim O.M.: ActaAnaesthesiol. Scand. 56, 1267 (2012).
9. Lange H., Kranke P., Steffen P., Steinfeldt T.,Wulf H., Eberhart L. H.J.: Der Anaesthesist 56,1001 (2007).

The effect of serotonin 5-HT1A, 5HT2 receptor ligands, ketoprofen and... 585
10. Nekovarova T., Yamamotova A., Vales K.,Stuchlik A., Fricova J., Rokyta R.: Front.Behav. Neurosci. 8, 99 (2014).
11. Kesim M., Yanik M.N., Kadioglu M., PepeogluD., Erkoseoglu I., Kalyoncu N.I., Yaris E.:Bratisl. Lek. Listy 115, 3 (2014).
12. Zygmunt M., Sapa J., Ch≥oÒ-Rzepa G.,ZagÛrska A., Paw≥owski M., Nowak G., SiwekA..: Pharmacol. Rep. 66, 505 (2014).
13. Ch≥oÒ-Rzepa G., Ømudzki P., Zajdel P.,Bojarski A., DuszyÒska B., Nikuforuk A.,TatarczyÒska E., Paw≥owski M.: Bioorg. Med.Chem. 15, 5239 (2007).
14. Henderson L.C., Forsaith J.: J. Pharmacol. Exp.Ther. 125, 237 (1959).
15. Litchfield J.T., Wilcoxon F.: J. Pharmacol. Exp.Ther. 96, 99 (1949).
16. Eddy N., Leimbach D.:. J. Pharmacol. Exp.Ther. 107, 385 (1953).
17. Jeong C. Y., Choi J. I., Yoon M. H.: Eur. J.Pharmacol. 502, 205 (2004).
18. Mu�oz-Islas E., Vidal-Cant˙ G.C., Bravo-Hern·ndez M., Cervantes-Dur·n C., Qui�onez-
Bastidas G.N., Pineda-Farias J.B., Barrag·n-Iglesias P., Granados-Soto V.: Pharmacol.Biochem. Behav. 120, 25 (2014).
19. Bektas N., Arslan R., Ozturk Y.: Life Sci. 95, 9(2014).
20. Kim Y.S., Chu Y., Han L., Li M., Li Z., Lavin-ka PC., Sun S. et al.: Neuron 81, 873 (2014).
21. McCleane G.: CNS Drugs 22, 139 (2008).22. Dickman R., Maradey-Romero C., Fass R.:
Neurogastroenterol. Motil. 26, 603 (2014).23. Werneck A.L., Rosso A.L., Vincent M.B.: Arq.
Neuropsiquiatr. 67, 407 (2009).24. Varga Z., Kriöka M., Kristov· V., Petrov· M.:
Interdiscip. Toxicol. 6, 141 (2013).25. Maroli S., Srinath H.P., Goinka C., Yadav NS.,
Bhardwaj A.., Varghese RK.: J. Int. Oral Health6, 66 (2014).
26. Crossley L.: Nurs. Times 110, 21 (2014).27. Kesim M., Duman E.N., Kadioglu M., Yaris E.,
Kalyoncu N.I., Erciyes N.: J. Pharmacol. Sci.97, 61 (2005).
Received: 13. 05. 2014


Acta Poloniae Pharmaceutica ñ Drug Research, Vol. 72 No. 3 pp. 587ñ596, 2015 ISSN 0001-6837Polish Pharmaceutical Society
Biochanin A (5,7-dihydroxy-4í-methoxy-isoflavone) is an isoflavone, which can be found inmany clover species. In zigzag clover (Trifoliummedium) it occurs in high concentration, and in redclover (Trifolium pratense), crimson clover(Trifolium incarnatum), haresfoot clover (Trifoliumarvense), hungarian clover (Trifolium pannonicum)and red-feather clover (Trifolium rubens) its concen-tration is lower (1). It is also present in other plantssuch as soy, alfalfa, peanuts, and chickpea (2). Thisisoflavone is also reported in Cassia fistula andDalbergia odorifera (3, 4). Biochanin A has beenproven to have many pharmacological activities.Some in vitro studies indicated that this substancemay act as a neuroprotective agent in L-glutamate-induced cytotoxicity in Parkinsonís, Alzheimerís orHuntingtonís diseases (5), it is also an inhibitor offatty acid amide hydrolase, the enzyme responsible
for the hydrolysis of anandamide ñ the endogenouscannabinoid receptor ligand (6). It also inhibitsallergic response in rat basophilic leukemia cells (7).There are reports that biochanin A shows antioxida-tive properties in cell cultures (8) as well as anti-inflammatory and anti-proliferative activities onRAW 264.7, HT-29 cell lines and mouse peritonealmacrophages (9). This isoflavone suppresses theproliferation of oral squamous carcinoma cells (10)and could be an anticancer agent which can selec-tively target cancer cells inhibiting multiple signal-ing pathways in HER-2-positive breast cancer cells(11). Moreover, it promotes apoptosis of prostatecancer cells (12, 13). Antiparasitic activity ofbiochanin A towards Leishmania chagasi andTrypanosoma cruzi is also confirmed (3).Furthermore, this flavonoid acts as antiviral agent inH5N1 influenza A virus-infected cells (14) and
BIOCHANIN A SHOWS NO EFFECT ON SKELETAL SYSTEM IN OVARIECTOMIZED RATS, WHEN ADMINISTERED
IN MODERATE DOSE
ILONA KACZMARCZYK-SEDLAK*, MARIA ZYCH, WERONIKA WOJNAR, EWA OZIMINA-KAMI—SKA, S£AWOMIR DUDEK, NATALIA CHADA£A and AGNIESZKA KACHEL
Medical University of Silesia in Katowice, School of Pharmacy with the Division of Laboratory Medicine, Department of Pharmacognosy and Phytochemistry,
JagielloÒska 4, 41-200 Sosnowiec, Poland
Abstract: Biochanin A is a naturally occurring isoflavone. Its main sources are clover species such as Trifoliumpretense, Trifolium subterraneum or Trifolium incarnatum. Phytoestrogens, including isoflavones, are plant-derived substances, which exhibit estrogen-like properties, thus they may be used as an alternative for hormonalreplacement therapies and prevent postmenopausal osteoporosis. Therefore, the aim of the presented study, wasto investigate the effect of biochanin A on chemistry and mechanical properties of skeletal system in rats withovariectomy-induced osteoporosis. The animals were divided into 4 groups ñ (I) sham-operated rats, (II)ovariectomized rats, (III) ovariectomized rats receiving estradiol at a dose of 0.2 mg/kg p.o., which were a pos-itive control, and (IV) ovariectomized rats receiving biochanin A at a dose of 5 mg/kg p.o. for four weeks. Theadministered dose of biochanin A is considered as moderate for human, which can be received in the dietarysupplements, and was established using ten-fold conversion rate resulting from faster metabolism in rats.Obtained results showed that ovariectomy induced harmful changes in bone tissue, causing worsening in bothchemistry and mechanical parameters in bones. Administration of biochanin A to ovariectomized rats did notaffect any changes in bone tissue in comparison to the bones of untreated ovariectomized rats. There was nei-ther improvement nor deterioration noted in chemical composition and mechanical properties in all analyzedbones. Basing on the results, it could be concluded, that biochanin A administered in a moderate dose showsno influence on bone tissue of rats with ovariectomy-induced osteoporosis.
Key words: biochanin A, ovariectomy, rats, osteoporosis, bones
587
* Corresponding author: [email protected]

588 ILONA KACZMARCZYK-SEDLAK et al.
shows antimicrobial properties against Clostridiumspp. (15).
What is more, there are in vitro and in vivostudies, indicating that biochanin A may inhibitmelanogenesis, thus it can prevent the abnormalskin pigmentation in mice (16). This isoflavone wasalso examined in vivo in many animal models. Someinvestigations on rats show that biochanin A is anantifibrotic agent which prevents liver injuries (2,17). Moreover, it shows antihyperglicemic effect(18), and can be used as chemoprevention of mam-mary tumorigenesis (19). Studies on murinexenograft model indicate that this substance mayalso inhibit the growth of the human breast cancercells implanted into mice (20).
Isoflavones, including biochanin A, are consid-ered as the phytoestrogens, due to their structuraland functional similarity to 17β-estradiol.Phytoestrogens are plant-derived, nonsteroidal sub-stances, which can bind to estrogen receptors (ER)and mimics the effect of estradiol, but their activityis lower when compared to 17β-estradiol (21).During menopause in women, endogenous estrogenlevel decreases, what leads to disadvantageouschanges, such as flushing, but one of the most dan-gerous effect is osteoporosis (22). Hormonalreplacement therapy (HRT) is used in post-menopausal women in order to reduce these symp-toms, however this therapy is known to have someadverse effects on womenís health (23). Therefore,to overcome negative effects of HRT and minimizesymptoms of menopause, other substances, includ-ing isoflavones, have been tested. Until now, theeffects of biochanin A on skeletal system have beenexamined in in vitro and in vivo studies. The in vitroexperiment was conducted on mesenchymal stemcells and the results indicate that biochanin A pre-vents adipogenesis and enhances the differentiation
of osteoblasts (24). Oral administration of thisisoflavone to ovariectomized rats at a dose of 25mg/kg for 14 weeks showed positive results inskeletal system (25). Even though the intake of phy-toestrogens is commonly considered as a safe thera-py, there are also some reports that long-termadministration of higher doses of these substancesmay result in some complications, such as abnormaluterus bleedings or the increased occurrence ofendometrial hyperplasia (26, 27, 28). Thus, in ourstudy, the effect of biochanin A on bones in ovariec-tomized rats was investigated while administeringthis isoflavone at a dose of 5 mg/kg orally (p.o.) for4 weeks.
MATERIALS AND METHODS
Virgin three-month-old Wistar female ratswere provided by the Centre of ExperimentalMedicine at the Medical University of Silesia.Animals were fed with standard laboratory chow adlibitum and since the day preceding the experiment,the standard chow was replaced with chow contain-ing no soybean. The research was carried out withthe approval of the Local Ethics Commission inKatowice.
Rats were divided into four groups (n = 7): I ñthe control group of sham-operated, vehicle treatedrats (SHAM), II ñ the control group of ovariec-tomized, vehicle treated rats (OVX), III ñ theovariectomized rats receiving estradiol at a dose of0.2 mg/kg p.o. (OVX + ES), and IV ñ the ovariec-tomized rats receiving biochanin A at a dose of 5mg/kg p.o. (OVX + BioA). Administration of ana-lyzed substances started one week after surgery andcontinued for 4 weeks.
All animals were weighted at the first day orresearch and after 4 weeks of the administration of
Table 1. Effects of estradiol and biochanin A on the body weight gain and weight of organs in ovariectomized rats.
Parameters SHAM OVX OVX + ES OVX + BioA
Final body weight [g]
234.4 ± 4.3 245.8 ± 4.7 238.1 ± 6.4 246.4 ± 8.5
Body weight gain after 15.9 ± 1.8 29.7 ± 2.4AA 23.0 ± 1.7 37.6 ± 5.04 weeks [g]
Uterus weight [g]
0.616 ± 0.085 0.103 ± 0.005AA 0.252 ± 0.009BB 0.100 ± 0.005
Thymus weight [g]
0.313 ± 0.018 0.482 ± 0.052AA 0.500 ± 0.024 0.578 ± 0.048
Results are presented as the means ± SEM (n = 7). AA - p< 0.01 ñ statistically significant differences between the OVX and the SHAMgroups; BB - p < 0.01 ñ statistically significant differences in comparison with the OVX group.

Biochanin A shows no effect on skeletal system in ovariectomized rats... 589
the substances. Moreover, the body mass gain wasmonitored during the whole experiment. One weekbefore treatment with biochanin A and estradiol,sham surgery and bilateral ovariectomy were per-formed in general anesthesia induced by the mixtureof ketamine and xylazine intraperitoreally. After 4weeks of drugs administration, all animals were sac-rificed with use of general anesthesia induced byketamine and xylazine and cardiac exsanguination.Uterus, thymus and following bones: the right andleft tibia and the right and left femur, as well as theL-4 vertebra were excised from each of the rats. Themass of analyzed bones was presented as the ratio oftheir mass per body mass determined after 4 weeksof the experiment.
The analysis of the mechanical properties of the
bones
Investigation of the bone mechanical proper-ties of the left femoral diaphysis, right tibial proxi-mal metaphysis and right femoral neck was per-formed using the Instron apparatus, model 3342 500N. Results were studied by using the softwareBluehill 2, version 2.14.
For the femoral diaphysis, the bending testwith three point loading was applied and followingparameters were measured: the maximum load, thefracture load, displacement for maximum load, dis-placement for fracture load, and energy for maxi-mum load. The Youngís modulus and stress werealso determined. Assessment of the mechanicalproperties of tibial proximal metaphysis was per-formed according to the method of St¸rmer et al.(29, 30), using the three-point bending test.Likewise in femoral diaphysis, in tibial metaphysis:the maximum load, the fracture load, displacementfor maximum load, displacement for fracture load,energy for maximum load, stress and Youngís mod-ulus were measured. The mechanical properties ofthe femoral neck were analyzed by performing acompression test and the maximum load affectingthe femoral neck was determined. All methods usedto examine the mechanical properties of the boneswere described in previous studies (31, 32).
Assessment of the chemical content of the bones
and the serum
Chemical content analysis involved the calcula-tion of the water, organic substances and mineral sub-stances content and the content of calcium and phos-phorus in left femur (after bone mechanical propertiesanalysis) and left tibia as well as in L-4 vertebra.
In order to determine the water content, thetibia, femur and L-4 vertebra were weighed after
lyophilization in the lyophilizer Labconco Freezone6 (USA) for seven days (temperature: -53OC, pres-sure: 0.03 mBa). The difference between the bonemass obtained directly after the isolation and thebone mass determined after lyophilization corre-sponds to the water content.
Afterwards, the lyophilized bones were miner-alized for 48 h in the muffle furnace type LG/11/C6produced by Naberherm (The Netherlands) andweighed again. The bone ash obtained during themineralization process comprised the mass of themineral substances, and the difference between bonemass determined after lyophilization and bone massafter mineralization corresponds to the content ofthe organic substances in analyzed bones. The con-tent of water, organic and mineral substances waspresented as the ratio of water, organic and mineralsubstances mass per 100 mg of the bone mass afterisolation.
In order to determine calcium and inorganicphosphorus content, mineralized bones were dis-solved in 6 M HCI, diluted in distilled water, andthen examined by the spectrophotometric method,using the kit Pointe Scientific, Inc. (USA) The con-tent of calcium and phosphorus in the analyzedbones was presented as the ratio of the quantity ofcalcium and phosphorus per 100 mg of mineral sub-stances.
In serum, the content of calcium and inorganicphosphorus was also determined. The assay wasperformed by spectrophotometric method using thekit Pointe Scientific Inc.
Statistical analysis
The results obtained during the tests were pre-sented as the arithmetic means ± SEM.
The results were evaluated by one-wayANOVA, followed by Duncanís post hoc test. Non-parametric tests: Kruskal-Wallis and Mann-WhitneyU test were performed, when necessary (lack of nor-mality or of homogeneity of variance).
The differences were considered to be statisti-cally significant if p < 0.05.
RESULTS AND DISCUSSION
The menopause is the mark of the end of natu-ral female reproductive life and it is defined as thepermanent cessation of menstruation resulting fromthe loss of ovarian follicular activity (33). The lossof the activity of ovarian follicular results in thedecrease of endogenous estrogens. When such defi-ciency occurs, the rate of bone loss is accelerated ñthe osteoclastsí lifespan is increased and

590 ILONA KACZMARCZYK-SEDLAK et al.
osteoblastsí decreased. All these actions lead topostmenopausal osteoporosis (34). One of the mostdangerous effects of postmenopausal osteoporosisare bone fractures. Due to the fact that the studies onbone mechanical resistance are unable to conduct onhuman, the animal model was developed. The bestmodel for bone studies in postmenopausal period areovariectomized rats. After ovariectomy, the osteo-porotic changes similar to those in postmenopausalwomen are observed in these animals (35).
In our study, the ovariectomy proved to causetypical changes in rats. The body weight gain after 4weeks in ovariectomized rats (OVX) was signifi-cantly higher than in sham-operated rats (SHAM) by87.0%. What is more, the uterus weight was loweredby 83.2% and thymus weight increased by 53.9%(Table 1). Furthermore, weight of all analyzed boneswas lower in OVX than in SHAM rats, but thesechanges were not statistically significant (Table 2).Estrogen deficiency also resulted in bone chemistry.The water content in analyzed bones increased, butthe most significant changes were observed in femurand L-4 vertebra, where the water content was 9.9%and 11.8%, respectively, higher in OVX than inSHAM (Table 3). Furthermore, there was decreaseof mineral content observed in tibia and L-4 vertebraby 4.4% and 8.9%, respectively, what is more, in L-4 vertebra, calcium content also decreased by 6.5%when compared to SHAM rats. Other studiedparameters of bone chemical composition (organicfraction content as well as phosphorus content) werenot affected by ovariectomy in statistically signifi-cant manner (Table 3). Ovariectomy also affectedthe mechanical properties of bones. The greatestchanges were observed in tibia, where the following
parameters were affected: maximal load, maximumstress, fracture load, energy for fracture load andstress for fracture load decreased by 43.9, 42.8, 44.5,30.2 and 43.2%, respectively, in tibial metaphysis.Other parameters were not changed in statisticallysignificant manner in all analyzed bones, however,the maximum stress and fracture stress were alsolower in OVX group than in SHAM rats, both infemoral diaphysis as well as tibial metaphysis.There were no changes detected in femoral neckwhen comparing OVX to SHAM group (Table 5).Similar changes in ovariectomized rats wereobserved in our previous study (32), as well as inother studies (30, 36, 37).
In our experiment, the positive control wasused. For this purpose, estradiol at a dose of 0.2mg/kg p.o. was administered to ovariectomized rats.This substance is one of estrogens which can beused in HRT. HRT is used to overcome unfavorableeffects of postmenopausal symptoms includingosteoporosis (38, 39). Moreover, estradiol was alsoused in other studies as a positive control (30, 32,36, 37). Ovariectomized rats receiving estradiol(OVX + ES) showed statistically insignificantdecrease of body weight gain in comparison to OVXrats. What is more, in OVX + ES, the uterus weightincreased by 147.7%, when compared to OVXgroup (Table 1). Macrometric parameters of allexamined bones were not altered by administrationof estradiol (Table 2). Chemical composition of ana-lyzed bones was slightly affected by administrationof estradiol at a dose of 0.2 mg/kg p.o. Except formineral content in femur and L-4 vertebra, whichincreased by 4.3 and 6.0%, respectively, in OVX +ES when compared to OVX, other parameters in all
Table 2. Effects of estradiol and biochanin A on bone macrometric parameters in ovariectomized rats.
Parameters SHAM OVX OVX + ES OVX + BioA
FEMUR
Weight [g] 0.663 ± 0.012 0.628 ± 0.006 0.631 ± 0.023 0.633 ± 0.023
Length [mm] 33.45 ± 0.27 33.50 ± 0.22 32.91 ± 0.25 33.37 ± 0.23
Diameter [mm] 3.25 ± 0.02 3.22 ± 0.04 3.20 ± 0.05 3.20 ± 0.05
TIBIA
Weight [g] 0.517 ± 0.008 0.477 ± 0.014 0.489 ± 0.016 0.484 ± 0.015
Length [mm] 37.54 ± 0.34 37.59 ± 0.04 36.78 ± 0.19 37.01 ± 0.42
Diameter [mm] 2.63 ± 0.05 2.58 ± 0.05 2.62 ± 0.05 2.59 ± 0.03
L-4 VERTEBRA
Weight [g] 0.176 ± 0.006 0.168 ± 0.011 0.163 ± 0.006 0.154 ± 0.005
Results are presented as the means ± SEM (n = 7).

Biochanin A shows no effect on skeletal system in ovariectomized rats... 591
Table 3. Effects of estradiol and biochanin A on bone mineral, H2O, organic compounds, calcium and phosphorus content in ovariec-tomized rats.
Parameters SHAM OVX OVX + ES OVX + BioA
FEMUR
H2O content [mg/100 mg 27.23 ± 0.74 29.92 ± 1.12A 28.81 ± 0.52 30.47 ± 0.46 bone weight]
Organic compounds [mg/100 mg 25.10 ± 0.69 24.87 ± 0.43 24.05 ± 0.17 24.13 ± 0.23 bone weight]
Mineral content [mg/100 mg 47.67 ± 1.06 45.22 ± 0.81 47.14 ± 0.50 45.40 ± 0.55bone weight]
Calcium content [mg/100 mg 39.43 ± 0.34 38.07 ± 0.94 39.55 ± 0.37 38.31 ± 0.45 mineral substances]
Phosphorus content [mg/100 mg 15.79 ± 0.19 15.15 ± 0.37 15.55 ± 0.27 15.47 ± 0.17mineral substances]
TIBIA
H2O content [mg/100 mg 25.60 ± 0.74 26.82 ± 1.16 26.32 ± 0.75 28.52 ± 0.75bone weight]
Organic compounds [mg/100 mg 25.89 ± 0.42 26.81 ± 0.34 26.24 ± 0.35 25.98 ± 0.47bone weight]
Mineral content [mg/100 mg 48.51 ± 0.43 46.37 ± 0.93A 47.44 ± 0.52 45.50 ± 0.33bone weight]
Calcium content [mg/100 mg 41.54 ± 1.53 38.03 ± 1.81 40.96 ± 0.52 41.79 ± 0.42mineral substances]
Phosphorus content [mg/100 mg 15.05 ± 1.04 14.66 ± 0.82 15.52 ± 0.26 16.00 ± 0.29mineral substances]
L-4 VERTEBRA
H2O content [mg/100 mg 26.44 ± 0.24 29.56 ± 0.60AA 27.66 ± 0.79 30.79 ± 0.58bone weight]
Organic compounds [mg/100 mg 26.29 ± 0.31 27.37 ± 0.73 26.58 ± 0.42 26.12 ± 0.33bone weight]
Mineral content [mg/100 mg 47.26 ± 0.37 43.08 ± 0.89AAA 45.76 ± 0.66BB 43.08 ± 0.37bone weight]
Calcium content [mg/100 mg 43.78 ± 0.78 40.92 ± 0.65A 41.06 ± 0.81 39.21 ± 0.61mineral substances]
Phosphorus content [mg/100 mg 16.71 ± 0.47 16.30 ± 0.45 15.96 ± 0.21 15.72 ± 0.21mineral substances]
Results are presented as the means ± SEM (n = 7). A - p < 0.05, AA - p < 0.01, AAA ñ p < 0.001 ñ statistically significant differences between the OVX and the SHAM groups; BB - p < 0.01 ñ statistically significant differences in comparison with the OVX group.

592 ILONA KACZMARCZYK-SEDLAK et al.
Table 4. Effects of estradiol and biochanin A on serum concentrations of calcium and inorganic phos-phorus in ovariectomized rats.
Parameters SHAM OVX OVX + ES OVX + BioA
Calcium mg/100 mL]
8.99 ± 0.37 9.13 ± 0.20 9.43 ± 0.59 9.49 ± 0.45
Phosphorus [mg/100 mL]
5.45 ± 0.42 6.07 ± 0.49 7.55 ± 0.64 6.29 ± 0.36
Results are presented as the means ± SEM (n = 7).
Table 5. Effects of estradiol and biochanin A administered for 4 weeks on bone mechanical properties in ovariectomized rats.
Parameters SHAM OVX OVX + ES OVX + BioA
FEMORAL DIAPHYSIS
Maximal load [N] 100.4 ± 4.8 99.9 ± 3.7 99.1 ± 5.1 101.1 ± 4.7
Displacement for maximal load [mm] 0.494 ± 0.020 0.546 ± 0.043 0.478 ± 0.030 0.591 ± 0.040
Energy for maximum load [J] 0.029 ± 0.002 0.032 ± 0.004 0.027 ± 0.003 0.036 ± 0.004
Maximum stress[MPa] 172.1 ± 26.3 116.6 ± 5.0 118.9 ± 2.9 121.0 ± 4.2
Fracture load [N] 100.1 ± 4.8 99.9 ± 3.7 99.1 ± 5.1 100.9 ± 4.7
Displacement for fracture 0.497 ± 0.022 0.546 ± 0.043 0.478 ± 0.030 0.595 ± 0.041load [mm]
Energy for fracture load [J] 0.030 ± 0.003 0.032 ± 0.004 0.027 ± 0.003 0.036 ± 0.004
Stress for fracture load [MPa] 171.5 ± 26.2 116.6 ± 5.0 118.9 ± 2.9 120.8 ± 4.2
Youngís modulus [MPa] 6362 ± 274 5120 ± 325 5925 ± 268 5828 ± 358
TIBIAL METAPHYSIS
Maximal load [N] 122.3 ± 4.2 68.6 ± 5.1AA 85.7 ± 12.0 69.4 ± 3.1
Displacement for maximal load [mm] 0.947 ± 0.084 0.946 ± 0.039 0.840 ± 0.061 0.941 ± 0.066
Energy for maximum load [J] 0.065 ± 0.007 0.039 ± 0.004 0.044 ± 0.008 0.045 ± 0.004
Maximum stress [MPa] 85.4 ± 7.7 48.8 ± 7.6A 70.2 ± 13.3 45.5 ± 3.6
Fracture load [N] 118.9 ± 4.6 66.0 ± 5.4AA 84.9 ± 11.9 68.1 ± 2.9
Displacement for fracture load [mm] 1.042 ± 0.087 1.156 ± 0.080 0.886 ± 0.066 1.038 ± 0.057
Energy for fracture load [J] 0.076 ± 0.005 0.053 ± 0.005A 0.049 ± 0.009 0.051 ± 0.003
Stress for fracture load [MPa] 82.8 ± 6.9 47.0 ± 7.4A 69.6 ± 13.2 44.6 ± 3.3
Youngís modulus[MPa] 3692 ± 818 2762 ± 1335 4009 ± 1135 2490 ± 807
FEMORAL NECK
Maximal load (N) 84.0 ± 9.4 80.3 ± 6.8 84.3 ± 7.2 79.4 ± 4.9
Results are presented as the means ± SEM (n = 7). A - p < 0.05, AA - p < 0.01 ñ statistically significant differences between the OVX and theSHAM groups.

Biochanin A shows no effect on skeletal system in ovariectomized rats... 593
studied bones were not changed (Table 3).Administration of estradiol to ovariectomized ratsdid not affect mechanical properties of bones ñ allanalyzed parameters remained unchanged (Table 5).There were no significant changes in serum calciumand inorganic phosphorus content in OVX + ES rats,when compared to OVX rats (Table 4).
Biochanin A was previously examined onbones in vivo in ovariectomized rats. The authors ofthe study administered biochanin A at a dose of 25mg/kg p.o. to the animals for 14 weeks. Their resultsindicated that this isoflavone shows positive effecton rodentsí skeletal system, improving the bonemineral density (BMD), bone mineral content(BMC) and the percentage of the trabecular bonevolume in relation to the total tissue volume (25).
There are, however, some reports indicating thatthe usage of isoflavones at high doses and in long-time period could be unsafe for animals and human.Some studies show that the intake of this kind of phy-toestrogens may lead to uterotropic changes and evento abnormal endometrial bleedings (26-28). What ismore, Leclerc et al. indicate that phytoestrogens mayinteract with other receptors than ER (40).
For this reason, in our study, we administeredlower dose of this isoflavone for 4 weeks. This dosewas evaluated on the basis of commercially avail-able pharmacological products named PromensilÆ
and PromensilÆ Forte. In PromensilÆ, there is 26 mgof biochanin A per 40 mg of all isoflavones.PromensilÆ Forte has got double dose of isoflavones,when compared to PromensilÆ (41). Therefore,patients may receive biochanin A at doses of 26 or52 mg. Considering the commonly used ten-foldconversion rate resulting from faster metabolism inrats, we administered biochanin A at a dose of 5mg/kg to animals. Similar conversion was previous-ly used in other study (42).
The treatment with biochanin A at a dose of 5mg/kg p.o. showed no results on body weight gain,uterus weight and thymus weight in OVX + BioArats when compared to OVX rats, however, therewas statistically insignificant tendency of greaterbody weight gain after 4 weeks of treatment in OVX+ BioA rats (by 37.9%), than in OVX rats (Table 1).Our results describing uterus weight overlap withthose obtained by Su et al. (25). Also, the adminis-tration of this isoflavone did not affect any of theanalyzed macrometric parameters of femur, tibiaand L-4 vertebra in OVX + BioA rats in comparisonto OVX rats (Table 2). The analysis of chemicalcomposition revealed that administration ofbiochanin A did not cause any statistically signifi-cant changes in all examined bones in OVX + BioA
rats when compared to OVX rats. Neither water con-tent, organic content, mineral content nor the calci-um and phosphorus content were altered (Table 3).What is more, the examination of mechanical prop-erties also showed that biochanin A had no influenceon studied bones in treated rats when compared tountreated animals (Table 5). Our results revealedthat biochanin A administered at a dose of 5 mg/kgp.o. to ovariectomized rats shows neither beneficialnor harmful effect on skeletal system in laboratoryanimals. However, in previous studies, Su et al.reported that treatment with higher dose (25 mg/kg)in long-time period (14 weeks) shows advantageouseffect on the ratsí bones ñ it prevented the bone lossin ovariectomized animals. The authors examinedbone mineral density, bone mineral content andbone volume. The serum calcium and inorganicphosphorus were also studied, but their levels wereunchanged (25). In our study, the concentration ofinorganic phosphorus and calcium in serum was alsodetermined, and these results overlap with those pre-sented by Su et al. (25) ñ there were no significantdifferences between all examined groups (Table 4).
There are many reports indicating that biochaninA is demethylated to genistein in digestive system.Such mechanism was observed in sheep, adminis-tered with 14C-labeled biochanin A, where labeledgenistein was observed in rumen fluids (43). In vitrostudies conducted on human liver microsomes alsoshowed, that biochanin A is metabolized to genisteinand some conjugates by cytochrome P450 (44).Pharmacokinetics and metabolism of biochanin Awas also studied in rats. Moon et al. (45) demonstrat-ed that biochanin A in male rats after oral andintraperitoneal administration was demethylated togenistein and its conjugates. Similar observationswere described by Singh et al. in female rats. Theauthors also determined the oral bioavailability of thisisoflavone and considered this parameter as low. Inthis study, the authors also indicated that biochanin Ais rapidly converted into free genistein, as well as intogenistein and biochanin A conjugates (46).
Examining the effect of biochanin A on skele-tal system, this isoflavone should not be consideredas single agent influencing the bone tissue.Biochanin A in digestive system metabolizes viademethylation to other substances including genis-tein, which is also a potent agent affecting the bonemetabolism. The majority of scientific reports sug-gests that genistein shows beneficial properties onbones, preventing from osteoporotic changes both inlaboratory animals (including ovariectomized rats)and women suffering from postmenopausal osteo-porosis (47, 48).

594 ILONA KACZMARCZYK-SEDLAK et al.
There are, however, some reports indicatingthat genistein shows disadvantageous effect onskeletal system. In vivo experiments conducted byåliwiÒski et al. (49) proved that genistein has harm-ful effects on mechanical properties of bones andtheir chemical composition. There is also anotherstudy revealing that genistein displays neither bene-ficial nor injurious effect on skeletal system in rats(50).
åliwiÒski et al. examined the effect of genisteinon ovariectomized rats at a dose of 5 mg/kg; he alsoconducted in vitro experiment on mice osteoclastsapplying doses of 1 ◊ 10-9, 1 ◊ 10-8 and 1 ◊ 10-7 M. Inin vitro studies, the authors observed the advanta-geous effects of genistein revealed by the decreasedosteoclasts number and reduced RANKL/OPG ratio.The best results in in vitro experiment were observedat a dose of 1 ◊ 10-8 M. In spite of beneficial effectof genistein observed in in vitro study, the authorsdemonstrated that administering this isoflavone toovariectomized rats at a dose of 5 mg/kg for 4 weeksfails to show any beneficial influence on bones.What is more, the administration of this isoflavonecaused deterioration of some mechanical parameterse.g., maximal load in bones (49).
Another article focused on the effect of genis-tein on bone tissue in rats administered at low dosesfor long time period (5 months) also demonstratedthat this isoflavone does not improve the microar-chitecture of bones, regardless of the age of the ani-mals and whether they had progeny or not. Theauthors examined two doses administered orally ñ1.6 mg/kg and 3.2 mg/kg, and used three animalmodels: 3-month-old virgin rats, 12-month-oldretired breeder rats and 14-month-old retired breed-er rats. There were no statistically significantchanges observed in any of analyzed groups whichmight suggest that genistein shows beneficial effecton BMC, BMD or histomorphological parameters incortical and cancellous bone (50).
The above-mentioned examples of the effect ofgenistein on bone tissue, as well as the reports aboutpharmacokinetics of biochanin A may provide theexplanation of the reason why this isoflavoneadministered at a moderate dose (converted to aver-age dose taken by human) ñ 5 mg/kg for 4 weeks didnot show beneficial effect on skeletal system inovariectomized rats.
Biochanin A is one of the major constituents inred clover herb (Trifolii pratense herba). Studiesfocused on the effect of red clover extracts on osteo-porotically changed bone tissue in ovariectomizedrats proved that those extracts show beneficial effecton skeletal system (37, 51). Our previous study indi-
cated that formononetin, which is also present in redclover, also shows the advantageous effect on bonesin ovariectomized rats (32). However, Cegie≥a et al.concluded that the effect exerted by red clover is dif-ferent and more complex than the one of estradiolitself, thus it could be assumed that not onlyisoflavones act as a preventive agents, but other con-stituents may affect skeletal system in rats (37).
CONCLUSION
Due to the fact that the biological activity ofbiochanin A depends on many factors such asmetabolism and pharmacokinetics, it is very impor-tant to examine several doses of this substance. Inour research we conducted the test investigatingeffect of biochanin A on skeletal system of rats withovariectomy induced osteoporosis, using the dose,which can be assumed as moderate. This dose (5mg/kg p.o.) was converted into the dose that can beintake by human in dietary supplements available inpharmaceutical market.
The results obtained during studies indicatethat the administration of biochanin A at a dose of 5mg/kg p.o. for 4 weeks to ovariectomized rats caus-es neither improvement nor deterioration ofmechanical parameters of bones and their chemicalcomposition.
Acknowledgment
This study was supported by Grant No. KNW-1-043/K/3/0. The authors would like to thank thestaff of Department of Pharmacology (School ofPharmacy with The Division of LaboratoryMedicine, Medical University of Silesia) for makingthis study possible.
Conflict of interests
The authors state that they have no conflict ofinterests.
REFERENCES
1. ZgÛrka G.: J. AOAC Int. 94, 22 (2011). 2. Breikaa R.M., Algandaby M.M., El-Demerdash
E., Abdel-Naim A.B.: PLoS One 8, e69276(2013).
3. Sartorelli P., Carvalho C.S., Reim„o .J.Q.,Ferreira M.J., Tempone A.G.: Parasitol. Res.104, 311 (2009).
4. Zhang D.Y., Zu Y.G., Fu Y.J., Luo M., Gu C.B.et al.: Sep. Purif. Technol. 83, 91 (2011).

Biochanin A shows no effect on skeletal system in ovariectomized rats... 595
5. Tan J.W., Tham C.L., Israf D.A., Lee S.H., KimM.K.: Neurochem. Res. 38, 512 (2013).
6. Thors L., Burston J.J., Alter B.J., McKinneyM.K., Cravatt B.F. et al.: Br. J. Pharmacol. 160,549 (2010).
7. Chung M.J., Sohng J.K., Choi D.J., Park Y.I.:Life Sci. 93, 401 (2013).
8. Saviranta N.M.M., Veeroos L., Granlund L.J.,Hassinen V.H., Kaarniranta K., KarjalainenR.O. et al.: Food Res. Int. 44, 109 (2011).
9. Kole L., Giri B., Manna S.K., Pal B., Ghosh S.:Eur. J. Pharmacol. 653, 8 (2011).
10. Johnson T.L., Lai M.B., Lai J.C., Bhushan A.:Evid. Based Complement. Alternat. Med. 7, 351(2010).
11. Sehdev V., Lai J.C., Bhushan A.: J. Oncol.2009, 121458 (2009).
12. Seo Y.J., Kim B.S., Chun S.Y., Park Y.K.,Kang K.S., Kwon T.G.: J. Korean Med. Sci. 26,1489 (2011).
13. Szliszka E., Czuba Z.P., Mertas A., ParadyszA., Krol W.: Urol. Oncol. 31, 331 (2013).
14. Sithisarn P., Michaelis M., Schubert-ZsilaveczM., Cinatl J. Jr.: Antiviral Res. 97, 41 (2013).
15. Sklenickova O., Flesar J., Kokoska L., VlkovaE., Halamova K., Malik J.: Molecules 15, 1270(2010).
16. Lin V.C., Ding H.Y., Tsai P.C., Wu J.Y., LuY.H., Chang T.S.: Biosci. Biotechnol. Biochem.75, 914 (2011).
17. Breikaa R.M., Algandaby M.M., El-DemerdashE., Abdel-Naim A.B.: Biosci. Biotechnol.Biochem. 77, 909 (2013).
18. Harini R., Ezhumalai M., Pugalendi K.V.: Eur.J. Pharmacol. 676, 89 (2012).
19. Mishra P., Kale R.K., Kar A.: Mol. Cell.Biochem. 312, 1 (2008).
20. Moon Y.J., Shin B.S., An G., Morris M.E.:Pharm. Res. 25, 2158 (2008).
21. Kuhnle G.G.C., Vogiatzoglou A., Ward H.A.,Khaw K.T.: Proc. Nutr. Soc. 70 (OCE4), E254(2011).
22. Bijak M., Po≥aÊ I., Borowiecka M., Nowak P.,Stetkiewicz T., PertyÒski T. : Przegl.Menopauz. 6, 402 (2010) (Polish).
23. Atkinson C., Compston J.E., Day N.E., DowsettM., Bingham S.A.: Am. J. Clin. Nutr. 79, 326(2004).
24. Su S.J., Yeh Y.T., Su S.H., Chang K.L., ShyuH.W. et al.: Evid. Based Complement. Alternat.Med. 2013, 846039 (2013).
25. Su S.J, Yeh Y.T., Shyu H.W.: Evid. BasedComplement. Alternat. Med. 2013, 594857(2013).
26. van Hunsel F.P., Kampschˆer P.: Ned. Tijdschr.Geneeskd. 156, A5095 (2012).
27. Unfer V., Casini M.L., Costabile L., MignosaM., Gerli S., Di Renzo G.C.: Fertil. Steril. 82,145 (2004).
28. Chandrareddy A., Muneyyirci-Delale O.,McFarlane S.I., Murad O.M.: Complement.Ther. Clin. Pract. 14, 132 (2008).
29. St¸rmer E.K., Seidlov·-Wuttke D., SehmischS., Rack T., Wille J. et al.: J. Bone Miner. Res.21, 89 (2006).
30. Folwarczna J., Pytlik M., Zych M., Cegie≥a U.,Kaczmarczyk-Sedlak I. et al.: Mol. Nutr. FoodRes. 57, 1772 (2013).
31. Kaczmarczyk-Sedlak I., Janiec W., Pytlik M.,åliwiÒski L., Folwarczna J. et al.: Pharmacol.Rep. 57, 203 (2005).
32. Kaczmarczyk-Sedlak I., Wojnar W., Zych M.,Ozimina-KamiÒska E., Taranowicz J., SiwekA.: Evid. Based Complement. Alternat. Med.2013, 457052 (2013).
33. Burger H.G., Hale G.E., Robertson D.M.,Dennerstein L.: Hum. Reprod. Update 13, 559(2007).
34. Seeman E.: Curr. Osteoporos. Rep. 2, 90(2004).
35. Kalu D.N.: Bone Miner. 15, 175 (1991). 36. Folwarczna J., Zych M., Burczyk J., Trzeciak
H., Trzeciak H.I.: Planta Med. 75, 1567 (2009). 37. Cegie≥a U., Folwarczna J., Pytlik M., ZgÛrka
G.: Evid. Based Complement. Alternat. Med.2012, 921684 (2012).
38. Rossouw J.E., Anderson G.L., Prentice R.L.,LaCroix A.Z., Kooperberg C. et al.: J. Am.Med. Assoc. 288, 321 (2002).
39. Bowring C.E., Francis R.M.: Menopause Int.17, 63 (2011).
40. Leclercq G., de Cremoux P., This P., JacquotY.: Maturitas 68, 56 (2011).
41. DÍbski R., Paszkowski T., PertyÒski T.,ZgliczyÒski W.: Przegl. Menopauz. 3, 189(2013).
42. Pytlik M., Cegie≥a U., Folwarczna J., NowiÒskaB.: Pharmacol. Rep. 64, 625 (2012).
43. Batterham T.J., Shutt D.A., Hart N.K., BradenA.W.H., Tweedale H.J.: Aust. J. Agric. Res. 22,131 (1971).
44. Tolleson W.H., Doerge D.R., Churchwell M.I.,Marques M.M., Roberts D.W.: J. Agric. FoodChem. 50, 4783 (2002).
45. Moon Y.J., Sagawa K., Frederick K., Zhang S.,Morris M.E.: AAPS J. 8, E433 (2006).
46. Singh S.P., Wahajuddin Ali M.M., Jain G.K.: J.Sep. Sci. 33, 3326 (2010).

596 ILONA KACZMARCZYK-SEDLAK et al.
47. Wang Z.L., Sun J.Y., Wang D.N., Xie Y.H.,Wang S.W., Zhao W.M.: Phytomedicine 13,718 (2006).
48. Bitto A., Burnett B.P., Polito F., Marini H.,Levy R.M. et al.: Br. J. Pharmacol. 155, 896(2008).
49. åliwiÒski L., Folwarczna J., NowiÒska B.,Cegie≥a U., Pytlik M. et al.: Acta Biochim. Pol.56, 261 (2009).
50. Turner R.T., Iwaniec U.T., Andrade J.E.,Branscum A.J., Neese S.L. et al.: Menopause20, 677 (2013).
51. Occhiuto F., Pasquale R.D., Guglielmo G.,Palumbo D.R., Zangla G. et al.: Phytother. Res.21, 130 (2007).
Received: 12. 05. 2014

Acta Poloniae Pharmaceutica ñ Drug Research, Vol. 72 No. 3 pp. 597ñ606, 2015 ISSN 0001-6837Polish Pharmaceutical Society
Second-generation antipsychotics are beingused more often than ever before in children andadolescents with both psychotic disorders and awide range of non-psychotic disorders. Severalsecond-generation antipsychotics have receivedregulatory approval for some pediatric indicationsin various countries, but off-label use is still fre-quent (1).
Aripiprazole (Abilify) is an atypical antipsy-chotic partial agonist at dopamine D2 and 5-HT1A
receptors and is an agonist at 5-HT2 receptors. It hasbeen described as a dopamine system stabilizer as,in high levels of dopamine production, it will act asan antagonist; and where dopamine activity is low,it will act as an agonist (2).
In Denmark, aripiprazole (Abilify) is licensedfor treatment of schizophrenia, and treatment andprevention of recurrence of mania only for adults. In
the USA, it was licensed by the Food and DrugAdministration (FDA) in 2002 for the treatment ofsymptoms associated with autistic spectrum disor-ders in children and adolescents.
Although in Denmark, treatment of childrenand adolescents with Abilify is, as in many otherEuropean countries, as off-label use, this secondgeneration, atypical antipsychotic is widely used inthe treatment of psychiatric conditions in childrenand adolescents.
Starting around 2008, the Child andAdolescent Psychiatric Clinic 1 in Roskilde has usedAbilify more widely and has gathered experiencewith it.
After five years of prescribing Abilify for chil-dren and adolescents, the authors have decided toshare their experience and to describe patients whohave undergone treatment with Abilify.
CLINICAL EXPERIENCE OF LONG-TERM TREATMENT WITH ARIPIPRAZOLE (ABILIFY) IN CHILDREN AND ADOLESCENTS
AT THE CHILD AND ADOLESCENT PSYCHIATRIC CLINIC 1 IN ROSKILDE, DENMARK
BEATA DIOMäINA1,2*, PERNILLE DARLING RASMUSSEN3 and VITA DANILEVI»I�T�4
1Clinic of Psychiatry, Medical Faculty, Vilnius University, Lithuania2Child and Adolescent Psychiatric Clinic 1 in Roskilde, Region Zealand, Denmark
3Child and Adolescent Psychiatric Clinic in Holbaek, Region Zealand, Denmark4Clinic of Psychiatry, Medical Faculty, Vilnius University, Lithuania
Abstract: The aim of this paper is to share the clinical experience of the treatment of aripiprazole (Abilify) inchildren and adolescents. The authors have done a cross-sectional study about Abilifyís treatment in childrenand adolescents with severe conduct problems (high impulsivity, aggression, outward reaction, physical cross-border behavior), high restlessness with ADHD, psychotic and psychosis-like symptoms with autistic disorders,psychosis, and intensive tics with Touretteís syndrome. The authors studied and described patients at the Childand Adolescent Psychiatric Clinic 1 in Roskilde, Denmark, who were treated with Abilify and were patients ofthe clinic in June 2013. The target group consisted of 33 patients, aged 9-18 years, which were in Abilify treat-ment during this time. Indications for the treatment and effectiveness of Abilify, Abilifyís common doses usedin children and adolescents, and the most common adverse effects of Abilify are presented. Abilify was found to be effective, well tolerated and safe for children and adolescents. The dose depends on thecomplexity of diagnosis (higher doses used in cases of complex diagnosis), on the age (higher doses used inolder children, but only in the case of noncomplex diagnoses). Statistical analysis shows that in cases of com-plex diagnoses, dosage does not depend on age but depends on other factors. It also shows that the effect oftreatment is better for those who did not gain weight.
Keywords: Abilify, conduct disorder, autism
597
* Corresponding author: [email protected]; phone: +45 51 43 96 48 and +37069815218; fax: +45 46 32 30 51; postal address: LilleStrandvej 12 A, 3.th 2900 Hellerup, Denmark

598 BEATA DIOMäINA et al.
The aim of our study is to share the clinicalexperience of the treatment of children and adoles-cents with Abilify.
MATERIALS AND METHODS
The authors have made a cross-sectional studyabout Abilifyís treatment in children and adoles-cents. The authors have studied and describedpatients at the Child and Adolescent PsychiatricClinic 1 in Roskilde, Denmark, who have tried treat-
ment of Abilify and were patients of the clinic inJune 2013. The patients received outpatient treat-ment at the clinic.
Most of the patients were still in treatment withAbilify at this point in time, but some of them havestopped Abilify treatment for different reasons (inef-fectiveness of the treatment or unacceptable adverseeffects).
Most of them started Abilify in the clinic, butsome of them started the treatment in other placesand later were referred to the clinic. Patients who
Figure 1. Age distribution in the study group
Figure 2. Age and gender distribution in the study group

Clinical experience of long-term treatment with aripiprazole (Abilify) in... 599
received Abilify in the clinic starting in August2008, but were discharged from the clinic at the startof June 2013, are not included in this study.
Another patient is not included in the groupbecause of a short duration of the treatment (onlyone week). The treatment was interrupted becauseof intolerable adverse effects in the form of akathisia(the boy suffered inner restlessness, inability to sitstill, and remained motionless); the dose and effectwere not assessed.
Indications for starting Abilifyís treatment forpatients were the following: ● severe conduct problems (high impulsivity,
aggression, outward reaction, physical cross-bor-der behavior) with autistic disorder and ADHD;
● high restlessness with ADHD; ● intensive anxiety symptoms with autistic disor-
der; ● psychotic and psychosis-like symptoms with
autistic disorders; ● psychosis; ● intensive tics with Touretteís syndrome.
The patients in the study group were dividedinto two subgroups: one of them was noncomplex
and included patients diagnosed with ADHD, and theother group was complex and included patients withpervasive developmental disorders and psychosis,and patients who had two and more diagnoses.
The study group consisted of 33 children andadolescent psychiatric patients, 7 girls and 26 boysin ages 9-18, which have attended the Child andAdolescent Psychiatric Clinic 1 in Roskilde fromAugust 2008 until June 2013, and have been in treat-ment with Abilify at least four weeks or longer (thelongest period being almost five years).
Patients undergoing Abilify treatment weremonitored with clinical psychiatric examinations withtheir parents. Physical examinations included weightcontrol, blood pressure, blood tests, and EKG bothbefore treatment and after, at approximately fourweeks, six months, one year, and later once yearly.
Effectiveness of treatment for the psychiatricsymptoms was assessed with only verbal reportsfrom children and their parents about the childísfunctioning in school, at home, with peer groups,etc. Some of the adverse effects such as fatigue,akathisia, and increased appetite were also evaluat-ed with only verbal reports from children and theirparents. However, other possible adverse effectssuch as increased levels of cholesterol and prolactinwere monitored with blood tests, along with othercriteria (red and white blood cells, electrolytes bal-ance, liver function tests, cholesterol and prolactinlevel). Weight gain as an effect of increased appetitewas monitored with weight controls.
Finally, based on the data thus acquired, statis-tical analysis was performed. The following statisti-cal methods were used: descriptive statistics(Figures 1-4, frequency tables 1-5) and inferentialstatistics (two independent samples t-test, Spearmanrank correlation coefficient, Mann-Whitney U-test.Statistical package SPSS 21.0 was used for dataprocessing).
Limitations
1. This study was not designed as a clinical trial,but rather a sharing of real, long-term, clinicalexperience.
2. The severity of symptoms and the effect ofAbilify were not measured with any scale
Table 1. Diagnosis of the patients.
Diagnosis Numberof cases
Attention deficit hyperactivity disorder 28
Pervasive developmental disorders 13
Psychotic disorders 2
Touretteís syndrome 7
Attention deficit disorder 1
Anxiety disorders 2
Obsessive compulsive disorder 1
Adaptation disorder 1
Mental retardation 4
Inferioritas intellectualis 1
Other disorder of psychological development
1
Attachment disorder 1
Other tics disorder 1
Table 2. The mean daily dosage of aripiprazole in cases of complex and noncomplex diagnosis.
Complexity Number of Mean daily Standardof diagnose patients dosage [mg] deviation
Noncomplex 11 1.75 1.30
Complex 22 6.27 3.34

600 BEATA DIOMäINA et al.
before or after the start of the treatment, butonly with subjective reports about the effects onthe symptoms from parents or patients.
3. Most of the patients have been in combinedtreatment, and in addition to Abilify, have beenon the most common ADHD medicines such asmethylphenidat and atomoxetin. Some of thepatients have been on sertralin for anxiety anddepression, and some of them on melatonin forsleep difficulty. Combined treatments were nottaken into account.
4. Small sample size, considering number of vari-ables in the study, which was not beneficent forusing more sophisticated statistical methods,such like multiple regression analysis.
RESULTS
Description of the study group
Patientsí psychopathologyThe patients have been diagnosed with atten-
tion deficit and hyperactivity disorder (ADHD), per-vasive developmental disorders, psychotic disor-ders, Touretteís syndrome, other tics disorder, anxi-ety disorders, adaptations disorder, mental retarda-tion, attachment disorders, inferioritas intelectuallis,other disorder of psychological developmental.
But only 11 patients from the study group havebeen diagnosed with only one diagnose ADHD (F90.0 or F 90.1), and most of the patients (22 patientsor 70% of the patients) have been diagnosed withmore complex psychiatric disorders such as perva-sive developmental disorders or psychotic disorders,or they had ADHD in addition to other disorderssuch as Tourretteís syndrome, attachment disorder,mental retardation, anxiety disorder or other disor-der of psychological development so their psy-
chopathology is more complex. Later, the group wasdivided into subgroups of complex diagnosis and asubgroup of noncomplex diagnosis.
Age and gender of patients are given in Figures1 and 2.
Doses usedThe mean daily dosage of aripiprazole in the
study group was 4.65 mg, standard deviation 3.52, aminimum dosage 0.25 mg and maximum dosage of12.5 mg.
The mean daily dosage of aripiprazole in casesof complex diagnosis was 6.27 mg, standard devia-tion 3.34 and in cases of noncomplex diagnosis was1.75 mg, standard deviation 1.30.
Tolerability, adverse effects and effectiveness of thetreatment
There were 14 patients who had no adverseeffects. Another 19 patients had such adverse effectsas a fatigue, little tremor of hands in the start oftreatment, increased appetite with weight gain,hyperprolactinemia.
There were six (18%) patients who complainedof fatigue, and five of them (15%) had fatigue as atransient adverse effect. But in one case, fatigue wasvery bothersome and lasted as long as the boy wasin treatment. There was, however, a positive effecton his impulsiveness and his intensive anxietysymptoms, but after five weeks the treatment wasinterrupted, because the boy was almost always tiredand sleepy, making it impossible for him to functionoptimally.
Increased appetite with following weight gainwas observed in 14 patients (42%). Increasedappetite is a very serious adverse effect, and oftenfor young people it becomes impossible to continuethe treatment. Therefore, treatment was interruptedbecause of this adverse effect in 6 patients (18%).
Hyperprolactinemia was observed in only onepatient. Unfortunately, the patient did not collabo-rate with a physician to have a blood test, and theboy developed gynecomastia - an obvious symptom
Table 3. Adverse effects of Abilify in the study group.
Adverse effectNumber
of patients
Only transient fatigue 3
Little tremor of hands in the start of treatment
1
Bothersome fatigue 1
Increase appetite with weight gain 11
Increase appetite with weight gain and transient fatigue
2
Hyperprolactinemia and increaseappetite with weight gain
1
No adverse effect 14
Table 4. Adverse effects as a reason to interrupt the treatment.
Adverse effectNumber
of patients
Bothersome fatigue 1 (3)
Increased appetite with weight gain
6 (18)
Hyperprolactinemia, increased appetite with weight gain
1 (3)

Clinical experience of long-term treatment with aripiprazole (Abilify) in... 601
of hyperprolactinemia. His treatment was interrupt-ed because of hyperprolactinemia and increasedappetite.
The treatment was interrupted because ofadverse effects in eight patients (24%).
However, there were 14 patients (42%) whohad no adverse effects. If we put them together withother three patients (9%) who had transient fatigueand one patient (3%) who had little tremor of handsin the start of treatment, we can see that 18 patientscould tolerate Abilify treatment and they had noadverse effect or only a very slight adverse effects.The largest part of the patients had good tolerabilityof Abilify (54%).
To defend Abilify as a safe antipsychotic med-icine, it is necessary to point out that no Abilify-
treated patient developed dyslipidemia, no patienthad a cardiac adverse effect.
Of the patients treated, 21 (64%) had a positiveeffect, eight (24%) had some effect, only three (9%)did not have an effect, and only one (3%) had a neg-ative effect of treatment (the patient reported deteri-oration of tics caused by Abilify).
Analyses of data Correlations of the treatmentís effect with used
dosage, complexity of diagnosis, age, weight andweight gain were analyzed.
The authors also tried to analyze the factorsthat determined the doses. Are patientsí age andweight or complexity of psychopathology the maindetermining factors for the choice of dose?
Figure 3. Doses used in the study group
Figure 4. Tolerability of the treatment in the study group

602 BEATA DIOMäINA et al.T
able
5. D
iagn
osis
, age
s, g
ende
rs o
f th
e pa
tient
s, d
oses
use
d, a
nd e
ffec
ts o
f th
e tr
eatm
ent i
n th
e st
udy
grou
p.
Still
in tr
eatm
ent (
blan
k)N
o.
Com
plex
ity o
f D
iagn
osis
D
oses
Eff
ect
Age
G
ende
rA
dver
se e
ffec
ts
or r
easo
n of
inte
rrup
tion
of
psyc
hopa
thol
ogy
[mg]
tr
eatm
ent
11
F 84
.510
++11
GFa
tigue
21
F 90
.0 F
84.
06
+11
BW
eigh
t gai
n, in
crea
sed
ap
petit
e, f
atig
ue
31
F 20
.910
++10
BW
eigh
t gai
n, in
crea
sed
appe
tite,
fat
igue
41
F 90
.0 F
84.
55
++17
GFa
tigue
50
F 90
.00.
25++
9G
no
61
F 90
.0 F
70
F 43
.23
10++
18B
no
71
F 90
.1 F
84.
03
+9
Bno
80
F 90
.02.
5+
12B
Wei
ght g
ain,
Inte
rrup
ted
wei
ght g
ain
incr
ease
d ap
petit
e
Litt
le tr
emor
of
hand
s9
1F
90.1
F 8
4.5
5++
15B
in th
e st
art o
f tr
eatm
ent
100
F 90
.01
+10
Bno
110
F 90
.11
++9
Bno
120
F 90
.0 F
95.
82.
5-
14B
Wei
ght g
ain,
Inte
rrup
ted
wei
ght g
ain
incr
ease
d ap
petit
ein
effe
ctiv
enes
s of
trea
tmen
t
131
F 84
.0 F
42.
0 F
90.0
50
13B
Wei
ght g
ain,
Inte
rrup
ted
wei
ght g
ain
incr
ease
d ap
petit
ein
effe
ctiv
enes
s of
trea
tmen
t
140
F 90
.02
++14
GW
eigh
t gai
n,in
crea
sed
appe
tite
Inte
rrup
ted
wei
ght g
ain
150
F 90
.01
+11
BW
eigh
t gai
n,in
crea
sed
appe
tite
161
F 90
.0 F
95.
2 F
84.5
F 41
.1 F
40.
2 12
.5++
9B
no
171
F 90
.0 F
84.
12.
5++
12B
St
rong
ann
oyin
g fa
tigue
Inte
rrup
ted
fatig
ue
181
F 90
.1 F
88
5+
14B
Wei
ght g
ain,
incr
ease
d ap
petit
e In
terr
upte
d w
eigh
t gai
n

Clinical experience of long-term treatment with aripiprazole (Abilify) in... 603
Tab
le 5
. con
t.
Still
in tr
eatm
ent (
blan
k)N
o.
Com
plex
ity o
f D
iagn
osis
D
oses
Eff
ect
Age
G
ende
rA
dver
se e
ffec
ts
or r
easo
n of
inte
rrup
tion
of
psyc
hopa
thol
ogy
[mg]
tr
eatm
ent
191
F 98
.8 F
95.
.22.
5++
17B
no
201
F 90
.0 F
60.
310
016
Gno
211
F 90
.0, F
84.
0.F
95.2
., F
705
++14
Bno
221
F 84
.0 F
90.
0 F
95.2
3+
9B
no
230
F 90
.01
++10
Bno
241
F 84
.8 F
90.
0 F
70.0
10++
15B
no
251
F 84
.0 F
90.
1 F
95.2
10++
12B
no
261
F 90
.0 F
71
0.5
++9
Bno
270
F 90
.01
++10
GFa
tigue
280
F 90
.15
++12
B
Wei
ght g
ain
incr
ease
d ap
petit
e
290
F 90
.01
++10
BW
eigh
t gai
n,in
crea
sed
appe
tite
301
F 90
.0, F
95.
27.
50
15B
Wei
ght g
ain,
Inte
rrup
ted
wei
ght g
ain
and
incr
ease
d ap
petit
e in
effe
ctiv
enes
s of
trea
tmen
t
311
F 28
, F 9
4.1
R 4
1.8
6++
11B
Wei
ght g
ain,
incr
ease
d ap
petit
e
321
F 84
.52
++13
GW
eigh
t gai
n in
crea
sed
appe
tite
Wei
ght g
ain
33
1 F
90.0
, F 9
5.2
F 70
7.
5 +
15
B
incr
ease
d ap
petit
e,
Inte
rrup
ted
wei
ght g
ain
and
hype
rpro
lact
inem
iahy
perp
rola
ctin
emia
++ p
ositi
ve e
ffec
t, +
som
e ef
fect
, 0 n
o ef
fect
, ñ n
egat
ive
effe
ct, B
= b
oy; G
= g
irl

604 BEATA DIOMäINA et al.
Statistical analyses of used doses show the follow-ing results:1. Dose depends on the complexity of diagnosis.
Higher doses are used in cases of complex diag-nosis. Independent sample t-test shows that themean dose is greater in cases of complex diag-noses (p < 0.001), standard deviation of dose isalso greater for complex diagnoses (p = 0.002).Mann-Whitney U-test confirms results of the t-test, p < 0.001 (see Table 2).
2. Dose depends on age. Higher doses are used inolder children. Spearman rank-correlation coef-ficient 0.42 shows that dose increases with anincrease of age, p = 0.015 (statistically signifi-cant relationship).After separate statistical analysis of cases ofcomplex diagnoses and noncomplex diagnoses,it appears that in cases of simple diagnoses, thedose depends almost exclusively on age (p <0.001, Spearman coefficient 0.88), but in casesof complex diagnoses, dose does not depend onage (p = 0.645, Spearman coefficient 0.11) . Itseems that dose depends on other factors.
3. Statistical analyses show that the effect of treat-ment is better for those who did not gain weight(p = 0.040, Spearman coefficient 0,11). There were 84% cases with good effect for those
who didnët gain weight; only 46% for those who did. It seems that no weight gain gives better com-
pliance and predicts a better result of the treatments.
DISCUSSION
As we mentioned before in the section of thelimitations of the study, our study was not designedas a clinical trial. However, we observed the patientsfor a longer period of treatment than is done in aclinical trial, which usually lasts several weeks.Some of our patients have been in Abilify treatmentfor almost five years. Therefore, the observation ofthe patients for a longer period of treatment could beconsidered an advantage of our study.
The indications for starting Abilifyís treatmentfor our patients have been similar as in other studies.In Ercanís study (3), there were: inattention, hyper-activity/impulsivity, delinquency, aggressive behav-ior, conduct disorder, oppositional defiant disorders.
In the study by Valicenti-McDermott andDemb (4), there were diagnoses within the autisticspectrum, mental retardation, attention-deficit/hyper-activity disorder/disruptive behavior disorders, mooddisorders, reactive attachment and sleep disorders.Target symptoms included aggression, hyperactivity,impulsivity, and self-injurious behaviors.
In the study of of Masi et al. (5), target symp-toms were Touretteís disorder and co-morbidADHD.
As one can see, in our study group of 33 chil-dren and adolescents aged 9-18 years, we observeda positive effect in 64% of the patients. These areapproximately the same results as in the studies byErcan et al. (3). They conducted a study to deter-mine the effectiveness and safety of aripiprazole inchildren and adolescents with both attentiondeficit/hyperactivity disorder and conduct disorder.In their eight-week, open-label study with 20 chil-dren and adolescents ranging in age 6-16 years theyobserved very much or much improvement withregard to inattention, hyperactivity/impulsivity,delinquency, aggressive behavior, conduct disorder,and oppositional defiant disorders in 63.1% of thepatients.
Valicenti-McDermott and Demb (4) observedmuch improvement in regard to target symptoms in56% of the patients in their study groups.
Results of a study by Findling et al. also sug-gest a clinically meaningful effect. Their study pro-vides valuable safety and tolerability informationregarding the long-term use of aripiprazole in thetreatment of pediatric patients with irritability asso-ciated with autistic disorder (6). Moyal et al. showeda positive effect of Abilify for irritability and onquality of life (3).
We would also like to emphasize that meandaily dose in our study group is much lower than inErcanís study (4.65 mg versus 8.55 mg).
Our results show that a higher dose is used inolder children, which is also described in the studyby Blumer et al. (8). Based on the results of the phar-macokinetic study, Blumer and colleagues (8) haveproposed following weight-based dosing for pedi-atric patients: 1 mg for patients < 25 kg, 2 mg forpatients between 25 and 50 kg, 5 mg for thosebetween 50 to 70 kg , and 10 mg for patients withweight greater than 70 kg. It seems that larger dosesfor older children can be a consequence of theirhigher weight.
We can also see that the mean dose is greater incases of complex diagnoses than in cases of non-complex diagnoses. It could appear very logical:older children and those with more severe pathologyneed a higher dose of medications. However, ourresults also show that in cases of noncomplex diag-noses, the dose depends almost exclusively on age;but in cases of complex diagnoses, dose does notdepend on age. It could be, that in cases of complexpsychopathology, clinical dose depends more on theseverity of pathology as well as on individual fac-

Clinical experience of long-term treatment with aripiprazole (Abilify) in... 605
tors. It is well known that factors influencing choiceof a treatment dose in a clinical situation can bemany, they are inter-related, sometimes not easilymeasured, and therefore more sophisticated experi-ments and more advanced statistical methods (suchlike regression analysis) are desirable in order toexplain treatment decisions of a physician.However, such methods require using considerablylarger patient samples and possibly other researchdesigns. This was not feasible in our situation.
In the studies of Ercan (3) and Masi et al. (5),no patient was excluded from the study because ofadverse drug effects, but in our group, 24% ofpatients interrupted treatment because of adverseeffects. We must take into account that there werepatients who received treatment much longer thatthe patients from Ercanís eight-week, open-labelstudy and Masiís 12-week open-label study.
Most studies report adverse effects fromAbilify in the form of weight gain, increasedappetite, fatigue, and tremors. We observed thesame adverse effects.
Valicenti-McDermott and Demb (4) reportadverse effects in 50% of the patients - almost thesame as our results, where we observed adverseeffects in 58% of the patients. As shown in theirstudy, mean body mass index (BMI) rose signifi-cantly from 22.5 to 24.1. This is one of the mostbothersome adverse effects, which complicatedtreatment with Abilify. In our study, increasedappetite was observed in 42% of the patients.
In our study, the effect of treatment is signifi-cantly better for those who did not gain weight. Itseems that no weight gain gives better complianceand predicts a better result of the treatments.
Many studies report that Abilify is a well toler-ated, effective medicine with minimum extrapyrami-dal effects (9). Abilify does not show any adverseeffect on QTc interval. Aripiprazole is not associatedwith increased prolactin or with dyslipidemia (10).
Our results show that there was only onepatient in the study group, who had little tremor ofhands in the start of treatment. During five years ofthe treatment, no Abilify-treated patient developeddyslipidemia, and only one patient developed pro-lactinemia. There were no patients who had a car-diac adverse effect.
Our experience and results should encourageclinicians to use Abilify in children and adolescents.
CONCLUSIONS
1. Abilify is found to be effective for child andadolescent psychiatric disorders (64% of the
patients had positive effects, and 21% of themhad some effects from the treatment).
2. Abilify is found to be well tolerated in childrenand adolescents. Fifty seven percent of thepatients could tolerate Abilify treatment, andthey did not have any side effects or had a veryslight adverse effect.
3. Abilify is found to be safe. No Abilify-treatedpatient developed dyslipidemia or a cardiacadverse effect. Hyperprolactinemia andakathisia are seldom adverse effects of Abilify.
4. Increased appetite and weight gain are the mostcommon adverse effects of Abilify. Increasedappetite and weight gain were observed in 42%of patients.
5. The dose depends on the complexity of diag-nosis and on the age. Higher doses are used incases of complex diagnosis. Higher doses areused for older children, but only in the case ofnoncomplex diagnoses. Statistical analysisshows that in cases of complex diagnoses,dosage does not depend on age.
6. Statistical analysis shows that the effect of treat-ment is better for those who did not gain weight.
Declaration of interest
The authors do not have any interests todeclare.
Acknowledgments
We acknowledge Raimundas VaitkeviËius,statistician from Klaip�da and Vytautas Magnusuniversities, Department of Psychology for perform-ing statistical analysis of the data and Proof-Reading-Service.com for providing language helpand proof reading the article.
REFERENCES
1. De Hert M., Dobbelaere M., Sheridanc E.M.,Cohend D., Correll C.U.: Eur Psychiatry 26,144 (2011).
2. Deb S., Farmah B.K., Arshad E., Deb T., RoyM., Unwin G.L.: Res. Dev. Disabil. 35, 711(2014).
3. Ercan E.S., Uysal T., Ercan E., Ard�c U.A.:Pharmacopsychiatry 45, 13 (2012).
4. Valicenti-McDermott M.R., Demb H.: J. Child.Adolesc. Psychopharmacol. 16, 549 (2006).
5. Masi G., Gagliano A., Siracusano R., BerloffaS., Calarese T. et al.: J. Child. Adolesc. Psycho-pharmacol. 22, 120 (2012).

606 BEATA DIOMäINA et al.
6. Findling R.L., Mankoski R., Timko K. et al.:59th Annual Meeting of the AACAP, SanFrancisco, CA, October 23-28, 2012.
7. Moyal W.N., Lord C., Walkup J.T.: Paediatr.Drugs 16, 123 (2014)
8. Blumer J.L., Findling R., Kauffman R. et al.:Clin. Pharmacol. Ther. 71, MPI-3 (2002).
9. Han M., Huang X-F., Deng C.: Int. J.Neuropsychopharmacol. 12, 941 (2009).
10. Kumar A., Datta S.S., Wright S.D., FurtadoV.A., Russell P.S.: Cochrane Database SystRev. 2013 Oct 15; 10: CD009582. doi: 10.1002/14651858.pub.2
11. Sochocky N., Milin R.: Curr. Clin. Pharmacol.8, 370 (2013).
Received: 16. 05. 2014

Acta Poloniae Pharmaceutica ñ Drug Research, Vol. 72 No. 3 pp. 607ñ614, 2015 ISSN 0001-6837Polish Pharmaceutical Society
There is a general belief amongst the con-sumers all over the world that herbal drugs arealways safe because they are natural or near tonature but evidence suggests otherwise. In Pakistan,traditional healers (Hakims/Tabibs) are registeredby the government under an Act of the Parliamentbut there is no regulatory control on the manufac-ture, sale, distribution etc. of traditional medicines(1). Requirements and methods for research andevaluation of the safety and efficacy of herbal med-icines are more complex than those for convention-al pharmaceuticals. A single medicinal plant maycontain hundreds of natural constituents, and amixed herbal medicinal product may contain sever-al times that number. If every active ingredientwould be isolated from every herb, the time and
resources required would be tremendous. Such ananalysis may actually be impossible in practice, par-ticularly in the case of mixed herbal medicines (2).Female and male have different body compositions.The body fate percentage is larger and the bodywater content is smaller in female. Furthermore,these differences are age dependent, with body fateincreasing in both genders with age. Body fat com-position may affect the volume of distribution ofmany drugs. For lipophilic drugs such as opioidsand benzodiazepines, the volume of distribution perkg body weight generally will be higher in femalesthan in males. Conversely, the volume of distribu-tion for water soluble drugs such as muscle relaxantmay be lower in females than in males. Thus thesame dose per kg body weight will result in a lower
GENERAL
RATIONALIZED AND COMPLEMENTARY FINDINGS OF SILYMARIN (MILK THISTLE) IN PAKISTANI HEALTHY VOLUNTEERS
MUHAMMAD ASHRAF1, FARAH ABID1,2, SUALEHA RIFFAT3, SAJID BASHIR4, JAVED IQBAL2,MUHAMMAD SARFRAZ5*, ATTIA AFZAL6* and MUHAMMAD ZAHEER7
1Department of Pharmacology and Toxicology, University of Veterinary and Animal Sciences (UVAS),Lahore, Pakistan
2Department of Pharmacy, The University of Lahore, Lahore, Pakistan3Bioequivalence Study (BeSt) Centre, Institute of Pharmaceutical Sciences, University of Veterinary and Animal Sciences (UVAS), Lahore, Pakistan.
4Department of Pharmacy, University of Sargodha, Sargodha, Pakistan5School of Pharmacy, Tongji Medical College, Huazhong University of Science and Technology (HUST),
Wuhan, China6School of Pharmacy, China Pharmaceutical University (CPU), Nanjing, China
7Pakistan Council of Scientific and Industrial Research (PCSIR) Laboratories, Lahore, Pakistan
Abstract: The aim of the work was to examine the influence of gender on pharmacokinetics of silymarin; abasic constituent of medicinal herb ìmilk thistleî (Silybum marianum). The presented work is the extension ofpublished work of Usman et al. (16). The comparative parallel design pharmacokinetic study was conducted inPakistani healthy volunteers (male and female) receiving a single 200 mg oral dose of silymarin. Sixteen sub-jects (8 males and 8 females) were enrolled and completed the 12 h study. Blood screening was done on HPLCand the pharmacokinetic parameters were calculated by APO, 3.2 Ver. software using non-compartmental andtwo compartment model approaches. A significant difference (p < 0.05) was observed in almost all calculatedpharmacokinetic parameters of silymarin in male and female. Clinically, the silymarin has been underestimat-ed in the previous study. Gender based clinical investigations should be directed in the future on other flavono-lignans of ëmilk thistleí as well.
Keywords: gender-based pharmacokinetics, milk thistle, parallel design, silymarin, two compartment model
607
* Corresponding author: e-mail:[email protected]; phone: 86-27-83692793, 86-13437294800; fax: 86-27-83692762; e-mail: [email protected]; phone: 86-55-35738200; fax: 86-55-35738200
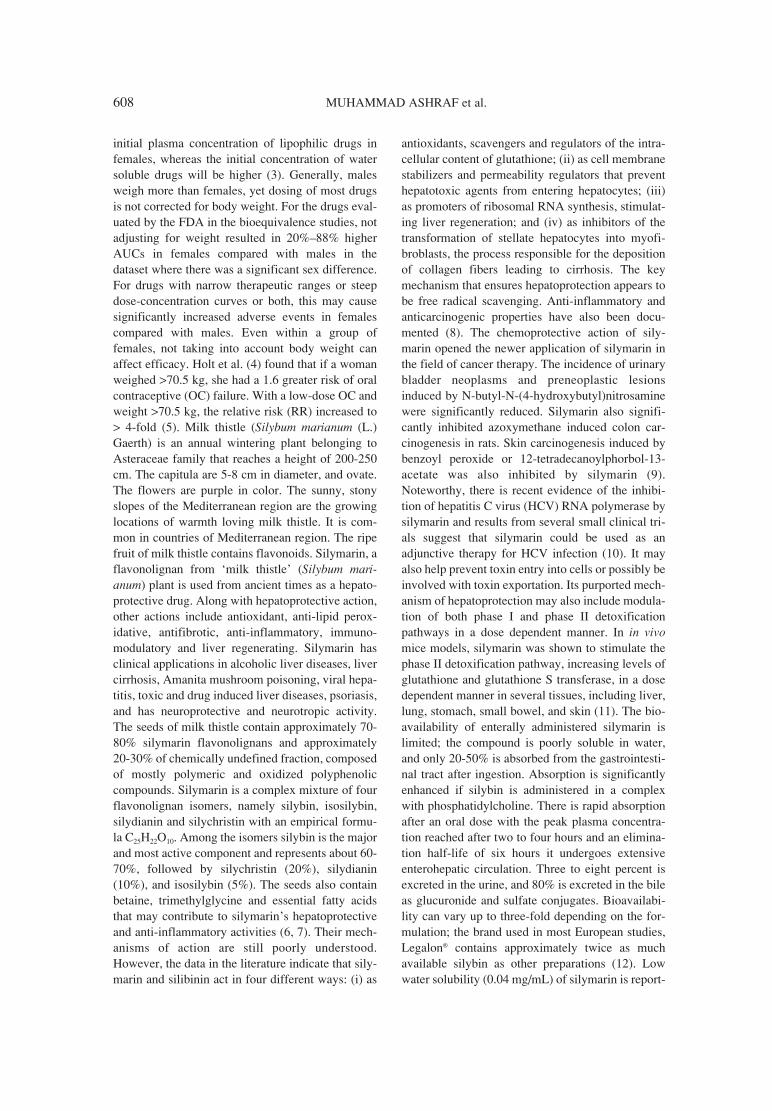
608 MUHAMMAD ASHRAF et al.
initial plasma concentration of lipophilic drugs infemales, whereas the initial concentration of watersoluble drugs will be higher (3). Generally, malesweigh more than females, yet dosing of most drugsis not corrected for body weight. For the drugs eval-uated by the FDA in the bioequivalence studies, notadjusting for weight resulted in 20%ñ88% higherAUCs in females compared with males in thedataset where there was a significant sex difference.For drugs with narrow therapeutic ranges or steepdose-concentration curves or both, this may causesignificantly increased adverse events in femalescompared with males. Even within a group offemales, not taking into account body weight canaffect efficacy. Holt et al. (4) found that if a womanweighed >70.5 kg, she had a 1.6 greater risk of oralcontraceptive (OC) failure. With a low-dose OC andweight >70.5 kg, the relative risk (RR) increased to> 4-fold (5). Milk thistle (Silybum marianum (L.)Gaerth) is an annual wintering plant belonging toAsteraceae family that reaches a height of 200-250cm. The capitula are 5-8 cm in diameter, and ovate.The flowers are purple in color. The sunny, stonyslopes of the Mediterranean region are the growinglocations of warmth loving milk thistle. It is com-mon in countries of Mediterranean region. The ripefruit of milk thistle contains flavonoids. Silymarin, aflavonolignan from ëmilk thistleí (Silybum mari-anum) plant is used from ancient times as a hepato-protective drug. Along with hepatoprotective action,other actions include antioxidant, anti-lipid perox-idative, antifibrotic, anti-inflammatory, immuno-modulatory and liver regenerating. Silymarin hasclinical applications in alcoholic liver diseases, livercirrhosis, Amanita mushroom poisoning, viral hepa-titis, toxic and drug induced liver diseases, psoriasis,and has neuroprotective and neurotropic activity.The seeds of milk thistle contain approximately 70-80% silymarin flavonolignans and approximately20-30% of chemically undefined fraction, composedof mostly polymeric and oxidized polyphenoliccompounds. Silymarin is a complex mixture of fourflavonolignan isomers, namely silybin, isosilybin,silydianin and silychristin with an empirical formu-la C25H22O10. Among the isomers silybin is the majorand most active component and represents about 60-70%, followed by silychristin (20%), silydianin(10%), and isosilybin (5%). The seeds also containbetaine, trimethylglycine and essential fatty acidsthat may contribute to silymarinís hepatoprotectiveand anti-inflammatory activities (6, 7). Their mech-anisms of action are still poorly understood.However, the data in the literature indicate that sily-marin and silibinin act in four different ways: (i) as
antioxidants, scavengers and regulators of the intra-cellular content of glutathione; (ii) as cell membranestabilizers and permeability regulators that preventhepatotoxic agents from entering hepatocytes; (iii)as promoters of ribosomal RNA synthesis, stimulat-ing liver regeneration; and (iv) as inhibitors of thetransformation of stellate hepatocytes into myofi-broblasts, the process responsible for the depositionof collagen fibers leading to cirrhosis. The keymechanism that ensures hepatoprotection appears tobe free radical scavenging. Anti-inflammatory andanticarcinogenic properties have also been docu-mented (8). The chemoprotective action of sily-marin opened the newer application of silymarin inthe field of cancer therapy. The incidence of urinarybladder neoplasms and preneoplastic lesionsinduced by N-butyl-N-(4-hydroxybutyl)nitrosaminewere significantly reduced. Silymarin also signifi-cantly inhibited azoxymethane induced colon car-cinogenesis in rats. Skin carcinogenesis induced bybenzoyl peroxide or 12-tetradecanoylphorbol-13-acetate was also inhibited by silymarin (9).Noteworthy, there is recent evidence of the inhibi-tion of hepatitis C virus (HCV) RNA polymerase bysilymarin and results from several small clinical tri-als suggest that silymarin could be used as anadjunctive therapy for HCV infection (10). It mayalso help prevent toxin entry into cells or possibly beinvolved with toxin exportation. Its purported mech-anism of hepatoprotection may also include modula-tion of both phase I and phase II detoxificationpathways in a dose dependent manner. In in vivomice models, silymarin was shown to stimulate thephase II detoxification pathway, increasing levels ofglutathione and glutathione S transferase, in a dosedependent manner in several tissues, including liver,lung, stomach, small bowel, and skin (11). The bio-availability of enterally administered silymarin islimited; the compound is poorly soluble in water,and only 20-50% is absorbed from the gastrointesti-nal tract after ingestion. Absorption is significantlyenhanced if silybin is administered in a complexwith phosphatidylcholine. There is rapid absorptionafter an oral dose with the peak plasma concentra-tion reached after two to four hours and an elimina-tion half-life of six hours it undergoes extensiveenterohepatic circulation. Three to eight percent isexcreted in the urine, and 80% is excreted in the bileas glucuronide and sulfate conjugates. Bioavailabi-lity can vary up to three-fold depending on the for-mulation; the brand used in most European studies,LegalonÆ contains approximately twice as muchavailable silybin as other preparations (12). Lowwater solubility (0.04 mg/mL) of silymarin is report-

Rationalized and complementary findings of silymarin... 609
ed. Solubility of silymarin in various other solventslike transcutol, ethanol, polysorbate 20, and glyc-erylmonooleate is 350.1, 225.2, 131.3 and 33.2mg/mL, respectively. Silymarin possesses nolipophilic properties, even though its water solubili-ty is poor (13). Apart from the role the physicianshave to play in safeguarding the public health, phar-macistís interventions in the appropriate use ofherbal medicines are necessary to make the overallhealth delivery system safe and effective.Pharmacists should therefore be knowledgeableabout the medicinal plants, herbal therapies andother herbal based dietary supplements in view oftheir increasing popularity and utilization so as to beable to provide objective information to the con-sumers (1, 14). Major activity of Food and DrugAdministration (FDA) Office of Womenís Health(OWH) is ensuring the development of consistentregulatory policies relating to the participation ofwomen in clinical trials, and analysis of the data todetect gender differences. Whenever appropriate,OWH ensures that this information is incorporatedinto product labeling (15). The presented work is theextension of Usman et al. study (16). In the previouswork, pharmacokinetic study was conducted only onmale. In the present work, both the gender, male andfemale, were included in the study to encompass anydifference in pharmacokinetics of silymarin due togender variation.
MATERIALS AND METHODS
Materials
Silymarin standard (98%, HPLC) was provid-ed by Abbot Pharmaceuticals Pvt. Ltd. Karachi,Pakistan. Methanol (96%, HPLC), potassium dihy-drogen phosphate (98%, analytical) and phosphoricacid (85%, analytical) were obtained from Merck,Germany. Silymarin 200 mg tablets manufacturedby Abbott Pharmaceuticals Pvt. Ltd. Karachi,Pakistan were purchased from the local market. Allreagents and solutions throughout the research wereprepared in fresh stock (not older than one week) ofdistilled water.
Instruments
Water was distilled by Water DistillationApparatus (Kˆttermann). The pH of distilled waterwas confirmed via Cyber Scan pH meter before andafter use. The analysis was carried out using HPLC(Shimadzu LC.9, CSW 32 Ver. 1.3 Software, Japan)equipped with a degasser, quaternary pump, manualsampler and a UV detector (Shimadzu SPD-6AV)connected to data collection system.
Chromatographic conditions
The analytical column was a Brownlee MPLC5 µm (220 ◊ 4.6 mm, pore size 80 �) with packingC18 (RP18, ODS, Octadecyl) from Perkin Elmer,maintained at ambient room temperature. Theextraction and emission wavelength were adjusted at288 nm.
Preparation of mobile phase
The mobile phase was prepared by dissolving2.72 g of potassium dihydrogen phosphate inmethanol quantity sufficient to make final volume of1 L with pH 2.8 adjusted with phosphoric acid andfiltered through 0.45 µm membrane filter prior touse.
Preparation of standard and working solutions
Working solutions were prepared in mobilephase by 0.3, 0.6, 1.25, 2.5, 5 and 10 µg/mL dilu-tions. A stock solution of silymarin standard wasprepared freshly by dissolving 50 mg drug in 50 mLof methanol to give a final concentration of 1mg/mL.
Extraction method
The extraction procedure and other factorswere kept constant to see the influence of genderonly on pharmacokinetics of silymarin. A hundredmilliliters of human blood sample was collectedfrom blood bank of UVAS. The plasma was sepa-rated from blood by centrifugation (17). The extrac-tion procedure was carried out as described byUsman et al. (16). Briefly, 100 µL of acetate bufferat pH 5.6 and glucuronidase type HP-2 (30 µL)(Helix pomatia, Merck, Germany, 127300 units/mL)were added to a 100 µL of plasma sample and thismixtures were incubated at 370C for 2 h with peri-odical shaking. Then, 200 µL of borate buffer (pH8.5) and 2 mL of diethyl ether were added to themixture. The mixture was vortexed for 1 min andcentrifuged at 3000 rpm for 2 min. Then, organicphase was transferred into a sample test tube andevaporated under nitrogen steam. The residue wasreconstituted in a 130 µL aliquot of the mobilephase, vortexed for 30 s and centrifuged for 1 min at2500 rpm, and then 100 µL of the solution wasinjected directly into the chromatographic system.The same extraction method was implemented onblood samples of the test subjects.
Subjects and materials
Sixteen healthy Pakistani volunteers (8 maleand 8 female) ranging from 18 to 45 years andfrom 50 to 80 kg in age and weight, respectively,

610 MUHAMMAD ASHRAF et al.
were selected. Alcoholic, drug abused, hepatitis B& C positive, pregnant and known history ofhypersensitivity with the drug under study volun-teers were rejected according to the inclusion andexclusion criteria of therapeutic ethical committeeof University of Veterinary and Animal Sciences(UVAS), Lahore, Pakistan. Additionally, the vol-unteers who had bleed and/or taking any medicinewithin three months before initiating the study aswell as who were incapable of understanding writ-ten consent were also abandoned from the study.Written informed consent was taken from eachvolunteer who received a dose of silymarin 200mg orally. Each subject was fasted after midnight(00:00 a.m.) before the administration of the drugin next morning (9:00 a.m.). The subjects contin-ued to fast for 3 h after administration. Volunteerswere housed at blood collection center throughoutthe period of blood sampling. Eight samples of 5mL blood each were collected over a period of 12h from each subject at predefined time schedule of
zero, 0.5, 1, 2, 3, 5, 8 and 12 h after silymarinadministration and stored in heparinized glasstubes. The plasma was harvested from blood cellsby centrifugation and stored at -400C until analy-sis.
Pharmacokinetics and statistics
The absorption and elimination kinetics profileof silymarin was determined by software APO PC-Computer Program, MWPHARM version 3.02,MEDIWARE, Holland. The program determinescompartmental and non-compartmental analysis incalculation of the bioavailability and eliminationkinetic parameters. GraphPad Prism 5 was used toapply unpaired t test for statistical analysis of the data.
Validation and optimization
Some parameters tested during the validationprocess were: system suitability, selectivity and lin-earity, limit of detection (LOD), limit of quantitation(LOQ), accuracy and precision.
Table 1. Demographic data for volunteers (n = 8).
Males Females
Age Weight Height Age Weight Height(year) (kg) (cm)
BMI(year) (kg) (cm) BMI
Minimum 19 50 149 22 19 50 145 22
Maximum 29 68 169 24 27 62 162 25
Mean 23 58 158 23 23 56 154 24
SD* 3.6 6.3 7.8 0.81 2.4 4.6 6 1.1
CV** 15.50% 10.91% 4.93% 3.50% 10.46% 8.27% 3.87% 4.82%
*SD = standard deviation, **CV = coefficient of variance.
Figure 1. Mean plasma concentrations ± SD and time profile of healthy male and female volunteers

Rationalized and complementary findings of silymarin... 611
Stability study
Chemical stability of silymarin in plasma wasassessed in accordance with the Guidelines forindustry: Bioanalytical method validation (18)(results were not shown).
RESULTS
The objective of proceeding extraction proce-dure of Usman et al. (16) was to encompass theinfluence of gender only. The demography of thevolunteers has been shown in Table 1. The bioana-lytical method was validated prior to quantify thedrug in subject samples. Extraction efficiency (EE)of silymarin as silychristin, silydianin, silybin A andsilybin B (chromatogram was not shown) was meas-ured by expression: .
Σ(AUC)ExtractedE.E = ñññññññññññññññ × 100Σ(AUC)Non-extracted
The % recovery (EE) was 89-103% with bias -13 to +17 at stated concentrations. Other parame-ters of validation process are given in Table 2. Theresults of the developed method were revalidated
after one month and inter-day precision was defined.The mean plasma concentration ± SD versus timeprofiles of silymarin for the gender (male andfemale) is shown in Figure 1. The absolute percent-age difference between the means of calculatedpharmacokinetic parameters of male and female was9.52-100. The mean values of time for maximumconcentration (Tmax), half lives (absorption, phase Iand phase II), volume of distribution (Vd), volume ofdistribution in compartment 1 (Vdi), volume of dis-tribution steady state (Vdss), clearance (CL) andmean residence time (MRT) were higher in femaleswhile the values of peak plasma concentration(Cmax), area under curve (AUC), AUC polyexponen-tial, AUC trapezoidal, absorption rate constant (ka),elimination rate constant from compartment 1 (k10),transfer constants (k12 and k21) and lag time werelower in females as compared to those in males(Table 3). There was significant difference (p <0.05) in all calculated pharmacokinetic parametersbetween the male and female subjects except trans-fer constant k12 (p > 0.05). High significant differ-ence (p = 0.0001) was observed in Cmax, Vdi, Vdss andAUC, especially if calculated by trapezoidal rule. If
Table 2. Validated performance of treated samples (mean ± SD).
Parameters Properties testNo. of Test
ResultsAcceptance
Remarkstreatment conditions criteria
[silychristin,silydianin,
silybin A andNormal silybin B]
(predefined) [4.62 ± 1.19
SystemRetention and stress (%RSD 0.069),
No interferingsuitability
time (Tr) n > 3 study 12.09 ± 0.9 RSD = 2.0% peaks(min) (accelerated (%RSD 0.37),
stability 12.32 ± 2.1 study) (%RSD 0.76),
14.4 ± 3.4 (%RSD 0.37, respectively)]
Results wereSelectivity Goodness of
y = 13.87x +reproducible and
fit test n > 3 predefined 5.7505, r2 > 0.9
within the linearity r2 = 0.999stated range
0.036 ± 0.01, LOD and Qualification %RSD 7
LOQ and n > 5 predefined 0.06 ± 0.005, %RSD ≤
-(µg/mL) quantification %RSD 0.7,
1.0%
respectively
Higher % CVPrecision Intra-day and 1.2-9.5%, % CV ≤ (≥ 10%) was
(% CV) and inter-day n > 5 predefined ≥ 93%, 10%, observed at accuracy (%) variations respectively 85-105% lower conc.
(0.03 µg/mL)
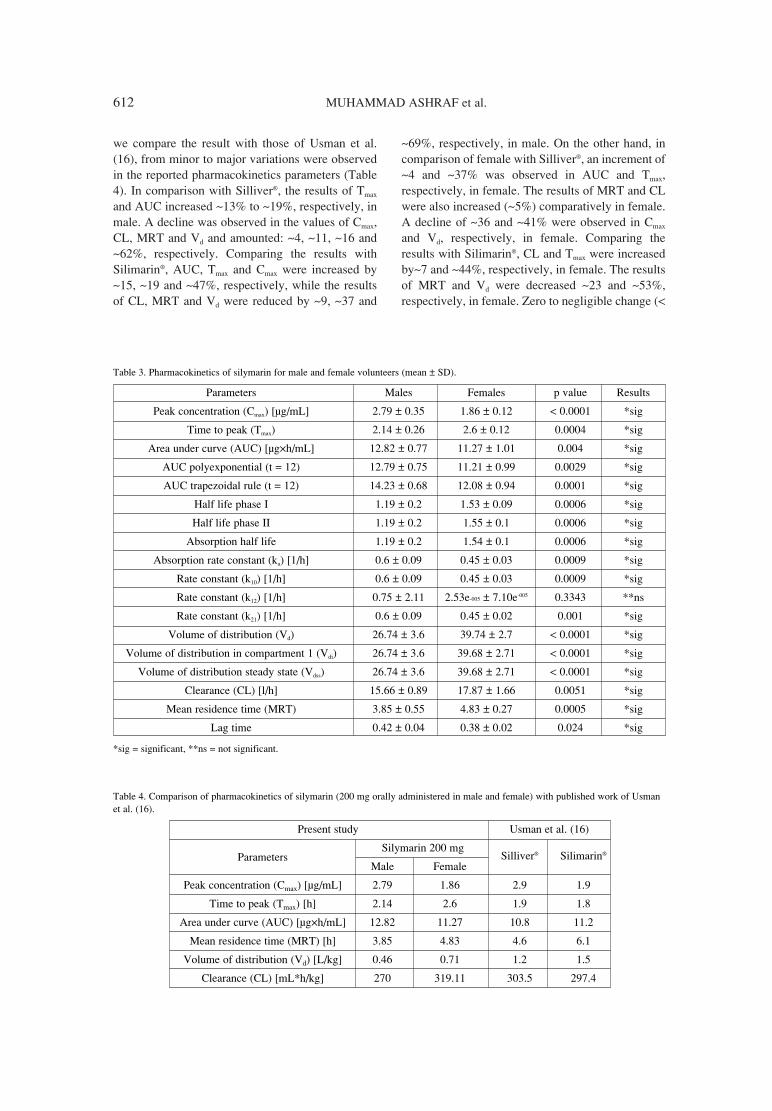
612 MUHAMMAD ASHRAF et al.
we compare the result with those of Usman et al.(16), from minor to major variations were observedin the reported pharmacokinetics parameters (Table4). In comparison with SilliverÆ, the results of Tmax
and AUC increased ~13% to ~19%, respectively, inmale. A decline was observed in the values of Cmax,CL, MRT and Vd and amounted: ~4, ~11, ~16 and~62%, respectively. Comparing the results withSilimarinÆ, AUC, Tmax and Cmax were increased by~15, ~19 and ~47%, respectively, while the resultsof CL, MRT and Vd were reduced by ~9, ~37 and
~69%, respectively, in male. On the other hand, incomparison of female with SilliverÆ, an increment of~4 and ~37% was observed in AUC and Tmax,respectively, in female. The results of MRT and CLwere also increased (~5%) comparatively in female.A decline of ~36 and ~41% were observed in Cmax
and Vd, respectively, in female. Comparing theresults with SilimarinÆ, CL and Tmax were increasedby~7 and ~44%, respectively, in female. The resultsof MRT and Vd were decreased ~23 and ~53%,respectively, in female. Zero to negligible change (<
Table 3. Pharmacokinetics of silymarin for male and female volunteers (mean ± SD).
Parameters Males Females p value Results
Peak concentration (Cmax) [µg/mL] 2.79 ± 0.35 1.86 ± 0.12 < 0.0001 *sig
Time to peak (Tmax) 2.14 ± 0.26 2.6 ± 0.12 0.0004 *sig
Area under curve (AUC) [µg◊h/mL] 12.82 ± 0.77 11.27 ± 1.01 0.004 *sig
AUC polyexponential (t = 12) 12.79 ± 0.75 11.21 ± 0.99 0.0029 *sig
AUC trapezoidal rule (t = 12) 14.23 ± 0.68 12.08 ± 0.94 0.0001 *sig
Half life phase I 1.19 ± 0.2 1.53 ± 0.09 0.0006 *sig
Half life phase II 1.19 ± 0.2 1.55 ± 0.1 0.0006 *sig
Absorption half life 1.19 ± 0.2 1.54 ± 0.1 0.0006 *sig
Absorption rate constant (ka) [1/h] 0.6 ± 0.09 0.45 ± 0.03 0.0009 *sig
Rate constant (k10) [1/h] 0.6 ± 0.09 0.45 ± 0.03 0.0009 *sig
Rate constant (k12) [1/h] 0.75 ± 2.11 2.53e-005 ± 7.10e-005 0.3343 **ns
Rate constant (k21) [1/h] 0.6 ± 0.09 0.45 ± 0.02 0.001 *sig
Volume of distribution (Vd) 26.74 ± 3.6 39.74 ± 2.7 < 0.0001 *sig
Volume of distribution in compartment 1 (Vdi) 26.74 ± 3.6 39.68 ± 2.71 < 0.0001 *sig
Volume of distribution steady state (Vdss) 26.74 ± 3.6 39.68 ± 2.71 < 0.0001 *sig
Clearance (CL) [l/h] 15.66 ± 0.89 17.87 ± 1.66 0.0051 *sig
Mean residence time (MRT) 3.85 ± 0.55 4.83 ± 0.27 0.0005 *sig
Lag time 0.42 ± 0.04 0.38 ± 0.02 0.024 *sig
*sig = significant, **ns = not significant.
Table 4. Comparison of pharmacokinetics of silymarin (200 mg orally administered in male and female) with published work of Usmanet al. (16).
Present study Usman et al. (16)
ParametersSilymarin 200 mg
Male FemaleSilliverÆ SilimarinÆ
Peak concentration (Cmax) [µg/mL] 2.79 1.86 2.9 1.9
Time to peak (Tmax) [h] 2.14 2.6 1.9 1.8
Area under curve (AUC) [µg◊h/mL] 12.82 11.27 10.8 11.2
Mean residence time (MRT) [h] 3.85 4.83 4.6 6.1
Volume of distribution (Vd) [L/kg] 0.46 0.71 1.2 1.5
Clearance (CL) [mL*h/kg] 270 319.11 303.5 297.4

Rationalized and complementary findings of silymarin... 613
1%) was observed in case of Cmax and AUC, respec-tively, in female.
DISCUSSION
Numerous studies have shown a gender differ-ence in the pharmacokinetics of many drugs.Pharmacokinetic differences arise because of differ-ences in endogenous and exogenous hormones, dif-ferences in body size and fat compositions, and dif-ference in liver metabolism. Approximately 50% ofthe drugs currently on the market are metabolized bycytochrome P-450 isozyme 3A4.Women appear tohave higher levels of 3A4 than men (15, 19). Theresults of accuracy and precision showed that theextraction method was accurate and reproducible forplasma concentrations. It was inferred from the sta-tistical analysis that pharmacokinetics of silymarinbehaved differently in male and female that mightbe due to reduced liver blood flow and lower clear-ance of the drug in female volunteers as compared tomale (3). As silymarin was the lipophilic extract ofìmilk thistleî that made it a potential candidate toreach in deep tissues of the body, especially infemales that had high fat content as compared tomale. This factor was led to increase of ~12, ~18,~20, ~23 and ~33% in mean values of CL, Tmax,MRT, half lives (phase I and phase II) and volumesof distribution (Vd, Vdi, Vdss) in female (Table 2) (20,21). Under very general assumptions, the area underthe plasma or blood drug concentrations is a param-eter that is closely dependent on the drug amountthat enter into the systemic circulation and on theability that the system has to eliminate the drug(clearance) (22). On the basis of higher mean valuesof AUC and Cmax (12% and 33%, respectively) inmale as compared to female, it is expected that muchbetter bioavailability of silymarin will be achievedin male. As much of the drug was transferred fromcentral compartment to deep tissue in femalebecause of high fat contents that led to reducedamount to reach systemic circulation and resulted inlow AUC and Cmax in female as compared to male.The rate of absorption and distributions (ka, k10, k12
and k21) was high in male as compared to female thatmight be due to difference in life style of Pakistanimales and females. The ratio of fast food intake, useof tea, exercise etc., is high in Pakistani males ascompared to females. All these factors directlyinfluence the function of GIT. Two compartmentmodel approach was used in this study to calculatepharmacokinetic parameters as compared to the pre-vious study of silymarin by Usman et al. (16). Thevariation in pharmacokinetics of silymarin in com-
parison with the previous study might be due todemographic difference in gender.
CONCLUSIONS
On the bases of observed variations in pharma-cokinetics of silymarin in male and female it will beright to say that gender based evidence should beprovided if clinical study is reported especially onhuman being. It is evident that the dose of silymarinmust be adjusted prior to administration accordingto demographic parameters of the patient.Furthermore, the presented work demands furtherresearch to conduct on larger population in thefuture to make a concrete decision about the doseadjustemnt of silymarin in male and female. It isalso recommended by the authors that In Vitro InVivo Correlation (IVIVC) shoud be developed forsilymarin to predeict bioavalibity of the newlydeveloped formulatons (23, 24).
Acknowledgment
All the authors read and approved the finalmanuscript. They are sincerely thankful to the vol-unteers for their participation in clinical trials with-out any financial interest.
Conflict of interest
The authors declare that there is no financialsupport and conflict of interest related to the contentof this manuscript.
REFERENCES
1. Haq I.: Pak. J. Med. Res. 43, 4 (2004).2. Dinsmore A.D., Hsu M.F., Nikolaides M.G.,
Marquez M., Bausch A.R., Weitz D.A.: Science298, 5595 (2002).
3. Pleym H., Spigset O., Kharasch E.D., Dale O.:Acta Anaesthesiol. Scand. 47, 3 (2003).
4. Holt V.L., Cushing-Haugen K.L, Daling JR.:Obstet. Gynecol. 99, 820 (2002).
5. Anderson G.D.: J. Womens Health (Larchmt)14, 19 (2005).
6. Ghosh A., Ghosh T., Jain S.: J. Pharm. Sci.Technol. 2l, 348 (2010).
7. Shakeel A.H., Yar A.K.: Global J. Res. Med.Plants Indigen. Med. 3, 1 (2014).
8. Fraschini F., Demartini G., Espost D.: Clin.Drug Invest. 22, 51 (2002).
9. Dixit N., Baboota S., Kohli K., Ahmad S., AliJ.: Indian J. Pharmacol. 39, 172 (2007).

614 MUHAMMAD ASHRAF et al.
10. Molto J., Valle M., Miranda C., Cedeno S.,Negredo E., Clotet B.: Antimicrob. AgentsChemother. 56, 2837 (2012).
11. Narayan R.: Biomath Info. [online]. (2009).Available from: http://www.biomath.info/Protocols/PGY2/docs/RupaNarayan.pdf
12. Murphy J.M., Caban M., Kemper K.J.:Longwood Herbal Task Force. [online]. (2000).Available from: http://www.longwoodherbal.org/milkthistle/milkthistle.pdf:
13. Javed S., Kohli K., Ali M.: Altern. Med. Rev.16, 239 (2011).
14. Yaghmaei P., Azarfar K., Dezfulian M.,Ebrahim-Habibi A.: DARU 22, 24 (2014)
15. Miller MA.: Int. J. Toxicol. 20, 149 (2001).16. Usman M., Ahmad M., Madni AU., Akhtar N.,
Asghar W. et al.: Trop. J. Pharm. Res. 8, 311(2009).
17. (2009). Protocol of preparation of blood plas-ma. ProImmune Limited. Available at: http://www.proimmune.com/ecommerce/pdf_files/PR31.pdf
18. (2013). U.S. Department of Health and HumanServices, Food and Drug Administration.
Center for Drug Evaluation and Research(CDER). Revision 1. Available at: http://www.fda.gov/downloads/Drugs/GuidanceComplianceRegulatoryInformation/Guidances/UCM368107.pdf
19. Zhu H.J., Brinda B.J., Chavin K.D., BernsteinH.J., Patrick K.S., Markowitz J.S.: Drug Metab.Dispos. 41, 1679 (2013).
20. Dashti-Khavidaki S., Shahbazi F., Khalili H.,Lessan-Pezeshki M.: J. Pharm. Pharm. Sci. 15,112 (2012).
21. Baerdemaeker LED, Mortier EP, Struys MM.:BJA/CEACCP. Available at:http://ceaccp.oxfordjournals.org/ 4, 5 (2004).
22. Urso R., Blardi P., Giorgi G.: Eur. Rev. Med.Pharmacol. Sci. 6, 33 (2002).
23. Sarfraz M, Ahmad M, Sarfraz A.: Pak. J. Sci.Ind. Res. Ser. B: Biol. Sci. 55, 1 (2012).
24. Sharma M.: Research and Reviews: Journal ofPharmaceutics and Nanotechnology (RRJPNT)2, 23 (2014).
Received: 7. 04. 2014

Acta Poloniae Pharmaceutica ñ Drug Research, Vol. 72 No. 3 pp. 615ñ624, 2015 ISSN 0001-6837Polish Pharmaceutical Society
Halal is an Arabic word which means ìlawful,îìpermissibleî under Islamic law (1-3). Halal is auniversal term that applies to all facets of life; how-ever, this study will adapt this term to refer only topharmaceutical products that are deemed permissi-ble for consumption of Muslims.
It is a firm belief of all Muslims that Allah is ourcreator and He is the best judge of what is right for usto consume and in what shape it should be done.However, it is pertinent to mention that all old reli-gions of the world like Hinduism, Judaism andChristianity also command certain religious restric-tions and bindings on their followers in the consump-tion of foods and drinks (4, 5). They may use otherterminologies to define these restrictions but the main
sentiment is the same. Therefore, it would be perti-nent to look into various items of human consump-tion, including medicines, and their variants, to deter-mine admissibility according to individual beliefs.
The globally expanding Muslim population hasin turn expanded the Muslim consumerís marketmanifold. Moreover, awareness among Muslims isdawning regarding medicines and its sources.Muslim consumers are now increasingly mindfuland in search for Halal medicines. Most countries ofthe world have a body or more to look upon issuesrelated to the Halal food. These bodies govern allmatters including issuance of Halal certification.Though, at present, pharmaceuticals are not manda-tory for monitoring of the Halal status.
KAP AMONG DOCTORS WORKING IN HOSPITALS, REGARDING HALALPHARMACEUTICALS; A CROSS SECTIONAL ASSESSMENT
SALEHA SADEEQA1*, AZMI SARRIFF1, IMRAN MASOOD2, MUHAMMAD ATIF2
and MARYAM FAROOQUI3
1Discipline of Clinical Pharmacy, School of Pharmaceutical Sciences, Universiti Sains Malaysia, Penang, Malaysia
2Faculty of Pharmacy and Alternative Medicine, The Islamia University of Bahawalpur, Bahawalpur, Punjab, Pakistan
3Faculty of Pharmacy Universiti Teknologi MARA (Bertam campus), Penang, Malaysia
Abstract: There is a growing awareness amongst Muslims to avoid all items containing non-Halal ingredients.This sentiment has now progressed into the field of various medications. It therefore, required a study to assessthe knowledge, attitude and perception (KAP) relating to pharmaceuticals containing non-Halal ingredientsamong doctors working in various hospitals of Malaysia. This was a cross sectional study, carried out in January2013 - February 2013 period, using a structured, self-administered questionnaires. Study settings included var-ious government hospitals in Malaysia. Data were collected by distributing questionnaires through respectiveheads of the departments. Study was conducted on a sample of 243 participants. Inclusion criterion was a reg-istered medical doctor working in a government hospital. Descriptive statistics (mean, standard deviation, fre-quency, percentage, median, inter quartile range) was applied to summarize the data, non-parametric tests wereapplied. χ2 Test and Fisherís Exact Test were applied to assess the association between demographic charac-teristics and knowledge, attitude and perception scores. Results revealed that the hospital doctors had a goodand positive attitude and perception about Halal pharmaceuticals. Mean knowledge score out of maximum pos-sible 9 score was 7.67 ± 1.68. Mean attitude score out of maximum possible 45 score was 34.10 ± 5.35 whilemean perception score out of maximum possible 55 score was 45.73 ± 5.44. Mean overall KAP score out ofmaximum possible 109 was 87.60 ± 10.37. There was a significant, positive and weak correlation (0.20 - 0.29)between knowledge and attitude (r = 0.231, p < 0.001) as well as between knowledge and perception (r = 0.209,p = 0.001) while there was good correlation (0.5 - 0.75) between attitude and perception (r = 0.588, p < 0.001).It is concluded from the results that the better knowledge the respondents have on Halal pharmaceuticals thebetter is their perception and attitude towards Halal pharmaceuticals.
Keywords: knowledge, attitude, perception, KAP, halal, pharmaceuticals
615
* Corresponding author: e-mail: [email protected]

616 SALEHA SADEEQA et al.
As a majority of Malaysian population isMuslim (6), there are many government organiza-tions which play active role to ensure provision ofHalal foods and pharmaceuticals. Halal IndustryDevelopment Corporation (HDC) coordinates theoverall development of the Halal industry, and focus-es on development of Halal standards, audit and cer-tification (7). Department of Islamic DevelopmentMalaysia (JAKIM) has established Malaysia Halallogo and has implemented Halal Certification System(8). Ministry of International Trade and Industry(MITI) promotes Halal products and services (9).Department of Standards, Government of Malaysiahas launched worldís first standards, MS 2424:2010(P): for Halal pharmaceuticals. These general guide-lines will address the entire pharmaceutical manufac-turing and supply chain ñ from processing to han-dling, packaging, labeling, distribution, storage anddisplay of medicines and health supplies (10).
Though many government and non govern-ment organizations are playing an active role toensure provision of Halal foods and pharmaceuticalsto Muslims in Malaysia, to the best of our knowl-edge no study has been done, so far, to evaluate theperception of doctors working in hospitals regardingHalal pharmaceuticals. Moreover, their knowledgeon the issues surrounding Halal pharmaceuticals isnot well explored. Therefore, the main objective ofthis study is to explore Malaysian hospital doctorsíperception and their opinion of Halal pharmaceuti-cals and to identify barriers to prescribing them.
EXPERIMENTAL
Study settings and design
A cross sectional study design was adopted byusing structured, self-administered questionnaire.Survey was conducted across Malaysia fromJanuary 2013 to March 2013. Study settings includ-ed various government hospitals in Malaysia.
Questionnaire design and validation
After extensive literature review, a self admin-istered questionnaire was designed to conduct thisstudy. The questionnaire was validated by a panel ofexperts which was composed of eight (8) senior aca-demic researchers and was updated according totheir recommendations (11). A pilot study was con-ducted to evaluate the reliability of the updatedquestionnaire. Cronbachís α was applied to testvalidity and internal consistency of the question-naire (12) and α = 0.6 was set as the minimumacceptable value for validity. Final modificationswere made based upon the results of pilot study.
The final questionnaire consisted of four parts.The first part of the questionnaire was on respon-dentís demographic information including age, gen-der, race, religion, nationality, current position(house officer or specialist), current area of practice,country of basic educational degree, basic medicalqualification, post graduate medical qualificationand finally the experience. Second part had 9 state-ments to evaluate the knowledge of respondents.Third part consisted of 11 statements for percep-tionís evaluation and final part had 9 statementsabout the attitude of respondents regarding Halalpharmaceuticals. All questions were close ended,except one at the end for additional comments.
Scoring method for knowledge, attitude and per-
ception (KAP)
For knowledge statements respondents wereasked to choose ìyesî or ìnoî options. Correctanswer (yes) was scored one (1) while incorrectanswer (no) was scored zero (0). A five point Likertscale was used for perception and attitude state-ments (strongly agree = 5, agree = 4, neutral = 3, dis-agree = 2 and strongly disagree = 1). Hence, theminimum and maximum score for knowledge, atti-tude and perception can be 0 to 9, 1 to 45 and 1 to55, respectively (11). Total KAP score can be 109.
Selection criteria and recruitment of respondents
All medical doctors working in differentdepartments (except those who were not involved inprescribing i.e., radiologists, pathologists etc.) inselected government hospitals, on duty during thestudy period and willing to participate in study wererecruited as ìstudy participantsî.
Sampling and data collection
Sampling technique was convenience sam-pling. All doctors, in selected hospitals, (involved inprescribing medicines) were approached. Only thosedoctors were included in the study who agreed toparticipate. Doctors were approached throughrespective heads of the departments (13) and wererequested to return the completed questionnaireswithin two weeks. Reminders were sent after oneweek (14). No incentives were offered to any of therespondents (15, 16).
Ethical consideration
Ethical approval to conduct this study wastaken from ìJoint Ethics Committee of School ofPharmaceutical Sciences, USM and Hospital LamWah Ee on Clinical Studiesî. Additionally, approvalof the Ministry of Health Malaysia was also taken.

KAP among doctors regarding Halal pharmaceuticals across sectional assessment 617
Table 1. Descriptive characteristics of hospital doctors n = 243.
haracteristics Demographic characteristics Frequency (%)
24-28 109 (44.9)
29-33 71 (29. 2)Age (years)
34-40 43 (17.7)
≥41 20 (8.2)
GenderMale 102 (42.0)
Female 141 (58.0)
Malay 90 (37.2)
Chinese 96 (39.7)
Race Indian 8 (19.8)
OthersPunjabi = 4, Mamak = 1, 8 (3.3)Kadazan = 1, Bisaya = 1
Muslims 93 (38.4)
Christians 29 (12.0)
Religion Buddhist 72 (29.8)
Hindu 40 (16.5)
Others (Sikh = 5, Tao = 2) 8 (3.3)
Nationality Malaysian 243 (100)
House Officer 64 (26.3)
Current Position Medical Officer 130 (53.5)
Specialist/consultant 49 (20.3)
General medicine 103 (42.7)
Obstetrics and gynecology 38 (15.8)
Surgery 49 (20.3)Current area of practice
Pediatrics 28 (11.6)
ENT 22 (9.1)
Others 1 (0.4)
MBBS 108 (44.4)
Doctor in medicine (MD) 124 (51.0)Basic medical qualification
Others (MBBCh, BAO = 8,Melo G = 1
11 (4.5)
Postgraduate qualificationYes 51 (21.2)
No 189 (77.8)
Malaysia 165 (68.5)
Others (Russia = 20, India = 16, Indonesia = 11, UK = 8,
Country of basic degree Australia = 5, Ireland = 4, 76 (31.5)Ukraine = 4, Czech Republic = 2,
Canada = 1
1-4 140 (57.6)
5-8 51 (21.0) Working experience (years)
9-12 20 (8.2)
≥ 12 32 (13.2)
Note: The frequencies and percentages are based on observed values; missing values are excluded (18).

618 SALEHA SADEEQA et al.
Moreover, permission was also sought from direc-tors of respective hospitals and the heads of thedepartments.
Data analysis
After data collection and screening, data wereentered in SPSS version 18. After data cleaning,normality of data was checked by Kolmogorov-Smirnov test. Descriptive statistics (mean, standarddeviation, frequency, percentage, median, interquartile range) was applied to summarize the data.As data were not normally distributed, so non-para-metric tests were applied. χ2 Test and Fisherís ExactTest were applied to assess the association betweendemographic characteristics and knowledge, attitudeand perception score. To find relationship betweenknowledge-attitude, knowledge-perception and atti-tude-perception of respondents, Spearman-correla-tion was applied; p value of 0.05 or less was takenas statistically significant. Responses were consid-ered positive, if they were on positive side of themidpoint of score and negative, if they were on neg-ative side of the midpoint of score (17).
RESULTS
Respondentsí demographics
A total of 243 doctors participated in the study.Demographic characteristics of the respondents aredepicted in Table 1. Mean age of the respondentswas 31.25 years with SD of ± 6.33. Age ranges from
24 to 56 years. Gender - 102 (42%) of the respon-dents were male and 141 (58%) were female.Ethnicity - 90 (37.2%) were Malay, 96 (39.7%) wereChinese and 48 (19.8%) Indians. According to thereligion, 93 (38.4%) were Muslims, 29 (12%)Christians, 72 (29.8%) Buddhists, 40(16.5%) Hinduand 8 (3.3%) from other categories. A total of 64(26.3%) were house officers, 130 (53.5%) medicalofficers and 49 (20.3%) were specialists.
Respondentsí knowledge regarding Halal phar-
maceuticals
Out of maximum possible score (equal to 9),mean knowledge score was 7.67, SD = 1.685. Thefrequency distribution of respondentsí knowledgeregarding Halal pharmaceuticals is depicted in Table2. A total of 42% respondents scored 100% score,24% respondents scored 88% score while 14%scored 77%. Hence, overall a large majority (> 94%)of the respondents scored 50% and above, whichshows that study population has good knowledgeregarding Halal pharmaceuticals.
Results showed that all, except one, of therespondents were aware of the term ìHalalî, while225 (93%) of the respondents were aware of theterm ìHaramî (ìunlawfulî, ìprohibitedî, ìforbid-denî) showing a significant association with respectto respondentsí religion (p = 0.008) and race (p =0.003). On the other hand, a total of 181 (74.8%)respondents were aware of the term ìHalal pharma-ceuticalî showing a significant association with
Table 2. Hospital doctorsí knowledge about Halal pharmaceuticals (frequeny distribution n = 243).
Responses
Statements Yes Non (%) n (%)
Are you aware of the term/ word ìHalalî? 241 (99.6) 1 (0.4)
Are you aware of the term/word ìHaramî? 225 (93.0) 17 (7.0)
Are you aware of the term/word ìHalal pharmaceuticalsî? 181 (74.8) 61 (25.2)
Do you know that Muslim patients need Halal medicines? 228 (95.0) 12 (5.0)
Do you know that dead animals, blood, pork and Alcohol are Haram for Muslims to use in any form (food, medication etc)?
227 (94.2) 14 (5.8)
Do you know that ingredients of some drugs/medicines are derived from porcine and dead animals?
231 (95.5) 11 (4.5)
Do you know that resources are available to offer Halal alternatives of non-Halal drugs?
173 (72.1) 67 (27.9)
Do you know that it is ethical obligation for a practitioner to take consent from the patient before dispensing any medicine which has any non-Halal content?
200 (82.6) 42 (17.4)
Do you know that most of the doctors are aware of the presence of potentially forbidden animal-derived ingredients in medicines?
183 (75.9) 58 (24.1)
Note: The frequencies and percentages are based on observed values; missing values are excluded (18). The cut off level of ≥ 5 wasconsidered as good knowledge while < 5 as poor.

KAP among doctors regarding Halal pharmaceuticals across sectional assessment 619
respect to respondentsí gender (Fisherís p value =0.035), religion (p = 0.005) and years of experience(p = 0.045). A large majority (95%) of the respon-dents were aware that Muslim patients need Halalmedicines showing a significant association withrespect to respondentsí religion (p < 0.001), race (p= 0.002) and years of experience (p = 0.021).
It was also found that a total of 227 (94.2%)respondents were aware that dead animals, blood,pork and alcohol are Haram for Muslims to use inany form (food, medication etc.), showing a signifi-cant association with respect to respondentsí reli-gion (p = 0.031) and race (p = 0.016). A majority ofrespondents (95.5%) were aware that ingredients ofsome drugs/medicines are derived from porcine anddead animals. This showed a significant associationwith respect to respondentsí race (p = 0.002). A totalof 173 respondents (72.1%) had knowledge thatresources are available to offer Halal alternatives ofnon-Halal drugs, showing a significant associationwith respect to respondentsí religion (p = 0.015).Results found that 200 (82.6%) of the respondents
had knowledge that it is ethical obligation for a prac-titioner to take consent from the patient before dis-pensing any medicine which has any non-Halal con-tent, showing a significant association with respectto respondentsí religion (p = 0.003) and race (p =0.047). Study further found that 183 (75.9%) of therespondents were aware that most of the doctorsknow of the presence of potentially forbidden ani-mal-derived ingredients in medicines. This showeda significant association with respect to respondentsíreligion (p = 0.033) and race (p = 0.010).
Respondentsí perception regarding Halal phar-
maceuticals
The perception of respondents regarding Halalpharmaceuticals was evaluated by using perceptionquestionnaire. The frequency distribution of respon-dentsí perception regarding Halal pharmaceuticals ispresented in Table 3. There were total 11 statementsto evaluate the perception of respondents. Out ofmaximum possible score (55), the mean perceptionscore was 45.73 ± 5.44. About 90% of the respon-
Table 3. Hospital doctorsí perception about Halal pharmaceuticals (frequency distribution n = 243).
Responses*
Statements SA A N DA SDAn (%) n (%) n (%) n (%) n (%)
Patient has a right to ask information about sources & ingredients of medicines.
131 (53.9) 107(44) 5 (2.1)
It is important for prescriber to explain about the sources & ingredients of medicine as much as possible and 78 (32.2) 132 (54.5) 27 (11.2) 4 (1.7) 1 (0.4)encourage the patients to ask questions.
It is not a common practice to inform the patients aboutsources of the medicines.
21 (8.6) 106 (43.6) 59 (24.3) 45 (18.5) 12 (4.9)
Drug manufacturers should provide prescribers with a list of their products containing animal-derived ingredients.
106 (43.8) 118 (48.8) 16 (6.6) 1 (0.4) 1 (0.4)
Doctor should be educated about the sources of medicines. 96 (39.5) 132 (54.3) 11 (4.5) 2 (0.8) 2 (0.8)
Patientís religious beliefs are considered while prescribing medicines.
99 (41.1) 115 (47.7) 21 (8.7) 5 (2.1) 1 (0.4)
Patientís religious beliefs impact their adherence to drug therapy.
88 (36.2) 122 (50.2) 28 (11.5) 4 (1.6) 1 (0.4)
Pharmaceutical manufacturers should be sensitive towards the requirements of patients and wherever possible should 91 (37.4) 110 (45.3) 37 (15.2) 4 (1.6) 1 (0.4)produce Halal medicines.
Drug companies should clearly mark medication packaging with easy-to-spot Halal/non Halal labels.
102 (42) 109 (44.9) 24 (9.9) 6 (2.5) 2 (0.8)
Clear and well explained guidelines are need of healthcare professionals to navigate religious conflicts.
83 (34.2) 132 (54.3) 26 (107) 1(0.4) 1 (0.4)
Healthcare professionals need to define medical necessity and explore existence of Halal alternatives.
70 (28.8) 133 (54.7) 32 (13.2) 8 (3.3)
Note: The frequencies and percentages are based on observed values; missing values are excluded [18]. The cut off level of ≥ 28 was con-sidered as positive perception while < 28 as negative. * SA = strongly agree, A = agree, N = neutral, DA = disagree, SDA = strongly dis-agree.

620 SALEHA SADEEQA et al.
dents scored more than 70% of the perception scoreand all respondents (except one) scored more than50% of the perception score denoting a positive per-ception towards Halal pharmaceuticals.
Results showed that a total of 131 (53.9%)respondents strongly agreed and 107 (44%) agreed,that the patient has a right to ask the informationabout sources of ingredients in medicines, showinga significant association with respect to respondentsíreligion (p < 0.001), race (p < 0.001) and currentposition (p < 0.001). A total of 78 (32.2%) of therespondents strongly agreed and 132 (54.5%)agreed, that it is important for prescriber to explainabout the sources and ingredients of medicine asmuch as possible and encourage the patients to askquestions. This showed a significant associationwith respect to respondentsí age (p = 0.021), gender(p = 0.042), race (p = 0.031) and years of experience(p = 0.025). On the other hand, 21 (8.6%) respon-dents strongly agreed and 106 (43.6%) agreed that itis not a common practice to inform the patientsabout sources of the medicines showing a significantassociation with respect to respondentsí race (p =0.014) and respondentsí current area of practice (p =0.005).
It was further found that 106 (43.8%) respon-dents strongly agreed while 118 (48.8%) agreed thatdrug manufacturers should provide prescribers witha list of their products containing animal-derived
ingredients. This showed a significant associationwith respect to respondentsí race (p < 0.001) andreligion (p < 0.001). A total of 96 (39.5%) respon-dents strongly agreed while 132 (54.3%) agreed thatdoctors should be educated about the sources ofmedicines. This showed a significant associationwith respect to respondentsí race (p < 0.001) andreligion (p < 0.001). A total of 99 (41.1%) respon-dents strongly agreed and 115 (47.7%) agreed, thatpatientís religious beliefs are considered while pre-scribing medicines showing a significant associationwith respect to respondentsí race (p < 0.001) andreligion (p < 0.001). On the other hand, 88 (36.2%)of the respondents strongly agreed while 122(50.2%) agreed that patientís religious beliefsimpact their adherence to drug therapy showing asignificant association with respect to respondentsírace (p < 0.001) and religion (p = 0.005).
The study further found that 91 (37.4%)respondents showed their response as ëstronglyagreeí while 110 (45.3%) as ëagreeí that pharma-ceutical manufacturers should be sensitive towardsthe requirements of patients and wherever possibleshould produce Halal medicines. This showed a sig-nificant association with respect to respondentsírace (p < 0.001), religion (p < 0.001) and currentposition (p < 0.001). A total of 102 (42%) respon-dents showed their response as ëstrongly agreeíwhile 109 (44.9%) as ëagreeí that drug companies
Table 4. Hospital doctorís attitude about Halal pharmaceuticals (frequency distribution n = 243).
Responses*
Statements SA A N DA SDAn (%) n (%) n (%) n (%) n (%)
I discuss with patients about forbidden/Haram ingredients of drugs.
41 (16.9) 134 (55.1) 56 (23.0) 11 (4.5) 1 (0.4)
I feel moral obligation to disclose the exact source of non-Halal ingredients to the patient (e.g. alcohol in syrups/elixirs 55 (22.6) 129 (53.1) 50 (20.6) 7 (2.9) 2 (0.8)and gelatin in capsules).
I take consent from patients, if I know the drug is non-Halal. 63 (25.9) 112 (46.1) 53 (21.8) 13 (5.3) 2 (0.8)
I consider patientís religious beliefs when designing a treatment regimen. 7
1 (29.2) 124 (51.0) 42 (17.3) 6 (2.5)
I make an effort to search for any available Halal alternatives. 39 (16.1) 103 (42.6) 76 (31.4) 23 (9.5) 1 (0.4)
I educate the patient regarding Halal ingredients. 35 (14.4) 108 (44.4) 80 (32.9) 20 (8.2)
I prefer Halal medicines in my practice. 59 (24.3) 77 (31.7) 89 (36.6) 15 (6.2) 3(1.2)
I recommend the purchase of Halal alternatives, which may be more expensive.
45 (18.5) 87 (35.8) 88 (36.2) 16 (6.6) 7 (2.9)
I feel that medical representatives are a good source of information about sources and ingredients of drugs for me.
48 (19.8) 114 (47.1) 63 (26.0) 14 (5.8) 3 (1.2)
Note: The frequencies and percentages are based on observed values; missing values are excluded (180). The cut off level of ≥ 23 was con-sidered as positive attitude while < 23 as negative. * SA = strongly agree, A = agree, N = neutral, DA = disagree, SDA = strongly disagree.

KAP among doctors regarding Halal pharmaceuticals across sectional assessment 621
should clearly mark medication packaging witheasy-to-spot Halal/non Halal labels. This showed asignificant association with respect to respondentsírace (p < 0.001), religion (p < 0.001) and currentposition (p = 0.047). A total of 83 (34.2%) respon-dents strongly agreed while132 (54.3%) agreed thatclear and well explained guidelines are a need ofhealthcare professionals to navigate religious con-flicts. This showed a significant association withrespect to respondentsí gender (p = 0.042), race (p <0.001) and religion (p < 0.001). Furthermore, 70(28.8%) of the respondents strongly agreed while133 (54.7%) agreed that healthcare professionalsneed to define medical necessity and explore exis-tence of Halal alternatives. This showed a signifi-cant association with respect to respondentsí gender(p = 0.005), race (p < 0.001), and religion (p <0.001).
Respondentsí attitude regarding Halal pharma-
ceuticals
The attitude of respondents regarding Halalpharmaceuticals was evaluated by using attitudequestionnaire. The frequency distribution of respon-dentsí attitude regarding Halal pharmaceuticals isshown in Table 4. There were total 9 statements toevaluate the attitude of respondents. Out of maxi-mum possible score (45), the mean attitude scorewas 34.10 ± 5.35. More than 77% of the respondentsscored 66% of the attitude score while 98% of therespondents scored more than 50% of the attitudescore denoting a positive attitude towards Halalpharmaceuticals.
The results showed that 41 (16.9%) respon-dents strongly agreed while 134 (55.1%) agreed thatthey discuss with their patients aboutforbidden/Haram ingredients of drugs, showing asignificant association with respect to respondentsícurrent position (p = 0.002) and current area of prac-tice (p = 0.045). A total of 55 (22.6%) respondentsstrongly agreed while 129 (53.1%) agreed that theyfeel moral obligation to disclose the derivation ofnon-Halal ingredients to the patients (e.g., alcohol insyrups/elixirs and gelatin in capsules). This showed
a significant association with respect to respondentsírace (p < 0.001 and religion (p = 0.003). It was fur-ther found that 63 (25.9%) of the respondentsshowed their response as ëstrongly agreeí while 112(46.1%) as ëagreeí that they take consent frompatients, if they know the drug is non-Halal. Thisshowed a significant association with respect torespondentsí race (p = 0.046) and current position (p= 0.024). The study further found that 71 (29.2%) ofthe respondents showed their response as ëstronglyagreeí while 124 (51%) as ëagreeí that they consid-er patientís religious beliefs when designing a treat-ment regimen. This showed a significant associationwith respect to respondentsí race (p < 0.001), reli-gion (p = 0.015) and current position (p = 0.013). Atotal of 39 (16.1%) respondents showed theirresponse as ëstrongly agreeí while 103 (42.6%) asëagreeí that they make an effort to search for anyavailable Halal alternatives. This showed a signifi-cant association with respect to respondentsí race (p= 0.011), religion (p = 0.013) and current position (p= 0.005). A total of 35 (14.4%) respondents showedtheir response as ëstrongly agreeí while 108 (44.4%)as ëagreeí that they educate the patients regardingHalal ingredients of medicines, showing a signifi-cant association with respect to respondentsí age (p= 0.045), race (p = 0.002), religion (p = 0.011), yearsof experience (p = 0.018), current position (p =0.003) and current area of practice (p = 0.001).
Ir was further found that 59 (24.3%) of therespondents showed their response as ëstronglyagreeí while 77 (31.7%) as ëagreeí that they preferHalal medicines in their practice, showing a signifi-cant association with respect to respondentsí gender(p = 0.003), race (p < 0.001) and religion (p <0.001). A total of 45 (18.5%) respondents showedtheir response as ëstrongly agreeí while 87 (35.8%)as ëagreeí that they recommend the purchase ofHalal alternatives, which may be more expensive,showing a significant association with respect torespondentsí race (p < 0.001) and religion (p <0.001). It was also found that 48 (19.8%) of therespondents showed their response as ëstronglyagreeí while 114 (47.1%) as ëagreeí that they feel
Table 5. Mean and median score of respondentsí knowledge, attitude, perception and KAP about Halal phar-maceuticals.
Variables Mean ± SD Median (IQR) (25-75)
Knowledge 7.67 ± 1.68 8 (7-9)
Attitude 34.10 ± 5.35 34 (31-36)
Perception 45.73 ± 5.44 45 (43-50)
KAP 87.60 ± 10.37 88 (81-95)

622 SALEHA SADEEQA et al.
that medical representatives are a good source ofinformation about sources and ingredients of drugsfor them showing a significant association withrespect to respondentsí race (p < 0.001) and religion(p < 0.001).
Correlation between knowledge, attitude and per-
ception
Correlations between knowledge, attitude andperception are depicted in Table 6. There was a sig-nificant, positive, and weak correlation (0.20 - 0.29)between knowledge and attitude (r = 0.231, p <0.001) as well as knowledge and perception (r =0.209, p = 0.001), whereas good correlation (0.5 -0.75) between attitude and perception (r = 0.588, p< 0.001). This means that the better knowledge therespondents have on Halal pharmaceuticals, the bet-ter is their perception towards them.
DISCUSSION AND CONCLUSION
This study was conducted to evaluate theknowledge, attitude and perception of doctors work-ing in various government hospitals of Malaysia. Atotal of 243 doctors participated in the survey.Extensive literature review found only one studywhich is conducted regarding Halal pharmaceuticalsamong doctors working in various hospitals (11).Medicines has become a necessity now to maintainhealth. Usually there are three players in this con-text: physicians, pharmacists and consumers (19).Consumers usually cannot judge which medicine issuitable for them. This is then the role of physicianto choose the most suitable medication for his/herpatient keeping in mind the religious beliefs of thepatient as well. Consumers who are the end users ofthe medicines are a key success factor for the treat-ment process. Therefore, any lack of knowledge,misconception or mal practice regarding medicineswould negatively affect on drugs utilization,patientsí quality of life and country resources. Thisis an accepted and undeniable finding that physi-cians are perceived as one of the most knowledge-able healthcare practitioners on drugs and medica-
tions being used. In fact, closer patient-physicianrelationship has resulted in consumer to perceivethat the advice of physician is reliable. Hence,physicianís opinion becomes an important factorwhen it comes to the drug decision making process.An important aspect of consideration when prescrib-ing a medication regimen is the patient him/herself.Individuals have different views on treatment,including the use of certain inactive ingredients inmedications. However, most patients are unaware ofthese ingredients in their medications. The cliniciansand pharmacists should be proactive and not leave itto the patient to broach the subject. Since patientshave the right to make informed decisions abouttheir medical treatment, it is important that health-care providers involve the patient when makingtreatment decisions (20).
In this study we tried to explore the knowledgeof doctors working in hospitals about Halal pharma-ceuticals. Study findings showed that doctors had agood knowledge towards issues surrounding Halalpharmaceuticals. More than 94% of the respondentsscored more than 50% of the knowledge score.Significant association was found between gender,race, religion, years of experience and differentstatements of knowledge.
This study found positive perception aboutHalal pharmaceuticals. Almost all of the respon-dents scored more than 50% of the perception score.A majority of the respondents perceived thatìpatients have a right to ask information aboutsources of ingredients in medicines which are pre-scribed to themî. A large majority of the respon-dents agreed that ëdrug companies should clearlymark medication packaging with ëHalalí or ënonHalalí logo. This approach is also described byKhokhar et al. while discussing faith issues in psy-chopharmacological prescribing (21). This would bea novel and convenient approach, if drug manufac-turers practice to mark drugs clearly about Halal ornon-Halal, then it will be easy for a medical practi-tioner to make a better choice for the patients. Amajority of respondents perceived that doctorsshould be educated more about Halalness of medi-
Table 6. Correlations between knowledge, attitude and perception*.
VariablesNumber. of
respondents (n) p value Correlation (r)
Knowledge-Perception 243 0.001 0.209
Knowledge-Attitude 243 < 0.001 0.231
Attitude-Perception 243 < 0.001 0.588
*Correlation significant at 0.01 levels (2 tailed).

KAP among doctors regarding Halal pharmaceuticals across sectional assessment 623
cines; moreover, doctors should inform theirpatients about Haram ingredients. This is in accor-dance with Newsonís ìClinical Ethics CommitteeCase Reportî in which this issue is highlighted (22).A large majority of respondents perceived thatpatientís religious beliefs impact their adherence todrug therapy. This is in line with Sattar et al. (23),who reported four different cases of patientís non-adherence due to religious beliefs. A majority ofrespondents either strongly agreed or agreed thatpharmaceutical manufacturers should be sensitivetowards the requirements of Muslim patients andwherever possible should produce Halal medicines.This is in accordance with what is reported byBashir et al. (24) while discussing ìConcordance inMuslim patients in primary careî. A large majorityof respondents perceived that drug manufacturersshould provide prescribers with a list of their prod-ucts containing animal-derived ingredients to assistthe prescriber. This approach is in line with what isreported by Hoesli and Smith while discussingeffects of religious and personal beliefs on medica-tion regimen design (20). Significant associationwas found between age, gender, race, religion, yearsof experience, current position (medical officer,house officer or specialist), current area of practiceand different statements of perception.
Study respondents have positive attitudetowards Halal pharmaceuticals. A large majority ofthe respondents scored 50% or more of the attitudescore. A large majority recommended purchasingHalal medicines, taking consent from their patients,educating the patients about Halal ingredients ofmedicine and discussing with their patients aboutHaram ingredients of medicines. Significant associ-ation was found between age, gender, race, religion,years of experience, current position (medical offi-cer, house officer or specialist), current area of prac-tice and different statements of attitude.
A significant, positive correlation was foundbetween knowledge and attitude, attitude and per-ception as well as knowledge and perception. Thismeans that the better knowledge the respondentshave on Halal pharmaceuticals, the better their per-ception will be towards them. A majority of respon-dents perceived that patientís religious beliefsshould be considered while doctors decide medica-tion for them.
Within this context, this research shows thatreligion and spirituality are linked to positive physi-cal and mental health. A study from the Universityof Missouri, Columbia shows that if religious issuesare addressed during treatment, even individualswith disabilities can adjust to their impairments and
it can give a new meaning to their lives (25).Therefore, it is advisable to disseminate adequateinformation about Halal medicines in the Malaysianpopulation. This dissemination of information willresult in building positive perception towards med-ications and an increased treatment outcome, whichis the aim of any therapy.
Summarizing the issue related to Halal phar-maceuticals, it can be said that healthcare continuesto mature. Previously, patient care was largelythought to involve simply the correct application ofmedical science to disease. Today, however, the slo-gan is that ìan ounce of preventionî is often betterthan a ìpound of intervention.î Religious issues docarry their weight and importance to health out-comes. However, a significant question in providingthe best quality of health care is ìhow can we offerour patients, with their rich diversity of religiousbackgrounds, care that is spiritually nurturing andculturally competent?î Addressing concern associ-ated with Halal and Haram in medication use can bethe first step in providing competent and rationalhealthcare.
To summarize this discussion, we can say thatthis study is an indicator that the knowledge, attitudeand perception regarding Halal/Haram status ofmedicines, among doctors working in hospitals,were good where 94%, 98%, and all (except one) ofthe respondents scored 50% and above, respective-ly. Significant correlations were found betweenknowledge and attitude, attitude and perception aswell as knowledge and perception.
Suggestions for further study
This issue is of paramount importance forMuslims as it affects their religious beliefs directlyand should be researched and explored in variousparts of, not only Malaysia but, the entire Muslimworld so that more pertinent results come to the focusof the various players in the field of pharmaceuticals.
REFERENCES
1. Nasaruddin R.R., Fuad F., Mel M., Jaswir I.,Abd. Hamid H.: Advances in Natural andApplied Sciences 6, 588 (2012)..
2. Khattak J Z K, Mir A, Anwar Z, Wahedi H M,Abbas G, Khattak H Z K, & Ismatullah H:Concept of Halal Food and Biotechnology.Advance Journal of Food Science andTechnology 3, 385 (2011).
3. Halal Pharmaceutical, What is Halal? [Online].Available at: http://halalpharmaceuticals.blogspot.com/ (Last accessed on Oct. 18, 2012).

624 SALEHA SADEEQA et al.
4. Easterbrook C., Maddern G.: Arch. Surg. 143,366 (2008).
5. Geraldine M., Ghalamkari H., Beaumont S.,Powell S., McGee P.: Informed Choice InMedicine Taking: Drugs of Porcine Origin &Clinical Alternatives. Medicines Partnership,London 2004.
6. Population and Housing Census, Populationdistribution and basic demographic characteris-tic report 2010, Dept. of Statistics, Malaysia.
7. Halal Industry Development Corporation[Online]. Available at: http:// www.hdcglobal.com/ (Last accessed on Oct. 18, 2012).
8. Department of Islamic Development Malaysia[Online]. Available at:http://www.islam.gov.my (Last accessed onOct. 19, 2012).
9. Halal Agencies in Malaysia [Online]. Availableat: http: //www. Hdcglobal .com /publisher/bhi _halal_agencies (Last accessed on Oct. 10,2012).
10. Malaysia introduces newHalalpharmaceuticalsstandard [Online]. Available at: http://halalme-dia.net/malaysia-introduces-halal-pharmaceuti-cals-standard/ (Last accessed on Mar. 2, 2011).
11. Sadeeqa S., Sarriff A.: J. App. Pharm. Sci. 4(10), 92 (2014).
12. De Bourdeaudhuij I., Klepp K., Due P., RodrigoC.P., De Almeida M., Wind M., Krolner R. etal.: Public Health Nutr. 8, 189 (2005).
13. Oshikoya K.A., Awobusuyi J.O.: BMC Clin.Pharmacol. 9, 14 (2009).
14. Desai C.K., lyer G., Panchal J., Shah S., DikshitR.K.: Perspect. Clin. Res. 2 (4), 129 (2011).
15. GarcÌa C., Llamocca L.P., GarcÌa K., JimÈnezA., Samalvides F., Gotuzzo E., Jacobs J: BMCClin. Pharmacol. 11, 18 (2011).
16. Edwards P., Roberts I., Clarke M.: BMJ 324,1183 (2002).
17. Ndetei D., Khasakhala L., Mutiso V., MbwayoA.: Knowledge, attitude and practice (KAP) ofmental illness among staff in general medicalfacilities in Kenya: practice and policy implica-tions. Afr. J. Psychiatry 14, 225 (2011).
18. Harris I.M., Kingston R.L., Rodriguez R.,Choudary V.: Am. J. Pharm. Educ. 70, 129(2006).
19. Al-Gedadi N.A., Hassali M.A., Shafie A.A:Pharm. Pract. (Granada) 6, 93 (2008).
20. Hoesli T.M, Smith K.M.: Orthopedics 34, 292(2011).
21. Khokhar W.A., Hameed I., Ali M.M., Sadiq J.,Bowie P.: Psychiatric Bull. 32, 179 (2008).
22. Newson A.J.: Clin. Ethics 5, 7 (2010).23. Sattar S.P. Ahmed M.S., Majeed F., Petty F.:
Ann. Pharmacother. 38, 621 (2004).24. Bashir A., Asif M., Lacey F., Langley C.,
Marriott J., Wilson K.: Int. J. Pharm. Pract. 9(S1), 78 (2001).
25. Science Daily: Religion and Healthcare shouldmix, study says. Available at: http://www.sci-encedaily.com/releases/2007/10/071023104134.htm. Available at: http://www.halal.gov.my/v3/index.php/en/ (Last accessed on Dec. 11, 2013).
Received: 4. 05. 2014

Erratum 625
In the paper: ÑNEW RENIN INHIBITORS CONTAINING PHENYLALANYLHISTIDYL-γ-AMINO ACIDDERIVATIVES IN P3- P1 POSITIONî Vol. 71 (1), pp. 59-69 (2014) the following text was omitted:
Acknowledgment
This research project was financed from budget resources (2010-2014) ñ grant no. NN405357939.
In the paper: ìFULLERENES AS THE CARRIERS OF COMPOUNDS WITH AMIDE BONDî Vol. 71 (6),pp. 1073-1078 (2014) and in the respective page of contents of this issue, the following authorship should beread:
MONIKA K. GRUDZIE—1*, MARCIN SUSKIEWICZ1, EDITA AJMANOVI»1, MARZENA M DREK1,FRANCISZEK A. PLUCI—SKI2 and ALEKSANDER P. MAZUREK1,2
1 Department of Drug Chemistry, Faculty of Pharmacy, Medical University of Warsaw,1 Banacha St., 02-097 Warszawa, Poland
2 National Medicines Institute, 30/34 Che≥mska St., 00-725 Warszawa, Poland


Submission of the manuscript
All papers (in duplicate and electronic version) should be submitteddirectly to Editor:
Editor Acta Poloniae Pharmaceutica ñDrug Research16 D≥uga St.00-238 WarsawPoland
We understand that submitted papers are original and not publishedelsewhere.
Authors submitting a manuscript do so on the understandingthat if it is accepted for publication, copyright of the article shall beassigned exclusively to the Publisher.
Scope of the Journal
Acta Poloniae Pharmaceutica - Drug Research publishes papers in allareas of research. Submitted original articles are published in the fol-lowing sections: Reviews, Analysis, Biopharmacy, Drug Biochemistry,Drug Synthesis, Natural Drugs, Pharmaceutical Technology, Pharmacology,Immunopharmacology, General. Any paper that stimulates progress indrug research is welcomed. Both, Regular Articles as well as ShortCommunications and Letters to the Editor are accepted.
Preparation of the manuscript
Articles should be written in English, double-spaced. Full name (first,middle initial, last) and address of authors should follow the title writ-ten in CAPITAL LETTERS. The abstract should be followed by key-words. We suggest the following structure of paper: l) introduction, 2)experimental, 3) results, 4) discussion and conclusion.
Instructions for citation of references in the e-journal:
1. In the text, sequential numbers of citations should be in order ofappearance (not alphabetically) in parentheses (...) not in brackets[Ö].2. In the list of references, for papers the correct order is: number ofreference with dot, family name and initial(s) of author(s), colon,proper abbreviation(s) for journal (Pubmed, Web of Science, no dotneither coma after one word journal name), number of volume, num-ber of issue (if necessary) in parantheses. first page or number of thepaper, year of publication (in parentheses), dot. For books: numberof reference with dot, family name and initial(s) of author(s), colon,title of chapter and/or book names and initials of editors (if any), edi-tion number, page(s) of corresponding information (if necessary),publisher name, place and year of publication.
EXAMPLES:
1. Gadzikowska M., Grynkiewicz G.: Acta Pol. Pharm. Drug Res.59, 149 (2002).
2. Gilbert A.M., Stack G.P., Nilakantan R., Kodah J., Tran M. etal.: Bioorg. Med. Chem. Lett. 14, 515 (2004).
3. Roberts S.M.: Molecular Recognition: Chemical andBiochemical Problems, Royal Society of Chemistry, Cambridge1989.
4. Salem I.I.: Clarithromycin, in Analytical Profiles of DrugSubstances And Excipients. Brittain H.G. Ed., pp. 45-85,Academic Press, San Diego 1996.
5. Homan R.W., Rosenberg H.C.: The Treatment of Epilepsy,Principles and Practices. p. 932 , Lea & Febiger, Philadelphia1993.
6. Balderssarini R.J.: in The Pharmacological Basis ofTherapeutics, 8th edn., Goodman L., Gilman A., Rall T.W., NiesA.S., Taylor P. Eds., Vol 1, p. 383, Pergamon Press, MaxwellMacmillan Publishing Corporation, New York 1985.
7. International Conference on Harmonization Guidelines,Validation of analytical procedures, Proceeding of theInternational Conference on Harmonisation (ICH), Commissionof the European Communities, Geneva 1996.
8. http://www.nhlbi.nih.gov/health/health-topics/topics/ms/(accessed on 03. 10. 2012).
Chemical nomenclature should follow the rules established bythe International Union of Pure and Applied Chemistry, theInternational Union of Biochemistry and Chemical Abstracts Service.Chemical names of drugs are preferred. If generic name is employed,its chemical name or structural formula should be given at point of firstcitation.
Articles should be written in the Past Tense and Impersonalstyle. I, we, me, us etc. are to be avoided, except in the Acknow-ledgment section.
Editor reserves the right to make any necessary corrections to apaper prior to publication.
Tables, illustrations
Each table, figure or scheme should be on a separate pagetogether with the relevant legend and any explanatory notes. Tablesideally should not have more than 70, and certainly not more than 140,characters to the line (counting spaces between columns 4 characters)unless absolutely unavoidable.
Good quality line drawings using black ink on plain A4 paperor A4 tracing paper should be submitted with all lettering etc., includ-ed. Good black and white photographs are also acceptable. Captions forillustrations should be collected together and presented on a separatesheet.
All tables and illustrations should be specially referred to in thetext.
Short Communications and Letters to the Editor
The same general rules apply like for regular articles, exceptthat an abstract is not required, and the number of figures and/or tablesshould not be more that two in total.
The Editors reserve the right to publish (upon agreement ofAuthor(s) as a Short Communication a paper originally submitted as afull-length research paper.
Preparation of the electronic manuscript
We encourage the use of Microsoft Word, however wewill accept manuscripts prepared with other software. Compact Disc -Recordable are preferred. Write following information on the disklabel: name the application software, and the version number used(e.g., Microsoft Word 2007) and specify what type of computer wasused (either IBM compatible PC or Apple MacIntosh).
Fee for papers accepted for publication
Since January 2013 there is a publication fee for papers accepted forpublication in Acta Poloniae Pharmaceutica Drug Research.The fee - 1000 PLN, should be paid before publication on the bankaccount: Polish Pharmaceutical Society, D≥uga 16, 00-238 WarszawaMillennium S.A. account no. 29 1160 2202 0000 0000 2770 0281with a note Ñpublication in Acta Pol. Pharm. Drug Res., paper no.ÖÖ..
For foreign authors the payment (250 �) should be done according tothe data:1. SWIFT Address: BANK MILLENNIUM SA, 02-593 WARSZA-
WA, POLAND, STANIS£AWA ØARYNA 2A St.2. SWIFT CODE: BIGBPLPWXXX3. Beneficiary account Number: PL 30 1160 2202 0000 0000 2777
0200 4. Bank Name: BANK MILLENNIUM SA5. Favoring: POLSKIE TOWARZYSTWO FARMACEUTYCZNE
(Polish Pharmaceutical Society), D£UGA 16, 00-238 WAR-SZAWA, Poland, NIP 526-025-19-54
6. Purpose of sending money: Publication in Acta Pol. Pharm. DrugRes., paper no. Ö..
For payments by Western Union, the name of recipient is KatarzynaTrembulak at the address of Polish Pharmaceutical Society (see above).
Instruction for Authors