Acta Orthopaedica 2015; 86 (1): x–x 1 -...
8
Acta Orthopaedica 2015; 86 (1): x–x 1 Improved survival for anatomic total shoulder prostheses Results of 4,173 shoulder arthroplasties reported to the Norwegian Arthro- plasty Register from 1994 through 2012 Bjørg T S FEVANG 1,2,3 , Tone W NYSTAD 1,3 , Arne SKREDDERSTUEN 3 , Ove N FURNES 3,4 , and Leif I HAVELIN 3,4 1 Department of Rheumatology, Haukeland University Hospital; 2 Department of Clinical Science, University of Bergen; 3 The Norwegian Arthroplasty Register, Department of Orthopaedic Surgery, Haukeland University Hospital; 4 Department of Clinical Medicine, University of Bergen, Bergen, Norway. Correspondence: [email protected] Submitted 2014-05-22. Accepted 2014-09-11. Open Access - This article is distributed under the terms of the Creative Commons Attribution Noncommercial License which permits any noncommercial use, distribution, and reproduction in any medium, provided the source is credited. DOI 10.3109/17453674.2014.984113 Background and purpose — Previously, implant survival of total shoulder prostheses was reported to be inferior to that of hemiprostheses. However, the use of total prostheses has increased in Norway due to reported good functional results. On this back- ground, we wanted to study implant survival of 4 major shoulder prosthesis types in Norway between 1994 and 2012. Patients and methods — The study population comprised 4,173 patients with shoulder replacements reported to the Norwegian Arthroplasty Register, including 2,447 hemiprostheses (HPs), 444 anatomic total prostheses (ATPs), 454 resurfacing prosthe- ses (RPs), and 828 reversed total prostheses (RTPs). Three time periods were compared: 1994–1999, 2000–2005, and 2006–2012. Kaplan-Meier failure curves were used to compare implant fail- ure rates for subgroups of patients, and adjusted risks of revision were calculated using Cox regression analysis. Results — For prostheses inserted from 2006 through 2012, the 5-year survival rates were 95% for HPs (as opposed to 94% in 1994–1999), 95% for ATPs (75% in 1994–1999), 87% for RPs (96% in 1994–1999), and 93% for RTPs (91% in 1994–1999). During the study period, the implant survival improved signifi- cantly for ATPs (p < 0.001). A tendency of better results with acute fracture and worse results in sequelae after previous fractures was seen in all time periods. Interpretation — The 5-year implant survival rates were good with all prosthesis types, and markedly improved for anatomic total prostheses in the last 2 study periods. The better functional results with total shoulder prostheses than with hemiprostheses support the trend towards increased use of total shoulder pros- theses. In a previous study from the Norwegian Arthroplasty Regis- ter (NAR), we reported superior results in terms of prosthesis survival with shoulder hemiprostheses (HPs) than with total prostheses (TPs), both anatomic and reverse (Fevang et al. 2009). However, several other studies have shown better func- tional results with the use of TPs than with HPs (Bryant et al. 2005, Pfahler et al. 2006, Radnay et al. 2007), and in a recent report from the NAR in which functional outcome was evalu- ated, patients with HPs came out worst for all variables mea- sured (Fevang et al. 2013). Based on these studies and treat- ment practice in other countries, a change in treatment policy has taken place in Norway—towards reduced use of HPs and increasing use of TPs, both anatomic and reversed types. The increasing volume of shoulder arthroplasty surgery in general, and also the relative increase in the use of TPs compared to HPs, will undoubtedly have increased the experience of Nor- wegian surgeons with shoulder arthroplasty surgery in gen- eral and insertion of TPs in particular. With this background, we wanted to compare the results of shoulder arthroplasties in Norway over 3 time periods (1994–1999, 2000–2005, and 2006–2012) in order to determine whether this change in treatment policy has improved results in terms of prosthesis survival for total prostheses. Patients and methods The NAR started collection of data on shoulder prostheses in 1994. All Norwegian hospitals performing shoulder arthro- plasty surgery report to the registry and the completeness of the data is good (Espehaug et al. 2006). Surgeons report primary Acta Orthop Downloaded from informahealthcare.com by Helse Bergen - Haukeland universitetssykehus on 11/26/14 For personal use only.
Transcript of Acta Orthopaedica 2015; 86 (1): x–x 1 -...

Acta Orthopaedica 2015; 86 (1): x–x 1
Improved survival for anatomic total shoulder prostheses Results of 4,173 shoulder arthroplasties reported to the Norwegian Arthro-plasty Register from 1994 through 2012
Bjørg T S FevANg1,2,3, Tone W NySTAd1,3, Arne SkReddeRSTueN3, Ove N FuRNeS3,4, and Leif I HAveLIN3,4
1 department of Rheumatology, Haukeland university Hospital; 2 department of Clinical Science, university of Bergen; 3 The Norwegian Arthroplasty Register, department of Orthopaedic Surgery, Haukeland university Hospital; 4 department of Clinical Medicine, university of Bergen, Bergen, Norway.Correspondence: [email protected] Submitted 2014-05-22. Accepted 2014-09-11.
Open Access - This article is distributed under the terms of the Creative Commons Attribution Noncommercial License which permits any noncommercial use, distribution, and reproduction in any medium, provided the source is credited.DOI 10.3109/17453674.2014.984113
Background and purpose — Previously, implant survival of total shoulder prostheses was reported to be inferior to that of hemiprostheses. However, the use of total prostheses has increased in Norway due to reported good functional results. On this back-ground, we wanted to study implant survival of 4 major shoulder prosthesis types in Norway between 1994 and 2012.
Patients and methods — The study population comprised 4,173 patients with shoulder replacements reported to the Norwegian Arthroplasty Register, including 2,447 hemiprostheses (HPs), 444 anatomic total prostheses (ATPs), 454 resurfacing prosthe-ses (RPs), and 828 reversed total prostheses (RTPs). Three time periods were compared: 1994–1999, 2000–2005, and 2006–2012. Kaplan-Meier failure curves were used to compare implant fail-ure rates for subgroups of patients, and adjusted risks of revision were calculated using Cox regression analysis.
Results — For prostheses inserted from 2006 through 2012, the 5-year survival rates were 95% for HPs (as opposed to 94% in 1994–1999), 95% for ATPs (75% in 1994–1999), 87% for RPs (96% in 1994–1999), and 93% for RTPs (91% in 1994–1999). During the study period, the implant survival improved signifi-cantly for ATPs (p < 0.001). A tendency of better results with acute fracture and worse results in sequelae after previous fractures was seen in all time periods.
Interpretation — The 5-year implant survival rates were good with all prosthesis types, and markedly improved for anatomic total prostheses in the last 2 study periods. The better functional results with total shoulder prostheses than with hemiprostheses support the trend towards increased use of total shoulder pros-theses.
In a previous study from the Norwegian Arthroplasty Regis-ter (NAR), we reported superior results in terms of prosthesis survival with shoulder hemiprostheses (HPs) than with total prostheses (TPs), both anatomic and reverse (Fevang et al. 2009). However, several other studies have shown better func-tional results with the use of TPs than with HPs (Bryant et al. 2005, Pfahler et al. 2006, Radnay et al. 2007), and in a recent report from the NAR in which functional outcome was evalu-ated, patients with HPs came out worst for all variables mea-sured (Fevang et al. 2013). Based on these studies and treat-ment practice in other countries, a change in treatment policy has taken place in Norway—towards reduced use of HPs and increasing use of TPs, both anatomic and reversed types. The increasing volume of shoulder arthroplasty surgery in general, and also the relative increase in the use of TPs compared to HPs, will undoubtedly have increased the experience of Nor-wegian surgeons with shoulder arthroplasty surgery in gen-eral and insertion of TPs in particular. With this background, we wanted to compare the results of shoulder arthroplasties in Norway over 3 time periods (1994–1999, 2000–2005, and 2006–2012) in order to determine whether this change in treatment policy has improved results in terms of prosthesis survival for total prostheses.
Patients and methods
The NAR started collection of data on shoulder prostheses in 1994. All Norwegian hospitals performing shoulder arthro-plasty surgery report to the registry and the completeness of the data is good (Espehaug et al. 2006). Surgeons report primary
Act
a O
rtho
p D
ownl
oade
d fr
om in
form
ahea
lthca
re.c
om b
y H
else
Ber
gen
- H
auke
land
uni
vers
itets
syke
hus
on 1
1/26
/14
For
pers
onal
use
onl
y.

2 Acta Orthopaedica 2015; 86 (1): x–x
operations and revisions, and the form filled in by the oper-ating surgeon contains information on patient characteristics, diagnosis, and data regarding the surgery and implant. Data on death or emigration are obtained from Statistics Norway. More than 1 diagnosis may be recorded for each patient, but for the present study, each patient was allocated 1 diagnosis according to a system in which the diagnoses were ranked as follows: osteoarthritis (OA) which ranked lowest, rheumatoid arthritis (RA), fracture sequelae (FS), and acute fracture (AF) which ranked highest. The outcome in this study was prosthe-sis survival or failure. We did not evaluate functional results.
As the aim of this study was to compare the results of 4 major prosthesis categories within 3 time periods, only patients with the 4 most frequent diagnoses (OA, RA, FS, and AF) were included in order to obtain comparable homogenous patient groups. Patients in whom the shoulder arthroplasty was inserted due to a malignant tumor were excluded (n = 19). Furthermore, 346 patients with the following diagnoses were excluded: rotator cuff arthropathy (n = 109), sequela after lig-ament damage (n = 39), sequela after dislocation (n = 21), pso-riatic arthritis (33), ankylosing spondylitis (21), osteonecrosis (n = 24), sequela after infection (n = 19), and other diagnosis (n = 80). Additionally, 83 patients were excluded because of missing values for one of the crucial variables (patient char-acteristics, date of surgery, type of prosthesis, or outcome). Eventually, 4,173 patients (3,166 women (76%) and 1,007 men (24%)) remained for inclusion, 1,398 with OA, 811 with RA, 787 with FS, and 1,177 with AF.
Patients were followed from their primary arthroplasty until revision, death, emigration, or end of follow-up (December 31, 2012). In order to study a possible change in results according to change in treatment policy, the patients were divided into 3 groups according to the year of primary surgery: 1994–1999, 2000–2005, and 2006–2012 (Table 1). Furthermore, they were grouped according to prosthesis type: hemiprosthesis (HP, n = 2,447), anatomic total prosthesis (ATP, n = 444), resurfac-ing prosthesis (RP, n = 454)—which were all hemiprosthe-ses—and reversed total prosthesis (RTP, n = 828) (Table 1 and Figure 1). Several different prosthesis brands were used and the complete list can be found in the 2012 annual report from the NAR: http://nrlweb.ihelse.net/Rapporter/Rapport2013.pdf.
Type of fixation was registered in all but 149 cases, which were excluded from the analysis addressing prosthesis fixa-tion (Table 1 and Figure 4). The term hybrid fixation refers to implant fixation where one component is inserted using cement and the other without cement. In 2006–2012, most RTPs were inserted with cementation of the humeral compo-nent without cementation of the glenoid component. Separate survival analyses were done comparing type of fixation for each prosthesis type within each of the 3 time periods. These figures are not presented, but some results are given. For TPs, the term Global denotes a combination of a Global cup and Global Advantage stem.
StatisticsWe used unadjusted Kaplan-Meier failure plots to illustrate dif-ferences in prosthesis failure between patients operated during the 3 different time periods for each of 4 different prosthesis types (Figure 2). Cumulative failure between the prosthesis types within 1 of 3 given time periods was compared (Figure 3) and plots according to mode of fixation were estimated for each prosthesis type (Figure 4). Since the prosthesis brands differed to some extent between the 3 study periods, separate analyses were performed comparing the most commonly used brands of each prosthesis type (Figure 5).
We used Cox regression to analyze the risk of revision for the total study period (Table 4) and within 3 different time periods, with adjustment for age, sex, diagnosis, and prosthe-sis type (Table 5). Method of fixation (cemented, uncemented, or hybrid) was not included in the regression analysis, as the impact of this variable is different for each prosthesis type. Instead, Kaplan-Meier failure plots illustrating the impact of fixation are presented (Figure 4). For RTPs, only patients with uncemented or hybrid fixation were included in the analysis because the number of cemented RTPs was low (n = 35).
Table 1. Sex, age, and mode of fixation during 3 time periods for hemiprostheses (HPs), anatomic total prostheses (ATPs), resurfac-ing prostheses (RPs), and reversed total prostheses (RTPs)
Variable HP ATP RP RTP Time period n = 2,447 n = 444 n = 454 n = 828
Sex, % women 1994–1999, n = 737 80 84 71 82 2000–2005, n = 981 81 45 73 85 2006–2012, n = 2,455 77 61 57 81Mean age (SD) 1994–1999, n = 737 68 (12) 70 (9.3) 64 (15) 67 (11) 2000–2005, n = 981 71 (11) 64 (14) 68 (11) 71 (11) 2006–2012, n = 2,455 72 (11) 68 (9.1) 64 (12) 73 (9.4)Fixation, % a
1994–1999 Cemented 48 31 98 b 1 Uncemented 52 65 2 96 Hybrid – 4 – 3 2000–2005 Cemented 70 33 0 11 Uncemented 30 59 100 b 59 Hybrid – 8 – 30 2006–2012 Cemented 75 65 1 4 Uncemented 25 18 99 b 40 Hybrid – 17 – 56 c
HP: hemiprosthesis; ATP: anatomic total prosthesis; RP: resurfacing prosthesis; RTP: reversed total prosthesis.a Percentage of HPs, TPs, RFs, and RTPs that were cemented,
uncemented, or hybrid/inverse hybrid.b In the period 1994–1999, only Scan resurfacing prostheses were
used and they were all cemented. After this, the Scan prostheses were not used and the new resurfacing prostheses were mainly uncemented.
c Almost exclusively cemented humeral component and uncemented glenoid component.
Act
a O
rtho
p D
ownl
oade
d fr
om in
form
ahea
lthca
re.c
om b
y H
else
Ber
gen
- H
auke
land
uni
vers
itets
syke
hus
on 1
1/26
/14
For
pers
onal
use
onl
y.

Acta Orthopaedica 2015; 86 (1): x–x 3
Results
During the study period, there was a change in treatment policy in Norway from almost exclusive use of hemiprosthe-ses to increasing use of anatomic and reverse total prostheses (Figure 1). This development was seen in patients with all 4 major diagnoses, but to a lesser degree in patients with AF (Table 2).
For patients with RA or fracture sequelae, the use of RTPs in particular increased, while for those with osteoarthritis, an increasing use of ATPs was seen. For HPs and RTPs, there was an increase in patient age at the time of surgery, but this was not seen for ATPs and RPs (Table 1). Prosthesis fixation also changed, with increasing use of cementation for HPs and ATPs. For the RTPs, a change took place from almost exclu-sive use of uncemented fixation during the first time period to mostly hybrid fixation in the last time period (Table 1). The cemented Scan prosthesis was the only resurfacing prosthe-sis used in 1994–1999. After this, the use of Scan prostheses ceased and the new RPs were uncemented (Table 1).
Prosthesis survivalWhen we analyzed all the prosthesis types together, the pros-thesis survival remained unchanged during the study period (Table 3). Also, in the overall study period, those patients with AF had the lowest risk of revision, RA and OA patients had similar results, while FS patients had a 1.5 times higher risk of revision than OA patients (p = 0.008) (Table 3). Furthermore, in the overall analysis RPs and RTPs had worse results than HPs and ATPs, which had similar results (Table 3).
For prostheses inserted in the period 1994–1999, the 5-year cumulative survival rate for HPs was 94%; that for ATPs was 75%, that for RPs was 96%, and that for RTPs was 91%. The 5-year survival figures were as follows for prostheses inserted in the period 2006–2012: 95% for HPs, 95% for ATPs, 87% for RPs, and 93% for RTPs.
During the study period, a trend of improvement in results was seen for HPs (Figure 2) while the prosthesis survival improved markedly for ATPs (p < 0.001) (Figure 2). A trend of increased prosthesis failure was seen for RPs (Figure 2), while no significant change in prosthesis failure was detected for RTPs (Figure 2).
Table 2. Percentage of patients with a given diagnosis having the 4 different prosthesis types inserted, over 3 time periods
Diagnosis, % a HP ATP RP RTP Total Time period n = 2,447 n = 444 n = 454 n = 828 n = 4,173
Osteoarthritis 1994–1999 72 13 6 9 119 2000–2005 54 7 27 12 291 2006–2012 25 33 20 23 988Rheumatoid arthritis 1994–1999 67 3 11 20 334 2000–2005 58 2 15 25 197 2006–2012 24 8 23 46 280Acute fracture 1994–1999 96 0 3 1 152 2000–2005 99 0 0 1 274 2006–2012 86 1 0 13 751Fracture sequelae 1994–1999 80 6 6 8 132 2000–2005 81 2 6 11 219 2006–2012 47 8 5 39 436
For abbreviations, see Table 1.a Percentage of patients with a given diagnosis during one of 3 time
periods, who had a HP, ATP, RP, or RTP.
Figure 1. Numbers of prostheses each year from 1994 through 2012
Table 3. Overall survival and risk of revision according to major explanatory factors
Variable Category S5 a S10 a RR 95% CI p-value
Gender Male 90 85 1 Female 93 90 0.8 0.6–1.0 0.08Age, years 19–69 90 85 1 ≥ 70 95 93 0.6 0.5–0.7 < 0.001Diagnosis OA 91 87 1 RA 92 88 0.9 0.7–1.3 0.6 AF 97 96 0.5 0.3–0.8 0.002 FS 88 85 1.5 1.1–2.1 0.008Prosthesis HP 94 91 1 ATP 92 87 1.3 0.9–2.1 0.2 RP 88 83 1.7 1.2–2.4 0.001 RTP 92 85 1.7 1.3–2.3 0.001Time period 1994–1999 93 89 1 2000–2005 92 89 1.0 0.7–1.4 1.0 2006–2012 93 - 0.9 0.6–1.2 0.4
OA: osteoarthritis; RA: rheumatoid arthritis; AF: acute fracture; FS: fracture sequela; HP, ATP, RP, RTP: see Table 1.a Unadjusted 5- and 10-year survival, in per cent.
Act
a O
rtho
p D
ownl
oade
d fr
om in
form
ahea
lthca
re.c
om b
y H
else
Ber
gen
- H
auke
land
uni
vers
itets
syke
hus
on 1
1/26
/14
For
pers
onal
use
onl
y.
4 Acta Orthopaedica 2015; 86 (1): x–x
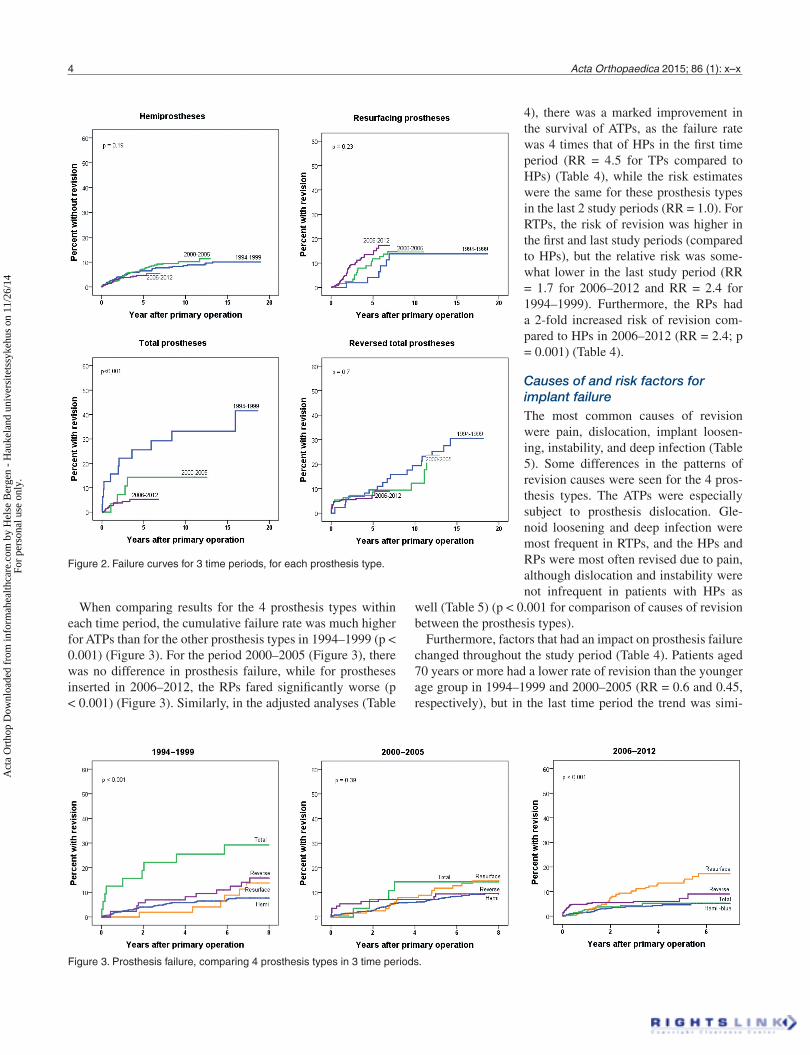
When comparing results for the 4 prosthesis types within each time period, the cumulative failure rate was much higher for ATPs than for the other prosthesis types in 1994–1999 (p < 0.001) (Figure 3). For the period 2000–2005 (Figure 3), there was no difference in prosthesis failure, while for prostheses inserted in 2006–2012, the RPs fared significantly worse (p < 0.001) (Figure 3). Similarly, in the adjusted analyses (Table
well (Table 5) (p < 0.001 for comparison of causes of revision between the prosthesis types).
Furthermore, factors that had an impact on prosthesis failure changed throughout the study period (Table 4). Patients aged 70 years or more had a lower rate of revision than the younger age group in 1994–1999 and 2000–2005 (RR = 0.6 and 0.45, respectively), but in the last time period the trend was simi-
Figure 2. Failure curves for 3 time periods, for each prosthesis type.
Figure 3. Prosthesis failure, comparing 4 prosthesis types in 3 time periods.
4), there was a marked improvement in the survival of ATPs, as the failure rate was 4 times that of HPs in the first time period (RR = 4.5 for TPs compared to HPs) (Table 4), while the risk estimates were the same for these prosthesis types in the last 2 study periods (RR = 1.0). For RTPs, the risk of revision was higher in the first and last study periods (compared to HPs), but the relative risk was some-what lower in the last study period (RR = 1.7 for 2006–2012 and RR = 2.4 for 1994–1999). Furthermore, the RPs had a 2-fold increased risk of revision com-pared to HPs in 2006–2012 (RR = 2.4; p = 0.001) (Table 4).
Causes of and risk factors for implant failureThe most common causes of revision were pain, dislocation, implant loosen-ing, instability, and deep infection (Table 5). Some differences in the patterns of revision causes were seen for the 4 pros-thesis types. The ATPs were especially subject to prosthesis dislocation. Gle-noid loosening and deep infection were most frequent in RTPs, and the HPs and RPs were most often revised due to pain, although dislocation and instability were not infrequent in patients with HPs as
Act
a O
rtho
p D
ownl
oade
d fr
om in
form
ahea
lthca
re.c
om b
y H
else
Ber
gen
- H
auke
land
uni
vers
itets
syke
hus
on 1
1/26
/14
For
pers
onal
use
onl
y.

Acta Orthopaedica 2015; 86 (1): x–x 5
lar but not statistically significant (RR = 0.7 for the older age group compared to the younger one; p = 0.1) (Table 4). A tendency of better prognosis in acute fracture (AF) patients and worse prognosis in patients with sequelae after previous fractures (FS) was seen in all time periods, but was only statis-tically significant for patients with AF in 2000–2005 and for patients with fracture sequelae in the last time period (2006–2012) (Table 4).
In patients with HPs, the best results were seen when the prostheses were cemented (Figure 4). This was seen for HPs in all 3 time periods, but it was statistically significant only in the last 2 periods (p = 0.07, 0.01, and 0.005 for 1994–1999, 2000–2005, and 2016–2012, respectively). While there was a similar trend of worse results for uncemented prostheses in the 3 other prosthesis types (Figure 4), no statistically signifi-cant differences were seen—although RTPs with hybrid fixa-
tion appeared to fare better than uncemented ones (p = 0.08) (Figure 4D). In the analyses of each study period, no signifi-cant differences in survival were seen for ATPs with the differ-ent types of fixation (p = 0.51, 0.69, and 0.85 for the periods 1994–1999, 2000–2005, and 2016–2012, respectively).
Impact of prosthesis brandTo investigate whether the differences in results were due to prosthesis brands that were particularly superior, separate analyses were performed for the most commonly used brands of each prosthesis type (Figure 5). There was no great differ-ence in survival for the 5 most commonly used hemiprosthe-ses, but better results were seen with the most recently used ATPs, Aequalis and Global (p < 0.001), than with brands used in the earlier periods. A separate analysis comparing only prostheses inserted from 2002 and later revealed the same, with statistically significantly better results for the Aequalis and Global than for the Bio-Modular (analysis not shown), and the use of the Bio-Modular had almost ceased in the last study period (only 6 cases). No significant differences were seen for the most common resurfacing prosthesis brands and reversed prosthesis brands (Figure 5C and D).
discussion
The main finding of this study was a marked improvement in prosthesis survival for anatomic total shoulder prostheses. A change towards older patients and more cemented prostheses may partly explain this improvement. Furthermore, new pros-thesis types that were used in the last 2 study periods gave markedly better results. However, the improved results may also have been caused by a positive learning curve among the operating surgeons performing more ATPs in general. This finding contrasts that of our previous article evaluating shoul-
Table 4. Risk of revision during 3 time periods according to major explanatory factors
Time period Variable Category RR 95% CI p-value
1994–1999 Sex Male 1 Female 0.8 0.5–1.4 0.5 Age, years 19–69 1 ≥70 0.6 0.3–0.9 0.02 Diagnosis OA 1 RA 1.0 0.5–2.0 0.9 AF 0.5 0.2–1.5 0.2 FS 1.2 0.6–2.6 0.6 Prosthesis HP 1 ATP 4.5 2.3–9.0 < 0.001 RP 1.2 0.5–2.8 0.7 RTP 2.4 1.4–4.1 0.0022000–2005 Sex Male 1 Female 0.9 0.6–1.5 0.8 Age, years 19–69 1 ≥70 0.45 0.3–0.7 0.001 Diagnosis OA 1 RA 0.7 0.4–1.2 0.2 AF 0.4 0.2–0.8 0.008 FS 1.3 0.8–2.2 0.3 Prosthesis HP 1 ATP 1.0 0.3–2.8 1.0 RP 1.3 0.7–2.2 0.5 RTP 1.2 0.6–2.2 0.62006–2012 Sex Male 1 Female 0.7 0.5–0.99 0.05 Age, years 19–69 1 ≥70 0.7 0.5–1.1 0.1 Diagnosis OA 1 RA 1.0 0.6–1.8 0.9 AF 0.6 0.3–1.2 0.2 FS 1.9 1.2–2.9 0.008 Prosthesis HP 1 ATP 1.0 0.5–1.9 1.0 RP 2.4 1.4–4.1 0.001 RTP 1.7 1.0–2.8 0.03
For abbreviations, see Table 3.
Table 5. Causes of revision for the 4 major prosthesis types
HP ATP RP RTP n = 2,447 n = 444 n = 454 n = 828
Loosening glenoid - 6 - 24Loosening humerus 14 1 7 12Dislocation 19 11 2 19Instability 18 3 5 6Deep infection 12 1 3 11Pain 81 7 43 4Other a 39 3 14 7
Total b 147 29 57 67
For abbreviations, see Table 1.a Including worn polyethylene insert, periprosthetic fractures, axis
deviation, dysfunction, and other.b Total number of revisions within each prosthesis group. More than
one cause of revision could be registered for each patient, giving a sum of all causes that was greater than the total number of revision operations.
Act
a O
rtho
p D
ownl
oade
d fr
om in
form
ahea
lthca
re.c
om b
y H
else
Ber
gen
- H
auke
land
uni
vers
itets
syke
hus
on 1
1/26
/14
For
pers
onal
use
onl
y.

6 Acta Orthopaedica 2015; 86 (1): x–x
Figure 4. Prosthesis failure according to type of fixation, for each prosthesis type.
der prosthesis survival, where failure rates of total prostheses were found to be high (Fevang et al. 2009). Cochrane reviews (Bryant et al. 2005, Singh et al. 2010) and reports from our own studies (Fevang et al. 2012, Fevang et al. 2013) show-ing superior functional results with ATPs may have contrib-uted to the increasing use of such prostheses in Norway. This has most likely resulted in improvements in surgical experi-ence and skills with these prostheses, ultimately leading to improved implant survival.
A marked change in mode of fixation from 31% to 65% cementation was seen for ATPs. Although we were unable to detect a statistically significant effect of fixation type on sur-vival of ATPs, even in the sub-analyses for each time period, it is noteworthy that the change in type of fixation coincided with the improvement in survival results.
The Aequalis and Global ATPs gave better results than the 2 other most frequently used ATP brands in the study. This could be due to frequent use (n = 192 for Aequalis as compared to 42 for Bio-Modular) and consequent improved surgical experi-ence with the prostheses, or it could be due to superior implant quality. The use of these prostheses in the last study period may have contributed to the increased survival of ATPs in that study period.
lund and Nyberg 2011, Young et al. 2011) and we recently found that reversed prostheses resulted in less pain and better function than anatomic total prostheses and hemiprostheses in RA patients (Fevang et al. 2013). In accordance with these publications, we found a marked increase in the use of RTPs in patients with RA in the present study.
The implant failure rate was somewhat higher for RTPs than for HPs in the first and last study periods (Table 5). One reason for the higher failure rate with RTPs may be that they might have been selected for patients with shoulders that were particularly badly damaged. Adjusting for diagnosis in the regression analysis may only control for this to some extent, as these prostheses are used in patients with injured rotator cuffs, irrespective of diagnosis. Even among patients with OA an increasing use of RTPs was seen, probably comprising OA patients with particularly ruined shoulders. Rotator cuff dis-ease has previously been shown to be a risk factor for revi-sion after total shoulder arthroplasty (Singh et al. 2011). In addition, RTPs inserted in our last study period had excellent 5-year results, particularly the Delta Xtend, but as RTPs have previously had inferior long-term results, these new prosthe-sis types must be followed up further. Taking into account the probably worse preoperative status of RTP shoulders and the
In a study of patients who were oper-ated from 1995 through 2005, no statis-tically significant difference in implant survival rate was seen between total prostheses and hemiprostheses (Farng et al. 2011). The 5-year implant survival for both TPs and HPs was around 93% in that study, closely resembling the values in our study (94% for HPs and 92% for ATPs) (Table 4). Furthermore, the 5-year survival of ATPs during our last study period (95%) compares well with that reported by Singh et al. (2011), although their 10-year estimate (90%) was better than the overall 10-year sur-vival in our study (87%) (Table 4).
Destruction of the glenohumeral joint is often accompanied by rotator cuff damage in patients with RA. In such patients, the insertion of ATPs or HPs is often followed by secondary rotator cuff failure and subsequent proximal humeral migration (Sneppen et al. 1996, Stewart and Kelly 1997, Betts et al. 2009). Thus, in these patients, ATPs have not been shown to give better functional results than hemiprostheses (Trail and Nuttall 2002, Sperling et al. 2007). However, good results with the use of RTPs have been demonstrated in RA patients (Hol-comb et al. 2010, John et al. 2010, Eke-
Act
a O
rtho
p D
ownl
oade
d fr
om in
form
ahea
lthca
re.c
om b
y H
else
Ber
gen
- H
auke
land
uni
vers
itets
syke
hus
on 1
1/26
/14
For
pers
onal
use
onl
y.

Acta Orthopaedica 2015; 86 (1): x–x 7
Figure 5. Prosthesis failure according to brand, for each prosthesis type.
good functional results, there appears to be good reasons to continue the use of RTPs in the right patients—mainly RA and FS patients with rotator cuff damage—in whom good func-tional results using RTP have been demonstrated (Fevang et al. 2013).
Failure rates for resurfacing prostheses appeared to be higher in the last study period (Figure 2), and compared to HPs the difference in revision risk increased (RR = 2.4 for RPs vs. HPs in the last study period). Although 48 patients had an RP inserted in the last study period, the year-by-year figure shows a fall in the use of these prostheses after 2006 (Figure 1). One explanation for the worsening of results for this pros-thesis type may therefore be decreasing volume per surgeon as other and better prosthesis types are increasingly preferred.
The results for hemiprostheses in terms of implant sur-vival were good during the whole study period. Even so, inferior results for pain and function have been demonstrated in patients with HPs, and the high rate of revisions due to pain shown in this study reflects the same problem. With the improved implant survival of ATPs shown in the last 7-year period, we expect that the use of HPs will continue to fall and that more ATPs will be used.
Espehaug B, Furnes O, Havelin L I, Engesaeter L B, Vollset S E, Kindseth O. Registration completeness in the Norwegian Arthroplasty Register. Acta Orthop 2006; 77(1): 49-56.
Farng E, Zingmond D, Krenek L, Soohoo N F. Factors predicting complica-tion rates after primary shoulder arthroplasty. J Shoulder Elbow Surg 2011; 20(4): 557-63.
Fevang B T, Lie S A, Havelin L I, Skredderstuen A, Furnes O. Risk factors for revision after shoulder arthroplasty: 1,825 shoulder arthroplasties from the Norwegian Arthroplasty Register. Acta Orthop 2009; 80(1): 83-91.
Fevang B T, Lygre S H, Bertelsen G, Skredderstuen A, Havelin L I, Furnes O. Good function after shoulder arthroplasty. Acta Orthop 2012; 83(5): 467-73.
Fevang B T, Lygre S H, Bertelsen G, Skredderstuen A, Havelin L I, Furnes O. Pain and function in eight hundred and fifty nine patients comparing shoul-der hemiprostheses, resurfacing prostheses, reversed total and conventional total prostheses. Int Orthop 2013; 37(1): 59-66.
Holcomb J O, Hebert D J, Mighell M A, Dunning P E, Pupello D R, Pliner M D, Frankle M A. Reverse shoulder arthroplasty in patients with rheumatoid arthritis. J Shoulder Elbow Surg 2010; 19(7): 1076-84.
John M, Pap G, Angst F, Flury M P, Lieske S, Schwyzer H K, Simmen B R. Short-term results after reversed shoulder arthroplasty (Delta III) in patients with rheumatoid arthritis and irreparable rotator cuff tear. Int Orthop 2010; 34(1): 71-7.
Pfahler M, Jena F, Neyton L, Sirveaux F, Mole D. Hemiarthroplasty versus total shoulder prosthesis: results of cemented glenoid components. J Shoul-der Elbow Surg 2006; 15(2): 154-63.
BTSF had full access to all data and takes responsi-bility for the integrity and the accuracy of the data analysis. Study concept and design: BTSF, AS, OF, and LIH. Acquisition of data: BTSF, OF, and LIH. Analysis and interpretation of data: BTSF, TWN, AS, OF, and LIH. Drafting of manuscript: BTSF. All the authors critically revised the manuscript and gave their final approval.
We thank the Norwegian surgeons for consci-entiously filling in the registry forms after each surgery. Also, we are grateful to the personnel of the Norwegian Arthroplasty Register, who are extremely important in completion of missing data in the registry. We did not receive any external funding for this work.
No competing interests declared.
Betts H M, Abu-Rajab R, Nunn T, Brooksbank A J. Total shoulder replacement in rheumatoid dis-ease: a 16- to 23-year follow-up. J Bone Joint Surg Br 2009; 91(9): 1197-200.
Bryant D, Litchfield R, Sandow M, Gartsman G M, Guyatt G, Kirkley A. A comparison of pain, strength, range of motion, and functional out-comes after hemiarthroplasty and total shoulder arthroplasty in patients with osteoarthritis of the shoulder. A systematic review and meta-analy-sis. J Bone Joint Surg Am 2005; 87(9): 1947-56.
Ekelund A, Nyberg R. Can reverse shoulder arthro-plasty be used with few complications in rheu-matoid arthritis? Clin Orthop Relat Res 2011; 469(9): 2483-8.
Act
a O
rtho
p D
ownl
oade
d fr
om in
form
ahea
lthca
re.c
om b
y H
else
Ber
gen
- H
auke
land
uni
vers
itets
syke
hus
on 1
1/26
/14
For
pers
onal
use
onl
y.

8 Acta Orthopaedica 2015; 86 (1): x–x
Radnay C S, Setter K J, Chambers L, Levine W N, Bigliani L U, Ahmad C S. Total shoulder replacement compared with humeral head replacement for the treatment of primary glenohumeral osteoarthritis: a systematic review. J Shoulder Elbow Surg 2007; 16(4): 396-402.
Singh J A, Sperling J, Buchbinder R, McMaken K. Surgery for shoulder osteoarthritis. Cochrane Database Syst Rev 2010; (10): CD008089.
Singh J A, Sperling J W, Cofield R H. Revision surgery following total shoul-der arthroplasty: analysis of 2588 shoulders over three decades (1976 to 2008). J Bone Joint Surg Br 2011; 93(11): 1513-7.
Sneppen O, Fruensgaard S, Johannsen H V, Olsen B S, Sojbjerg J O, Andersen N H. Total shoulder replacement in rheumatoid arthritis: proximal migra-tion and loosening. J Shoulder Elbow Surg 1996; 5(1): 47-52.
Sperling J W, Cofield R H, Schleck C D, Harmsen W S. Total shoulder arthro-plasty versus hemiarthroplasty for rheumatoid arthritis of the shoulder: results of 303 consecutive cases. J Shoulder Elbow Surg 2007; 16(6): 683-90.
Stewart M P, Kelly I G. Total shoulder replacement in rheumatoid disease: 7- to 13-year follow-up of 37 joints. J Bone Joint Surg Br 1997; 79(1): 68-72.
Trail I A, Nuttall D. The results of shoulder arthroplasty in patients with rheu-matoid arthritis. J Bone Joint Surg Br 2002; 84(8): 1121-5.
Young A A, Smith M M, Bacle G, Moraga C, Walch G. Early results of reverse shoulder arthroplasty in patients with rheumatoid arthritis. J Bone Joint Surg Am 2011; 93(20): 1915-23.
Act
a O
rtho
p D
ownl
oade
d fr
om in
form
ahea
lthca
re.c
om b
y H
else
Ber
gen
- H
auke
land
uni
vers
itets
syke
hus
on 1
1/26
/14
For
pers
onal
use
onl
y.


![µ ] v - Casa Montessori · µ ] v 7lwoxo , x x x x x x x x x x x x x x x x x x x x x x x x x x x x x x x x x x x x x x x x x x x x x x x x x x x x x x x x x x x x x x x x x x x x](https://static.fdocuments.net/doc/165x107/5e3041645d2be568cb68ec81/-v-casa-v-7lwoxo-x-x-x-x-x-x-x-x-x-x-x-x-x-x-x-x-x-x-x-x-x-x-x-x-x.jpg)