Acta Geophysica - COnnecting REpositories · Acta Geophysica vol. 63, no. 3, June 2015, pp. 789-814...
26
Acta Geophysica vol. 63, no. 3, June 2015, pp. 789-814 DOI: 10.1515/acgeo-2015-0013 ________________________________________________ Ownership: Institute of Geophysics, Polish Academy of Sciences; © 2015 Krakowska and Puskarczyk. This is an open access article distributed under the Crea- tive Commons Attribution-NonCommercial-NoDerivs license, http://creativecommons.org/licenses/by-nc-nd/3.0/. Tight Reservoir Properties Derived by Nuclear Magnetic Resonance, Mercury Porosimetry and Computed Microtomography Laboratory Techniques. Case Study of Palaeozoic Clastic Rocks Paulina I. KRAKOWSKA and Edyta PUSKARCZYK Faculty of Geology Geophysics and Environmental Protection, Department of Geophysics, AGH University of Science and Technology, Kraków, Poland; e-mail: [email protected] Abstract Results of the nuclear magnetic resonance (NMR) investigations, mercury porosimetry measurements (MP) and computed microtomogra- phy (micro-CT), applied to the tight Palaeozoic rocks from the depths lower than 3000 m, were presented to estimate their reservoir potential. NMR signal analysis and interpretation were performed. Based on NMR driven models, permeability and Free Fluid Index were calculated for data sets divided into homogeneous clusters. Computerized mercury po- rosimetry results visualization and processing provided useful informa- tion, as the automatically determined Swanson parameter is correlated with petrophysical properties of rocks. Micro-CT enriched the image of porous space in qualitative and quantitative ways. Homogeneity of pore space structure was discussed using micro-CT approach. Integration of the results in the frame of reservoir parameters from standard laboratory methods and the modern ones resulted in the improvement of methodol- ogy for determining the old, deep-seated, hard sedimentary rocks reser- voir potential. Key words: palaeozoic sedimentary rocks, nuclear magnetic resonance, mercury porosimetry, computed microtomography.
Transcript of Acta Geophysica - COnnecting REpositories · Acta Geophysica vol. 63, no. 3, June 2015, pp. 789-814...

Acta Geophysica vol. 63, no. 3, June 2015, pp. 789-814
DOI: 10.1515/acgeo-2015-0013
________________________________________________ Ownership: Institute of Geophysics, Polish Academy of Sciences; © 2015 Krakowska and Puskarczyk. This is an open access article distributed under the Crea-tive Commons Attribution-NonCommercial-NoDerivs license, http://creativecommons.org/licenses/by-nc-nd/3.0/.
Tight Reservoir Properties Derived by Nuclear Magnetic Resonance, Mercury Porosimetry and
Computed Microtomography Laboratory Techniques. Case Study of Palaeozoic Clastic Rocks
Paulina I. KRAKOWSKA and Edyta PUSKARCZYK
Faculty of Geology Geophysics and Environmental Protection, Department of Geophysics, AGH University of Science and Technology,
Kraków, Poland; e-mail: [email protected]
A b s t r a c t
Results of the nuclear magnetic resonance (NMR) investigations, mercury porosimetry measurements (MP) and computed microtomogra-phy (micro-CT), applied to the tight Palaeozoic rocks from the depths lower than 3000 m, were presented to estimate their reservoir potential. NMR signal analysis and interpretation were performed. Based on NMR driven models, permeability and Free Fluid Index were calculated for data sets divided into homogeneous clusters. Computerized mercury po-rosimetry results visualization and processing provided useful informa-tion, as the automatically determined Swanson parameter is correlated with petrophysical properties of rocks. Micro-CT enriched the image of porous space in qualitative and quantitative ways. Homogeneity of pore space structure was discussed using micro-CT approach. Integration of the results in the frame of reservoir parameters from standard laboratory methods and the modern ones resulted in the improvement of methodol-ogy for determining the old, deep-seated, hard sedimentary rocks reser-voir potential.
Key words: palaeozoic sedimentary rocks, nuclear magnetic resonance, mercury porosimetry, computed microtomography.
P.I. KRAKOWSKA and E. PUSKARCZYK
790
1. INTRODUCTION Petrophysical properties of deep-seated, old rocks are now a new research target due to the recent increased interest in tight gas formations (Monk 2013, Czeka�ski et al. 2012). Previously, Precambrian and Palaeozoic sedi-mentary rocks were the objects of scientific research regarding the analysis of the sedimentary basins and recognition of the lithosphere structure (Ba-kun-Czubarow 1984, Jaworowski and Miko�ajewski 2007, Kotarba 2010). Methodology which has been applied so far for investigation of hydrocar-bon-bearing formations was mainly focused on precise determination of wa-ter or hydrocarbon saturation by selection of the adequate geological and geophysical models, e.g., in the Polish part of the Carpathian Foredeep (Zor-ski 2009, Zorski et al. 2011).
Precambrian and Palaeozoic sedimentary rocks may be analyzed from the point of their reservoir properties in prospecting for hydrocarbons, table and geothermal waters, and for estimation of the rock utility to the CO2 stor-age (Kiersnowski et al. 2010, Semyrka et al. 2010, Such et al. 2010, Jarzyna et al. 2012, Xiao et al. 2014). Combination of laboratory measurements in-cluding nuclear magnetic resonance (NMR), mercury porosimetry (MP), and computed microtomography (micro-CT) leads to building up a detailed methodology in analyzing low porosity and low permeability rocks. Results obtained for selected rock samples are presented as an example of sophisti-cated approach to reservoir properties determination. An integration of the NMR and MP results using different permeability models (SDR, Coates, and clay-bound water) and fluid flow description was made. Information on pore space distribution was obtained from micro-CT experiments.
2. MATERIAL Tight and hard rocks of the Cambrian, Silurian, Ordovician, Carboniferous, and Permian age, located at the depth range of 3007.2-4588.0 m in wells sited in the Polish territory were used as testing material (Table 1). Rock samples were selected from deep wells, complying with four conditions: (i) depth of the rock was greater than 3000 m, (ii) rocks were of Precambrian or Palaeozoic age, (iii) lithology was represented by sandstones and clay-stones or carbonates (limestones and dolomites), and (iv) it was possible to probe the core sample of 0.10 m length and a quarter of core volume, which was cut at half of core’s diameter (Fig. 1).
Deep wells were located in the north, south-east, and central Poland in selected geological units built of old rock formation (Fig. 2). Samples were initially interpreted in the aspect of lithology and age. Several well recog-nized methods of laboratory investigation of core samples were applied to determine bulk density and specific density, total porosity and absolute per-
TIGHT RESERVOIR PROPERTIES BY NMR, MP, AND MICRO-CT
791
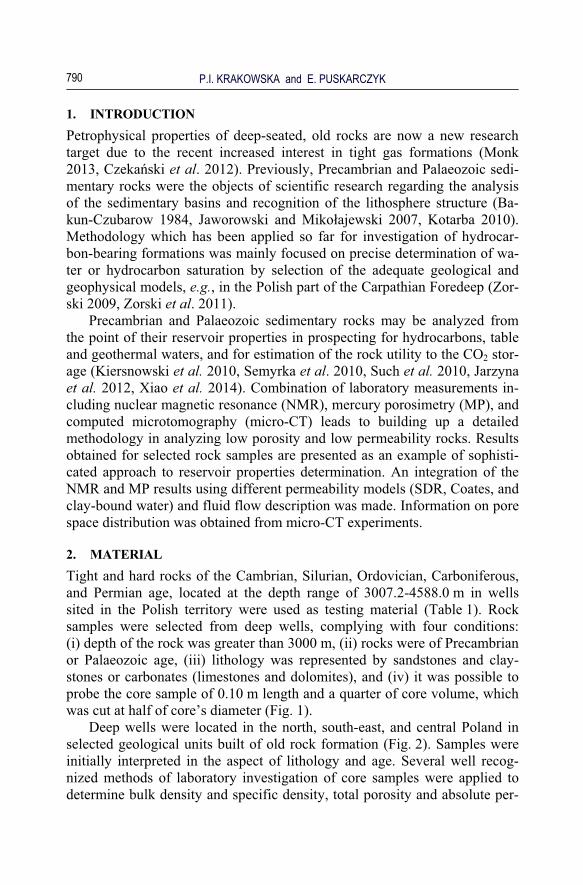
Table 1 Wells, depth, stratigraphy, and lithology of the studied rock samples
No. Well Year Bottom depth [m]
Bottom stratigraphy
Sample depth [m]
Lithology Age
869 H-IG1 1974 3520 Pt 3457 sandstone Cm 870 O-IG1 1967 4298 Pt 4106 sandstone Cm 871 P-IG1 1970 3930 Pt 3460 sandstone Cm 872 S-IG1 1974 5120 Pt 3546 claystone S 873 G-IG1 1972 3353.5 Cm 3012.3 sandstone Cm 874 �-IG1 1975 5632 Cm 4588 sandstone Cm 876 Si-IG1 1970 3010.3 Cm 3007.2 sandstone Cm 877 T-IG5 1977 3850.5 Cm 3034 sandstone O 878 �-IG1 1969 3276 Cm 3233 sandstone Cm 879 L-IG1 1961 3310 O 3246.5 claystone S 889 Br-1 1983 4065 C 3818 sandstone C 892 C-IG2 1980 5020 P 4016 sandstone P 894 Z-2 1976 4569.6 C 4498.6 sandstone C 896 Op-PIG2 1991 3055 C 3045 sandstone C
Explanations: No. – sample number, Year – drilling year, Age – age of the rock sample, Pt – Proterozoic, Cm – Cambrian, O – Ordovician, S – Silurian, C – Car-boniferous, P – Permian.
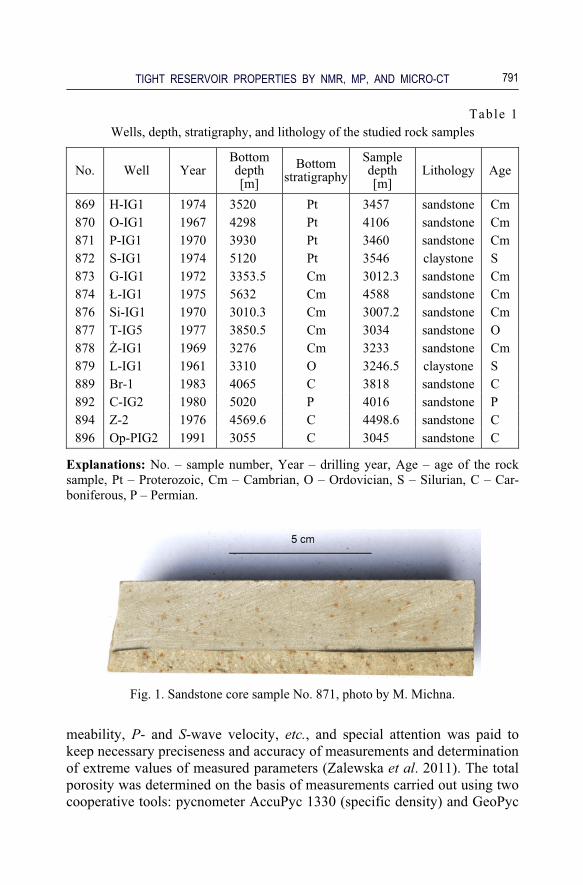
Fig. 1. Sandstone core sample No. 871, photo by M. Michna.
meability, P- and S-wave velocity, etc., and special attention was paid to keep necessary preciseness and accuracy of measurements and determination of extreme values of measured parameters (Zalewska et al. 2011). The total porosity was determined on the basis of measurements carried out using two cooperative tools: pycnometer AccuPyc 1330 (specific density) and GeoPyc
P.I. KRAKOWSKA and E. PUSKARCZYK
792
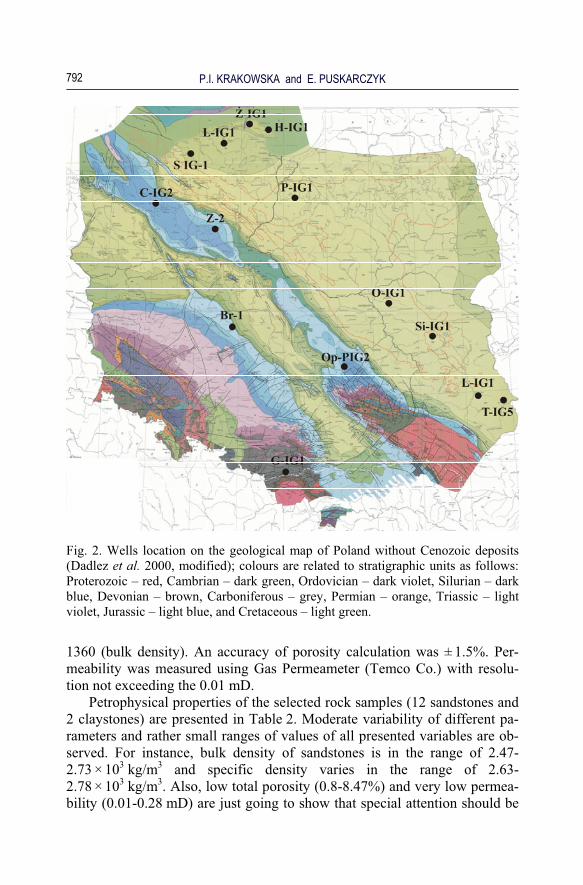
Fig. 2. Wells location on the geological map of Poland without Cenozoic deposits (Dadlez et al. 2000, modified); colours are related to stratigraphic units as follows: Proterozoic – red, Cambrian – dark green, Ordovician – dark violet, Silurian – dark blue, Devonian – brown, Carboniferous – grey, Permian – orange, Triassic – light violet, Jurassic – light blue, and Cretaceous – light green.
1360 (bulk density). An accuracy of porosity calculation was ± 1.5%. Per-meability was measured using Gas Permeameter (Temco Co.) with resolu-tion not exceeding the 0.01 mD.
Petrophysical properties of the selected rock samples (12 sandstones and 2 claystones) are presented in Table 2. Moderate variability of different pa-rameters and rather small ranges of values of all presented variables are ob-served. For instance, bulk density of sandstones is in the range of 2.47-2.73 × 10³ kg/m3 and specific density varies in the range of 2.63-2.78 × 10³ kg/m3. Also, low total porosity (0.8-8.47%) and very low permea-bility (0.01-0.28 mD) are just going to show that special attention should be
TIGHT RESERVOIR PROPERTIES BY NMR, MP, AND MICRO-CT
793
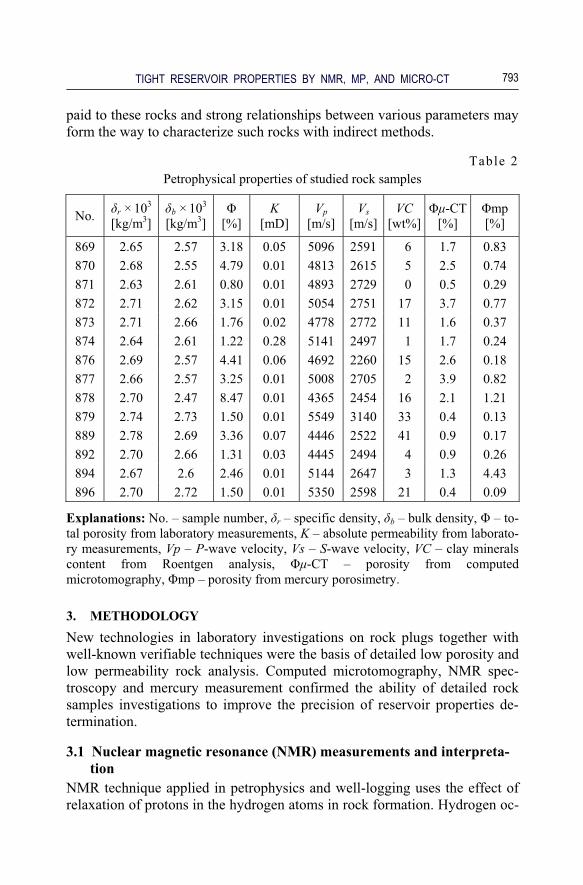
paid to these rocks and strong relationships between various parameters may form the way to characterize such rocks with indirect methods.
Table 2 Petrophysical properties of studied rock samples
No. �r × 103 [kg/m3]
�b × 103
[kg/m3] �
[%] K
[mD] Vp
[m/s] Vs
[m/s]VC
[wt%]��-CT
[%] �mp [%]
869 2.65 2.57 3.18 0.05 5096 2591 6 1.7 0.83 870 2.68 2.55 4.79 0.01 4813 2615 5 2.5 0.74 871 2.63 2.61 0.80 0.01 4893 2729 0 0.5 0.29 872 2.71 2.62 3.15 0.01 5054 2751 17 3.7 0.77 873 2.71 2.66 1.76 0.02 4778 2772 11 1.6 0.37 874 2.64 2.61 1.22 0.28 5141 2497 1 1.7 0.24 876 2.69 2.57 4.41 0.06 4692 2260 15 2.6 0.18 877 2.66 2.57 3.25 0.01 5008 2705 2 3.9 0.82 878 2.70 2.47 8.47 0.01 4365 2454 16 2.1 1.21 879 2.74 2.73 1.50 0.01 5549 3140 33 0.4 0.13 889 2.78 2.69 3.36 0.07 4446 2522 41 0.9 0.17 892 2.70 2.66 1.31 0.03 4445 2494 4 0.9 0.26 894 2.67 2.6 2.46 0.01 5144 2647 3 1.3 4.43 896 2.70 2.72 1.50 0.01 5350 2598 21 0.4 0.09
Explanations: No. – sample number, �r – specific density, �b – bulk density, � – to-tal porosity from laboratory measurements, K – absolute permeability from laborato-ry measurements, Vp – P-wave velocity, Vs – S-wave velocity, VC – clay minerals content from Roentgen analysis, ��-CT – porosity from computed microtomography, �mp – porosity from mercury porosimetry.
3. METHODOLOGY New technologies in laboratory investigations on rock plugs together with well-known verifiable techniques were the basis of detailed low porosity and low permeability rock analysis. Computed microtomography, NMR spec-troscopy and mercury measurement confirmed the ability of detailed rock samples investigations to improve the precision of reservoir properties de-termination.
3.1 Nuclear magnetic resonance (NMR) measurements and interpreta-tion
NMR technique applied in petrophysics and well-logging uses the effect of relaxation of protons in the hydrogen atoms in rock formation. Hydrogen oc-
P.I. KRAKOWSKA and E. PUSKARCZYK
794
curs in rocks in the form of water or hydrocarbons contained in rock pores, water bound in clay minerals and hydrogen included in hydroxyl groups in these minerals. The basic parameters observed in relaxation examination are: proton signal amplitude, spin-lattice relaxation time T1 and spin-spin relaxa-tion time T2 (Andrew 1969). These parameters are the source of detailed in-formation about porosity (total and effective), irreducible water saturation and permeability of reservoir rocks, pore space structure and type of liquid filling rock pores (Coates et al. 1999). In the multiphase systems, e.g., rocks where media of diverse quality fill the complex rock pore space, the spin-spin relaxation curve can be presented as a sum of components characterized by the relaxation time T2. The continuous distribution of relaxation times is directly related to distribution of pore sizes in the examined rock sample. In-dividually selected T2 cut-offs included into interpretation of NMR signals improve the determination of bound water volume and moveable media in rock formation (Liu et al. 2007).
NMR measurements were performed using NMR Maran7 equipped with permanent magnet generating 0.186 T intensity field. Frequency of hydrogen nuclei precession was equal to 7.9 MHz. Measurements were carried out in the temperature of 35° C. Core samples (0.04 m in length and 0.0254 m in diameter) were saturated with brine (NaCl mineralization = 50 g/l). Before each measurement series, a control measurement on the standard reference was done. Standard reference (porosity = 15%) was saturated with brine (containing hydrogen and deuterium) of NaCl mineralization = 50 g/l. Spin-spin relaxation times were measured with pulse methods using the Carr–Purcell–Meiboom–Gill spin echo methodology.
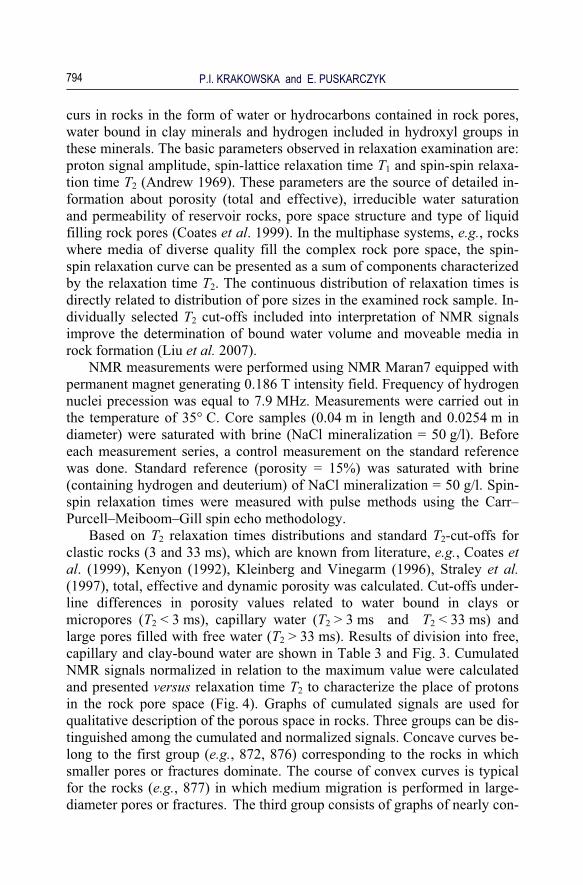
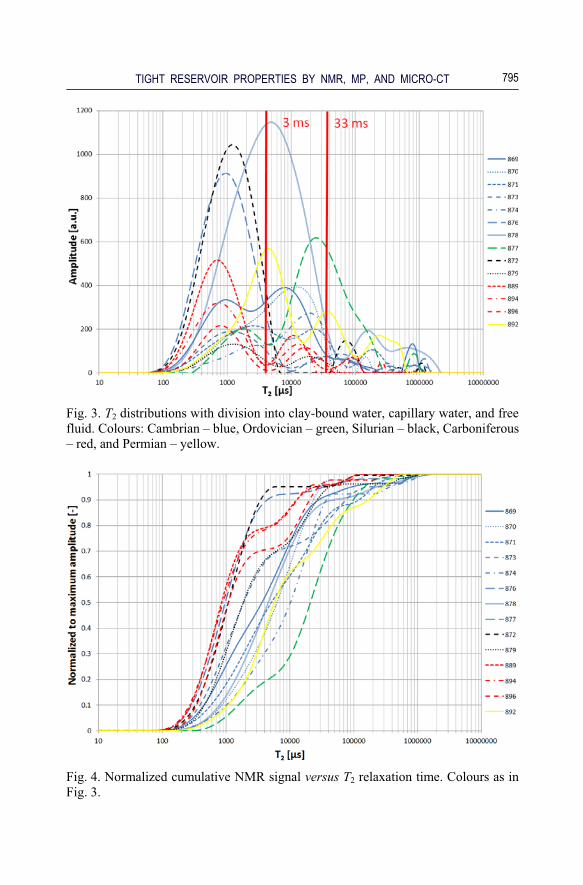
Based on T2 relaxation times distributions and standard T2-cut-offs for clastic rocks (3 and 33 ms), which are known from literature, e.g., Coates et al. (1999), Kenyon (1992), Kleinberg and Vinegarm (1996), Straley et al. (1997), total, effective and dynamic porosity was calculated. Cut-offs under-line differences in porosity values related to water bound in clays or micropores (T2 < 3 ms), capillary water (T2 > 3 ms and T2 < 33 ms) and large pores filled with free water (T2 > 33 ms). Results of division into free, capillary and clay-bound water are shown in Table 3 and Fig. 3. Cumulated NMR signals normalized in relation to the maximum value were calculated and presented versus relaxation time T2 to characterize the place of protons in the rock pore space (Fig. 4). Graphs of cumulated signals are used for qualitative description of the porous space in rocks. Three groups can be dis-tinguished among the cumulated and normalized signals. Concave curves be-long to the first group (e.g., 872, 876) corresponding to the rocks in which smaller pores or fractures dominate. The course of convex curves is typical for the rocks (e.g., 877) in which medium migration is performed in large-diameter pores or fractures. The third group consists of graphs of nearly con-
TIGHT RESERVOIR PROPERTIES BY NMR, MP, AND MICRO-CT
795
Fig. 3. T2 distributions with division into clay-bound water, capillary water, and free fluid. Colours: Cambrian – blue, Ordovician – green, Silurian – black, Carboniferous – red, and Permian – yellow.
Fig. 4. Normalized cumulative NMR signal versus T2 relaxation time. Colours as in Fig. 3.
P.I. KRAKOWSKA and E. PUSKARCZYK
796
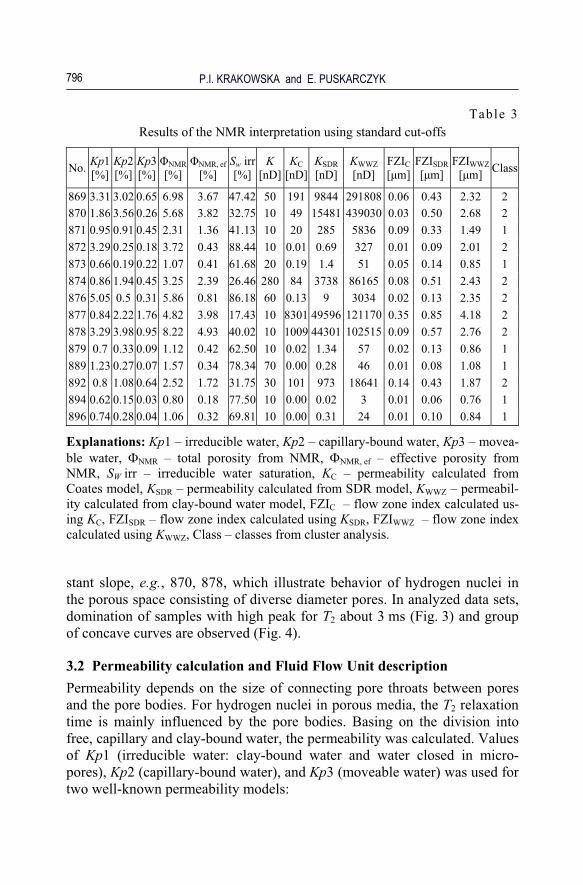
Table 3 Results of the NMR interpretation using standard cut-offs
No. Kp1 [%]
Kp2 [%]
Kp3 [%]
�NMR[%]
�NMR, ef[%]
Sw irr[%]
K[nD]
KC[nD]
KSDR[nD]
KWWZ[nD]
FZIC[�m]
FZISDR[�m]
FZIWWZ[�m] Class
869 3.31 3.02 0.65 6.98 3.67 47.42 50 191 9844 291808 0.06 0.43 2.32 2 870 1.86 3.56 0.26 5.68 3.82 32.75 10 49 15481 439030 0.03 0.50 2.68 2 871 0.95 0.91 0.45 2.31 1.36 41.13 10 20 285 5836 0.09 0.33 1.49 1 872 3.29 0.25 0.18 3.72 0.43 88.44 10 0.01 0.69 327 0.01 0.09 2.01 2 873 0.66 0.19 0.22 1.07 0.41 61.68 20 0.19 1.4 51 0.05 0.14 0.85 1 874 0.86 1.94 0.45 3.25 2.39 26.46 280 84 3738 86165 0.08 0.51 2.43 2 876 5.05 0.5 0.31 5.86 0.81 86.18 60 0.13 9 3034 0.02 0.13 2.35 2 877 0.84 2.22 1.76 4.82 3.98 17.43 10 8301 49596 121170 0.35 0.85 4.18 2 878 3.29 3.98 0.95 8.22 4.93 40.02 10 1009 44301 102515 0.09 0.57 2.76 2 879 0.7 0.33 0.09 1.12 0.42 62.50 10 0.02 1.34 57 0.02 0.13 0.86 1 889 1.23 0.27 0.07 1.57 0.34 78.34 70 0.00 0.28 46 0.01 0.08 1.08 1 892 0.8 1.08 0.64 2.52 1.72 31.75 30 101 973 18641 0.14 0.43 1.87 2 894 0.62 0.15 0.03 0.80 0.18 77.50 10 0.00 0.02 3 0.01 0.06 0.76 1 896 0.74 0.28 0.04 1.06 0.32 69.81 10 0.00 0.31 24 0.01 0.10 0.84 1
Explanations: Kp1 – irreducible water, Kp2 – capillary-bound water, Kp3 – movea-ble water, �NMR – total porosity from NMR, �NMR, ef – effective porosity from NMR, SW irr – irreducible water saturation, KC – permeability calculated from Coates model, KSDR – permeability calculated from SDR model, KWWZ – permeabil-ity calculated from clay-bound water model, FZIC – flow zone index calculated us-ing KC, FZISDR – flow zone index calculated using KSDR, FZIWWZ – flow zone index calculated using KWWZ, Class – classes from cluster analysis.
stant slope, e.g., 870, 878, which illustrate behavior of hydrogen nuclei in the porous space consisting of diverse diameter pores. In analyzed data sets, domination of samples with high peak for T2 about 3 ms (Fig. 3) and group of concave curves are observed (Fig. 4).
3.2 Permeability calculation and Fluid Flow Unit description Permeability depends on the size of connecting pore throats between pores and the pore bodies. For hydrogen nuclei in porous media, the T2 relaxation time is mainly influenced by the pore bodies. Basing on the division into free, capillary and clay-bound water, the permeability was calculated. Values of Kp1 (irreducible water: clay-bound water and water closed in micro-pores), Kp2 (capillary-bound water), and Kp3 (moveable water) was used for two well-known permeability models:
TIGHT RESERVOIR PROPERTIES BY NMR, MP, AND MICRO-CT
797
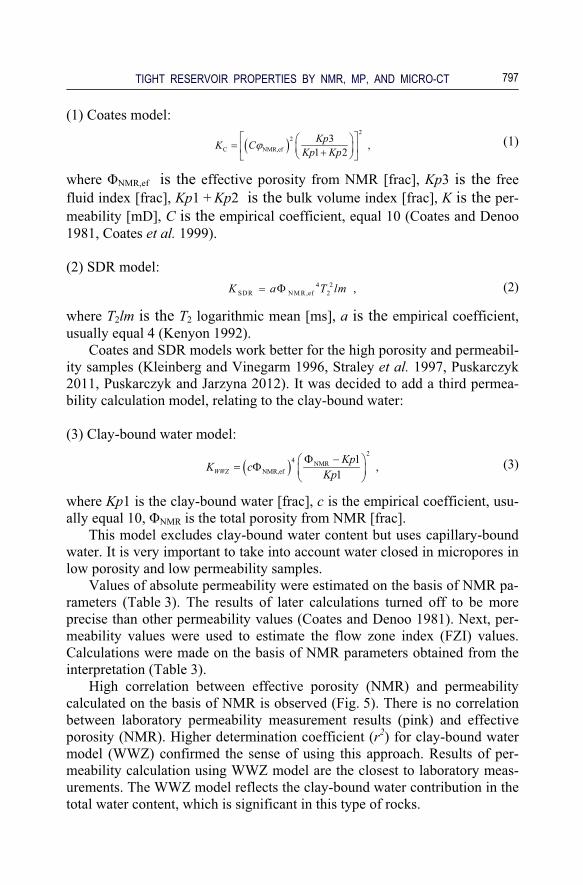
(1) Coates model:
� �2
2
C NMR,ef3 ,
1 2KpK C
Kp Kp�
� �� � � ��� �� � (1)
where �NMR,ef is the effective porosity from NMR [frac], Kp3 is the free fluid index [frac], Kp1 + Kp2 is the bulk volume index [frac], K is the per-meability [mD], C is the empirical coefficient, equal 10 (Coates and Denoo 1981, Coates et al. 1999). (2) SDR model: 4 2
SDR NM R,ef 2 ,K a T lm � (2)
where T2lm is the T2 logarithmic mean [ms], a is the empirical coefficient, usually equal 4 (Kenyon 1992).
Coates and SDR models work better for the high porosity and permeabil-ity samples (Kleinberg and Vinegarm 1996, Straley et al. 1997, Puskarczyk 2011, Puskarczyk and Jarzyna 2012). It was decided to add a third permea-bility calculation model, relating to the clay-bound water: (3) Clay-bound water model:
� �2
4 NMRNMR,ef
1,
1WWZKp
K cKp
� �� � � �� �
(3)
where Kp1 is the clay-bound water [frac], c is the empirical coefficient, usu-ally equal 10, �NMR is the total porosity from NMR [frac].
This model excludes clay-bound water content but uses capillary-bound water. It is very important to take into account water closed in micropores in low porosity and low permeability samples.
Values of absolute permeability were estimated on the basis of NMR pa-rameters (Table 3). The results of later calculations turned off to be more precise than other permeability values (Coates and Denoo 1981). Next, per-meability values were used to estimate the flow zone index (FZI) values. Calculations were made on the basis of NMR parameters obtained from the interpretation (Table 3).
High correlation between effective porosity (NMR) and permeability calculated on the basis of NMR is observed (Fig. 5). There is no correlation between laboratory permeability measurement results (pink) and effective porosity (NMR). Higher determination coefficient (r2) for clay-bound water model (WWZ) confirmed the sense of using this approach. Results of per-meability calculation using WWZ model are the closest to laboratory meas-urements. The WWZ model reflects the clay-bound water contribution in the total water content, which is significant in this type of rocks.

P.I. KRAKOWSKA and E. PUSKARCZYK
798
Fig. 5. Relationship between permeability versus porosity; permeability was calcu-lated according to various formulas (symbols are explained in Table 3).
The NMR measurement provides information about effective porosity and irreducible water saturation. Permeability calculated from NMR is only estimation and logarithm of permeability versus porosity relationship could be different from linear. Flow zone index (FZI) was used to obtain Fluid Flow Unit characterization of investigated rocks (Amaefule et al. 1993). Flow zone index (FZI) includes indirect information on pore throats and also on pores and grains distributions. The FZI parameter changes according to geological features as texture and structure of the rock. A low value of FZI is related to high tortuosity and low permeability.
FZI was calculated for standard NMR interpretation results. Inspection of results revealed two groups of samples responding to two Fluid Flow Units with similar factors. For division, the cluster analysis was used. The purpose of cluster analysis is to assemble observations into relatively homo-geneous groups. For the discussed data sets, cluster analysis was performed by k-means methods (MacQueen 1967). The k-mean clustering aim is to par-tition the observations into clusters, in which each observation belongs to the cluster with the nearest centroids. When the objects are assigned, the posi-tions of centroids are recalculated. The procedure is repeated until the cen-troids movement is stopped. The members of clusters are at once alike and at the same time unlike members of other groups. There is no analytical solu-tion to this problem, which is common to all areas of classification.
TIGHT RESERVOIR PROPERTIES BY NMR, MP, AND MICRO-CT
799
Cluster analysis was performed for each permeability model (1)-(3) (Ta-ble 3). Results of classification were the same. For further analysis, the WZ model (3) was chosen, because of the best fitting results. It was decided that this model provided the best permeability estimation for the analyzed data.
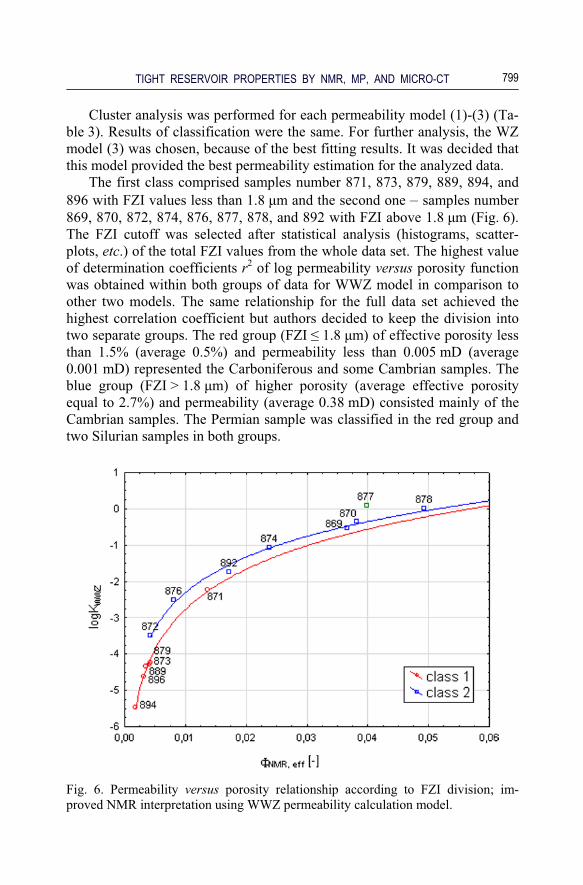
The first class comprised samples number 871, 873, 879, 889, 894, and 896 with FZI values less than 1.8 �m and the second one – samples number 869, 870, 872, 874, 876, 877, 878, and 892 with FZI above 1.8 �m (Fig. 6). The FZI cutoff was selected after statistical analysis (histograms, scatter-plots, etc.) of the total FZI values from the whole data set. The highest value of determination coefficients r2 of log permeability versus porosity function was obtained within both groups of data for WWZ model in comparison to other two models. The same relationship for the full data set achieved the highest correlation coefficient but authors decided to keep the division into two separate groups. The red group (FZI � 1.8 �m) of effective porosity less than 1.5% (average 0.5%) and permeability less than 0.005 mD (average 0.001 mD) represented the Carboniferous and some Cambrian samples. The blue group (FZI > 1.8 �m) of higher porosity (average effective porosity equal to 2.7%) and permeability (average 0.38 mD) consisted mainly of the Cambrian samples. The Permian sample was classified in the red group and two Silurian samples in both groups.
Fig. 6. Permeability versus porosity relationship according to FZI division; im-proved NMR interpretation using WWZ permeability calculation model.
P.I. KRAKOWSKA and E. PUSKARCZYK
800
3.3 Visualization and processing of mercury porosimetry results Mercury porosimetry is a well-known and useful technique of porous space investigation and provides the following parameters: total intrusion volume, median pore diameter-volume, median pore diameter-area, average pore di-ameter, porosity, threshold pressure, characteristic length, and tortuosity (Pittman 1992, Vavra et al. 1992, Webb 2001). Mercury porosimetry meas-urements were performed using porosimeter AutoPore IV 9500.
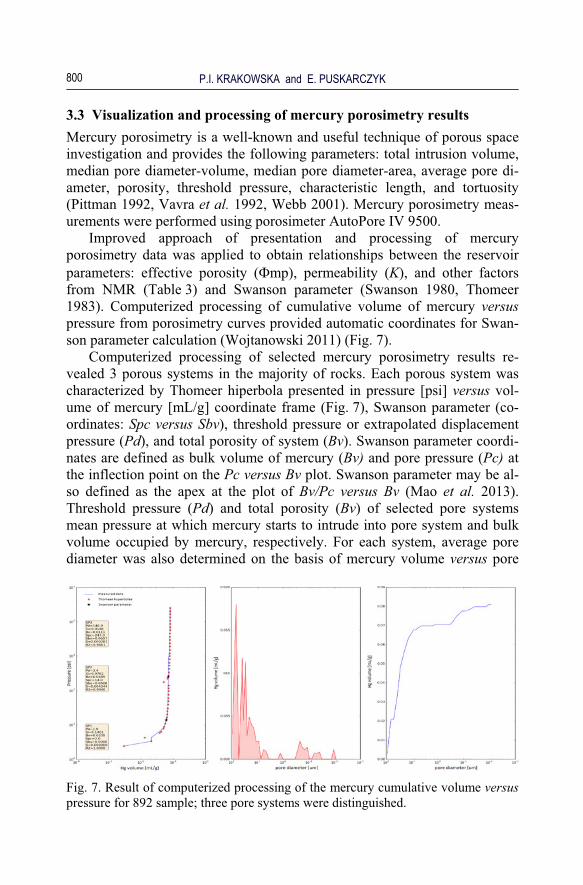
Improved approach of presentation and processing of mercury porosimetry data was applied to obtain relationships between the reservoir parameters: effective porosity (�mp), permeability (K), and other factors from NMR (Table 3) and Swanson parameter (Swanson 1980, Thomeer 1983). Computerized processing of cumulative volume of mercury versus pressure from porosimetry curves provided automatic coordinates for Swan-son parameter calculation (Wojtanowski 2011) (Fig. 7).
Computerized processing of selected mercury porosimetry results re-vealed 3 porous systems in the majority of rocks. Each porous system was characterized by Thomeer hiperbola presented in pressure [psi] versus vol-ume of mercury [mL/g] coordinate frame (Fig. 7), Swanson parameter (co-ordinates: Spc versus Sbv), threshold pressure or extrapolated displacement pressure (Pd), and total porosity of system (Bv). Swanson parameter coordi-nates are defined as bulk volume of mercury (Bv) and pore pressure (Pc) at the inflection point on the Pc versus Bv plot. Swanson parameter may be al-so defined as the apex at the plot of Bv/Pc versus Bv (Mao et al. 2013). Threshold pressure (Pd) and total porosity (Bv) of selected pore systems mean pressure at which mercury starts to intrude into pore system and bulk volume occupied by mercury, respectively. For each system, average pore diameter was also determined on the basis of mercury volume versus pore
Fig. 7. Result of computerized processing of the mercury cumulative volume versus pressure for 892 sample; three pore systems were distinguished.
TIGHT RESERVOIR PROPERTIES BY NMR, MP, AND MICRO-CT
801
diameter plot. Relationships between selected variables turned out to be quite strong and useful in determining porosity and pore diameters. Swanson parameter was also well correlated with individual parameters, i.e., threshold pressure and total porosity and also with the specific reservoir parameter cal-culated as the square root of permeability and porosity (Jarzyna and Puskarczyk 2010, Xiao et al. 2008). Presented plots and statistical formulas are the tools for calculating extreme values of porosity and determining low pore diameter range on the basis of computerized processing results. Also, results of porosimetry harmonize with NMR outcomes and micro-CT solu-tions.
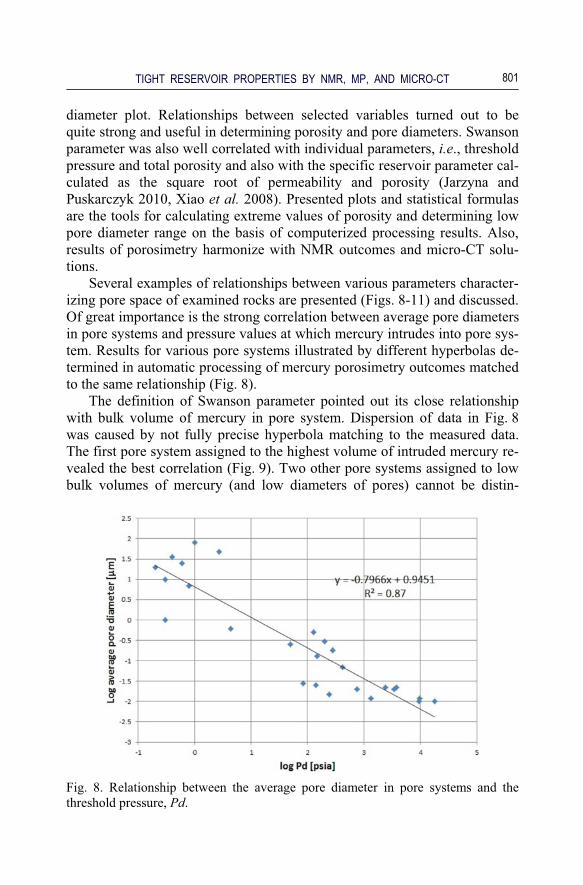
Several examples of relationships between various parameters character-izing pore space of examined rocks are presented (Figs. 8-11) and discussed. Of great importance is the strong correlation between average pore diameters in pore systems and pressure values at which mercury intrudes into pore sys-tem. Results for various pore systems illustrated by different hyperbolas de-termined in automatic processing of mercury porosimetry outcomes matched to the same relationship (Fig. 8).
The definition of Swanson parameter pointed out its close relationship with bulk volume of mercury in pore system. Dispersion of data in Fig. 8 was caused by not fully precise hyperbola matching to the measured data. The first pore system assigned to the highest volume of intruded mercury re-vealed the best correlation (Fig. 9). Two other pore systems assigned to low bulk volumes of mercury (and low diameters of pores) cannot be distin-
Fig. 8. Relationship between the average pore diameter in pore systems and the threshold pressure, Pd.
P.I. KRAKOWSKA and E. PUSKARCZYK
802
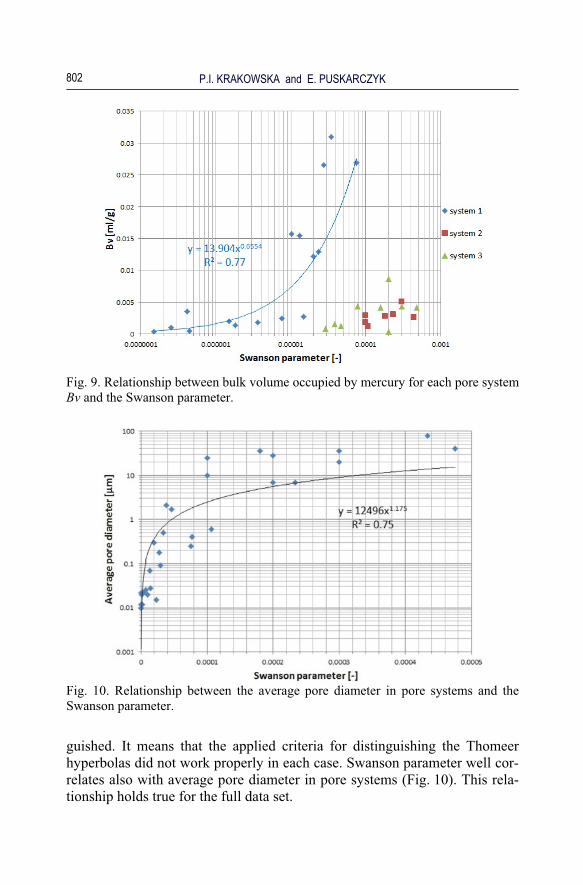
Fig. 9. Relationship between bulk volume occupied by mercury for each pore system Bv and the Swanson parameter.
Fig. 10. Relationship between the average pore diameter in pore systems and the Swanson parameter.
guished. It means that the applied criteria for distinguishing the Thomeer hyperbolas did not work properly in each case. Swanson parameter well cor-relates also with average pore diameter in pore systems (Fig. 10). This rela-tionship holds true for the full data set.
TIGHT RESERVOIR PROPERTIES BY NMR, MP, AND MICRO-CT
803
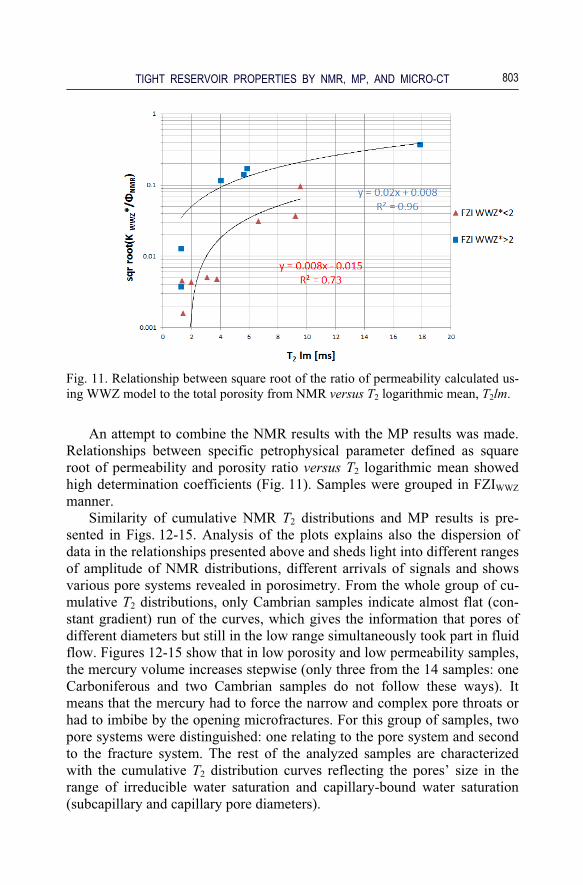
Fig. 11. Relationship between square root of the ratio of permeability calculated us-ing WWZ model to the total porosity from NMR versus T2 logarithmic mean, T2lm.
An attempt to combine the NMR results with the MP results was made. Relationships between specific petrophysical parameter defined as square root of permeability and porosity ratio versus T2 logarithmic mean showed high determination coefficients (Fig. 11). Samples were grouped in FZIWWZ manner.
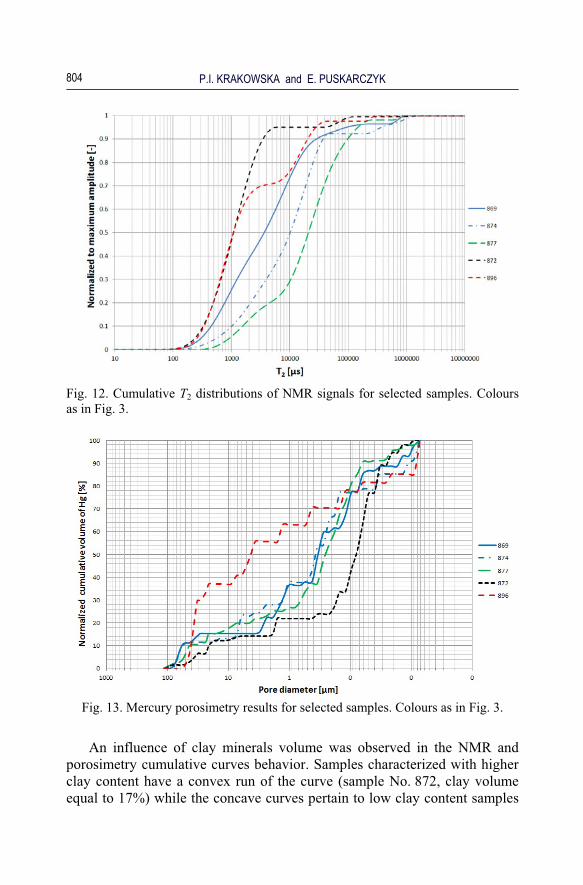
Similarity of cumulative NMR T2 distributions and MP results is pre-sented in Figs. 12-15. Analysis of the plots explains also the dispersion of data in the relationships presented above and sheds light into different ranges of amplitude of NMR distributions, different arrivals of signals and shows various pore systems revealed in porosimetry. From the whole group of cu-mulative T2 distributions, only Cambrian samples indicate almost flat (con-stant gradient) run of the curves, which gives the information that pores of different diameters but still in the low range simultaneously took part in fluid flow. Figures 12-15 show that in low porosity and low permeability samples, the mercury volume increases stepwise (only three from the 14 samples: one Carboniferous and two Cambrian samples do not follow these ways). It means that the mercury had to force the narrow and complex pore throats or had to imbibe by the opening microfractures. For this group of samples, two pore systems were distinguished: one relating to the pore system and second to the fracture system. The rest of the analyzed samples are characterized with the cumulative T2 distribution curves reflecting the pores’ size in the range of irreducible water saturation and capillary-bound water saturation (subcapillary and capillary pore diameters).
P.I. KRAKOWSKA and E. PUSKARCZYK
804
Fig. 12. Cumulative T2 distributions of NMR signals for selected samples. Colours as in Fig. 3.
Fig. 13. Mercury porosimetry results for selected samples. Colours as in Fig. 3.
An influence of clay minerals volume was observed in the NMR and porosimetry cumulative curves behavior. Samples characterized with higher clay content have a convex run of the curve (sample No. 872, clay volume equal to 17%) while the concave curves pertain to low clay content samples

TIGHT RESERVOIR PROPERTIES BY NMR, MP, AND MICRO-CT
805
Fig. 14. T2 distributions for selected samples. Colours as in Fig. 3.
Fig. 15. Incremental volume of mercury versus pore diameter for selected samples. Colours as in Fig. 3.
(sample No. 896, clay volume equal to 21%) which is also reflected in in-cremental volume of mercury (Fig. 14).
Joint analysis of NMR curves and MP plots gave the data set for calcu-lating a relationship between pore diameter and T2 time. Immediate compari-son of T2 distributions (Fig. 14) and incremental volume of mercury (Fig. 15) is rather difficult, but detailed inspection of the sequences of maxima on both plots enables mutual assigning of pore diameter and T2 time distribu-tion.
P.I. KRAKOWSKA and E. PUSKARCZYK
806
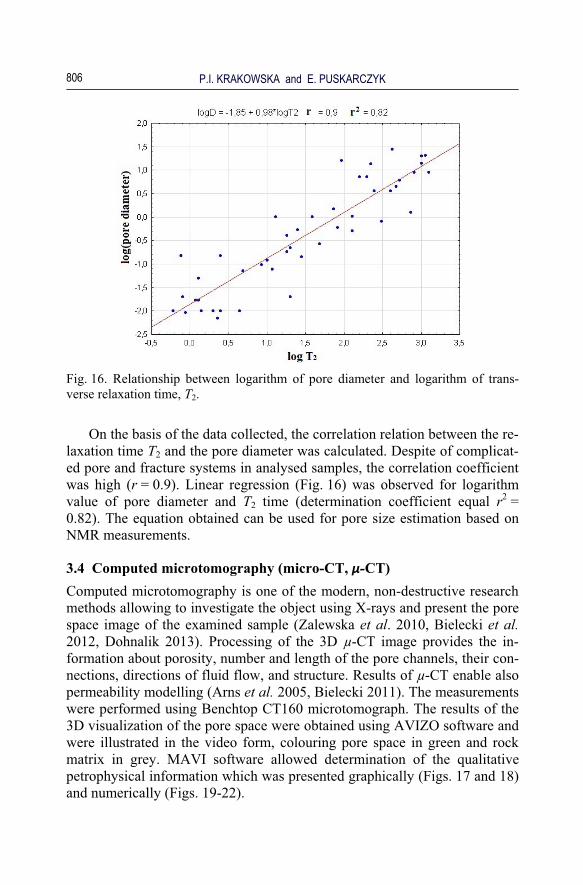
Fig. 16. Relationship between logarithm of pore diameter and logarithm of trans-verse relaxation time, T2.
On the basis of the data collected, the correlation relation between the re-laxation time T2 and the pore diameter was calculated. Despite of complicat-ed pore and fracture systems in analysed samples, the correlation coefficient was high (r = 0.9). Linear regression (Fig. 16) was observed for logarithm value of pore diameter and T2 time (determination coefficient equal r2 = 0.82). The equation obtained can be used for pore size estimation based on NMR measurements.
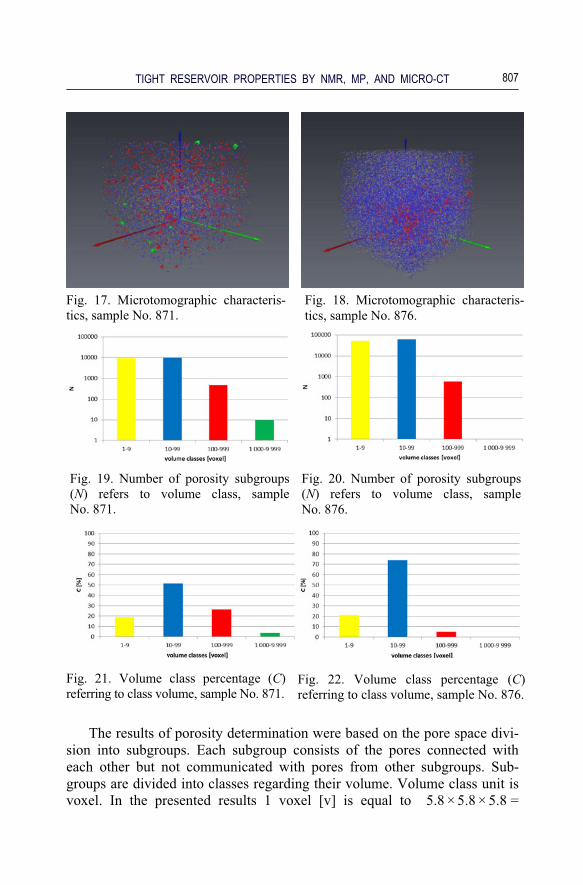
3.4 Computed microtomography (micro-CT, �-CT) Computed microtomography is one of the modern, non-destructive research methods allowing to investigate the object using X-rays and present the pore space image of the examined sample (Zalewska et al. 2010, Bielecki et al. 2012, Dohnalik 2013). Processing of the 3D μ-CT image provides the in-formation about porosity, number and length of the pore channels, their con-nections, directions of fluid flow, and structure. Results of μ-CT enable also permeability modelling (Arns et al. 2005, Bielecki 2011). The measurements were performed using Benchtop CT160 microtomograph. The results of the 3D visualization of the pore space were obtained using AVIZO software and were illustrated in the video form, colouring pore space in green and rock matrix in grey. MAVI software allowed determination of the qualitative petrophysical information which was presented graphically (Figs. 17 and 18) and numerically (Figs. 19-22).
TIGHT RESERVOIR PROPERTIES BY NMR, MP, AND MICRO-CT
807
Fig. 21. Volume class percentage (C) referring to class volume, sample No. 871.
The results of porosity determination were based on the pore space divi-
sion into subgroups. Each subgroup consists of the pores connected with each other but not communicated with pores from other subgroups. Sub-groups are divided into classes regarding their volume. Volume class unit is voxel. In the presented results 1 voxel [v] is equal to 5.8 × 5.8 × 5.8 =
Fig. 18. Microtomographic characteris-tics, sample No. 876.
Fig. 17. Microtomographic characteris-tics, sample No. 871.
Fig. 20. Number of porosity subgroups(N) refers to volume class, sampleNo. 876.
Fig. 19. Number of porosity subgroups (N) refers to volume class, sample No. 871.
Fig. 22. Volume class percentage (C)referring to class volume, sample No. 876.
P.I. KRAKOWSKA and E. PUSKARCZYK
808
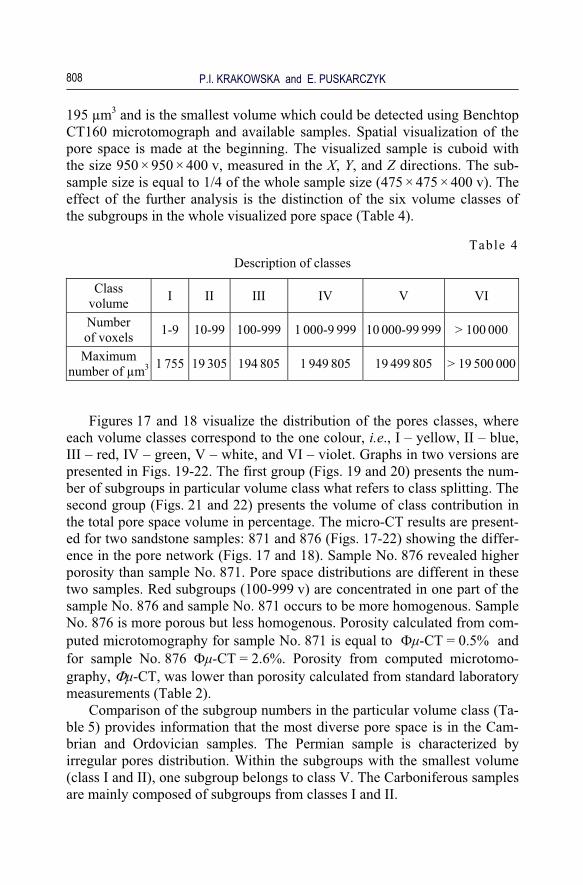
195 μm3 and is the smallest volume which could be detected using Benchtop CT160 microtomograph and available samples. Spatial visualization of the pore space is made at the beginning. The visualized sample is cuboid with the size 950 × 950 × 400 v, measured in the X, Y, and Z directions. The sub-sample size is equal to 1/4 of the whole sample size (475 × 475 × 400 v). The effect of the further analysis is the distinction of the six volume classes of the subgroups in the whole visualized pore space (Table 4).
Table 4 Description of classes
Class volume I II III IV V VI
Number of voxels 1-9 10-99 100-999 1 000-9 999 10 000-99 999 > 100 000
Maximum number of μm3 1 755 19 305 194 805 1 949 805 19 499 805 > 19 500 000
Figures 17 and 18 visualize the distribution of the pores classes, where each volume classes correspond to the one colour, i.e., I – yellow, II – blue, III – red, IV – green, V – white, and VI – violet. Graphs in two versions are presented in Figs. 19-22. The first group (Figs. 19 and 20) presents the num-ber of subgroups in particular volume class what refers to class splitting. The second group (Figs. 21 and 22) presents the volume of class contribution in the total pore space volume in percentage. The micro-CT results are present-ed for two sandstone samples: 871 and 876 (Figs. 17-22) showing the differ-ence in the pore network (Figs. 17 and 18). Sample No. 876 revealed higher porosity than sample No. 871. Pore space distributions are different in these two samples. Red subgroups (100-999 v) are concentrated in one part of the sample No. 876 and sample No. 871 occurs to be more homogenous. Sample No. 876 is more porous but less homogenous. Porosity calculated from com-puted microtomography for sample No. 871 is equal to ��-CT = 0.5% and for sample No. 876 ��-CT = 2.6%. Porosity from computed microtomo- graphy, ��-CT, was lower than porosity calculated from standard laboratory measurements (Table 2).
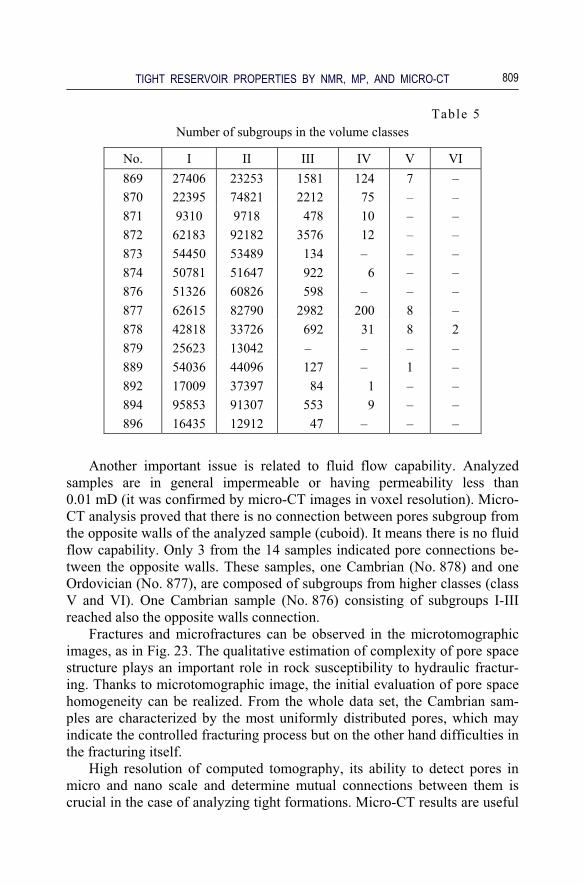
Comparison of the subgroup numbers in the particular volume class (Ta-ble 5) provides information that the most diverse pore space is in the Cam-brian and Ordovician samples. The Permian sample is characterized by irregular pores distribution. Within the subgroups with the smallest volume (class I and II), one subgroup belongs to class V. The Carboniferous samples are mainly composed of subgroups from classes I and II.
TIGHT RESERVOIR PROPERTIES BY NMR, MP, AND MICRO-CT
809
Table 5 Number of subgroups in the volume classes
No. I II III IV V VI 869 27406 23253 1581 124 7 – 870 22395 74821 2212 75 – – 871 9310 9718 478 10 – – 872 62183 92182 3576 12 – – 873 54450 53489 134 – – – 874 50781 51647 922 6 – – 876 51326 60826 598 – – – 877 62615 82790 2982 200 8 – 878 42818 33726 692 31 8 2 879 25623 13042 – – – – 889 54036 44096 127 – 1 – 892 17009 37397 84 1 – – 894 95853 91307 553 9 – – 896 16435 12912 47 – – –
Another important issue is related to fluid flow capability. Analyzed
samples are in general impermeable or having permeability less than 0.01 mD (it was confirmed by micro-CT images in voxel resolution). Micro-CT analysis proved that there is no connection between pores subgroup from the opposite walls of the analyzed sample (cuboid). It means there is no fluid flow capability. Only 3 from the 14 samples indicated pore connections be-tween the opposite walls. These samples, one Cambrian (No. 878) and one Ordovician (No. 877), are composed of subgroups from higher classes (class V and VI). One Cambrian sample (No. 876) consisting of subgroups I-III reached also the opposite walls connection.
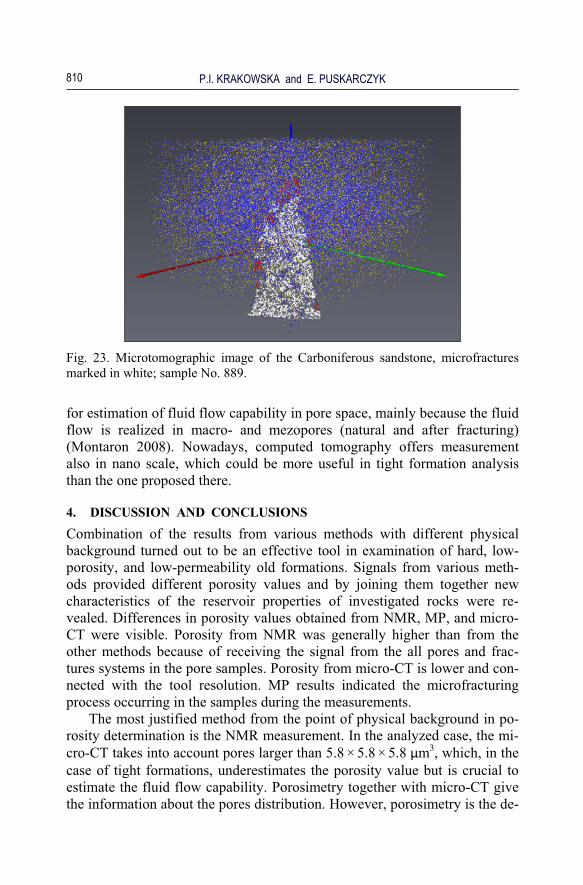
Fractures and microfractures can be observed in the microtomographic images, as in Fig. 23. The qualitative estimation of complexity of pore space structure plays an important role in rock susceptibility to hydraulic fractur-ing. Thanks to microtomographic image, the initial evaluation of pore space homogeneity can be realized. From the whole data set, the Cambrian sam-ples are characterized by the most uniformly distributed pores, which may indicate the controlled fracturing process but on the other hand difficulties in the fracturing itself.
High resolution of computed tomography, its ability to detect pores in micro and nano scale and determine mutual connections between them is crucial in the case of analyzing tight formations. Micro-CT results are useful
P.I. KRAKOWSKA and E. PUSKARCZYK
810
Fig. 23. Microtomographic image of the Carboniferous sandstone, microfractures marked in white; sample No. 889.
for estimation of fluid flow capability in pore space, mainly because the fluid flow is realized in macro- and mezopores (natural and after fracturing) (Montaron 2008). Nowadays, computed tomography offers measurement also in nano scale, which could be more useful in tight formation analysis than the one proposed there.
4. DISCUSSION AND CONCLUSIONS Combination of the results from various methods with different physical background turned out to be an effective tool in examination of hard, low-porosity, and low-permeability old formations. Signals from various meth-ods provided different porosity values and by joining them together new characteristics of the reservoir properties of investigated rocks were re-vealed. Differences in porosity values obtained from NMR, MP, and micro-CT were visible. Porosity from NMR was generally higher than from the other methods because of receiving the signal from the all pores and frac-tures systems in the pore samples. Porosity from micro-CT is lower and con-nected with the tool resolution. MP results indicated the microfracturing process occurring in the samples during the measurements.
The most justified method from the point of physical background in po-rosity determination is the NMR measurement. In the analyzed case, the mi-cro-CT takes into account pores larger than 5.8 × 5.8 × 5.8 �m3, which, in the case of tight formations, underestimates the porosity value but is crucial to estimate the fluid flow capability. Porosimetry together with micro-CT give the information about the pores distribution. However, porosimetry is the de-
TIGHT RESERVOIR PROPERTIES BY NMR, MP, AND MICRO-CT
811
structive method and the influence of mercury injection on core sample should be taken into account (overestimated effective porosity). Standard po-rosity measurements (pycnometer) meet requirement as a reference meas-urement of total porosity.
The NMR signals and T2 relaxation time distributions, cumulated curves of effective porosity and pore geometry distributions related to components of the rock porous space. Also graphs of cumulated pore specific surface were used for qualitative description of the porous space in rocks. Permea-bility calculated from NMR interpretation parameters is more accurate than standard laboratory measurements for low porosity, low permeability reser-voirs in analyzed case, and available equipment. The cluster analysis and FZI approach lead to more precise information about fluid flow abilities. In addition to giving standard parameters like effective porosity, average pore diameter or tortuosity, the MP may be also analyzed in terms of hydraulic properties. Swanson parameter is defined at the point in which mercury fills the connected pores responsible for the permeability and starts to squeeze in-to blind pores. Integration of NMR and MP results enabled getting the in-formation on pore diameter and extrapolation of the relationship to lower pores.
Microtomography allowed analyzing the pore space structure: pores ori-entation in pore space formation, microfractures presence and their direc-tions, porosity values and distribution. Micro-CT images informed about the pore space parameters graphically and numerically. 3D investigations in mi-cro-CT explained the complexity of pore space in tight rocks.
A new approach to combine the results of various methods for the effec-tive analysis of tight, low porosity, and low permeability rocks is needed with the aim of not omitting the potential of tight reservoirs.
Acknowledgmen t s . The authors express their gratitude to Polish Ministry of the Environment and Polish Geological Institute – National Re-search Institute, Warsaw, Poland, for the data. Laboratory measurements apart from mercury porosimetry were done in the Oil and Gas Institute, Kraków, Poland. Mercury porosimetry measurements were done in AGH UST, Faculty of Geology Geophysics and Environment Protection, Depart-ment of Fossil Fuels by Roman Semyrka, Ph.D. eng.
The project was founded by the National Science Centre on the basis of decision DEC-2011/03/N/ST10/05354, No. AGH 18.18.140.244.
Research was also financially supported by AGH UST FGGEP grant No. 15.11.140.053 for Ph.D. students in 2011 and statutory funds at AGH UST FGGEP, Kraków, Poland.
P.I. KRAKOWSKA and E. PUSKARCZYK
812
R e f e r e n c e s
Amaefule, J.O., M. Altunbay, D. Tiab, D.G. Kersey, and D.K. Keelan (1993), En-hanced reservoir description: using core and log data to identify hydraulic (flow) units and predict permeability in uncored intervals/wells. In: SPE Ann. Technical Conference and Exhibition, 3-6 October 1993, Houston, USA, SPE 26436-MS, 205-220, DOI: 10.2118/26436-MS.
Andrew, E.R. (1969), Nuclear Magnetic Resonance, Cambridge University Press, Cambridge.
Arns, C.H., F. Bauget, A. Ghous, A. Sakellariou, T.J. Senden, A.P. Sheppard, R.M. Sok, W.V. Pinczewski, J.C. Kelly, and M.A. Knackstedt (2005), Digi-tal core laboratory: Petrophysical analysis from 3d imaging of reservoir core fragments, Petrophysics 46, 4, 260-277.
Bakun-Czubarow, N. (1984), Petrology and elements of geochemistry.In: J. Leliwa-Kopysty�ski and R. Teisseyre (eds.), Constitution of the Earth’s Interior. Vol. 1, Physics and Evolution of the Earth‘s Interior, PWN – Polish Scien-tific Publ., Warszawa, Elsevier, Amsterdam, 326-357.
Bielecki, J. (2011), Investigation of complex structures by means of computed to-mography method, Ph.D. Thesis, Institute of Nuclear Physics, Polish Acad-emy of Sciences, Poland.
Bielecki, J., S. Boek, E. Dutkiewicz, R. Hajduk, J. Jarzyna, J. Lekki, T. Pieprzyca, Z. Stachura, Z. Szklarz, and W.M. Kwiatek (2012), Preliminary investiga-tions of elemental content, microporosity, and specific surface area of po-rous rocks using PIXE and X-ray microtomography techniques, Acta Phys. Pol. 121, 2, 474-479.
Coates, G., and S. Denoo (1981), The producibility answer product, The Tech. Rev. 29, 2, 54-63.
Coates, G.R., L. Xiao, and M.G. Prammer (1999), NMR logging. Principles and Ap-plications, Haliburton Energy Services, Huston, 234 pp.
Czeka�ski, E., and Group in POGC Co. (2012), Carboniferous – prospects of new hydrocarbon reservoirs discoveries, Sci. Works Oil and Gas Inst.182 (in Polish).
Dadlez, R., S. Marek, and J. Pokorski (2000), Geological map of Poland without Cainozoic deposits, scale 1:1 000 000, Polish Geological Institute, Warsaw, Poland.
Dohnalik, M. (2013), Improving the ability of determining reservoir rocks parame-ters using X-ray computed microtomography, Ph.D. Thesis, AGH Universi-ty of Science and Technology, Kraków, Poland.
Jarzyna, J., and E. Puskarczyk (2010), Nuclear magnetic resonance (NMR) and mer-cury porosimetry measurements for permeability determination. In: G. Christofides et al. (eds.), Proc. 19th Congress of the Carpathian-Balkan Geological Association, 23-26 September 2010, Thessaloniki, Greece, Sci-entific Annals, School of Geology, Sp. Vol. 99, 371-376.
TIGHT RESERVOIR PROPERTIES BY NMR, MP, AND MICRO-CT
813
Jarzyna, J.A., P.I. Krakowska, and E. Puskarczyk (2012), Tight Precambrian and Paleozoic reservoirs in the light of petrophysical analysis. In: Proc. 74th EAGE Conference and Exhibition incorporating EUROPEC 2012, 4-7 June 2012, Copenhagen, Denmark, DOI: 10.3997/2214-4609.20148228.
Jaworowski, K., and Z. Miko�ajewski (2007), Oil- and gas-bearing sediments of the Main Dolomite (Ca2) in the Midzychód region: a depositional model and the problem of the boundary between the second and third depositional se-quences in the Polish Zechstein Basin, Prz. Geol. 55, 12/1, 1017-1024 (in Polish).
Liu, Z.H., C.C. Zhou, L.H. Zhang, D.J. Dai, C.L. Li, L. Zhang, G.Q. Liu, and Y.J. Shi (2007), An innovative method to evaluate formation pore structure using NMR logging data. In: Proc. SPWLA 48th Annual Logging Symposi-um, 3-6 June 2007, Austin, USA, SPWLA-2007-S.
MacQueen, J.B. (1967), Some methods for classification and analysis of multivari-ate observations. In: Proc. 5th Berkeley Symp. Mathematical Statistics and Probability, University of California Press, Berkeley, 281-297.
Mao, Z.-Q., L. Xiao, Z.-N. Wang, Y. Jin, X.-G. Liu, and B. Xie (2013), Estimation of permeability by integrating nuclear magnetic resonance (NMR) logs with mercury injection capillary pressure (MICP) data in tight gas sands, Appl. Magn. Reson. 44, 4, 449-468, DOI: 10.1007/s00723-012-0384-z.
Monk, D. (2013), Unconventional reservoir sweet spots from geophysics (editorial), Oilfield Rev. Winter 2013/2014, 1.
Montaron, B. (2008), Connectivity theory – a new approach to modeling “non-Archie” rocks. In: Proc. SPWLA 49th Annual Logging Symposium, 25-28 May 2008, Edinburgh, Scotland, SPWLA-2008-GGGG.
Pittman, E.D. (1992), Relationship of porosity and permeability to various parame-ters derived from mercury injection-capillary pressure curves for sandstone, AAPG Bull. 76, 2, 191-198.
Puskarczyk, E. (2011), Assessment of reservoir properties of rock through nuclear magnetic resonance phenomenon application, Ph.D. Thesis, AGH Universi-ty of Science and Technology, Kraków, Poland (in Polish).
Puskarczyk, E. and J. Jarzyna (2012), New method of NMR signals fitting using ‘Distribution’ program. In: Proc. 74th EAGE Conference and Exhibition incorporating EUROPEC 2012, 4-7 June 2012, Copenhagen, Denmark, DOI: 10.3997/2214-4609.20148554.
Semyrka, G., J. Jarzyna, R. Semyrka, M. Ka�mierczuk, and L. Pikulski (2010), Res-ervoir parameters of lithostratigraphic successions of the lower Paleozoic strata in the Polish part of the Baltic region based on laboratory studies and well logs, Geol. Quart. 54, 2, 227-240.
Straley, Ch., D. Rossini, H. Vinegar, P. Tutunjian, and Ch. Morriss (1997), Core analysis by low-field NMR, The Log Analyst 38, 2, 84-94.
P.I. KRAKOWSKA and E. PUSKARCZYK
814
Such, P., G. Le�niak, and M. S�ota (2010), Quantitative porosity and permeability characterization of potential Rotliegend tight gas reservoir, Prz. Geol. 58, 4, 345-351 (in Polish).
Swanson, B.F. (1981), A simple correlation between permeabilities and mercury ca-pillary pressures, J. Petrol. Technol. 33, 12, 2498-2504, DOI: 10.2118/ 8234-PA.
Thomeer, J.H. (1983), Air permeability as a function of three pore-network parame-ters, J. Petrol. Technol. 35, 4, 809-814, DOI: 10.2118/10922-PA.
Vavra, C.L., J.G. Kaldi, and R.M. Sneider (1992), Geological applications of capil-lary pressure: A review, AAPG Bull. 76, 6, 840-850.
Webb, P.A. (2001), An introduction to the physical characterization of materials by mercury intrusion porosimetry with emphasis on reduction and presentation of experimental data, Micrometrics Instrument Corp., Norcross, USA.
Wojtanowski, K. (2011), Algorithm and application program to processing and in-terpretation of capillary pressure data, M.Sc. Thesis, AGH University of Science and Technology, FGGEP, Kraków, Poland.
Xiao, L., Z.Q. Mao, Z.X. Xiao, and C. Zhang (2008), A new method to evaluate pore structure consecutively using NMR and capillary pressure data. In: Proc. SPWLA 49th Annual Logging Symposium, 25-28 May 2008, Edin-burgh, Scotland, SPWLA-2008-AA.
Xiao, L., X.-P. Liu, C.-C. Zou, X.-X. Hu, Z.-Q. Mao, Y.-J. Shi, H.-P. Guo, and G.-R. Li (2014), Comparative study of models for predicting permeability from nuclear magnetic resonance (NMR) logs in two Chinese tight sand-stone reservoirs, Acta Geophys. 62, 1, 116-141, DOI: 10.2478/s11600-013-0165-6.
Zalewska, J., M. Dohnalik, J. Kaczmarczyk, A. Poszytek, G. Sikora, D. Cebulski, M. Mas�owski, and E. Bia�y (2010), X-ray computed microtomography in examination of carbonate rocks, Sci. Works Oil and Gas Inst. 171, 1-263 (in Polish).
Zalewska, J., M. Dohnalik, G. �ykowska, and J. Kiernicki (2011), Laboratory of the rocks and reservoir fluids geophysical parameters, Report no. 37/11/2011, Oil and Gas Institute, Kraków, Poland (in Polish).
Zorski, T. (2009), Recent improvements in interpretation methodology applied in GeoWin SATUN application, AGH Geologia 35, 2/1, 549-557.
Zorski, T., A. Ossowski, J. rodo�, and T. Kawiak (2011), Evaluation of mineral composition and petrophysical parameters by the integration of core analy-sis data and wireline well log data: the Carpathian Foredeep case study, Clay Minerals 46, 1, 25-45, DOI: 10.1180/claymin.2011.046.1.25.
Received 4 May 2014 Accepted 18 June 2014