
ACT Budget 2018-19. Budget Statements A · Web viewThe variation between the 2017-18 Budget and...
58
Contents ACT EXECUTIVE......................................................1 Purpose.......................................................... 1 201819 Priorities................................................ 1 Estimated Employment Level.......................................1 Changes to Appropriation.........................................2 Financial Statements – Territorial...............................3 Notes to the Territorial Budget Statements.......................7 AUDITOR-GENERAL....................................................9 Purpose.......................................................... 9 2018-19 Priorities............................................... 9 Estimated Employment Level.......................................9 Strategic Objectives and Indicators.............................10 Changes to Appropriation........................................11 Financial Statements – Controlled...............................13 Notes to the Controlled Budget Statements.......................17 ELECTORAL COMMISSIONER............................................19 Purpose......................................................... 19 2018-19 Priorities.............................................. 19 Estimated Employment Level......................................19 Changes to Appropriation........................................20 Financial Statements – Controlled...............................21 Notes to the Controlled Budget Statements.......................25 OFFICE OF THE LEGISLATIVE ASSEMBLY................................27 Purpose......................................................... 27 2018-19 Priorities.............................................. 27 Estimated Employment Level......................................28 Changes to Appropriation........................................29 Financial Statements – Controlled...............................31 Notes to the Controlled Budget Statements.......................36 201819 Budget Statements i
Transcript of ACT Budget 2018-19. Budget Statements A · Web viewThe variation between the 2017-18 Budget and...

ContentsACT EXECUTIVE......................................................................................................................................1
Purpose.............................................................................................................................................1
201819 Priorities...............................................................................................................................1
Estimated Employment Level............................................................................................................1
Changes to Appropriation..................................................................................................................2
Financial Statements – Territorial......................................................................................................3
Notes to the Territorial Budget Statements......................................................................................7
AUDITOR-GENERAL................................................................................................................................9
Purpose.............................................................................................................................................9
2018-19 Priorities..............................................................................................................................9
Estimated Employment Level............................................................................................................9
Strategic Objectives and Indicators.................................................................................................10
Changes to Appropriation................................................................................................................11
Financial Statements – Controlled...................................................................................................13
Notes to the Controlled Budget Statements....................................................................................17
ELECTORAL COMMISSIONER...............................................................................................................19
Purpose............................................................................................................................................19
2018-19 Priorities............................................................................................................................19
Estimated Employment Level..........................................................................................................19
Changes to Appropriation................................................................................................................20
Financial Statements – Controlled...................................................................................................21
Notes to the Controlled Budget Statements....................................................................................25
OFFICE OF THE LEGISLATIVE ASSEMBLY..............................................................................................27
Purpose............................................................................................................................................27
2018-19 Priorities............................................................................................................................27
Estimated Employment Level..........................................................................................................28
Changes to Appropriation................................................................................................................29
Financial Statements – Controlled...................................................................................................31
Notes to the Controlled Budget Statements....................................................................................36
Financial Statements – Territorial....................................................................................................37
Notes to the Territorial Budget Statements....................................................................................41
201819 Budget Statements i

201819 Budget Statements ii

This page intentionally left blank
201819 Budget Statements iii

ACT EXECUTIVE
PurposeThe ACT Executive consists of the Chief Minister and other Ministers appointed by the Chief Minister. The ACT Executive has powers under the Australian Capital Territory (Self-Government) Act 1988 to govern the Territory and execute and maintain enactments and laws.
201819 PrioritiesThe ACT Executive will be leading the Government’s agenda and progressing key priorities across directorates for 2018-19. The key focus will be providing the core services a growing city needs, continuing to deliver strong governance and accountability for Canberrans, and further strengthening community engagement.
Estimated Employment Level
Table 1: Estimated Employment Level
201617Actual
Outcome
201718Budget
201718Estimated Outcome
201819Budget
Staffing (FTE) 53 54 54 54
201819 Budget Statements 4 ACT Executive

Changes to Appropriation
Table 2: Changes to appropriation – Expenses on Behalf of the Territory
2017-18 Estimated Outcome
$'000
2018-19 Budget
$'000
2019-20 Estimate
$'000
2020-21 Estimate
$'000
2021-22 Estimate
$'000
2017-18 Budget 10,406 10,563 10,713 10,868 10,868
2018-19 Budget Technical AdjustmentsRemuneration Tribunal Outcome - MLAs 0 58 58 58 58Revised Indexation Parameters 0 0 0 0 145Revised Superannuation Parameters -29 -1 0 1 2
2018-19 Budget 10,377 10,620 10,771 10,927 11,073
201819 Budget Statements 5 ACT Executive

Financial Statements – Territorial
Table 3: ACT Executive: Statement of Income and Expenses on Behalf of the Territory
201718 Budget
$'000
201718 Estimated Outcome
$'000
201819 Budget
$'000
Var%
201920 Estimate
$'000
202021 Estimate
$'000
202122 Estimate
$'000
Income
Revenue10,406 Payment for Expenses on
Behalf of the Territory10,377 10,620 2 10,771 10,927 11,073
1,356 Resources Received Free of Charge
1,356 1,373 1 1,390 1,392 1,410
11,762 Total Revenue 11,733 11,993 2 12,161 12,319 12,483
Gains0 Other Gains 96 0 -100 0 0 0
0 Total Gains 96 0 -100 0 0 0
11,762 Total Income 11,829 11,993 1 12,161 12,319 12,483
Expenses 8,110 Employee Expenses 8,117 8,262 2 8,368 8,473 8,5811,139 Superannuation Expenses 1,110 1,161 5 1,176 1,191 1,2062,553 Supplies and Services 2,554 2,611 2 2,659 2,708 2,760
22 Depreciation and Amortisation
42 49 17 49 43 28
11,824 Total Expenses 11,823 12,083 2 12,252 12,415 12,575
-62 Operating Result 6 -90 # -91 -96 -92
-62 Total Comprehensive Income
6 -90 # -91 -96 -92
Note:1. In all years the negative operating result and total comprehensive income reflects the impact of depreciation and the
forecast movement in employee entitlements. There is an offsetting impact in the 2017-18 estimated outcome due to the transfer of furniture assets from the Office of the Legislative Assembly associated with fitouts following the expansion of the Legislative Assembly from 17 to 25 members in 2016-17.
201819 Budget Statements 6 ACT Executive

Table 4: ACT Executive: Statement of Assets and Liabilities on Behalf of the Territory
Budgetat
30/6/18 $'000
Est. Outcomeas at
30/6/18$'000
Budgetat
30/6/19 $'000
Var%
Estimateat
30/6/20 $'000
Estimateat
30/6/21 $'000
Estimateat
30/6/22 $'000
Current Assets104 Cash and Cash Equivalents 117 117 - 117 117 11736 Receivables 86 86 - 87 88 90
140 Total Current Assets 203 203 - 204 205 207
Non Current Assets49 Property, Plant and
Equipment254 229 -10 204 179 154
59 Intangible Assets 73 49 -33 25 6 2
108 Total Non Current Assets 327 278 -15 229 185 156
248 TOTAL ASSETS 530 481 -9 433 390 363
Current Liabilities0 Payables 137 138 1 141 144 149
870 Employee Benefits 758 797 5 836 884 941
870 Total Current Liabilities 895 935 4 977 1,028 1,090
Non Current Liabilities0 Employee Benefits 55 56 2 57 59 62
0 Total Non Current Liabilities
55 56 2 57 59 62
870 TOTAL LIABILITIES 950 991 4 1,034 1,087 1,152
-622 NET ASSETS -420 -510 -21 -601 -697 -789
REPRESENTED BY FUNDS EMPLOYED
-623 Accumulated Funds -426 -516 -21 -607 -703 -7951 Asset Revaluation Surplus 6 6 - 6 6 6
-622 TOTAL FUNDS EMPLOYED -420 -510 -21 -601 -697 -789
201819 Budget Statements 7 ACT Executive

Table 5: ACT Executive: Statement of Changes in Equity on Behalf of the Territory
Budgetat
30/6/18 $'000
Est. Outcomeas at
30/6/18$'000
Budgetat
30/6/19 $'000
Var%
Estimateat
30/6/20 $'000
Estimateat
30/6/21 $'000
Estimateat
30/6/22 $'000
Opening Equity-561 Opening Accumulated
Funds-432 -426 1 -516 -607 -703
1 Opening Asset Revaluation Reserve
6 6 - 6 6 6
-560 Balance at the Start of the Reporting Period
-426 -420 1 -510 -601 -697
Comprehensive Income-62 Operating Result -
Including Economic Flows6 -90 # -91 -96 -92
-62 Total Comprehensive Income
6 -90 # -91 -96 -92
0 Total Movement in Reserves
0 0 - 0 0 0
Closing Equity-623 Closing Accumulated
Funds-426 -516 -21 -607 -703 -795
1 Closing Asset Revaluation Reserve
6 6 - 6 6 6
-622 Balance at the end of the Reporting Period
-420 -510 -21 -601 -697 -789
201819 Budget Statements 8 ACT Executive

Table 6: ACT Executive: Cash Flow Statement on Behalf of the Territory
2017-18 Budget
$'000
2017-18 Estimated Outcome
$'000
2018-19 Budget
$'000
Var %
2019-20 Estimate
$'000
2020-21 Estimate
$'000
2021-22 Estimate
$'000
CASH FLOWS FROM OPERATING ACTIVITIESReceipts
10,406 Payment for Expenses on Behalf of the Territory
10,377 10,620 2 10,771 10,927 11,073
107 Other 107 99 -7 103 103 10310,513 Operating Receipts 10,484 10,719 2 10,874 11,030 11,176
Payments8,107 Employee 8,107 8,264 2 8,353 8,448 8,5461,139 Superannuation 1,110 1,161 5 1,176 1,191 1,2061,160 Supplies and Services 1,160 1,195 3 1,242 1,288 1,321107 Other 107 99 -7 103 103 103
10,513 Operating Payments 10,484 10,719 2 10,874 11,030 11,176
0 NET CASH INFLOW/(OUTFLOW) FROM OPERATING ACTIVITIES
0 0 - 0 0 0
CASH FLOWS FROM INVESTING ACTIVITIES
Payments0 Purchase of Property, Plant
and Equipment89 0 -100 0 0 0
0 Investing Payments 89 0 -100 0 0 0
0 NET CASH INFLOW/(OUTFLOW) FROM INVESTING ACTIVITIES
-89 0 100 0 0 0
0 NET INCREASE/(DECREASE) IN CASH AND CASH EQUIVALENTS
-89 0 100 0 0 0
104 CASH AT THE BEGINNING OF REPORTING PERIOD
206 117 -43 117 117 117
104 CASH AT THE END OF REPORTING PERIOD
117 117 - 117 117 117
201819 Budget Statements 9 ACT Executive

Notes to the Territorial Budget StatementsSignificant variations are as follows:
Statement of Income and Expenses on behalf of the Territory
Other Gains:
- the increase of $0.096 million in the 201718 estimated outcome from the original budget is mainly due to the transfer of furniture assets from the Office of the Legislative Assembly associated with fitouts following the expansion of the Legislative Assembly from 17 to 25 members in 2016-17.
Statement of Assets and Liabilities on behalf of the Territory
Property, Plant and Equipment:
- the increase of $0.205 million in the 201718 estimated outcome from the original budget is mainly due to the transfer of furniture assets from the Office of the Legislative Assembly associated with fitouts following the expansion of the Legislative Assembly from 17 to 25 members in 2016-17.
Statement of Changes in Equity on behalf of the Territory
There are no significant variations to be explained for this statement.
Cash Flow Statement on behalf of the Territory
Variations for this statement are explained in the notes above.
201819 Budget Statements 10 ACT Executive

This page intentionally left blank
201819 Budget Statements 11 ACT Executive

AUDITOR-GENERAL
PurposeThe Auditor-General is an independent Officer of the Legislative Assembly and aims to promote public accountability for the effective and efficient provision of ACT public services by providing independent, evidenced-based audit reports to the ACT Legislative Assembly and ACT community on these services.
The Auditor-General, subject to Territory laws, has complete discretion in performing audits. The Auditor-General makes recommendations to ACT Government agencies and Legislative Assembly Committees on how improvements could be made to services and programs provided by the ACT public sector.
The Auditor-General also responds to representations and public interest disclosures made by members of the Legislative Assembly and the community.
The ACT Audit Office supports the Auditor-General in carrying out these activities.
2018-19 PrioritiesThe main priorities for 2018-19 include:
completing a planned program of performance audits which meets the expectations of the Legislative Assembly and ACT community and achieving an even spread of these audits during the year;
completing an annual program of audits of financial statements and reviews of statements of performance within required timeframes including completing the summary reports on the results of these audits and reviews;
completing performance audits and financial audits in accordance with professional auditing requirements and maintaining compliance with the Quality Control Standards;
responding to representations and public interest disclosures made by members of the Legislative Assembly and the community; and
addressing any recommendations from internal audit and quality assurance reviews.
201819 Budget Statements 12 Auditor-General

Estimated Employment Level
Table 1: Estimated Employment Level
2016-17Actual
Outcome
2017-18Budget
2017-18Estimated Outcome
2018-19Budget
Staffing (FTE) 33 37 37 35
Strategic Objectives and Indicators
Strategic Objective 1 Business and Corporate Strategies
The Audit Office will be operating under its ‘Strategic Plan 2018-2021’. This plan is supported by individual action plans for performance audit, financial audit and professional services (corporate) activities for 2018-19.
The main strategies the Audit Office plans to use to achieve its objectives include the:
provision of informative and evidenced-based reports on the results of the performance audits and financial audits to the ACT Legislative Assembly;
provision of advice and briefings to ACT Legislative Assembly committees, including the Standing Committee on Public Accounts;
completion of audits efficiently and effectively in accordance with professional auditing requirements;
continuation of bringing the performance audit work forward to achieve a more even spread of performance audits; and
improvement in performance by:
- addressing recommendations from internal audits and quality control reviews of performance audit and financial audit work;
- providing learning and development opportunities to staff; and
- responding to feedback provided in surveys by audited agencies and Audit Office staff.
201819 Budget Statements 13 Auditor-General

Changes to Appropriation
Table 2: Changes to appropriation – Controlled Recurrent Payments
2017-18 Estimated Outcome
$'000
2018-19 Budget
$'000
2019-20 Estimate
$'000
2020-21 Estimate
$'000
2021-22 Estimate
$'000
2017-18 Budget 2,894 2,935 2,947 2,977 2,977
2018-19 Budget Policy DecisionsBetter Government - More resources for the ACT Auditor-General
0 0 280 560 571
2018-19 Budget Technical AdjustmentsComcare Premium adjustment -5 0 0 0 0Revised Wage Parameters 0 20 49 78 107Revised Indexation Parameters 0 7 0 0 -12Revised Superannuation Guarantee Rate 0 3 5 11 11Revised Superannuation Parameters -34 -16 -11 -5 -5
2018-19 Budget 2,855 2,949 3,270 3,621 3,649
201819 Budget Statements 14 Auditor-General

Table 3: Changes to appropriation – Capital Injections, Controlled
2017-18 Estimated Outcome
$'000
2018-19 Budget
$'000
2019-20 Estimate
$'000
2020-21 Estimate
$'000
2021-22 Estimate
$'000
2017-18 Budget 0 0 0 0 0
2018-19 Budget Technical AdjustmentsRevised Wage Parameters 0 9 0 0 0
2018-19 Budget 0 9 0 0 0
201819 Budget Statements 15 Auditor-General

Financial Statements – Controlled
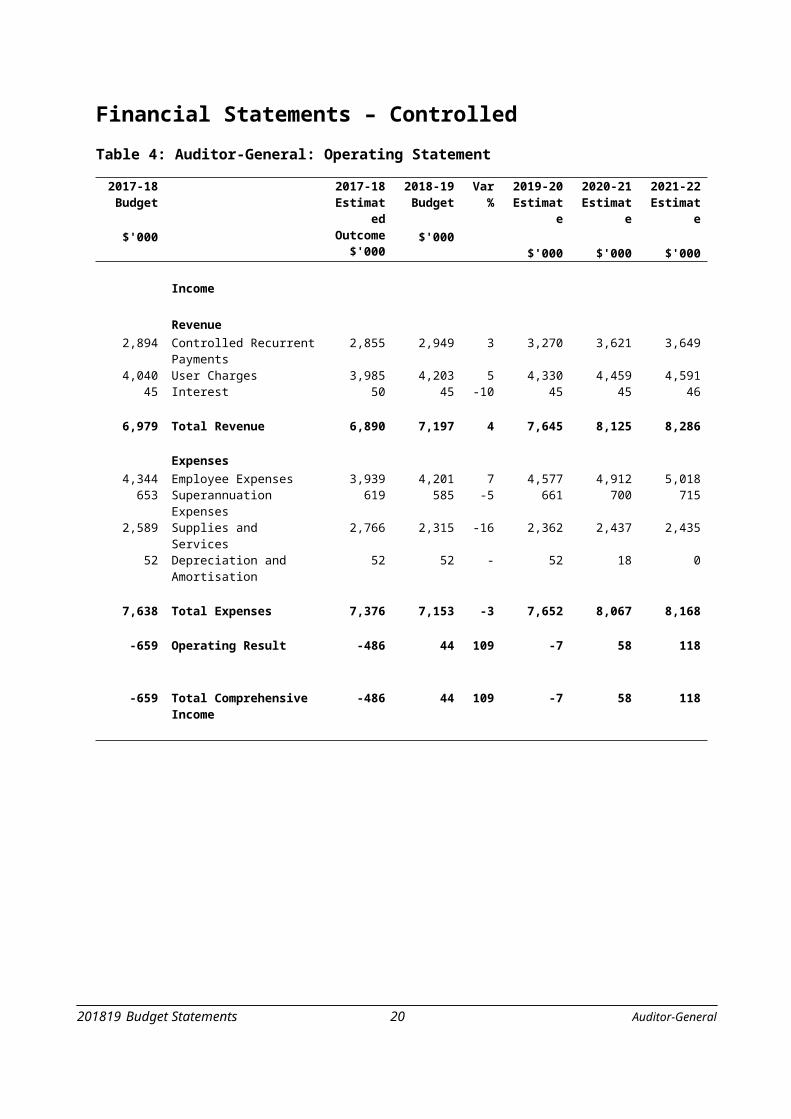
Table 4: Auditor-General: Operating Statement
2017-18 Budget
$'000
2017-18 Estimated Outcome
$'000
2018-19 Budget
$'000
Var%
2019-20 Estimate
$'000
2020-21 Estimate
$'000
2021-22 Estimate
$'000
Income
Revenue2,894 Controlled Recurrent
Payments2,855 2,949 3 3,270 3,621 3,649
4,040 User Charges 3,985 4,203 5 4,330 4,459 4,59145 Interest 50 45 -10 45 45 46
6,979 Total Revenue 6,890 7,197 4 7,645 8,125 8,286
Expenses 4,344 Employee Expenses 3,939 4,201 7 4,577 4,912 5,018653 Superannuation Expenses 619 585 -5 661 700 715
2,589 Supplies and Services 2,766 2,315 -16 2,362 2,437 2,43552 Depreciation and
Amortisation52 52 - 52 18 0
7,638 Total Expenses 7,376 7,153 -3 7,652 8,067 8,168
-659 Operating Result -486 44 109 -7 58 118
-659 Total Comprehensive Income
-486 44 109 -7 58 118
201819 Budget Statements 16 Auditor-General

Table 5: Auditor-General: Balance Sheet
Budgetat
30/6/18 $'000
2017-18 Estimated Outcome
$'000
Budgetat
30/6/19 $'000
Var%
Estimateat
30/6/20 $'000
Estimateat
30/6/21 $'000
Estimateat
30/6/22 $'000
Current Assets1,483 Cash and Cash Equivalents 1,581 1,282 -19 1,511 1,475 1,4111,410 Receivables 1,401 1,483 6 1,457 1,737 2,090
17 Other Assets 25 25 - 25 25 25
2,910 Total Current Assets 3,007 2,790 -7 2,993 3,237 3,526
Non Current Assets122 Property, Plant and
Equipment122 70 -43 18 0 0
122 Total Non Current Assets 122 70 -43 18 0 0
3,032 TOTAL ASSETS 3,129 2,860 -9 3,011 3,237 3,526
Current Liabilities186 Payables 209 209 - 209 209 209
1,655 Employee Benefits 1,420 1,079 -24 1,218 1,366 1,518
1,841 Total Current Liabilities 1,629 1,288 -21 1,427 1,575 1,727
Non Current Liabilities151 Employee Benefits 112 131 17 150 170 18986 Other Liabilities 86 86 - 86 86 86
237 Total Non Current Liabilities 198 217 10 236 256 275
2,078 TOTAL LIABILITIES 1,827 1,505 -18 1,663 1,831 2,002
954 NET ASSETS 1,302 1,355 4 1,348 1,406 1,524
REPRESENTED BY FUNDS EMPLOYED
666 Accumulated Funds 1,018 1,071 5 1,064 1,122 1,240288 Asset Revaluation Surplus 284 284 - 284 284 284
954 TOTAL FUNDS EMPLOYED 1,302 1,355 4 1,348 1,406 1,524
201819 Budget Statements 17 Auditor-General

Table 6: Auditor-General: Statement of Changes in Equity
Budgetat
30/6/18 $'000
2017-18 Estimated Outcome
$'000
Budgetat
30/6/19 $'000
Var%
Estimateat
30/6/20 $'000
Estimateat
30/6/21 $'000
Estimateat
30/6/22 $'000
Opening Equity1,325 Opening Accumulated Funds 1,504 1,018 -32 1,071 1,064 1,122288 Opening Asset Revaluation
Reserve284 284 - 284 284 284
1,613 Balance at the Start of the Reporting Period
1,788 1,302 -27 1,355 1,348 1,406
Comprehensive Income-659 Operating Result -486 44 109 -7 58 118
-659 Total Comprehensive Income
-486 44 109 -7 58 118
Closing Equity666 Closing Accumulated Funds 1,018 1,071 5 1,064 1,122 1,240288 Closing Asset Revaluation
Reserve284 284 - 284 284 284
954 Balance at the end of the Reporting Period
1,302 1,355 4 1,348 1,406 1,524
201819 Budget Statements 18 Auditor-General

Table 7: Auditor-General: Cash Flow Statement
2017-18 Budget
$'000
2017-18 Estimated Outcome
$'000
2018-19 Budget
$'000
Var %
2019-20 Estimate
$'000
2020-21 Estimate
$'000
2021-22 Estimate
$'000
CASH FLOWS FROM OPERATING ACTIVITIESReceipts
2,894 Controlled Recurrent Payments
2,855 2,949 3 3,270 3,621 3,649
4,204 User Charges 4,137 4,333 5 4,667 4,541 4,73345 Interest Received 45 45 - 45 45 46
281 Other 529 427 -19 478 462 4777,424 Operating Receipts 7,566 7,754 2 8,460 8,669 8,905
Payments4,008 Employee 3,921 4,349 11 4,342 4,737 4,902735 Superannuation 701 681 -3 770 832 855
2,885 Supplies and Services 3,305 2,767 -16 2,856 2,873 2,949275 Other 275 265 -4 263 263 263
7,903 Operating Payments 8,202 8,062 -2 8,231 8,705 8,969
-479 NET CASH INFLOW/(OUTFLOW) FROM OPERATING ACTIVITIES
-636 -308 52 229 -36 -64
CASH FLOWS FROM FINANCING ACTIVITIESReceipts
0 Capital Injections 0 9 # 0 0 00 Financing Receipts 0 9 # 0 0 0
Payments0 Financing Payments 0 0 - 0 0 0
0 NET CASH INFLOW/(OUTFLOW) FROM FINANCING ACTIVITIES
0 9 # 0 0 0
-479 NET INCREASE/(DECREASE) IN CASH AND CASH EQUIVALENTS
-636 -299 53 229 -36 -64
1,962 CASH AT THE BEGINNING OF REPORTING PERIOD
2,217 1,581 -29 1,282 1,511 1,475
1,483 CASH AT THE END OF REPORTING PERIOD
1,581 1,282 -19 1,511 1,475 1,411
201819 Budget Statements 19 Auditor-General
Notes to the Controlled Budget StatementsSignificant variations are explained below.
Operating Statement
Employee Expenses:
- The 2017-18 estimated outcome was $0.405 million lower than the 2017-18 Budget as the departure of financial and performance audit staff resulted in a lower than anticipated full time equivalent staff in 2017-18.
- The increase of $0.262 million in the 2018-19 Budget from the 2017-18 estimated outcome reflects the budget assumption that the budgeted number of audit staff will be maintained in 2018-19.
Supplies and Services:
- The 2017-18 estimated outcome was $0.177 million higher than the 2017-18 Budget due mainly to higher performance audit contractor costs to replace departing performance audit staff.
- The decrease of $0.451 million in the 2018-19 Budget from the 2017-18 estimated outcome reflects a decrease in performance audit contractor costs as the number of performance audits delivered in 2018-19 will be reduced by one. In 2017-18, the Audit Office used its cash reserves to do an additional performance audit as recommended by the strategic reviewer.
Balance Sheet
Cash and Cash Equivalents:
- The 2017-18 estimated outcome was $0.098 million higher than the Budget mainly due to a higher than anticipated cash balance at the beginning of the year.
- The Budget at 30 June 2019 is $0.299 million lower than the 2017-18 estimated outcome as cash is anticipated to be used to pay leave entitlements for an executive staff member.
Statement of Changes in Equity
Variations in this statement are explained in the notes above.
201819 Budget Statements 20 Auditor-General

Cash Flow Statement
Variations in this statement are explained in the notes above.
This page intentionally left blank
201819 Budget Statements 21 Auditor-General

ELECTORAL COMMISSIONER
PurposeThe Electoral Commissioner is an independent statutory office holder under the Electoral Act 1992. The Electoral Commissioner is a member of the ACT Electoral Commission, which consists of three statutory office holders – the Chairperson, the Electoral Commissioner and one other Member. The Electoral Commissioner is assisted by officers employed under the Public Sector Management Act 1994 and the Electoral Act. The Electoral Commissioner is the chief executive officer of the Commission.
The ACT Electoral Commission is responsible for:
the conduct of elections and referendums for the ACT Legislative Assembly; the determination of electoral boundaries for the ACT; and the provision of electoral information, education, advice and services to a wide range of
clients.
2018-19 PrioritiesMajor priorities for 2018-19 include:
undertaking a redistribution of electoral boundaries for the ACT;
administering ongoing financial disclosure scheme functions, including monitoring of compliance with disclosure obligations by political parties, candidates and other election participants;
reviewing and enhancing ICT systems to ensure readiness for the 2020 ACT Legislative Assembly election;
conducting non-parliamentary elections, including the ACT Government enterprise agreement ballots; and
continuing to provide a comprehensive electoral education program.
Estimated Employment Level
Table 1: Estimated Employment Level
2016-17Actual
Outcome
2017-18Budget
2017-18Estimated Outcome
2018-19Budget
Staffing (FTE) 13.4 9 111 9Note:1. The variation between the 2017-18 Budget and the 2017-18 Estimated Outcome is due to the backfilling of one
employee on long service leave and the engagement of a project officer to assist in the development and testing of electoral ICT systems. The table does not include two part time statutory office holders and election casuals employed under the Electoral Act 1992.
201819 Budget Statements 22 Electoral Commissioner

Changes to Appropriation
Table 2: Changes to appropriation – Controlled Recurrent Payments
2017-18 Estimated Outcome
$'000
2018-19 Budget
$'000
2019-20 Estimate
$'000
2020-21 Estimate
$'000
2021-22 Estimate
$'000
2017-18 Budget 2,954 3,008 3,073 3,141 3,141
FMA Section 16B Rollovers from 2016-17Rollover - 2016-17 Controlled Recurrent Payments 150 0 0 0 0
2018-19 Budget Policy DecisionsBetter Government - Electronic voting 0 0 0 75 75
2018-19 Budget Technical AdjustmentsRevised Superannuation Parameters -39 -75 -86 -99 -101Estimated Outcome - End of Year estimate -259 259 0 0 0Estimated Outcome - Electoral Services Funding 0 27 628 5,551 0Revised Wage Parameters 0 16 38 60 83Revised Superannuation Guarantee Rate 0 2 4 7 7Revised Indexation Parameters 0 0 0 0 57
2018-19 Budget 2,806 3,237 3,657 8,735 3,262
Table 3: Changes to appropriation – Capital Injections, Controlled
2017-18 Estimated Outcome
$'000
2018-19 Budget
$'000
2019-20 Estimate
$'000
2020-21 Estimate
$'000
2021-22 Estimate
$'000
2017-18 Budget 0 0 0 0 0
FMA Section 16B Rollovers from 2016-17Rollover - Electoral ICT Systems Upgrade 235 0 0 0 0
2018-19 Budget Policy DecisionsBetter Government - Electronic voting 0 196 240 0 0
2018-19 Budget Technical AdjustmentsRevised Wage Parameters 0 7 0 0 0
2018-19 Budget 235 203 240 0 0
201819 Budget Statements 23 Electoral Commissioner

Financial Statements – Controlled
Table 4: Electoral Commissioner: Operating Statement
2017-18 Budget
$'000
2017-18 Estimated Outcome
$'000
2018-19 Budget
$'000
Var%
2019-20 Estimate
$'000
2020-21 Estimate
$'000
2021-22 Estimate
$'000
Revenue2,954 Controlled Recurrent
Payments2,806 3,237 15 3,657 8,735 3,262
23 User Charges 69 23 -67 23 25 260 Interest 16 16 - 16 16 16
2,977 Total Revenue 2,891 3,276 13 3,696 8,776 3,304
Expenses 1,300 Employee Expenses 1,182 1,335 13 1,732 2,925 1,443263 Superannuation Expenses 159 198 25 243 351 220
1,395 Supplies and Services 1,501 1,714 14 1,692 5,471 1,611190 Depreciation and
Amortisation194 108 -44 104 167 191
3,148 Total Expenses 3,036 3,355 11 3,771 8,914 3,465
-171 Operating Result -145 -79 46 -75 -138 -161
-171 Total Comprehensive Income
-145 -79 46 -75 -138 -161
201819 Budget Statements 24 Electoral Commissioner

Table 5: Electoral Commissioner: Balance Sheet
Budgetat
30/6/18 $'000
2017-18 Estimated Outcome
$'000
Budgetat
30/6/19 $'000
Var%
Estimateat
30/6/20 $'000
Estimateat
30/6/21 $'000
Estimateat
30/6/22 $'000
Current Assets725 Cash and Cash Equivalents 925 941 2 957 973 98983 Receivables 68 68 - 68 68 680 Capital Works in Progress 235 431 83 671 235 235
808 Total Current Assets 1,228 1,440 17 1,696 1,276 1,292
Non Current Assets144 Property, Plant and
Equipment111 86 -23 67 50 31
324 Intangible Assets 274 191 -30 106 392 220
468 Total Non Current Assets 385 277 -28 173 442 251
1,276 TOTAL ASSETS 1,613 1,717 6 1,869 1,718 1,543
Current Liabilities172 Payables 270 251 -7 232 213 194289 Employee Benefits 437 436 .. 442 448 453
461 Total Current Liabilities 707 687 -3 674 661 647
Non Current Liabilities10 Employee Benefits 9 9 - 9 9 9
10 Total Non Current Liabilities 9 9 - 9 9 9
471 TOTAL LIABILITIES 716 696 -3 683 670 656
805 NET ASSETS 897 1,021 14 1,186 1,048 887
REPRESENTED BY FUNDS EMPLOYED
805 Accumulated Funds 897 1,021 14 1,186 1,048 887
805 TOTAL FUNDS EMPLOYED 897 1,021 14 1,186 1,048 887
201819 Budget Statements 25 Electoral Commissioner

Table 6: Electoral Commissioner: Statement of Changes in Equity
Budgetat
30/6/18 $'000
2017-18 Estimated Outcome
$'000
Budgetat
30/6/19 $'000
Var%
Estimateat
30/6/20 $'000
Estimateat
30/6/21 $'000
Estimateat
30/6/22 $'000
Opening Equity976 Opening Accumulated Funds 807 897 11 1,021 1,186 1,048
976 Balance at the Start of the Reporting Period
807 897 11 1,021 1,186 1,048
Comprehensive Income-171 Operating Result - Including
Economic Flows-145 -79 46 -75 -138 -161
-171 Total Comprehensive Income
-145 -79 46 -75 -138 -161
0 Total Movement in Reserves 0 0 - 0 0 0
Transactions Involving Owners Affecting Accumulated Funds
0 Capital Injections 235 203 -14 240 0 0
0 Total Transactions Involving Owners Affecting Accumulated Funds
235 203 -14 240 0 0
Closing Equity805 Closing Accumulated Funds 897 1,021 14 1,186 1,048 887
805 Balance at the end of the Reporting Period
897 1,021 14 1,186 1,048 887
201819 Budget Statements 26 Electoral Commissioner

Table 7: Electoral Commissioner: Cash Flow Statement
2017-18 Budget
$'000
2017-18 Estimated Outcome
$'000
2018-19 Budget
$'000
Var %
2019-20 Estimate
$'000
2020-21 Estimate
$'000
2021-22 Estimate
$'000
CASH FLOWS FROM OPERATING ACTIVITIESReceipts
2,954 Controlled Recurrent Payments
2,806 3,237 15 3,657 8,735 3,262
23 User Charges 69 23 -67 23 25 250 Interest Received 16 16 - 16 16 16
2,977 Operating Receipts 2,891 3,276 13 3,696 8,776 3,303
Payments1,319 Employee 1,190 1,354 14 1,745 2,938 1,457263 Superannuation 158 199 26 243 351 219
1,395 Supplies and Services 1,501 1,714 14 1,692 5,471 1,6112,977 Operating Payments 2,849 3,267 15 3,680 8,760 3,287
0 NET CASH INFLOW/(OUTFLOW) FROM OPERATING ACTIVITIES
42 9 -79 16 16 16
CASH FLOWS FROM INVESTING ACTIVITIESReceipts
Payments0 Purchase of Property, Plant
and Equipment235 196 -17 240 0 0
0 Investing Payments 235 196 -17 240 0 0
0 NET CASH INFLOW/(OUTFLOW) FROM INVESTING ACTIVITIES
-235 -196 17 -240 0 0
CASH FLOWS FROM FINANCING ACTIVITIESReceipts
0 Capital Injections 235 203 -14 240 0 00 Financing Receipts 235 203 -14 240 0 0
Payments
0 NET CASH INFLOW/(OUTFLOW) FROM FINANCING ACTIVITIES
235 203 -14 240 0 0
0 NET INCREASE/(DECREASE) IN CASH AND CASH EQUIVALENTS
42 16 -62 16 16 16
725 CASH AT THE BEGINNING OF REPORTING PERIOD
883 925 5 941 957 973
725 CASH AT THE END OF REPORTING PERIOD
925 941 2 957 973 989
201819 Budget Statements 27 Electoral Commissioner

Notes to the Controlled Budget StatementsSignificant variations are as follows:
Operating Statement
controlled recurrent payments:
- the increase of $0.431 million (15 percent) in the 2018-19 Budget from the 2017-18 estimated outcome is mainly due to the Commission rolling over $0.259 million of the 2017-18 appropriation into 2018-19 to support the Commission’s internal audit program and assist in early preparations for the 2020 ACT Legislative Assembly election.
Balance Sheet
There are no significant variances in the Balance Sheet requiring explanation.
Statement of Changes in Equity
Variations in the Statement are explained in the notes above.
Cash Flow Statement
Variations in the Statement are explained in the notes above.
201819 Budget Statements 28 Electoral Commissioner

This page deliberately left blank
201819 Budget Statements 29 Electoral Commissioner

OFFICE OF THE LEGISLATIVE ASSEMBLY
PurposeThe Office of the Legislative Assembly (the Office) is established by the Legislative Assembly (Office of the Legislative Assembly) Act 2012 (the Act) and provides a statutory basis for its independence from the Executive.
Under Section 6 of the Act, the Office’s function is to provide impartial advice and support to the Legislative Assembly and committees and members of the Assembly, including:
providing advice on parliamentary practice and procedure, and the functions of the Assembly and committees;
reporting proceedings of the Assembly and meetings of committees;
maintaining an official record of proceedings of the Assembly;
providing library and information facilities and services for members;
providing staff to enable the Assembly and committees to operate efficiently;
providing business support functions, including administering the entitlements of members who are not part of the Executive;
maintaining the Assembly precincts; and
providing public education about the function of the Assembly and committees.
Assistance to the Speaker
In 2018-19, the Office will also provide support to the Speaker on the establishment of the Integrity Commission. One-off funding is being provided to the Office for this purpose, with the intention of the remaining funds being transferred to the Integrity Commission, once it is established.
2018-19 PrioritiesPriorities for the Office in 2018-19 include to:
Commence the implementation of the 2018-2021 strategic plan for the Office;
Undertake a range of initiatives to continue the digital transformation of the Assembly’s business processes and to develop a digitisation plan for the Assembly’s archived records;
201819 Budget Statements 30 Office of the Legislative Assembly

Complete the double glazing of the Assembly Building’s external windows to improve thermal quality in the Assembly Building and reduce energy costs;
Explore improvements to physical security through a review of the layout of the public entrance to the Assembly building; and
Host the ceremonial celebrations In May 2019 for the 30th anniversary of the first sitting of the Assembly.
Estimated Employment Level
Table 1: Estimated Employment Level
2016-17Actual
Outcome
2017-18Budget
2017-18Estimated Outcome
2018-19Budget
Controlled Staffing (FTE) 50 55 50 521
Territorial Staffing (Actual) 47 N/A2 663 N/A2
Note(s):1. The variation between the 2017-18 Budget and the 2018-19 Budget is due to the budget for 2017-18 including several
staff who were back filling positions during periods of long term leave. Some of these staff who occupy full-time positions, have returned from leave on a part-time basis, which further reduced the full time equivalent number in the 2017-18 Budget.
2. Budgeted staffing numbers are not available as each member receives a staffing allocation. The member can decide the mix and number of staff they require to run their offices.
3. The increase from the 2016-17 Actual Outcome to the 2017-18 Estimated Outcome is the full year impact of additional staffing in Members offices following the expansion of the Assembly to 25 Members at the October 2016 election.
201819 Budget Statements 31 Office of the Legislative Assembly

Changes to Appropriation
Table 2: Changes to appropriation – Controlled Recurrent Payments
2017-18 Estimated Outcome
$'000
2018-19 Budget
$'000
2019-20 Estimate
$'000
2020-21 Estimate
$'000
2021-22 Estimate
$'000
2017-18 Budget 8,900 9,220 9,426 9,630 9,630
2018-19 Budget Policy DecisionsBetter Government - ACT Integrity Commission 0 1,048 2,388 0 0Better Government - Digital Committees 0 80 81 28 0Better Government - Planning for a digital Assembly 0 230 144 0 0
2018-19 Budget Technical AdjustmentsRevised Wage Parameters 0 66 159 256 352Remuneration Tribunal Outcome - Clerk 0 7 7 7 7Revised Indexation Parameters 0 0 0 0 159S14B Transfer - Controlled Recurrent Payment to Capital Injection (Permanent Transfer) - Artworks
-30 -30 -30 -30 -30
Revised Superannuation Guarantee Rate 0 6 11 19 20Revised Superannuation Parameters 126 121 108 90 105Transfer – Expenses on Behalf of the Territory to Controlled Recurrent Payments
220 220 220 220 220
2018-19 Budget 9,216 10,968 12,514 10,220 10,463
Table 3: Changes to appropriation – Expenses on Behalf of the Territory
2017-18 Estimated Outcome
$'000
2018-19 Budget
$'000
2019-20 Estimate
$'000
2020-21 Estimate
$'000
2021-22 Estimate
$'000
2017-18 Budget 9,923 10,120 10,287 10,419 10,419
2018-19 Budget Technical AdjustmentsRemuneration Tribunal Outcome - MLAs 0 94 95 96 97Revised Indexation Parameters 0 0 0 0 126Revised Wage Parameters 0 0 0 661 0Transfer – Expenses on Behalf of the Territory to Controlled Recurrent Payments
-220 -220 -220 -220 -220
2018-19 Budget 9,703 9,994 10,162 10,956 10,422
201819 Budget Statements 32 Office of the Legislative Assembly

Table 4: Changes to appropriation – Capital Injections, Controlled
2017-18 Estimated Outcome
$'000
2018-19 Budget
$'000
2019-20 Estimate
$'000
2020-21 Estimate
$'000
2021-22 Estimate
$'000
2017-18 Budget 5 5 5 5 5
FMA Section 16B Rollovers from 2016-17Procedural Document Production System 122 0 0 0 0Upgrade and Expansion of Audio System 44 0 0 0 0
2018-19 Budget Technical AdjustmentsRevised Wage Parameters 0 26 0 0 0S14B Transfer - Controlled Recurrent Payment to Capital Injection (Permanent Transfer) - Artworks
30 30 30 30 30
2018-19 Budget 201 61 35 35 35
Table 5: Changes to appropriation – Capital Injections, Territorial
2017-18 Estimated Outcome
$'000
2018-19 Budget
$'000
2019-20 Estimate
$'000
2020-21 Estimate
$'000
2021-22 Estimate
$'000
2017-18 Budget 144 108 278 285 285
2nd AppropriationBuilding a better city – Legislative Assembly building works 390 0 0 0 0
FMA Section 16B Rollovers from 2016-17Better Infrastructure Fund 250 0 0 0 0
2018-19 Budget Policy DecisionsBetter Government - Double glazing for the Legislative Assembly
0 850 0 0 0
2018-19 Budget Technical AdjustmentsRevised Indexation Parameters 0 0 0 0 7
2018-19 Budget 784 958 278 285 292
201819 Budget Statements 33 Office of the Legislative Assembly

Financial Statements – Controlled
Table 6: Office of the Legislative Assembly: Operating Statement
2017-18 Budget
$'000
2017-18 Estimated Outcome
$'000
2018-19 Budget
$'000
Var%
2019-20 Estimate
$'000
2020-21 Estimate
$'000
2021-22 Estimate
$'000
Income
Revenue8,900 Controlled Recurrent
Payments9,216 10,968 19 12,514 10,220 10,463
2 Interest 2 2 - 2 2 238 Distribution from
Investments with the Territory Banking Account
38 38 - 38 39 40
704 Resources Received Free of Charge
704 704 - 704 704 704
44 Other Revenue 44 44 - 44 45 46
9,688 Total Revenue 10,004 11,756 18 13,302 11,010 11,255
Expenses 5,230 Employee Expenses 5,272 6,390 21 7,444 5,918 6,049844 Superannuation Expenses 973 1,100 13 1,230 1,112 1,155
3,648 Supplies and Services 3,842 4,333 13 4,700 4,062 4,142326 Depreciation and
Amortisation326 359 10 359 359 359
7 Other Expenses 1 1 - 1 1 1
10,055 Total Expenses 10,414 12,183 17 13,734 11,452 11,706
-367 Operating Result -410 -427 -4 -432 -442 -451
46 Total Other Comprehensive Income
46 178 287 169 169 169
-321 Total Comprehensive Income
-364 -249 32 -263 -273 -282
201819 Budget Statements 34 Office of the Legislative Assembly

Table 7: Office of the Legislative Assembly: Balance Sheet
Budgetat
30/6/18 $'000
2017-18 Estimated Outcome
$'000
Budgetat
30/6/19 $'000
Var%
Estimateat
30/6/20 $'000
Estimateat
30/6/21 $'000
Estimateat
30/6/22 $'000
Current Assets232 Cash and Cash Equivalents 85 85 - 85 85 85
1,214 Investments 1,937 1,965 1 1,954 1,943 1,93278 Receivables 72 69 -4 66 63 60
473 Capital Works in Progress 0 0 - 0 0 070 Other Assets 90 87 -3 84 81 78
2,067 Total Current Assets 2,184 2,206 1 2,189 2,172 2,155
Non Current Assets2,616 Property, Plant and
Equipment3,150 3,138 .. 3,105 3,072 3,039
662 Intangible Assets 497 397 -20 297 197 970 Capital Works in Progress 280 280 - 280 280 280
3,278 Total Non Current Assets 3,927 3,815 -3 3,682 3,549 3,416
5,345 TOTAL ASSETS 6,111 6,021 -1 5,871 5,721 5,571
Current Liabilities341 Payables 478 388 -19 277 166 55
1,570 Employee Benefits 1,691 1,644 -3 1,542 1,449 1,363112 Other Liabilities 0 0 - 0 0 0
2,023 Total Current Liabilities 2,169 2,032 -6 1,819 1,615 1,418
Non Current Liabilities277 Employee Benefits 263 498 89 789 1,081 1,375
277 Total Non Current Liabilities 263 498 89 789 1,081 1,375
2,300 TOTAL LIABILITIES 2,432 2,530 4 2,608 2,696 2,793
3,045 NET ASSETS 3,679 3,491 -5 3,263 3,025 2,778
REPRESENTED BY FUNDS EMPLOYED
2,113 Accumulated Funds 2,433 2,245 -8 2,017 1,779 1,532932 Asset Revaluation Surplus 1,246 1,246 - 1,246 1,246 1,246
3,045 TOTAL FUNDS EMPLOYED 3,679 3,491 -5 3,263 3,025 2,778
201819 Budget Statements 35 Office of the Legislative Assembly

Table 8: Office of the Legislative Assembly: Statement of Changes in Equity
Budgetat
30/6/18 $'000
2017-18 Estimated Outcome
$'000
Budgetat
30/6/19 $'000
Var%
Estimateat
30/6/20 $'000
Estimateat
30/6/21 $'000
Estimateat
30/6/22 $'000
Opening Equity2,429 Opening Accumulated Funds 2,596 2,433 -6 2,245 2,017 1,779932 Opening Asset Revaluation
Reserve1,246 1,246 - 1,246 1,246 1,246
3,361 Balance at the Start of the Reporting Period
3,842 3,679 -4 3,491 3,263 3,025
Comprehensive Income46 Post Audit Adjustments 46 178 287 169 169 169
-367 Operating Result - Including Economic Flows
-410 -427 -4 -432 -442 -451
-321 Total Comprehensive Income
-364 -249 32 -263 -273 -282
Transactions Involving Owners Affecting Accumulated Funds
5 Capital Injections 201 61 -70 35 35 35
5 Total Transactions Involving Owners Affecting Accumulated Funds
201 61 -70 35 35 35
Closing Equity2,113 Closing Accumulated Funds 2,433 2,245 -8 2,017 1,779 1,532932 Closing Asset Revaluation
Reserve1,246 1,246 - 1,246 1,246 1,246
3,045 Balance at the end of the Reporting Period
3,679 3,491 -5 3,263 3,025 2,778
201819 Budget Statements 36 Office of the Legislative Assembly

Table 9: Office of the Legislative Assembly: Cash Flow Statement
2017-18 Budget
$'000
2017-18 Estimated Outcome
$'000
2018-19 Budget
$'000
Var %
2019-20 Estimate
$'000
2020-21 Estimate
$'000
2021-22 Estimate
$'000
CASH FLOWS FROM OPERATING ACTIVITIESReceipts
8,900 Controlled Recurrent Payments
9,216 10,968 19 12,514 10,220 10,463
2 Interest Received 2 2 - 2 2 238 Distribution from
Investments with the Territory Banking Account
38 38 - 38 39 40
288 Other 288 288 - 288 289 2909,228 Operating Receipts 9,544 11,296 18 12,842 10,550 10,795
Payments4,882 Employee 4,884 6,047 24 7,106 5,570 5,692786 Superannuation 912 1,036 14 1,130 1,012 1,055
3,459 Supplies and Services 3,653 4,144 13 4,511 3,873 3,953230 Other 224 224 - 224 224 224
9,357 Operating Payments 9,673 11,451 18 12,971 10,679 10,924
-129 NET CASH INFLOW/(OUTFLOW) FROM OPERATING ACTIVITIES
-129 -155 -20 -129 -129 -129
CASH FLOWS FROM INVESTING ACTIVITIESReceipts
1,844 Proceeds from Sale/Maturity of Investments
1,844 1,874 2 1,874 1,874 1,874
1,844 Investing Receipts 1,844 1,874 2 1,874 1,874 1,874
Payments75 Purchase of Property, Plant
and Equipment271 105 -61 105 105 105
1,645 Purchase of Investments 1,645 1,675 2 1,675 1,675 1,6751,720 Investing Payments 1,916 1,780 -7 1,780 1,780 1,780
124 NET CASH INFLOW/(OUTFLOW) FROM INVESTING ACTIVITIES
-72 94 231 94 94 94
201819 Budget Statements 37 Office of the Legislative Assembly

Table 9: Office of the Legislative Assembly: Cash Flow Statement (continued)
2017-18 Budget
$'000
2017-18 Estimated Outcome
$'000
2018-19 Budget
$'000
Var %
2019-20 Estimate
$'000
2020-21 Estimate
$'000
2021-22 Estimate
$'000
CASH FLOWS FROM FINANCING ACTIVITIESReceipts
5 Capital Injections 201 61 -70 35 35 355 Financing Receipts 201 61 -70 35 35 35
5 NET CASH INFLOW/(OUTFLOW) FROM FINANCING ACTIVITIES
201 61 -70 35 35 35
232 CASH AT THE BEGINNING OF REPORTING PERIOD
85 85 - 85 85 85
232 CASH AT THE END OF REPORTING PERIOD
85 85 - 85 85 85
201819 Budget Statements 38 Office of the Legislative Assembly

Notes to the Controlled Budget StatementsSignificant variations are as follows:
Operating Statement
controlled recurrent payments:
- the increase of $1.752 million in the 2018-19 Budget from the 2017-18 estimated outcome is largely for additional resources to undertake digitisation initiatives within the Assembly and funding for the establishment of the ACT Integrity Commission.
employee expenses:
- the increase of $1.118 million in the 2018-19 Budget from the 2017-18 estimated outcome is largely for additional resources to undertake digitisation initiatives within the Assembly and funding for the establishment of the ACT Integrity Commission.
supplies and services:
- the increase of $0.491 million in the 2018-19 Budget from the 2017-18 estimated outcome is largely due to the funding for establishment of the ACT Integrity Commission.
Cash Flow Statement
Variations in the Statement are explained in the notes above.
201819 Budget Statements 39 Office of the Legislative Assembly

Financial Statements – Territorial
Table 10: Office of the Legislative Assembly: Statement of Income and Expenses on behalf of the Territory
2017-18 Budget
$'000
2017-18 Estimated Outcome
$'000
2018-19 Budget
$'000
Var%
2019-20 Estimate
$'000
2020-21 Estimate
$'000
2021-22 Estimate
$'000
Revenue9,923 Payment for Expenses on
Behalf of the Territory9,703 9,994 3 10,162 10,956 10,422
441 Resources Received Free of Charge
441 441 - 441 441 441
10,364 Total Revenue 10,144 10,435 3 10,603 11,397 10,863
Expenses 9,170 Employee Expenses 8,955 9,216 3 9,373 10,148 9,606979 Superannuation Expenses 979 1,004 3 1,015 1,024 1,033460 Supplies and Services 460 460 - 460 472 473
1,084 Depreciation and Amortisation
1,084 1,180 9 1,214 1,214 1,214
11,693 Total Expenses 11,478 11,860 3 12,062 12,858 12,326
-1,329 Operating Result -1,334 -1,425 -7 -1,459 -1,461 -1,463
201819 Budget Statements 40 Office of the Legislative Assembly

Table 11: Office of the Legislative Assembly: Statement of Assets and Liabilities on behalf of the Territory
Budgetat
30/6/18 $'000
2017-18 Estimated Outcome
$'000
Budgetat
30/6/19 $'000
Var%
Estimateat
30/6/20 $'000
Estimateat
30/6/21 $'000
Estimateat
30/6/22 $'000
Current Assets436 Cash and Cash Equivalents 137 163 19 189 215 24141 Receivables 6 7 17 8 9 10
477 Total Current Assets 143 170 19 197 224 251
Non Current Assets32,670 Property, Plant and
Equipment28,040 27,728 -1 26,702 25,683 24,671
32,670 Total Non Current Assets 28,040 27,728 -1 26,702 25,683 24,671
33,147 TOTAL ASSETS 28,183 27,898 -1 26,899 25,907 24,922
Current Liabilities39 Payables 84 84 - 84 84 84
815 Employee Benefits 523 704 35 885 1,068 1,253
854 Total Current Liabilities 607 788 30 969 1,152 1,337
Non Current Liabilities9 Employee Benefits 1 2 100 3 4 5
9 Total Non Current Liabilities 1 2 100 3 4 5
863 TOTAL LIABILITIES 608 790 30 972 1,156 1,342
32,284 NET ASSETS 27,575 27,108 -2 25,927 24,751 23,580
REPRESENTED BY FUNDS EMPLOYED
14,076 Accumulated Funds 14,657 14,190 -3 13,009 11,833 10,66218,208 Asset Revaluation Surplus 12,918 12,918 - 12,918 12,918 12,918
32,284 TOTAL FUNDS EMPLOYED 27,575 27,108 -2 25,927 24,751 23,580
201819 Budget Statements 41 Office of the Legislative Assembly

Table 12: Office of the Legislative Assembly: Statement of Changes in Equity on behalf of the Territory
Budgetat
30/6/18 $'000
2017-18 Estimated Outcome
$'000
Budgetat
30/6/19 $'000
Var%
Estimateat
30/6/20 $'000
Estimateat
30/6/21 $'000
Estimateat
30/6/22 $'000
Opening Equity15,261 Opening Accumulated Funds 15,207 14,657 -4 14,190 13,009 11,83318,208 Opening Asset Revaluation
Reserve12,918 12,918 - 12,918 12,918 12,918
33,469 Balance at the Start of the Reporting Period
28,125 27,575 -2 27,108 25,927 24,751
Comprehensive Income-1,329 Operating Result - Including
Economic Flows-1,334 -1,425 -7 -1,459 -1,461 -1,463
-1,329 Total Comprehensive Income
-1,334 -1,425 -7 -1,459 -1,461 -1,463
Transactions Involving Owners Affecting Accumulated Funds
144 Capital Injections 784 958 22 278 285 292
144 Total Transactions Involving Owners Affecting Accumulated Funds
784 958 22 278 285 292
Closing Equity14,076 Closing Accumulated Funds 14,657 14,190 -3 13,009 11,833 10,66218,208 Closing Asset Revaluation
Reserve12,918 12,918 - 12,918 12,918 12,918
32,284 Balance at the end of the Reporting Period
27,575 27,108 -2 25,927 24,751 23,580
201819 Budget Statements 42 Office of the Legislative Assembly

Table 13: Office of the Legislative Assembly: Cash Flow Statement on behalf of the Territory
2017-18 2017-18 2018-19 Var 2019-20 2020-21 2021-22Budget Estimated
OutcomeBudget % Estimate Estimate Estimate
$'000 $'000 $'000 $'000 $'000 $'000
CASH FLOWS FROM OPERATING ACTIVITIESReceipts
9,923 Payment for Expenses on Behalf of the Territory
9,703 9,994 3 10,162 10,956 10,422
30 Other 30 30 - 30 30 309,953 Operating Receipts 9,733 10,024 3 10,192 10,986 10,452
Payments9,229 Employee 9,009 9,354 4 9,522 10,295 9,751588 Superannuation 588 604 3 604 613 62235 Supplies and Services 35 35 - 35 47 485 Other 5 5 - 5 5 5
9,857 Operating Payments 9,637 9,998 4 10,166 10,960 10,426
96 NET CASH INFLOW/(OUTFLOW) FROM OPERATING ACTIVITIES
96 26 -73 26 26 26
CASH FLOWS FROM INVESTING ACTIVITIES
Payments144 Purchase of Property, Plant
and Equipment784 958 22 278 285 292
144 Investing Payments 784 958 22 278 285 292
-144 NET CASH INFLOW/(OUTFLOW) FROM INVESTING ACTIVITIES
-784 -958 -22 -278 -285 -292
CASH FLOWS FROM FINANCING ACTIVITIESReceipts
144 Capital Injections 784 958 22 278 285 292144 Financing Receipts 784 958 22 278 285 292
144 NET CASH INFLOW/(OUTFLOW) FROM FINANCING ACTIVITIES
784 958 22 278 285 292
96 NET INCREASE/(DECREASE) IN CASH AND CASH EQUIVALENTS
96 26 -73 26 26 26
340 CASH AT THE BEGINNING OF REPORTING PERIOD
41 137 234 163 189 215
436 CASH AT THE END OF REPORTING PERIOD
137 163 19 189 215 241
201819 Budget Statements 43 Office of the Legislative Assembly

Notes to the Territorial Budget StatementsThere were no significant variations requiring explanation.
201819 Budget Statements 44 Office of the Legislative Assembly


