ACROSS THE STATES - aarp.org · so these state data can be at your fingertips. The AARP Public...
84
ACROSS THE STATES PROFILES OF LONG-TERM SERVICES AND SUPPORTS by Ari Houser Wendy Fox-Grage Kathleen Ujvari PUBLISHED FOR 24 YEARS AARP PUBLIC POLICY INSTITUTE 2018
Transcript of ACROSS THE STATES - aarp.org · so these state data can be at your fingertips. The AARP Public...

ACROSS THE STATES PROFILES OF LONG-TERM SERVICES
AND SUPPORTS
by Ari Houser Wendy Fox-Grage Kathleen Ujvari
PUBLISHED FOR 24 YEARS AARP PUBLIC POLICY INSTITUTE2018

This page intentionally left blank.

2018 Across the States 2018 Across the States iii
AARP Public Policy Institute August 2018
CONTENTS
PURPOSE ............................................................................................................................................. 1
OVERVIEW .......................................................................................................................................... 2
FINDINGS ............................................................................................................................................ 3
“Oldest Old” (Ages 85+) Population Will Triple ........................................................................................................3
Older Population Is Growing More Diverse ...............................................................................................................4
Living Arrangements, Income, and Disability Impact LTSS .................................................................................6
LTSS Cost More than Most Can Afford .......................................................................................................................7
Medicaid Spending Is Becoming More Balanced toward More Home- and Community-Based Services, but with Great Variation among States and Populations .....................................................................9
Family Caregivers Provide the Most LTSS, but Future “Oldest Old” Generations Will Face a Shrinking Availability .................................................................................................................................................... 11
Home- and Community-Based Services Are Not Keeping Pace .........................................................................12
Meals ...................................................................................................................................................................... 12Home Care Workers .......................................................................................................................................... 12Assisted Living and Residential Care ......................................................................................................... 12
Nursing Facility Residents Decreased, while Quality Varies ..............................................................................13
STATE DATA, GRAPHICS, MAPS, AND TOOLS ............................................................................... 14
DATA DOCUMENTATION .................................................................................................................. 15
STATE AND DATA RANKINGS .........................................................................................................A-1

This page intentionally left blank.

2018ACROSS THE STATES
PROFILES OF LONG-TERM SERVICES AND SUPPORTS
PURPOSE
Across the States provides comparable state data, rankings, and national averages on
• Age demographics and projections;• Living arrangements, income, and poverty;• Disability rates;• Costs of care;• Private long-term care insurance;• Medicaid long-term services and supports
(LTSS);• Family caregivers;• Home- and community-based services
(HCBS); and• Nursing facilities.
The purpose of Across the States is to provide these data across all states because the United States does not have a national LTSS system. Given the aging of the population, rising demand for LTSS, and high cost of services, these data are essential to improving the lives of those who need LTSS and their family caregivers.
About Across the States 2018
This reference book is a powerful compilation of state data and analysis on LTSS in each state. This resource combines data from a large number of studies and data sources—including some original analysis not found elsewhere—into a single volume, so these state data can be at your fingertips.
The AARP Public Policy Institute has been publishing Across the States for 24 years to help policy makers, administrators, and stakeholders make informed decisions about LTSS public policies and programs. Each state profile is a four-page, user-friendly, print-ready document that provides your state’s data and rankings and can be found at http://www.aarp.org/acrossthestates.

2018 Across the States 2018 Across the States 2
AARP Public Policy Institute August 2018
OVERVIEW
Across the States reveals four key trends:
(1) The ages 85+ population—the cohortwith the highest need for LTSS—isprojected to triple (a 208 percentincrease) between 2015 and 2050. Incomparison, the population younger thanage 65 will increase by only 12 percent.The under age 65 population, currently85 percent of the total population, isprojected to be 78 percent in 2050.
(2) This demographic shift will have aprofound impact on family caregiving.The caregiver support ratio comparesthe number of people ages 45–64 (peakcaregiver age) to the number ages 80+(peak care need). Currently, there are about7 people ages 45–64 for every person age80+. By 2050, that ratio will drop to 3 to 1.
(3) The older population is becomingmore diverse. In particular, the Hispanicpopulation ages 65+ is projected toquadruple between 2015 and 2050.
(4) State Medicaid LTSS systems arebecoming more balanced—that is,the percentage of spending goingto HCBS is increasing—both overalland for older people and adults withdisabilities specifically. However,states vary considerably in both levelof balance and trend. The percentage ofLTSS spending for older people and adultswith disabilities going to HCBS ranged from13 percent to 73 percent in 2016. While40 states became more balanced, 11 statesbecame less balanced for older adults andpeople with physical disabilities in 2016compared with 2011.

2018 Across the States 2018 Across the States 3
AARP Public Policy Institute August 2018
FINDINGS
“Oldest Old” (Ages 85+) Population Will Triple
Between 2015 and 2050, the ages 85+ population is projected to more than triple, which has significant implications because this age group is the most likely to need LTSS to help with everyday tasks. Members of this age group are most likely to need help with activities of daily living such as bathing, dressing, eating, transferring, and toileting. Nearly one-third of this population has dementia. Members of this age group not only have higher rates of disability than younger people, but they are also more likely to live alone, without a spouse or other family member to provide them with assistance.
In stark contrast to the older population, the population under age 65 is projected to grow by only 12 percent from 2015 to 2050. Meanwhile, the population ages 85+ is projected to increase by 208 percent, ages 75–84 by 113 percent, and ages 65–74 by 42 percent.
The growth of the 85+ age group is projected to significantly outpace all other age groups once baby boomers begin turning age 85 in 2031. The aging of the baby boomers will cause rapid growth in the ages 85+ population over the following two decades. In 2015, people ages 85 and older made up 2 percent of the US population. By 2050, they are projected to represent 5 percent.
The oldest age group is projected to dramatically increase between 2015 and 2050, while the younger population (under age 65) is projected to increase only slightly.
Projected Population Growth by Age Group, 2015–2050
Go to http://www.aarp.org/acrossthestates for each state’s demographics projections and graphs.

2018 Across the States 2018 Across the States 4
AARP Public Policy Institute August 2018
Older Population Is Growing More Diverse
The older population is projected to become more racially and ethnically diverse. In 2015, roughly 8 out of 10 people ages 65+ (78 percent) in the United States were non-Hispanic White. In contrast, today’s younger population cohorts are much more diverse. As these younger cohorts age, the older population will likely become more diverse. Out of a projected total ages 65+ population of 88 million in 2050, about 54 million are projected to be non-Hispanic White and 34 million Hispanic or non-White.
The total ages 65+ population (for all races) is projected to almost double from 48 million in 2015 to 88 million in 2050. The dramatic increase is largely due to the growth in minority racial and ethnic groups, all of
which are growing faster than the White older population. About 15 percent of people ages 65+ lived in a home where a language other than English was spoken in 2015.
Racial and ethnic minorities are projected to increase from 22 percent of the ages 65+ population in 2015 to 39 percent in 2050.
Diversity of the Ages 65+ Population, United States, 2015
Projected Diversity of the Ages 65+ Population, United States, 2050
From 2015 to 2050, the non-White older populations—Hispanic, Black, and other non-Hispanic (including Asian, Pacific Islander, Native American, and multiple races)—are projected to increase much more rapidly than the White older population.
Projected Population Growth of the Ages 65+ Population by Race, 2015–2050
Blank 2015 2050 Percentage Increase
White 37.1 mil 54.0 mil +46%
Hispanic 3.8 mil 16.0 mil +323%
Black 4.2 mil 9.7 mil +130%
Other Non-Hispanic*
* Includes Asian, Pacific Islander, Native American, and people of multiple races.
** Totals may not add up precisely due to rounding.
2.6 mil 8.4 mil +216%
Total** 47.8 mil 88.0 mil +84%

2018 Across the States 2018 Across the States 5
AARP Public Policy Institute August 2018
This growing diversity of the older population will impact how LTSS are provided in terms of meeting diverse personal and family caregiver preferences, arranging for language translation
services, providing services with cultural sensitivity, and training health care providers in cultural competence.
The older Hispanic population is projected to more than quadruple from 2015 to 2050.
Hispanics as a Percentage of the Ages 65+ Population, 2015
Hispanics as a Percentage of the Ages 65+ Population, 2050 (Projected)
2018 Across the States 2018 Across the States 6
AARP Public Policy Institute August 2018
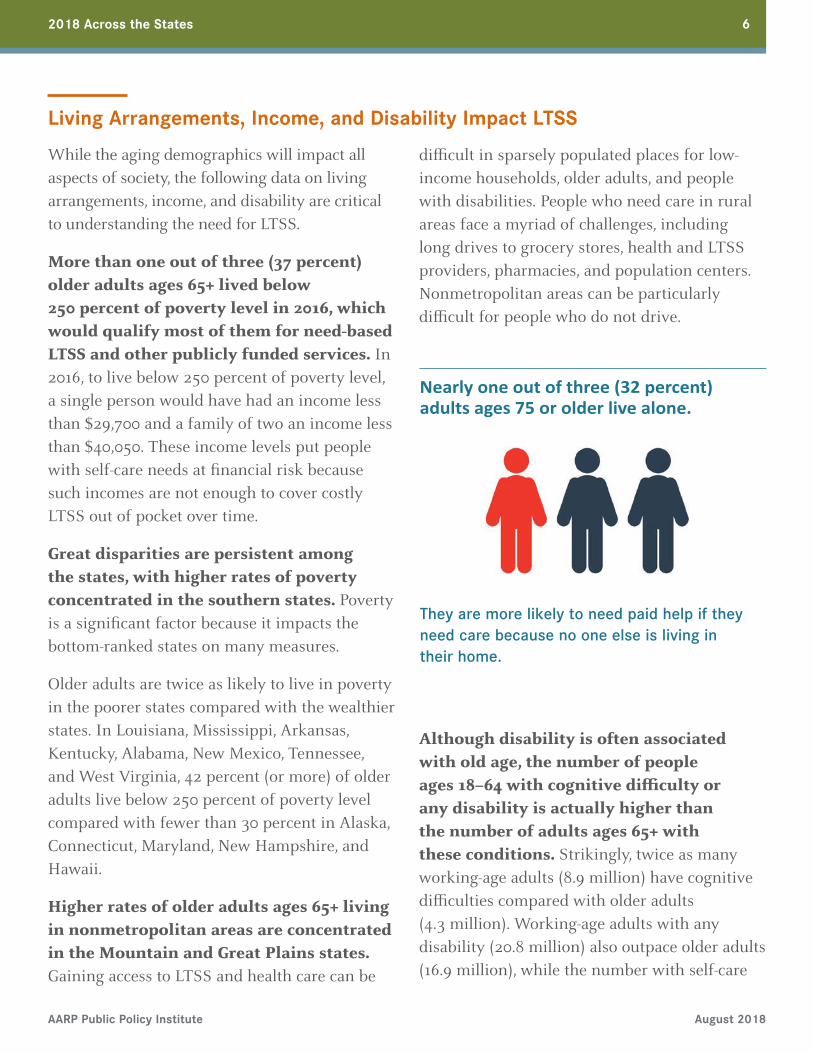
Living Arrangements, Income, and Disability Impact LTSS
While the aging demographics will impact all aspects of society, the following data on living arrangements, income, and disability are critical to understanding the need for LTSS.
More than one out of three (37 percent) older adults ages 65+ lived below 250 percent of poverty level in 2016, which would qualify most of them for need-based LTSS and other publicly funded services. In 2016, to live below 250 percent of poverty level, a single person would have had an income less than $29,700 and a family of two an income less than $40,050. These income levels put people with self-care needs at financial risk because such incomes are not enough to cover costly LTSS out of pocket over time.
Great disparities are persistent among the states, with higher rates of poverty concentrated in the southern states. Poverty is a significant factor because it impacts the bottom-ranked states on many measures.
Older adults are twice as likely to live in poverty in the poorer states compared with the wealthier states. In Louisiana, Mississippi, Arkansas, Kentucky, Alabama, New Mexico, Tennessee, and West Virginia, 42 percent (or more) of older adults live below 250 percent of poverty level compared with fewer than 30 percent in Alaska, Connecticut, Maryland, New Hampshire, and Hawaii.
Higher rates of older adults ages 65+ living in nonmetropolitan areas are concentrated in the Mountain and Great Plains states. Gaining access to LTSS and health care can be
difficult in sparsely populated places for low-income households, older adults, and people with disabilities. People who need care in rural areas face a myriad of challenges, including long drives to grocery stores, health and LTSS providers, pharmacies, and population centers. Nonmetropolitan areas can be particularly difficult for people who do not drive.
Nearly one out of three (32 percent) adults ages 75 or older live alone.
They are more likely to need paid help if they need care because no one else is living in their home.
Although disability is often associated with old age, the number of people ages 18–64 with cognitive difficulty or any disability is actually higher than the number of adults ages 65+ with these conditions. Strikingly, twice as many working-age adults (8.9 million) have cognitive difficulties compared with older adults (4.3 million). Working-age adults with any disability (20.8 million) also outpace older adults (16.9 million), while the number with self-care

2018 Across the States 2018 Across the States 7
AARP Public Policy Institute August 2018
difficulties (3.7 million) is comparable to that of older adults (3.9 million). Self-care and cognitive difficulties are the most likely to result in a need for LTSS.
Again, there is great variation among the states in terms of the percentage of older people with these difficulties. Older adults in Mississippi
have the highest percentages of self-care needs (11 percent) and cognitive difficulties (12 percent), approximately double the rate of the states with the lowest percentages. In Colorado, 5 percent of older adults have self-care needs, and in South Dakota, 6 percent of older adults have cognitive difficulties.
Although higher numbers of younger people have disabilities, the percentage of people with disabilities is higher among the older population.
Number and Percentage of Adults with a Disability by Age Group and Type of Disability, 2016
blankAdults Ages 18–64
with DisabilityPercent of Population
Ages 18–64Adults Ages 65+ with Disability
Percent of Population Ages 65+
Self-Care Difficulty 3.7 mil 1.9% 3.9 mil 8.1%
Cognitive Difficulty 8.9 mil 4.5% 4.3 mil 8.9%
Any Disability 20.8 mil 10.6% 16.9 mil 35.0%
LTSS Cost More than Most Can Afford
In 2017, the median annual cost of a nursing facility was $97,455 for a private room and $87,600 for a shared room. The base price for assisted living was $45,000. The median cost for a home health aide to provide care at home was $22 per hour for 30 hours a week, for an annual price of $33,540. Adult day services cost $70 per day; for an individual utilizing adult day services 5 days a week, the annual cost was $18,200.
The cost of LTSS is not within reach of most families across all the states. The
annual median cost for nursing facilities is more than double the median income of older households, $42,113. This high cost of care can all too often cause people to exhaust their savings and rely on Medicaid, the largest public payer for LTSS.
Although the cost of care varies greatly across the states, LTSS—especially nursing facility care—is unaffordable for most middle-income families. For the cost of one year of nursing facility care, a person could pay for three years of home care or five years of adult day services.

2018 Across the States 2018 Across the States 8
AARP Public Policy Institute August 2018
The price tag for LTSS can be expensive.
Annualized Private Pay Cost, United States, 2017
Despite the need for long-term care insurance to cover these costs, the vast majority (95 percent) of adults ages 40+ do not have this type of insurance. In 2015, there were only 50 individual and group long-term care insurance policies per 1,000 adults ages 40 and older. The District of Columbia had the highest percentage of ages 40+ adults covered, primarily because of a
large government workforce with access to this voluntary benefit. The long-term care insurance market has been plagued with a decline in the number of policies, rising premiums, insurers leaving this business, and consumer confusion about the need for and lack of coverage of LTSS. Because of the low take-up rates, the overwhelming majority of private pay LTSS is paid out of pocket rather than by insurance.

2018 Across the States 2018 Across the States 9
AARP Public Policy Institute August 2018
Medicaid Spending Is Becoming More Balanced toward More Home- and Community-Based Services, but with Great Variation among States and Populations
When personal funds to pay for care run out, Medicaid—a federal- and state-funded program—can cover the costs for eligible people with long-term disabilities. It is estimated that nearly one out of five older Americans will need Medicaid to help pay for LTSS at some time during their lives.
More than 5 million Medicaid beneficiaries of all ages received LTSS in 2013, and roughly 7 out of 10 of them received services in their homes and communities. The vast majority of Americans of all ages and abilities prefer to live in their homes and communities as long as possible. However, the experience of older Medicaid beneficiaries is quite different, as the distribution of Medicaid spending tilts toward institutional services, which is out of balance with beneficiaries’ overwhelming desire to receive services in their homes and communities. Of the roughly 2 million Medicaid beneficiaries ages 65+ who received LTSS in 2013, about one-half of them obtained services at home or in the community while the other half lived in nursing facilities.
Most states (40) became more balanced—that is, the percentage of Medicaid LTSS spending going toward HCBS increased—for older people and adults with physical disabilities from 2011 to 2016. During this time, Medicaid spending for HCBS
for these populations increased by 39 percent while spending on nursing facilities increased by 6 percent. As a result, the percentage of Medicaid LTSS spending for older people and adults with physical disabilities going to HCBS increased 6.6 percentage points during this five-year period. Delaware had the greatest increase (18 percentage points) while Kentucky had the largest decrease (6 percentage points).
Despite recent progress, Medicaid balance—the percentage of LTSS spending going to home- and community-based services—still lags behind for older adults and people with physical disabilities.
Percentage of Medicaid LTSS Spending Going to Home- and Community-Based Services and Institutional Care, 2016
Less than half of Medicaid spending on LTSS for older people and adults with physical disabilities (45 percent) went to HCBS while the majority (55 percent) went to nursing facilities in 2016. However, there was wide state variation. The percentage of LTSS spending for older people and adults with disabilities going to HCBS ranged from 13 percent in the least

2018 Across the States 2018 Across the States 10
AARP Public Policy Institute August 2018
balanced state of Kentucky to 73 percent in the most balanced state of New Mexico.
Only 11 states spent one-half or more of Medicaid LTSS funds on home- and community-based services for older people and adults with physical disabilities in 2016.
Percentage of Medicaid LTSS Spending for Older People and Adults with Physical Disabilities Going toward HCBS, 2011 and 2016
Medicaid LTSS spending for all populations—including beneficiaries with intellectual or developmental disabilities, and mental health and substance use disorders—was more balanced, with 57 percent going toward HCBS and the remaining 43 percent going toward institutional care. State variation for all populations was considerable, ranging from 27 percent of spending going to HCBS in Mississippi to 81 percent in Oregon.
The majority of Medicaid LTSS spending (62 percent) went toward older people and adults with physical disabilities in 2016,
primarily because of high nursing facility spending. More than three-fourths (78 percent) of Medicaid institutional spending went to nursing facilities, which overwhelmingly serve older adults.
Another source of funding for HCBS is non-Medicaid state funding, which can come from states’ general revenue, lottery funds, and tax levies. Although in most states the amount of such funding is small compared with Medicaid, states have flexibility with this source of funds to reach the near poor to prevent impoverishment and to divert people from entering more expensive nursing facility care.

2018 Across the States 2018 Across the States 11
AARP Public Policy Institute August 2018
Family Caregivers Provide the Most LTSS, but Future “Oldest Old” Generations Will Face a Shrinking Availability
Although Medicaid is the largest public payer for LTSS, unpaid family caregivers are the largest source of this care. In 2013, about 40 million family caregivers provided 37 billion hours of care at an average value of $12.51 per hour. This estimated economic value of family caregivers’ unpaid care exceeded Medicaid spending on this care in every state.
In 2015, there were 7 people ages 45–64 (the peak caregiver age group) for each person age 80 and older (the peak care need age group). While not all people ages 80+ have access to 7 potential caregivers ages 45–64, this is a useful metric for the overall availability of caregivers to provide family care to older people. In 2030, it is estimated that the “family caregiver support ratio” will drop to 4 to 1. It is estimated to then fall to about 3 to 1 in 2050, when all baby boomers will be ages 85 or older.
Family caregivers provided $470 billion worth of unpaid care in 2013, more than six times the Medicaid spending on home- and community-based services.
The supply of family caregivers is not expected to keep up with the large numbers of older adults needing care.
Family Caregiver Support Ratio, 2015 and 2050

2018 Across the States 2018 Across the States 12
AARP Public Policy Institute August 2018
Home- and Community-Based Services Are Not Keeping Pace
Meals
Since 2011, Older Americans Act funding for meals and other services has been relatively flat and has not kept up with the cost of food, gas, and staff as well as need. Home-
delivered meals (sometimes referred to as “meals
on wheels”) and congregate meals (such as those
served in senior centers and adult day centers)
are fundamental to ensuring basic nutrition for
low-income older adults, many of whom are
homebound. The Older Americans Act provided
funding for roughly 1.5 million older adults to
receive congregate meals and about 900,000
to receive meals in their homes in 2016. States
have the flexibility to transfer funds among
Older Americans Act supportive services and
congregate and home-delivered meals. States
are required to match 15 percent of funding for
meals, but many states “overmatch” with public
and private funds.
Home Care Workers
Across all states, home care aides live disproportionately in poverty, and those who live and work in the poorer southern states have the lowest wages. In 2015, nearly
2 million home health and personal care aides provided care, at just slightly more than $11 per hour on average. These workers made roughly $22,000 each in 2015 if they worked full time, which is just above the poverty line for a family of three (about $20,000), making them eligible for Medicaid. However, many of them do not work full time and therefore fall under the poverty line. This low pay coupled with a lack of benefits, inconsistent hours, and difficult work has led to workforce shortages. This shortage can add to the pressures of family caregivers.
Assisted Living and Residential Care
Assisted living and residential care communities are needed options for when living at home is no longer viable. However, the number of these units ranges greatly around the country, from a high of 121 units per 1,000 people ages 75+ in Oregon to a low of 20 units in Louisiana. These options are available mostly to people who can pay privately for them. Medicaid cannot cover room and board charges, only services. However, many state Medicaid programs do not cover these optional services in assisted living and residential care settings.

2018 Across the States 2018 Across the States 13
AARP Public Policy Institute August 2018
Nursing Facility Residents Decreased, while Quality Varies
The large majority (46) of states had decreases in nursing facility residents from 2011 to 2016. About 1.3 million Americans lived in nursing facilities on a typical day in 2016, occupying 81 percent of a total of 1.7 million beds. The number of nursing facility residents declined 4 percent from 2011 to 2016. States with the most significant reductions were Wisconsin (–15 percent), Tennessee (–14 percent), Georgia (–13 percent), Minnesota (–12 percent), and Connecticut (–10 percent).
Roughly 6 out of 10 (62 percent) nursing facility residents rely on Medicaid because many of them have spent their life savings
paying for care. A quarter of residents (25 percent) pay for nursing facility care out of their own pockets or through private long-term care insurance. Only 14 percent of current residents have Medicare as their primary payer, which covers only post-acute care for a limited duration after a hospitalization.
Despite the aging of society, nursing facilities, beds, residents, and occupancy rates have all dropped slightly.
Percentage Change in Ages 75+ Population, Nursing Facilities, Beds, Residents, and Occupancy Rate, 2011–2016
Although nursing facility care is for people who need care 24/7, about one out of every eight residents (12 percent) had low care needs in 2014. These residents can generally manage their daily needs in less-restrictive settings after a short-term stay. Maine had the smallest percentage of its nursing facility

2018 Across the States 2018 Across the States 14
AARP Public Policy Institute August 2018
population with low care needs (4 percent), while Missouri had the largest percentage (24 percent).
Nursing facility residents received about 4 hours of nursing care per day in 2016. The bulk of this time (2.42 hours per day) was from certified nursing assistants, 0.79 hour was from registered nurses, and 0.82 hour was
from licensed practical nurses. At the state level, measures of nursing facility quality correlated with registered nurse hours per resident day (correlation coefficient R = 0.40 to 0.61) but were only slightly correlated with total direct care hours per resident day (R = 0.19 to 0.32). Higher staffing levels were associated with better quality outcomes.
Nursing facility quality varies considerably across the states.
• The percentage of long-stay residents with a hospital admission in 2014 ranged from 5 percent(Hawaii) to 28 percent (Mississippi).
• The percentage of long-stay residents without a psychiatric diagnosis receiving an antipsychotic medication in 2017 ranged from 7 percent (Hawaii) to 20 percent (Oklahoma).
• The percentage of high-risk residents with pressure sores in 2017 ranged from 3 percent(Hawaii) to 10 percent (District of Columbia).
STATE DATA, GRAPHICS, MAPS, AND TOOLS
To access your four-page state data profile as well as easy-to-use graphics, maps, and
additional tools, go to http://www.aarp.org/acrossthestates.

2018 Across the States 2018 Across the States 15
AARP Public Policy Institute August 2018
Data Documentation

2018 Across the States 2018 Across the States 16
AARP Public Policy Institute August 2018
This page intentionally left blank.

2018 Across the States 2018 Across the States 17
AARP Public Policy Institute August 2018
This section presents detailed indicator definitions, lists exceptions and adjustments, and provides links to the source data, where possible. Care should be taken when making comparisons with indicators from earlier editions of Across the States or other publications, as data sources, definitions, and methodology may differ.
Population and Projections
Line graph, current (2015) and projected
population growth by age group, percentage of
population by age group, percent change from
2015, and diversity of the ages 65+ population.
Source: AARP Public Policy Institute based on
Regional Economic Models Inc., eREMI 4.1.0
(build 4681) standard regional control. The last
historical data year is 2015; 2016 and later data
are based on projections with a last history year
of 2015. Four race categories are included in the
REMI model: White, Black, Other, and Hispanic.
These categories correspond to the Census Bureau race/ethnicity classification as follows:
• The White category in the REMI model includes non-Hispanic people who are White alone,
• The Black category includes non-Hispanic people who are Black alone,
• The Other category includes non-Hispanic people of all other races and combinations of races, and
• The Hispanic category includes all people who are of Hispanic origin, regardless of their race.
Population Characteristics
Living Arrangements, Income, and Poverty, 2016
People ages 75+ living alone. Source: AARP Public Policy Institute calculations using data from US Census Bureau, American Community Survey 2016, Table B25116, “Tenure by Household Size by Age of Householder,” generated using American FactFinder (https://factfinder.census.gov), accessed April 2018.
Percentage of population living in nonmetropolitan areas. Source: AARP Public Policy Institute calculations using population data from US Census Bureau Population Estimates, Annual Estimates of the Resident Population for
Selected Age Groups by Sex for the United States, States, Counties, and Puerto Rico Commonwealth and Municipios: April 1, 2010, to July 1, 2016 (available on American FactFinder: https://factfinder.census.gov) and August 2017 core-based statistical areas, metropolitan divisions, and combined statistical areas delineation file (available at https://www.census.gov/geographies/reference-files/time-series/demo/metro-micro/delineation-files.html), both accessed May 2018.
Metropolitan statistical areas are Office of Management and Budget (OMB)-defined contiguous clusters of counties with relatively high population density. Each metropolitan statistical area must have at least one urbanized

2018 Across the States 2018 Across the States 18
AARP Public Policy Institute August 2018
area of 50,000 or more inhabitants, and consist of “central counties” in which at least 50 percent of the population resides within urban areas of 10,000 or more population, or that contain at least 5,000 people residing within a single urban area of 10,000 or more population, and “outlying counties” that meet specified requirements of commuting to or from the central counties. More information may be found at https://www.census.gov/ programs-surveys/metro-micro/about.html.
This indicator measures the percentage of the population ages 65+ in each state living in counties that are not part of a defined metropolitan area. This includes residents living in micropolitan statistical areas, which are similar to metropolitan areas except that they are defined around an urbanized area of 10,000 or more but less than 50,000 inhabitants. As of August 2017, the United States has 383 metropolitan statistical areas and 550 micropolitan statistical areas.
Median household income ages 65+.Source: AARP Public Policy Institute calculations using data from US Census Bureau, American Community Survey 2016, Table B19049, “Median Household Income in the Past 12 Months (in 2016 Inflation-Adjusted Dollars) by Age of Householder,” generated using American FactFinder (https://factfinder.census.gov), accessed April 2018. All income variables are computed for the preceding 12 months (the survey is conducted throughout the year, so this reference period could be January 2015 to December 2015, December 2015 to November 2016, or any time in between) and are reported in 2016 inflation-adjusted dollars.
Below poverty level ages 65+.Source: AARP Public Policy Institute calculations using data from US Census Bureau, American Community Survey 2016, Table B17001, “Poverty Status in the Past 12 Months by Sex by Age,” generated using American FactFinder, (https://factfinder.census.gov), accessed April 2018. The Census poverty thresholds are similar to but not exactly the same as the US Department of Health and Human Services guidelines that are used for eligibility for many social services. For people ages 65+ living alone or with another adult, the thresholds are usually somewhat lower than the guidelines. For example, the poverty threshold for a single adult age 65+ interviewed in 2016 was $11,511. The 2016 poverty guideline for a single adult was $11,880.
Below 250 percent poverty level ages 65+.Source: AARP Public Policy Institute analysis of US Census Bureau, American Community Survey 2016, public use microdata, accessed April 2018.
Disability Rates, 2016
People ages 18–64 and ages 65+ with self-care difficulty.Source: AARP Public Policy Institute calculations using data from US Census Bureau, 2016 American Community Survey 1-Year Estimates, Table C18106, “Sex by Age by Self-Care Difficulty for the Civilian Noninstitutionalized Population 5 Years and Over,” generated using American FactFinder (https://factfinder.census.gov), accessed April 2018. Question asks respondents if they had “difficulty dressing or bathing.” Difficulty with these activities are two of six specific activities of daily living (ADLs) often used by health care providers to assess patients’ self-care needs.

2018 Across the States 2018 Across the States 19
AARP Public Policy Institute August 2018
People ages 18–64 and ages 65+ with cognitive difficulty. Source: AARP Public Policy Institute calculations using data from US Census Bureau, 2016 American Community Survey 1-Year Estimates, Table C18104, “Sex by Age by Cognitive Difficulty for the Civilian Noninstitutionalized Population 5 Years and Over,” generated using American FactFinder (https://factfinder.census.gov), accessed April 2018. Question asks respondents if, because of a physical, mental, or emotional condition, they had “serious difficulty concentrating, remembering, or making decisions.”
People ages 18–64 and ages 65+ with any disability.Source: AARP Public Policy Institute calculations using data from US Census Bureau, 2016 American Community Survey 1-Year Estimates, Table C18101, “Sex by Age by Disability Status for the Civilian Noninstitutionalized Population 5 Years and Over,” generated using American FactFinder (https://factfinder.census.gov), accessed April 2018. Includes persons with one or more of six types of disability—hearing, vision, cognitive, ambulatory, self-care, and independent living.
Private Pay Costs
Annualized Private Pay Costs by Long-Term Services and Supports (LTSS) Type, 2017
Cost of care for a private room and semi-private room in a nursing facility; assisted living; adult day services; and in-home care (30 hours per week). Source: AARP Public Policy Institute calculations using data from Genworth 2017 Cost of Care Survey, data files received by private communication with Gordon Saunders in June 2018. The most current version of the Cost of Care Survey is available at https://www.genworth.com/costofcare. Annual cost of care for a private room and semi-private room in a nursing facility is based on the daily private room rate and semi-private room rate, multiplied by 365 days of care; the annual cost of assisted living is based on the monthly rate, multiplied by 12 months; the annual cost of adult day services is based on the daily rate for 5 days of care per week, multiplied by 52 weeks; and the annual cost of in-home care is based on the median hourly rate for 30 hours of care per week, multiplied by 52 weeks. For
the District of Columbia, 2016 data were used for assisted living and 2015 for adult day services, as more recent data were not available.
Long-Term Care Insurance, 2015
Private long-term care insurance policies in effect.Source: Susan Reinhard, Jean Accius, Ari Houser, Kathleen Ujvari, Julia Alexis, Wendy Fox-Grage, Picking Up the Pace of Change: A State Scorecard on Long-Term Services and Supports for Older Adults, People with Physical Disabilities, and Family Caregivers (Washington, DC: AARP Public Policy Institute, The Commonwealth Fund, and The SCAN Foundations, June 2017), http://www.longtermscorecard.org. Number of group and individual stand-alone and hybrid private long-term care insurance (LTCI) policies in force (for people of all ages) per 1,000 population ages 40 or older in the state. This is not an exact proportion of people ages 40 and older with private LTCI, because data on the age of policyholders at the state level

2018 Across the States 2018 Across the States 20
AARP Public Policy Institute August 2018
are not available. In 2009, 74 percent of group policyholders and 95 percent of individual policyholders were ages 40 and older.
LTCI policy data are from the AARP Public Policy Institute analysis of 2015 National Association of Insurance Commissioners (NAIC) Long-Term Care Insurance Experience Reporting–Form 5, end-of-year inforce counts, by company type (unpublished), http://store.naic.org/prod_serv_ home.htm. In addition, California Public Employee Retirement System (CalPERS) group LTCI policies (CalPERS, Facts at a Glance: January 2014–15 Comprehensive Annual Financial Report),
http://www.calpers.ca.gov/, and federal LTCI group policy counts (Long Term Care Partners LLC, unpublished, “Federal Long-Term Care Insurance Program Data, 2015”) are separately collected as NAIC does not report CalPERS or federal LTCI counts.
Population data from US Census Bureau Population Estimates, Annual Estimates of the Resident Population for Selected Age Groups by Sex for the United States: April 1, 2010, to July 1, 2015. Available on American FactFinder (https://factfinder.census.gov).
Medicaid Long-Term Services and Supports
Medicaid Spending Balance
Medicaid Home- and Community-Based Service (HCBS) spending as a percentage of LTSS spending for older people and adults with physical disabilities, 2011, 2016, and percent change; Medicaid LTSS spending balance by population, 2016 (pie charts). Source: AARP Public Policy Institute calculations based on data from Steve Eiken, Kate Sredl, Brian Burwell, and Angie Amos, Medicaid Expenditures for Long-Term Services and Supports in FY 2016, produced for the Medicaid Innovation Accelerator Program (Cambridge, MA: IBM Watson Health, 2018), https://www.medicaid.gov/medicaid/ltss/downloads/reports-and-evaluations/ltssexpenditures2016.pdf. 2011 data from AARP Public Policy Institute calculations based on data from Steve Eiken, Kate Sredl, Brian Burwell, and Paul Saucier, Medicaid Expenditures for Long-Term Services and Supports (LTSS) in FY 2014: Managed LTSS Reached 15 Percent of LTSS Spending (Cambridge, MA: Truven Health Analytics, an
IBM Company, 2016), https://www.medicaid.gov/medicaid/ltss/downloads/ltss-expenditures- 2014.pdf.
This is the percentage of Medicaid LTSS spending for older people and adults with physical disabilities (defined as nursing homes, personal care, aged/disabled waivers, home health, private duty nursing, and other programs used primarily by older people and adults with physical disabilities) going to HCBS.
Data for 2014 were used instead of 2016 for Alaska, California, Idaho, and Kansas because of surprising recent trend lines or known incompleteness. Each year, a few states exhibit a surprising one-year increase or decrease for certain program authorities. Usually these trends are offset by an opposite trend the following year.
A different reference year was used instead of 2011 for Massachusetts (2010/2011 average), New Jersey (2012), and New Mexico (2010) because of

2018 Across the States 2018 Across the States 21
AARP Public Policy Institute August 2018
concerns about data quality or completeness for the 2011 data year.
For Consumer First Choice spending in Oregon, 41 percent was allocated to older people and adults with physical disabilities and 59 percent to other populations in accordance with historical spending ratios.
Medicaid Expenditures (Total Federal + State)
Medicaid LTSS spending for older people and adults with physical disabilities (nursing facility and HCBS), 2016; Medicaid LTSS spending for all populations (institutional services and HCBS), 2016. Source: AARP Public Policy Institute calculations based on data from Steve Eiken, Kate Sredl, Brian Burwell, and Angie Amos, Medicaid Expenditures for Long-Term Services and Supports in FY 2016, produced for the Medicaid Innovation Accelerator Program (Cambridge, MA: IBM Watson Health, 2018), https://www.medicaid.gov/medicaid/ltss/downloads/reports-and-evaluations/ltssexpenditures2016.pdf.
Medicaid LTSS spending for older people and adults with physical disabilities is defined as nursing homes, personal care, aged/disabled waivers, home health, private duty nursing, and other programs used primarily by older people and adults with physical disabilities.
Data for 2014 were used instead of 2016 for Alaska, California, Idaho, and Kansas because of surprising recent trend lines or known incompleteness. Each year, a few states exhibit a surprising one-year increase or decrease for certain program authorities. Usually these trends are offset by an opposite trend the following year.
For Consumer First Choice spending in Oregon, 41 percent was allocated to older people and adults with physical disabilities and 59 percent to other populations in accordance with historical spending ratios.
State-funded HCBS expenditures for older people and adults with physical disabilities, 2014.Source: AARP Public Policy Institute calculations based on data from “State LTSS Scorecard Survey” (unpublished, Washington, DC: AARP Public Policy Institute, 2016).
Change in Medicaid Expenditures, 2011–16
Medicaid LTSS spending for older people and adults with physical disabilities, nursing facility spending, and HCBS spending.Source: AARP Public Policy Institute calculations based on data from Steve Eiken, Kate Sredl, Brian Burwell, and Angie Amos, Medicaid Expenditures for Long-Term Services and Supports in FY 2016, produced for the Medicaid Innovation Accelerator Program (Cambridge, MA: IBM Watson Health, 2018), https://www.medicaid.gov/medicaid/ltss/downloads/reports-and-evaluations/ltssexpenditures2016.pdf. Data for 2011 from AARP Public Policy Institute calculations based on data from Steve Eiken, Kate Sredl, Brian Burwell, and Paul Saucier, Medicaid Expenditures for Long-Term Services and Supports (LTSS) in FY 2014: Managed LTSS Reached 15 Percent of LTSS Spending (Cambridge, MA: Truven Health Analytics, an IBM Company, 2016), https://www.medicaid.gov/medicaid/ltss/downloads/ltss-expenditures-2014.pdf.
Data for 2014 were used instead of 2016 for Alaska, California, Idaho, and Kansas because of surprising recent trend lines, or known incompleteness. Each year, a few states exhibit

2018 Across the States 2018 Across the States 22
AARP Public Policy Institute August 2018
a surprising one-year increase or decrease for certain program authorities. Usually these trends are offset by an opposite trend the following year.
A different reference year was used instead of 2011 for Massachusetts (2010/2011 average), New Jersey (2012), and New Mexico (2010) because of concerns about data quality or completeness for the 2011 data year.
For Consumer First Choice spending in Oregon, 41 percent was allocated to older people and adults with physical disabilities and 59 percent to other populations in accordance with historical spending ratios.
Medicaid LTSS Users
Medicaid LTSS users ages 65+, 2013: All Medicaid LTSS users; institutional services only; HCBS only; and HCBS and institutional services.Source: AARP calculations based on Steve Eiken, Table 10, “Older Adults Who Received Any Type of Medicaid LTSS, 2013,” and Table 1, “Beneficiaries Who Received Any Type of Medicaid LTSS, 2013” in Medicaid Long-Term Services and Supports Beneficiaries in 2013
(Cambridge, MA: Truven Health Analytics, September 2017), https://www.medicaid.gov/ medicaid/ltss/downloads/reports-and-evaluations/ltss-beneficiaries-2013.pdf. Fourteen states are excluded because of missing, old, or unreliable data (Alabama, Arizona, Colorado, Delaware, District of Columbia, Hawaii, Idaho, Kansas, Maine, Minnesota, New Jersey, New Mexico, Tennessee, and Wisconsin).
Medicaid LTSS users, all ages, 2013: All Medicaid LTSS users; institutional services only; HCBS only; and HCBS and institutional services.Source: AARP calculations based on Steve Eiken, Table 10, “Older Adults Who Received Any Type of Medicaid LTSS, 2013,” and Table 1, “Beneficiaries Who Received Any Type of Medicaid LTSS, 2013” in Medicaid Long-Term Services and Supports Beneficiaries in 2013 (Cambridge, MA: Truven Health Analytics, September 2017), https://www.medicaid.gov/medicaid/ltss/downloads/reports-and-evaluations/ltss-beneficiaries-2013.pdf. Nine states are excluded because of missing, old, or unreliable data (Alabama, Colorado, Delaware, District of Columbia, Idaho, Kansas, Maine, Minnesota, and New Jersey).
Family Caregivers
Family caregivers; economic value of family caregiving; economic value per hour (all 2013).Source: AARP Public Policy Institute calculations based on Susan C. Reinhard, Lynn Feinberg, Rita Choula, and Ari Houser, “Valuing the Invaluable 2015 Update: Undeniable Progress, but Big Gaps Remain,” Insight on the Issues #104, AARP Public Policy Institute, Washington, DC, July 2015,
https://www.aarp.org/ppi/info-2015/valuing-the-invaluable-2015-update.html; and US Census Bureau Population Estimates, Annual Estimates of the Resident Population for Selected Age Groups by Sex for the United States: April 1, 2010 to July 1, 2016 (2016 vintage estimates). Available on American FactFinder (https://factfinder.census.gov).
https://www.medicaid.gov/medicaid/ltss/downloads/reports-and-evaluations/ltss-beneficiaries-2013.pdf
https://www.medicaid.gov/medicaid/ltss/downloads/reports-and-evaluations/ltss-beneficiaries-2013.pdf
https://www.medicaid.gov/medicaid/ltss/downloads/reports-and-evaluations/ltss-beneficiaries-2013.pdf
https://www.medicaid.gov/medicaid/ltss/downloads/reports-and-evaluations/ltss-beneficiaries-2013.pdf
https://www.medicaid.gov/medicaid/ltss/downloads/reports-and-evaluations/ltss-beneficiaries-2013.pdf
2018 Across the States 2018 Across the States 23
AARP Public Policy Institute August 2018
Ratio of economic value to Medicaid HCBS spending, 2013.Source: AARP Public Policy Institute calculations based on Susan C. Reinhard, Lynn Feinberg, Rita Choula, and Ari Houser, “Valuing the Invaluable 2015 Update: Undeniable Progress, but Big Gaps Remain,” Insight on the Issues #104, AARP Public Policy Institute, Washington, DC, July 2015, https://www.aarp.org/ppi/info-2015/valuing-the-invaluable-2015-update.html; and Steve Eiken, Kate Sredl, Brian Burwell, and Angie Amos, Medicaid Expenditures for Long-Term Services and Supports in FY 2016, produced for the Medicaid Innovation Accelerator Program (Cambridge, MA: IBM Watson Health, 2018) https://www.medicaid.gov/medicaid/ltss/ downloads/reports-and-evaluations/ltss expenditures2016.pdf. 2014 Medicaid HCBS
spending was used for New Mexico because of incomplete 2013 data.
Caregiver support ratio (2015, 2050).Source: AARP Public Policy Institute based on Regional Economic Models Inc., eREMI 4.1.0 (build 4681) standard regional control. The year 2015 is the latest historical data year; 2016 and later data are based on projections with a latest history year of 2015. The caregiver support ratio is defined as the number of people ages 45–64 divided by the number of people ages 80 and older.
Home- and Community-Based Services
Assisted Living Supply, 2014
Assisted living and residential care units.Source: Susan Reinhard Jean Accius, Ari Houser, Kathleen Ujvari, Julia Alexis, and Wendy Fox-Grage, Picking Up the Pace of Change: A State Scorecard on Long-Term Services and Supports for Older Adults, People with Physical Disabilities, and Family Caregivers (Washington, DC: AARP Public Policy Institute, The Commonwealth Fund, and The SCAN Foundations, June 2017), http://www.longtermscorecard.org.
Data for the assisted living and residential care units are from the National Center for Health Statistics (NCHS) National Study of Long-Term Care Providers Survey (NSLTCP). To be eligible for inclusion in the study, a residential care community must have been licensed, registered,
listed, certified, or otherwise regulated by the state to
• Provide room and board with at least two meals a day, with around-the-clock onsite supervision;
• Help with personal care, such as bathing and dressing, or health-related services, such as medication management;
• Have four or more licensed, certified, or registered beds;
• Have at least one resident currently living in the community; and
• Serve a predominantly adult population.
Excluded were residential care communities licensed to exclusively serve individuals with

2018 Across the States 2018 Across the States 24
AARP Public Policy Institute August 2018
severe mental illness or intellectual disability/developmental disability. Nursing facilities were also excluded. Data are not reported for Connecticut and Iowa—Connecticut’s licensing structure for assisted living does not permit a unit count and the vast majority of Iowa’s assisted living/residential care facilities were categorically ineligible for the NSLTCP owing to the operational definition used in the survey.
Population data are from US Census Bureau, Annual Estimates of the Resident Population for Selected Age Groups by Sex for the United States: April 1, 2010 to July 1, 2015. Available on American FactFinder (https://factfinder.census.gov).
Personal Care and Home Health Aides
Personal care and home health aides, 2015.*
* These measures report the average number of aides per year across the three years 2014–16 (N2014 + N2015 + N2016)/3 and the average ratio of aides to adults with self-care disability (R2014 + R2015 + R2016)/3, calculated separately.
Source: AARP Public Policy Institute analysis of US Census Bureau, American Community Survey 2014, 2015, and 2016, public use microdata, accessed May 2018; and US Census Bureau, 2014, 2015, and 2016 American Community Survey 1-Year Estimates, Table C18106, “Sex by Age by Self-Care Difficulty for the Civilian Noninstitutionalized Population 5 Years and Over,” generated using American FactFinder (https://factfinder.census.gov), accessed April 2018.
For each year 2014, 2015, and 2016, the number of personal care aides was calculated from the public use microdata sample (PUMS) as the number of people with occupation code 4610 (personal care aides) and industry code 8170 (home health care services), 8370 (social
services: individual and family service), or 9290 (private households) who were employed in the past year. The number of home health aides was calculated from the PUMS as the number of people with occupation code 3600 (nursing psychiatric and home health aides) and industry 8170, 8370, and 9290. These numbers were divided by the number of people ages 18 and older with self-care difficulty, from the corresponding year’s Table C18106.
Median hourly wage (personal care and home care aides), 2017.
Source: Bureau of Labor Statistics, Occupational Employment Statistics, May 2017 data release, state and national data tables (https://www.bls.gov/oes/tables.htm), accessed May 2018. Personal care aides are occupation code 39-9021 and home health aides are occupation code 31-1011.
Congregate and Home Delivered Meals, 2016
People receiving Older Americans Act (OAA) congregate meals; people receiving OAA home delivered meals; total OAA expenditures.
Source: AARP Public Policy Institute calculations using data from Administration on Aging, AGing Integration Database (AGID), State Program Reports, “SPR 2016, Expenditures, Total Expenditures: Home Delivered Meals” and “SPR 2016, Expenditures, Total Expenditures: Congregate Meals,” https://agid.acl.gov/Data Glance/SPR/, accessed May 2018.

2018 Across the States 2018 Across the States 25
AARP Public Policy Institute August 2018
Nursing Facilities
** This measure reports the average number of nursing assistants per year across the three years 2014–16 (N2014 + N2015 + N2016)/3 and the average ratio of nursing assistants to adults ages 75+ (R2014 + R2015 + R2016)/3, calculated separately.
Nursing Facilities, Utilization, and Resources
Total nursing facilities; nursing facility beds; nursing facility residents; nursing facility occupancy rate (2016); percent change in nursing facility residents 2011–16.Source: Helen Carrillo, University of California, San Francisco, analysis of data from Centers for Medicare & Medicaid Services, Certification and Survey Provider Enhanced Reports (CASPER), 18 Mos CASPER Data, July 2015–December 2016. Baseline data for percent change in nursing facility residents calculation are from Charlene Harrington and Helen Carrillo, University of California, San Francisco, analysis of data from Centers for Medicare and Medicaid Services, On-line Survey, Certification, and Reporting system (OSCAR), 18 Mos OSCAR Data, July 2010–December 2011. 2010 resident count was used instead of 2011 for West Virginia baseline because of a suspected data anomaly.
Direct care nursing hours per patient day; RN hours per resident day (2016).Source: Charlene Harrington, Helen Carrillo, Rachel Garfield, MaryBeth Musumeci, and Ellen Squires, Table 8, “Average RN, LPN/LVN, & Assistant Hours per Resident Day in Certified Nursing Facilities by State and Calendar Year,” in Nursing Facilities, Staffing, Residents and Facility Deficiencies, 2009 through 2016 (Washington, DC: Kaiser Commission on Medicaid and the
Uninsured, 2018), http://files.kff.org/attachment/REPORT-Nursing-Facilities-Staffing-Residents-and-Facility-Deficiencies-2009–2016. Total nursing hours include RN, LPN/LVN, and CNA hours.
Nursing assistants, 2015.**Source: AARP Public Policy Institute analysis of US Census Bureau, American Community Survey 2014, 2015, and 2016, public use microdata, accessed May 2018; and US Census Bureau, Annual Estimates of the Resident Population for Selected Age Groups by Sex for the United States: April 1, 2010 to July 1, 2014 (2014 vintage), April 1, 2010, to July 1, 2015 (2015 vintage), April 1, 2010, to July 1, 2016 (2016 vintage), available on American FactFinder (https://factfinder.census.gov), accessed April 2018.
For each year 2014, 2015, and 2016, the number of nursing assistants was calculated from PUMS as the number of people with occupation code 4610 (personal care aides) or 3600 (nursing psychiatric and home health aides) and industry code 8270 (skilled nursing facilities) who were employed in the past year. These numbers were divided by the number of people ages 75 and older, from the corresponding vintage population estimates.
Median hourly wage, 2017.Source: Bureau of Labor Statistics, Occupational Employment Statistics, May 2017 data release, and state and national data tables (https://www.bls.gov/oes/tables.htm), accessed May 2018. Nursing assistants are occupation code 31-1014.

2018 Across the States 2018 Across the States 26
AARP Public Policy Institute August 2018
Long-stay residents receiving inappropriate use of antipsychotic medication, 2017.Source: Centers for Medicare & Medicaid Services, Minimum Data Set 3.0, Quality Measure QM419, Q1–Q4, 2017, State Averages for calendar year end 2017, file date April 1, 2018, accessed on Nursing Home Compare in May 2018. https://data.medicare.gov/data/nursing-home-compare.
This is the percentage of long-stay nursing home residents, defined as 100 or more cumulative days in the nursing facility, who are receiving antipsychotic medication on target assessment. Criteria exclude nursing home residents with a diagnosis of bipolar disorder, schizophrenia, Tourette’s syndrome, and Huntington’s disease.
High-risk nursing home residents with pressure sores, 2017.Source: Centers for Medicare & Medicaid Services, Minimum Data Set 3.0, Quality Measure QM403, Q1–Q4, 2017, State Averages for calendar year end 2017, file date April 1, 2018, accessed on Nursing Home Compare in May 2018. https://data.medicare.gov/data/nursing-home-compare.
This is the percentage of long-stay nursing home residents impaired in bed mobility or transfer, comatose, or suffering malnutrition who have pressure sores (stages 2–4) on target assessment.
Long-stay residents with a hospital admission, 2014.Source: Susan Reinhard, Jean Accius, Ari Houser, Kathleen Ujvari, Julia Alexis, and Wendy Fox-Grage, Picking Up the Pace of Change: A State Scorecard on Long-Term Services and Supports
for Older Adults, People with Physical Disabilities, and Family Caregivers (Washington, DC: AARP Public Policy Institute, The Commonwealth Fund, and The SCAN Foundations, June 2017), http://www.longtermscorecard.org; and V. Mor, Brown University, analysis of 2014 Medicare enrollment data, Medicare Provider and Analysis Review File (CMS, MEDPAR 2014).
This is the percentage of long-stay residents (residing in a nursing home for at least 90 consecutive days) who were ever hospitalized within six months of baseline assessment. The national percentage was not provided in the source data. The US rate was estimated by the average of state rates, weighted by total nursing home population in each state.
Nursing home residents with low care needs, 2014.Source: Susan Reinhard, Jean Accius, Ari Houser, Kathleen Ujvari, Julia Alexis, and Wendy Fox-Grage, Picking Up the Pace of Change: A State Scorecard on Long-Term Services and Supports for Older Adults, People with Physical Disabilities, and Family Caregivers (Washington, DC: AARP Public Policy Institute, The Commonwealth Fund, and The SCAN Foundations, June 2017), http://www.longtermscorecard.org. Analysis of 2014 Minimum Data Set (MDS) state-level data are as reported in LTCFocus.org, by V. Mor at Brown University. Data were not available for Alaska or the District of Columbia.
Brown University (2014). Changing Long-Term Care in America Project at Brown University, funded in part by the National Institute on Aging (1P01AG027296). Providence, RI: Brown University of School of Public Health. http://ltcfocus.org/.

2018 Across the States 2018 Across the States 27
AARP Public Policy Institute August 2018
This is the percentage of nursing home residents ages 65 and older who met the criteria of having low care needs. Low care status is met if a resident does not require physical assistance in any of the four late-loss ADLs (bed mobility, transferring, using the toilet, and eating) and is not classified in either the “Special Rehab” or “Clinically Complex” Resource Utilization Group (RUG-IV). Low care status may apply to a resident who is also classified in either of the lowest 2 of the 44 RUG-IV groups.
Residents by primary payer (Medicaid, Medicare, and “other”), 2016.Source: Charlene Harrington, Helen Carrillo, Rachel Garfield, MaryBeth Musumeci, and Ellen Squires, Table 3, “Percent of Certified Nursing Facility Residents by Primary Payer Source, by State and Calendar Year,” in Nursing Facilities, Staffing, Residents and Facility Deficiencies, 2009 through 2016 (San Francisco: University of California, San Francisco, 2018), https://www.kff.org/medicaid/report/nursing-facilities-staffing-residents-and-facility-deficiencies-2009-through-2016/.

2018 Across the States 2018 Across the States 28
AARP Public Policy Institute August 2018
This page intentionally left blank.

2018 Across the States 2018 Across the States A-1
AARP Public Policy Institute August 2018
State and Data Rankings

2018 Across the States A-2
AARP Public Policy Institute August 2018
This page intentionally left blank.

2018 Across the States A-3
AARP Public Policy Institute August 2018
Population and ProjectionsPopulation: All Ages (thousands)
State2015 2030 2050
Value Rank Value Rank Value RankUnited States 321,419 blank 358,380 blank 395,882 blankAlabama 4,859 24 5,143 24 5,397 25Alaska 738 48 788 48 825 48Arizona 6,828 14 7,589 15 8,170 15Arkansas 2,978 33 3,113 34 3,234 34California 39,145 1 45,338 1 52,272 1Colorado 5,457 22 6,211 21 6,877 22Connecticut 3,591 29 3,953 29 4,529 28Delaware 946 45 1,013 45 1,119 45District of Columbia 672 49 762 49 802 49Florida 20,271 3 23,747 3 25,967 4Georgia 10,215 8 11,505 8 12,564 8Hawaii 1,432 40 1,553 40 1,597 41Idaho 1,655 39 1,789 39 1,868 39Illinois 12,860 5 13,864 6 15,377 5Indiana 6,620 16 6,968 17 7,632 17Iowa 3,124 30 3,378 31 3,745 30Kansas 2,912 34 3,149 33 3,405 33Kentucky 4,425 26 5,055 25 5,513 24Louisiana 4,671 25 4,992 26 5,250 26Maine 1,329 42 1,467 42 1,544 42Maryland 6,006 19 6,689 18 7,530 18Massachusetts 6,794 15 7,926 14 9,138 14Michigan 9,923 10 10,695 10 11,639 10Minnesota 5,490 21 6,200 22 6,994 19Mississippi 2,992 32 3,084 35 3,180 35Missouri 6,084 18 6,388 19 6,883 21Montana 1,033 44 1,111 44 1,129 44Nebraska 1,896 37 2,134 37 2,371 36Nevada 2,891 35 3,235 32 3,480 32New Hampshire 1,331 41 1,527 41 1,723 40New Jersey 8,958 11 10,063 11 11,608 11New Mexico 2,085 36 2,225 36 2,288 37New York 19,796 4 22,826 4 26,233 3North Carolina 10,043 9 10,884 9 11,786 9North Dakota 757 47 835 47 914 47Ohio 11,613 7 12,443 7 13,237 7Oklahoma 3,911 28 3,970 28 4,055 29Oregon 4,029 27 4,444 27 4,782 27Pennsylvania 12,803 6 13,941 5 15,137 6Rhode Island 1,056 43 1,193 43 1,344 43South Carolina 4,896 23 5,299 23 5,604 23South Dakota 858 46 963 46 1,031 46Tennessee 6,600 17 7,278 16 7,867 16Texas 27,469 2 31,006 2 33,888 2Utah 2,996 31 3,414 30 3,707 31Vermont 626 50 701 50 760 50Virginia 8,383 12 9,435 12 10,450 12Washington 7,170 13 8,348 13 9,937 13West Virginia 1,844 38 1,885 38 1,954 38Wisconsin 5,771 20 6,256 20 6,908 20Wyoming 586 51 609 51 635 51
Note: Data are ranked from highest to lowest value; this does not necessarily correspond to level of performance.
2015 population is historical data; 2030 and 2050 are projections based on a last history year of 2015.

2018 Across the States A-4
AARP Public Policy Institute August 2018
Population and ProjectionsPopulation: Under 65 (thousands)
State2015 2030 2050
Value Rank Value Rank Value RankUnited States 273,658 blank 284,013 blank 307,819 blankAlabama 4,095 24 4,063 24 4,240 25Alaska 666 47 647 49 669 48Arizona 5,708 15 5,813 15 6,071 16Arkansas 2,501 33 2,446 35 2,515 34California 33,956 1 36,742 1 40,908 1Colorado 4,745 21 4,972 19 5,268 22Connecticut 3,024 29 3,062 29 3,517 28Delaware 785 45 769 45 859 44District of Columbia 595 49 652 48 628 49Florida 16,329 4 17,800 4 19,181 4Georgia 8,910 8 9,308 8 9,789 8Hawaii 1,195 40 1,213 40 1,216 41Idaho 1,411 39 1,409 39 1,430 39Illinois 11,030 5 11,072 5 12,039 5Indiana 5,654 16 5,524 17 6,032 17Iowa 2,621 31 2,652 31 2,942 30Kansas 2,485 34 2,500 33 2,673 32Kentucky 3,752 26 4,063 24 4,406 23Louisiana 4,018 25 4,010 26 4,155 26Maine 1,079 42 1,089 42 1,159 42Maryland 5,157 18 5,284 18 5,838 18Massachusetts 5,749 14 6,267 14 7,128 14Michigan 8,352 10 8,357 10 9,166 9Minnesota 4,684 22 4,877 21 5,383 19Mississippi 2,553 32 2,450 34 2,503 35Missouri 5,129 19 4,967 20 5,336 20Montana 855 44 844 44 858 45Nebraska 1,617 37 1,704 37 1,864 36Nevada 2,469 35 2,506 32 2,578 33New Hampshire 1,112 41 1,156 41 1,313 40New Jersey 7,614 11 7,924 11 9,046 11New Mexico 1,755 36 1,730 36 1,774 37New York 16,831 3 18,374 3 20,814 3North Carolina 8,526 9 8,533 9 9,073 10North Dakota 650 48 671 47 728 47Ohio 9,770 7 9,769 7 10,381 7Oklahoma 3,335 28 3,162 28 3,209 29Oregon 3,368 27 3,459 27 3,626 27Pennsylvania 10,623 6 10,814 6 11,788 6Rhode Island 886 43 931 43 1,047 43South Carolina 4,101 23 4,105 23 4,306 24South Dakota 724 46 755 46 802 46Tennessee 5,584 17 5,765 16 6,154 15Texas 24,244 2 25,501 2 26,676 2Utah 2,688 30 2,894 30 2,942 30Vermont 516 50 526 50 575 50Virginia 7,195 12 7,468 12 8,071 12Washington 6,134 13 6,657 13 7,801 13West Virginia 1,508 38 1,448 38 1,532 38Wisconsin 4,869 20 4,836 22 5,318 21Wyoming 501 51 475 51 490 51
Note: Data are ranked from highest to lowest value; this does not necessarily correspond to level of performance.
2015 population is historical data; 2030 and 2050 are projections based on a last history year of 2015.

2018 Across the States A-5
AARP Public Policy Institute August 2018
Population: Ages 50+ (thousands)
State2015 2030 2050
Value Rank Value Rank Value RankUnited States 110,973 blank 134,344 blank 160,466 blankAlabama 1,743 24 1,950 24 2,227 24Alaska 217 49 258 49 285 50Arizona 2,365 15 2,969 15 3,498 15Arkansas 1,053 31 1,178 32 1,325 33California 12,462 1 16,345 1 20,619 1Colorado 1,763 23 2,308 22 2,856 21Connecticut 1,345 28 1,574 28 1,876 28Delaware 356 45 407 45 458 45District of Columbia 186 51 241 50 318 49Florida 8,035 3 9,767 3 11,421 3Georgia 3,223 10 4,191 9 5,104 8Hawaii 506 42 577 42 649 42Idaho 550 40 661 39 772 39Illinois 4,376 6 5,227 6 6,210 6Indiana 2,282 17 2,613 17 3,025 17Iowa 1,128 30 1,262 31 1,465 31Kansas 986 33 1,133 34 1,323 34Kentucky 1,574 25 1,833 25 2,141 25Louisiana 1,568 26 1,782 26 2,104 26Maine 565 39 627 41 698 41Maryland 2,083 20 2,561 18 3,003 18Massachusetts 2,460 13 3,001 14 3,762 14Michigan 3,677 8 4,122 10 4,706 10Minnesota 1,929 21 2,343 21 2,873 19Mississippi 1,018 32 1,139 33 1,277 35Missouri 2,191 18 2,463 19 2,819 22Montana 399 43 437 44 486 44Nebraska 642 38 760 38 903 37Nevada 972 34 1,284 30 1,516 30New Hampshire 531 41 630 40 745 40New Jersey 3,207 11 3,924 11 4,701 11New Mexico 740 36 837 36 920 36New York 6,932 4 8,341 4 10,401 4North Carolina 3,486 9 4,228 8 4,856 9North Dakota 249 48 282 48 344 47Ohio 4,266 7 4,757 7 5,413 7Oklahoma 1,316 29 1,435 29 1,577 29Oregon 1,468 27 1,758 27 2,067 27Pennsylvania 4,904 5 5,444 5 6,299 5Rhode Island 393 44 459 43 548 43South Carolina 1,777 22 2,068 23 2,362 23South Dakota 306 46 348 46 408 46Tennessee 2,334 16 2,746 16 3,225 16Texas 8,040 2 10,644 2 13,144 2Utah 746 35 1,038 35 1,387 32Vermont 255 47 291 47 329 48Virginia 2,854 12 3,560 12 4,139 12Washington 2,451 14 3,082 13 3,966 13West Virginia 734 37 766 37 797 38Wisconsin 2,123 19 2,460 20 2,858 20Wyoming 204 50 231 51 258 51
Note: Data are ranked from highest to lowest value; this does not necessarily correspond to level of performance.
2015 population is historical data; 2030 and 2050 are projections based on a last history year of 2015.
Population and Projections

2018 Across the States A-6
AARP Public Policy Institute August 2018
Population and ProjectionsPopulation: Ages 65+ (thousands)
State2015 2030 2050
Value Rank Value Rank Value RankUnited States 47,761 blank 74,367 blank 88,062 blankAlabama 764 23 1,080 24 1,157 24Alaska 73 51 141 49 156 50Arizona 1,120 13 1,776 13 2,098 14Arkansas 477 31 667 32 719 34California 5,189 1 8,595 1 11,364 1Colorado 712 24 1,239 22 1,610 19Connecticut 567 29 891 28 1,012 28Delaware 161 45 244 45 259 45District of Columbia 77 50 110 51 174 49Florida 3,942 2 5,947 2 6,787 3Georgia 1,305 11 2,197 10 2,775 8Hawaii 237 41 340 42 381 42Idaho 243 40 380 39 438 38Illinois 1,830 7 2,791 6 3,337 6Indiana 966 17 1,444 17 1,600 20Iowa 503 30 726 31 803 31Kansas 426 33 650 33 732 33Kentucky 673 25 992 25 1,108 26Louisiana 653 27 982 27 1,095 27Maine 251 39 378 40 386 41Maryland 850 20 1,405 20 1,692 17Massachusetts 1,045 14 1,659 15 2,010 15Michigan 1,571 8 2,337 9 2,473 11Minnesota 806 21 1,322 21 1,611 18Mississippi 440 32 634 34 678 35Missouri 955 18 1,421 18 1,547 22Montana 178 43 266 43 271 44Nebraska 279 38 430 38 507 37Nevada 422 34 729 30 902 29New Hampshire 219 42 371 41 410 40New Jersey 1,344 10 2,139 11 2,562 10New Mexico 330 36 494 36 514 36New York 2,964 4 4,451 4 5,419 4North Carolina 1,517 9 2,351 8 2,713 9North Dakota 107 48 164 48 187 47Ohio 1,843 6 2,674 7 2,856 7Oklahoma 576 28 808 29 845 30Oregon 661 26 985 26 1,155 25Pennsylvania 2,180 5 3,128 5 3,349 5Rhode Island 170 44 262 44 297 43South Carolina 795 22 1,195 23 1,298 23South Dakota 134 46 208 46 229 46Tennessee 1,017 16 1,513 16 1,713 16Texas 3,225 3 5,505 3 7,212 2Utah 308 37 519 35 764 32Vermont 110 47 175 47 185 48Virginia 1,188 12 1,967 12 2,379 12Washington 1,036 15 1,691 14 2,136 13West Virginia 336 35 437 37 422 39Wisconsin 902 19 1,421 18 1,590 21Wyoming 85 49 135 50 145 51
Note: Data are ranked from highest to lowest value; this does not necessarily correspond to level of performance.
2015 population is historical data; 2030 and 2050 are projections based on a last history year of 2015.

2018 Across the States A-7
AARP Public Policy Institute August 2018
Population and ProjectionsPopulation: Ages 85+ (thousands)
State2015 2030 2050
Value Rank Value Rank Value RankUnited States 6,287 blank 9,300 blank 19,385 blankAlabama 85 23 123 25 222 26Alaska 6 51 13 50 35 49Arizona 131 14 255 11 506 13Arkansas 56 32 81 33 144 34California 708 1 1,082 1 2,428 1Colorado 84 24 149 22 357 19Connecticut 90 22 118 26 259 24Delaware 19 46 32 45 63 45District of Columbia 11 49 11 51 21 51Florida 540 2 876 2 1,670 2Georgia 136 13 251 12 566 10Hawaii 38 38 51 38 97 41Idaho 28 42 51 38 103 39Illinois 259 6 335 6 696 6Indiana 128 17 170 21 340 22Iowa 79 27 97 29 192 30Kansas 65 31 84 32 176 31Kentucky 77 28 105 28 207 28Louisiana 76 29 109 27 215 27Maine 32 40 48 41 98 40Maryland 113 21 176 19 399 16Massachusetts 159 11 206 15 461 15Michigan 213 8 282 9 562 11Minnesota 118 19 172 20 399 16Mississippi 50 33 71 34 132 35Missouri 127 18 177 17 350 20Montana 22 44 35 43 69 44Nebraska 42 34 56 37 121 36Nevada 40 35 90 31 197 29New Hampshire 29 41 44 42 108 38New Jersey 197 9 269 10 588 9New Mexico 39 36 64 36 119 37New York 433 3 555 4 1,126 4North Carolina 175 10 294 8 594 8North Dakota 18 47 21 48 46 48Ohio 253 7 315 7 617 7Oklahoma 69 30 95 30 168 32Oregon 84 24 130 24 251 25Pennsylvania 334 5 391 5 763 5Rhode Island 28 42 34 44 73 43South Carolina 82 26 149 22 283 23South Dakota 21 45 28 46 61 46Tennessee 114 20 177 17 342 21Texas 374 4 635 3 1,439 3Utah 36 39 65 35 147 33Vermont 14 48 23 47 50 47Virginia 143 12 245 13 551 12Washington 131 14 213 14 468 14West Virginia 39 36 49 40 80 42Wisconsin 129 16 180 16 395 18Wyoming 10 50 16 49 34 50
Note: Data are ranked from highest to lowest value; this does not necessarily correspond to level of performance.
2015 population is historical data; 2030 and 2050 are projections based on a last history year of 2015.

2018 Across the States A-8
AARP Public Policy Institute August 2018
Population and ProjectionsPopulation: Ages 50+ (percent of total population)
State2015 2030 2050
Value Rank Value Rank Value RankUnited States 34.5% blank 37.5% blank 40.5% blankAlabama 35.9% 19 37.9% 23 41.3% 14Alaska 29.3% 48 32.8% 49 34.5% 51Arizona 34.6% 32 39.1% 12 42.8% 8Arkansas 35.4% 24 37.8% 25 41.0% 19California 31.8% 46 36.1% 41 39.4% 42Colorado 32.3% 45 37.2% 33 41.5% 11Connecticut 37.5% 9 39.8% 7 41.4% 12Delaware 37.7% 8 40.2% 6 40.9% 22District of Columbia 27.6% 50 31.6% 50 39.7% 37Florida 39.6% 5 41.1% 4 44.0% 2Georgia 31.6% 47 36.4% 39 40.6% 27Hawaii 35.4% 24 37.2% 33 40.7% 26Idaho 33.2% 43 36.9% 35 41.3% 14Illinois 34.0% 35 37.7% 27 40.4% 30Indiana 34.5% 33 37.5% 31 39.6% 39Iowa 36.1% 17 37.4% 32 39.1% 43Kansas 33.9% 38 36.0% 44 38.8% 45Kentucky 35.6% 21 36.3% 40 38.8% 45Louisiana 33.6% 40 35.7% 45 40.1% 34Maine 42.5% 1 42.8% 1 45.2% 1Maryland 34.7% 30 38.3% 20 39.9% 35Massachusetts 36.2% 16 37.9% 23 41.2% 16Michigan 37.1% 11 38.5% 18 40.4% 30Minnesota 35.1% 27 37.8% 25 41.1% 18Mississippi 34.0% 35 36.9% 35 40.2% 32Missouri 36.0% 18 38.6% 17 41.0% 19Montana 38.6% 6 39.3% 10 43.1% 7Nebraska 33.9% 38 35.6% 46 38.1% 48Nevada 33.6% 40 39.7% 8 43.6% 3New Hampshire 39.9% 3 41.3% 3 43.3% 4New Jersey 35.8% 20 39.0% 14 40.5% 29New Mexico 35.5% 23 37.6% 30 40.2% 32New York 35.0% 28 36.5% 38 39.7% 37North Carolina 34.7% 30 38.8% 16 41.2% 16North Dakota 32.9% 44 33.8% 48 37.6% 49Ohio 36.7% 13 38.2% 21 40.9% 22Oklahoma 33.6% 40 36.1% 41 38.9% 44Oregon 36.4% 14 39.6% 9 43.2% 6Pennsylvania 38.3% 7 39.1% 12 41.6% 10Rhode Island 37.2% 10 38.5% 18 40.8% 24South Carolina 36.3% 15 39.0% 14 42.1% 9South Dakota 35.6% 21 36.1% 41 39.6% 39Tennessee 35.4% 24 37.7% 27 41.0% 19Texas 29.3% 48 34.3% 47 38.8% 45Utah 24.9% 51 30.4% 51 37.4% 50Vermont 40.7% 2 41.4% 2 43.3% 4Virginia 34.0% 35 37.7% 27 39.6% 39Washington 34.2% 34 36.9% 35 39.9% 35West Virginia 39.8% 4 40.6% 5 40.8% 24Wisconsin 36.8% 12 39.3% 10 41.4% 12Wyoming 34.9% 29 38.0% 22 40.6% 27
Note: Data are ranked from highest to lowest value; this does not necessarily correspond to level of performance.
2015 population is historical data; 2030 and 2050 are projections based on a last history year of 2015.

2018 Across the States A-9
AARP Public Policy Institute August 2018
Population and Projections Population: Ages 65+ (percent of total population)
State2015 2030 2050
Value Rank Value Rank Value RankUnited States 14.9% blank 20.8% blank 22.2% blankAlabama 15.7% 20 21.0% 29 21.4% 38Alaska 9.9% 51 17.9% 48 18.9% 51Arizona 16.4% 10 23.4% 7 25.7% 3Arkansas 16.0% 15 21.4% 25 22.2% 23California 13.3% 45 19.0% 47 21.7% 31Colorado 13.0% 46 19.9% 41 23.4% 10Connecticut 15.8% 17 22.5% 10 22.3% 22Delaware 17.0% 6 24.1% 5 23.2% 12District of Columbia 11.5% 49 14.4% 51 21.7% 31Florida 19.4% 1 25.0% 2 26.1% 1Georgia 12.8% 47 19.1% 46 22.1% 25Hawaii 16.5% 8 21.9% 19 23.8% 8Idaho 14.7% 30 21.2% 28 23.4% 10Illinois 14.2% 40 20.1% 40 21.7% 31Indiana 14.6% 35 20.7% 34 21.0% 44Iowa 16.1% 13 21.5% 23 21.4% 38Kansas 14.6% 35 20.6% 35 21.5% 36Kentucky 15.2% 26 19.6% 44 20.1% 50Louisiana 14.0% 44 19.7% 42 20.9% 45Maine 18.8% 2 25.7% 1 25.0% 4Maryland 14.1% 43 21.0% 29 22.5% 19Massachusetts 15.4% 24 20.9% 31 22.0% 29Michigan 15.8% 17 21.9% 19 21.2% 43Minnesota 14.7% 30 21.3% 26 23.0% 14Mississippi 14.7% 30 20.6% 35 21.3% 41Missouri 15.7% 20 22.2% 14 22.5% 19Montana 17.2% 5 24.0% 6 24.0% 7Nebraska 14.7% 30 20.2% 39 21.4% 38Nevada 14.6% 35 22.5% 10 25.9% 2New Hampshire 16.5% 8 24.3% 4 23.8% 8New Jersey 15.0% 28 21.3% 26 22.1% 25New Mexico 15.8% 17 22.2% 14 22.5% 19New York 15.0% 28 19.5% 45 20.7% 47North Carolina 15.1% 27 21.6% 21 23.0% 14North Dakota 14.2% 40 19.7% 42 20.4% 49Ohio 15.9% 16 21.5% 23 21.6% 34Oklahoma 14.7% 30 20.3% 37 20.9% 45Oregon 16.4% 10 22.2% 14 24.2% 6Pennsylvania 17.0% 6 22.4% 13 22.1% 25Rhode Island 16.1% 13 22.0% 18 22.1% 25South Carolina 16.2% 12 22.5% 10 23.2% 12South Dakota 15.7% 20 21.6% 21 22.2% 23Tennessee 15.4% 24 20.8% 33 21.8% 30Texas 11.7% 48 17.8% 49 21.3% 41Utah 10.3% 50 15.2% 50 20.6% 48Vermont 17.6% 4 25.0% 2 24.3% 5Virginia 14.2% 40 20.9% 31 22.8% 17Washington 14.4% 39 20.3% 37 21.5% 36West Virginia 18.2% 3 23.2% 8 21.6% 34Wisconsin 15.6% 23 22.7% 9 23.0% 14Wyoming 14.5% 38 22.1% 17 22.8% 17
Note: Data are ranked from highest to lowest value; this does not necessarily correspond to level of performance.
2015 population is historical data; 2030 and 2050 are projections based on a last history year of 2015.

2018 Across the States A-10
AARP Public Policy Institute August 2018
Population and Projections Population: Ages 85+ (percent of total population)
State2015 2030 2050
Value Rank Value Rank Value RankUnited States 2.0% blank 2.6% blank 4.9% blankAlabama 1.8% 32 2.4% 36 4.1% 44Alaska 0.8% 51 1.6% 50 4.2% 42Arizona 1.9% 27 3.4% 2 6.2% 5Arkansas 1.9% 27 2.6% 25 4.4% 39California 1.8% 32 2.4% 36 4.6% 35Colorado 1.5% 46 2.4% 36 5.2% 20Connecticut 2.5% 5 3.0% 8 5.7% 9Delaware 2.0% 25 3.2% 5 5.6% 13District of Columbia 1.7% 37 1.4% 51 2.7% 51Florida 2.7% 1 3.7% 1 6.4% 2Georgia 1.3% 49 2.2% 45 4.5% 36Hawaii 2.7% 1 3.3% 3 6.0% 7Idaho 1.7% 37 2.9% 9 5.5% 14Illinois 2.0% 25 2.4% 36 4.5% 36Indiana 1.9% 27 2.4% 36 4.5% 36Iowa 2.5% 5 2.9% 9 5.1% 23Kansas 2.2% 12 2.7% 22 5.2% 20Kentucky 1.7% 37 2.1% 47 3.8% 50Louisiana 1.6% 45 2.2% 45 4.1% 44Maine 2.4% 8 3.3% 3 6.4% 2Maryland 1.9% 27 2.6% 25 5.3% 16Massachusetts 2.3% 10 2.6% 25 5.0% 27Michigan 2.1% 21 2.6% 25 4.8% 32Minnesota 2.2% 12 2.8% 16 5.7% 9Mississippi 1.7% 37 2.3% 44 4.1% 44Missouri 2.1% 21 2.8% 16 5.1% 23Montana 2.2% 12 3.2% 5 6.1% 6Nebraska 2.2% 12 2.6% 25 5.1% 23Nevada 1.4% 47 2.8% 16 5.7% 9New Hampshire 2.2% 12 2.9% 9 6.3% 4New Jersey 2.2% 12 2.7% 22 5.1% 23New Mexico 1.9% 27 2.9% 9 5.2% 20New York 2.2% 12 2.4% 36 4.3% 41North Carolina 1.7% 37 2.7% 22 5.0% 27North Dakota 2.4% 8 2.5% 33 5.0% 27Ohio 2.2% 12 2.5% 33 4.7% 33Oklahoma 1.8% 32 2.4% 36 4.1% 44Oregon 2.1% 21 2.9% 9 5.3% 16Pennsylvania 2.6% 4 2.8% 16 5.0% 27Rhode Island 2.7% 1 2.8% 16 5.4% 15South Carolina 1.7% 37 2.8% 16 5.0% 27South Dakota 2.5% 5 2.9% 9 5.9% 8Tennessee 1.7% 37 2.4% 36 4.4% 39Texas 1.4% 47 2.0% 48 4.2% 42Utah 1.2% 50 1.9% 49 4.0% 49Vermont 2.3% 10 3.2% 5 6.6% 1Virginia 1.7% 37 2.6% 25 5.3% 16Washington 1.8% 32 2.5% 33 4.7% 33West Virginia 2.1% 21 2.6% 25 4.1% 44Wisconsin 2.2% 12 2.9% 9 5.7% 9Wyoming 1.8% 32 2.6% 25 5.3% 16
Note: Data are ranked from highest to lowest value; this does not necessarily correspond to level of performance.
2015 population is historical data; 2030 and 2050 are projections based on a last history year of 2015.

2018 Across the States A-11
AARP Public Policy Institute August 2018
Population: All Ages (percent change from 2015)
State2030 2050
Value Rank Value RankUnited States +11% blank +23% blankAlabama +6% 44 +11% 44Alaska +7% 39 +12% 41Arizona +11% 21 +20% 21Arkansas +5% 45 +9% 46California +16% 3 +34% 2Colorado +14% 7 +26% 10Connecticut +10% 23 +26% 10Delaware +7% 39 +18% 30District of Columbia +13% 10 +19% 27Florida +17% 1 +28% 7Georgia +13% 10 +23% 17Hawaii +8% 29 +12% 41Idaho +8% 29 +13% 39Illinois +8% 29 +20% 21Indiana +5% 45 +15% 36Iowa +8% 29 +20% 21Kansas +8% 29 +17% 32Kentucky +14% 7 +25% 12Louisiana +7% 39 +12% 41Maine +10% 23 +16% 35Maryland +11% 21 +25% 12Massachusetts +17% 1 +34% 2Michigan +8% 29 +17% 32Minnesota +13% 10 +27% 8Mississippi +3% 49 +6% 49Missouri +5% 45 +13% 39Montana +8% 29 +9% 46Nebraska +13% 10 +25% 12Nevada +12% 17 +20% 21New Hampshire +15% 5 +29% 6New Jersey +12% 17 +30% 5New Mexico +7% 39 +10% 45New York +15% 5 +33% 4North Carolina +8% 29 +17% 32North Dakota +10% 23 +21% 19Ohio +7% 39 +14% 37Oklahoma +2% 50 +4% 51Oregon +10% 23 +19% 27Pennsylvania +9% 28 +18% 30Rhode Island +13% 10 +27% 8South Carolina +8% 29 +14% 37South Dakota +12% 17 +20% 21Tennessee +10% 23 +19% 27Texas +13% 10 +23% 17Utah +14% 7 +24% 16Vermont +12% 17 +21% 19Virginia +13% 10 +25% 12Washington +16% 3 +39% 1West Virginia +2% 50 +6% 49Wisconsin +8% 29 +20% 21Wyoming +4% 48 +8% 48
Note: Data are ranked from highest to lowest value; this does not necessarily correspond to level of performance.
2015 population is historical data; 2030 and 2050 are projections based on a last history year of 2015.
Population and Projections

2018 Across the States A-12
AARP Public Policy Institute August 2018
Population: Under 65 (percent change from 2015)
State2030 2050
Value Rank Value RankUnited States +4% blank +12% blankAlabama -1% 39 +4% 38Alaska -3% 46 +1% 44Arizona +2% 22 +6% 33Arkansas -2% 43 +1% 44California +8% 6 +20% 4Colorado +5% 9 +11% 17Connecticut +1% 27 +16% 10Delaware -2% 43 +9% 25District of Columbia +10% 1 +5% 36Florida +9% 2 +17% 8Georgia +4% 13 +10% 21Hawaii +2% 22 +2% 42Idaho 0% 32 +1% 44Illinois 0% 32 +9% 25Indiana -2% 43 +7% 31Iowa +1% 27 +12% 14Kansas +1% 27 +8% 29Kentucky +8% 6 +17% 8Louisiana 0% 32 +3% 41Maine +1% 27 +7% 31Maryland +2% 22 +13% 13Massachusetts +9% 2 +24% 2Michigan 0% 32 +10% 21Minnesota +4% 13 +15% 11Mississippi -4% 48 -2% 49Missouri -3% 46 +4% 38Montana -1% 39 0% 48Nebraska +5% 9 +15% 11Nevada +1% 27 +4% 38New Hampshire +4% 13 +18% 6New Jersey +4% 13 +19% 5New Mexico -1% 39 +1% 44New York +9% 2 +24% 2North Carolina 0% 32 +6% 33North Dakota +3% 19 +12% 14Ohio 0% 32 +6% 33Oklahoma -5% 50 -4% 51Oregon +3% 19 +8% 29Pennsylvania +2% 22 +11% 17Rhode Island +5% 9 +18% 6South Carolina 0% 32 +5% 36South Dakota +4% 13 +11% 17Tennessee +3% 19 +10% 21Texas +5% 9 +10% 21Utah +8% 6 +9% 25Vermont +2% 22 +11% 17Virginia +4% 13 +12% 14Washington +9% 2 +27% 1West Virginia -4% 48 +2% 42Wisconsin -1% 39 +9% 25Wyoming -5% 50 -2% 49
Note: Data are ranked from highest to lowest value; this does not necessarily correspond to level of performance.
2015 population is historical data; 2030 and 2050 are projections based on a last history year of 2015.
Population and Projections

2018 Across the States A-13
AARP Public Policy Institute August 2018
Population: Ages 50+ (percent change from 2015)
State2030 2050
Value Rank Value RankUnited States +21% blank +45% blankAlabama +12% 40 +28% 39Alaska +19% 20 +31% 34Arizona +26% 8 +48% 12Arkansas +12% 40 +26% 44California +31% 4 +65% 3Colorado +31% 4 +62% 5Connecticut +17% 25 +39% 22Delaware +14% 31 +29% 36District of Columbia +30% 6 +71% 2Florida +22% 12 +42% 16Georgia +30% 6 +58% 7Hawaii +14% 31 +28% 39Idaho +20% 17 +40% 20Illinois +19% 20 +42% 16Indiana +14% 31 +33% 32Iowa +12% 40 +30% 35Kansas +15% 30 +34% 29Kentucky +16% 27 +36% 27Louisiana +14% 31 +34% 29Maine +11% 47 +24% 47Maryland +23% 11 +44% 15Massachusetts +22% 12 +53% 9Michigan +12% 40 +28% 39Minnesota +21% 15 +49% 11Mississippi +12% 40 +25% 46Missouri +12% 40 +29% 36Montana +10% 49 +22% 49Nebraska +18% 23 +41% 18Nevada +32% 2 +56% 8New Hampshire +19% 20 +40% 20New Jersey +22% 12 +47% 13New Mexico +13% 37 +24% 47New York +20% 17 +50% 10North Carolina +21% 15 +39% 22North Dakota +13% 37 +38% 25Ohio +12% 40 +27% 43Oklahoma +9% 50 +20% 50Oregon +20% 17 +41% 18Pennsylvania +11% 47 +28% 39Rhode Island +17% 25 +39% 22South Carolina +16% 27 +33% 32South Dakota +14% 31 +34% 29Tennessee +18% 23 +38% 25Texas +32% 2 +63% 4Utah +39% 1 +86% 1Vermont +14% 31 +29% 36Virginia +25% 10 +45% 14Washington +26% 8 +62% 5West Virginia +4% 51 +9% 51Wisconsin +16% 27 +35% 28Wyoming +13% 37 +26% 44
Note: Data are ranked from highest to lowest value; this does not necessarily correspond to level of performance.
2015 population is historical data; 2030 and 2050 are projections based on a last history year of 2015.
Population and Projections

2018 Across the States A-14
AARP Public Policy Institute August 2018
Population: Ages 65+ (percent change from 2015)
State2030 2050
Value Rank Value RankUnited States +56% blank +84% blankAlabama +41% 48 +51% 48Alaska +93% 1 +114% 6Arizona +59% 13 +87% 15Arkansas +40% 49 +51% 48California +66% 8 +119% 5Colorado +74% 2 +126% 3Connecticut +57% 18 +78% 22Delaware +52% 27 +62% 37District of Columbia +43% 45 +127% 2Florida +51% 29 +72% 27Georgia +68% 7 +113% 8Hawaii +43% 45 +61% 39Idaho +56% 20 +80% 20Illinois +53% 25 +82% 18Indiana +49% 36 +66% 34Iowa +44% 43 +60% 40Kansas +52% 27 +72% 27Kentucky +47% 41 +65% 35Louisiana +50% 31 +68% 31Maine +51% 29 +54% 44Maryland +65% 10 +99% 12Massachusetts +59% 13 +92% 13Michigan +49% 36 +57% 41Minnesota +64% 11 +100% 10Mississippi +44% 43 +54% 44Missouri +49% 36 +62% 37Montana +50% 31 +52% 47Nebraska +54% 22 +82% 18Nevada +73% 3 +114% 6New Hampshire +70% 5 +87% 15New Jersey +59% 13 +91% 14New Mexico +50% 31 +56% 42New York +50% 31 +83% 17North Carolina +55% 21 +79% 21North Dakota +53% 25 +74% 26Ohio +45% 42 +55% 43Oklahoma +40% 49 +47% 50Oregon +49% 36 +75% 24Pennsylvania +43% 45 +54% 44Rhode Island +54% 22 +75% 24South Carolina +50% 31 +63% 36South Dakota +54% 22 +70% 30Tennessee +49% 36 +68% 31Texas +71% 4 +124% 4Utah +69% 6 +148% 1Vermont +59% 13 +68% 31Virginia +66% 8 +100% 10Washington +63% 12 +106% 9West Virginia +30% 51 +26% 51Wisconsin +57% 18 +76% 23Wyoming +59% 13 +71% 29
Note: Data are ranked from highest to lowest value; this does not necessarily correspond to level of performance.
2015 population is historical data; 2030 and 2050 are projections based on a last history year of 2015.
Population and Projections

2018 Across the States A-15
AARP Public Policy Institute August 2018
Population: Ages 85+ (percent change from 2015)
State2030 2050
Value Rank Value RankUnited States +48% blank +208% blankAlabama +44% 27 +160% 40Alaska +109% 2 +465% 1Arizona +95% 3 +287% 6Arkansas +45% 26 +157% 42California +53% 21 +243% 15Colorado +77% 8 +326% 3Connecticut +31% 39 +188% 29Delaware +73% 9 +237% 17District of Columbia -4% 51 +87% 51Florida +62% 14 +209% 20Georgia +85% 4 +316% 4Hawaii +33% 35 +152% 45Idaho +83% 5 +269% 10Illinois +30% 41 +169% 35Indiana +33% 35 +166% 37Iowa +22% 47 +142% 47Kansas +31% 39 +173% 34Kentucky +36% 32 +168% 36Louisiana +43% 28 +183% 32Maine +51% 24 +207% 22Maryland +55% 19 +252% 12Massachusetts +30% 41 +191% 28Michigan +32% 38 +164% 38Minnesota +46% 25 +237% 17Mississippi +42% 29 +162% 39Missouri +39% 31 +176% 33Montana +57% 16 +208% 21Nebraska +33% 35 +186% 30Nevada +127% 1 +396% 2New Hampshire +52% 23 +273% 9New Jersey +36% 32 +198% 26New Mexico +66% 13 +207% 22New York +28% 44 +160% 40North Carolina +68% 12 +240% 16North Dakota +15% 50 +154% 44Ohio +24% 45 +144% 46Oklahoma +36% 32 +141% 48Oregon +55% 19 +198% 26Pennsylvania +17% 49 +128% 49Rhode Island +18% 48 +157% 42South Carolina +82% 7 +244% 14South Dakota +30% 41 +185% 31Tennessee +56% 18 +201% 25Texas +70% 11 +284% 8Utah +83% 5 +313% 5Vermont +57% 16 +247% 13Virginia +72% 10 +286% 7Washington +62% 14 +257% 11West Virginia +24% 45 +103% 50Wisconsin +40% 30 +206% 24Wyoming +53% 21 +227% 19
Note: Data are ranked from highest to lowest value; this does not necessarily correspond to level of performance.
2015 population is historical data; 2030 and 2050 are projections based on a last history year of 2015.
Population and Projections

2018 Across the States A-16
AARP Public Policy Institute August 2018
Percentage of 65+ Population That Is White Non-Hispanic
State2015 2030 2050
Value Rank Value Rank Value RankUnited States 77.8% blank 72.2% blank 61.4% blankAlabama 78.7% 34 74.1% 32 67.8% 30Alaska 74.5% 39 72.5% 36 65.0% 33Arizona 81.0% 31 71.8% 37 57.0% 40Arkansas 86.9% 24 81.5% 26 73.7% 24California 58.6% 49 51.5% 49 38.7% 50Colorado 83.8% 29 79.8% 28 70.6% 27Connecticut 85.2% 28 79.8% 28 66.9% 31Delaware 80.5% 32 74.8% 31 62.7% 36District of Columbia 33.1% 50 30.4% 50 41.0% 48Florida 75.0% 38 67.1% 40 53.6% 43Georgia 72.0% 43 65.5% 44 54.7% 41Hawaii 26.5% 51 27.6% 51 21.4% 51Idaho 93.6% 10 89.4% 13 82.0% 12Illinois 77.3% 35 73.1% 34 62.8% 35Indiana 90.5% 17 87.6% 15 80.6% 14Iowa 96.3% 4 93.3% 5 86.2% 7Kansas 90.2% 18 86.0% 19 77.2% 20Kentucky 92.5% 13 89.6% 12 84.6% 10Louisiana 71.7% 44 68.0% 39 62.4% 37Maine 97.6% 1 96.0% 1 92.7% 1Maryland 67.5% 46 62.7% 46 52.1% 46Massachusetts 87.7% 23 82.7% 24 71.3% 26Michigan 85.6% 27 83.6% 23 77.1% 21Minnesota 94.1% 9 90.1% 10 80.3% 16Mississippi 72.3% 42 67.1% 40 60.5% 39Missouri 89.0% 20 86.2% 17 80.6% 14Montana 94.5% 7 92.4% 7 88.2% 5Nebraska 93.3% 12 89.0% 14 80.0% 17Nevada 72.8% 41 66.1% 43 52.5% 45New Hampshire 96.6% 3 94.8% 3 89.9% 4New Jersey 73.4% 40 67.1% 40 53.7% 42New Mexico 59.3% 48 53.5% 48 41.0% 48New York 70.2% 45 64.1% 45 53.5% 44North Carolina 79.1% 33 73.9% 33 64.5% 34North Dakota 95.9% 5 93.3% 5 87.8% 6Ohio 88.3% 22 86.2% 17 81.1% 13Oklahoma 83.7% 30 78.9% 30 69.8% 28Oregon 91.4% 15 86.5% 16 76.4% 22Pennsylvania 88.7% 21 85.7% 20 78.3% 19Rhode Island 89.9% 19 84.7% 22 73.2% 25South Carolina 77.0% 36 72.7% 35 65.9% 32South Dakota 94.2% 8 91.5% 8 85.4% 8Tennessee 86.5% 25 81.9% 25 74.9% 23Texas 64.5% 47 57.0% 47 44.4% 47Utah 90.9% 16 85.6% 21 78.6% 18Vermont 97.3% 2 95.9% 2 92.4% 2Virginia 76.9% 37 71.3% 38 61.5% 38Washington 86.1% 26 81.1% 27 69.7% 29West Virginia 95.7% 6 94.4% 4 91.9% 3Wisconsin 93.6% 10 90.8% 9 83.2% 11Wyoming 91.9% 14 90.0% 11 84.7% 9
Note: Data are ranked from highest to lowest value; this does not necessarily correspond to level of performance.
Data are rounded to the nearest whole percent on profile pages, which therefore may not exactly match the values in this table.
Population and Projections

2018 Across the States A-17
AARP Public Policy Institute August 2018
Percentage of 65+ Population That Is Hispanic
State 2015 2030 2050
Value Rank Value Rank Value RankUnited States 7.9% blank 11.1% blank 18.1% blank Alabama 1.0% 44 2.0% 42 4.9% 40Alaska 2.9% 23 3.8% 29 6.1% 35Arizona 12.0% 5 17.7% 5 28.5% 4Arkansas 1.5% 35 3.7% 30 8.6% 28California 19.3% 3 25.8% 3 36.6% 3Colorado 10.1% 8 12.7% 9 19.4% 9Connecticut 5.4% 11 8.6% 12 16.0% 11Delaware 2.3% 29 4.4% 27 10.6% 23District of Columbia 5.1% 13 8.1% 13 12.1% 15Florida 14.3% 4 18.0% 4 26.6% 5Georgia 2.6% 25 5.1% 23 11.2% 20Hawaii 3.1% 20 4.9% 24 8.1% 29Idaho 3.6% 17 6.2% 16 11.6% 16Illinois 6.4% 10 9.7% 10 17.4% 10Indiana 2.0% 30 3.3% 33 7.1% 30Iowa 1.3% 37 2.6% 36 5.8% 37Kansas 3.4% 18 5.6% 19 11.3% 17Kentucky 0.9% 47 1.8% 45 4.3% 42Louisiana 2.5% 27 3.4% 32 6.1% 35Maine 0.5% 51 1.0% 50 2.2% 50Maryland 3.1% 20 5.3% 21 11.1% 21Massachusetts 4.0% 16 6.3% 15 11.3% 17Michigan 1.7% 33 2.6% 36 5.1% 39Minnesota 1.1% 42 2.4% 39 5.8% 37Mississippi 1.0% 44 2.0% 42 4.3% 42Missouri 1.3% 37 2.3% 40 4.9% 40Montana 1.2% 39 2.1% 41 3.9% 45Nebraska 2.6% 25 4.9% 24 10.4% 24Nevada 10.4% 7 15.7% 6 26.5% 6New Hampshire 1.1% 42 1.8% 45 3.8% 46New Jersey 9.5% 9 13.1% 8 20.4% 7New Mexico 32.3% 1 36.2% 1 45.4% 1New York 10.7% 6 13.7% 7 19.6% 8North Carolina 1.9% 32 4.2% 28 10.4% 24North Dakota 0.6% 49 1.4% 48 3.5% 48Ohio 1.2% 39 1.9% 44 3.7% 47Oklahoma 2.5% 27 4.7% 26 9.9% 26Oregon 3.1% 20 5.8% 18 12.4% 14Pennsylvania 2.0% 30 3.5% 31 6.9% 32Rhode Island 4.5% 15 7.7% 14 14.8% 12South Carolina 1.4% 36 3.0% 34 7.1% 30South Dakota 1.0% 44 1.8% 45 4.1% 44Tennessee 1.2% 39 2.5% 38 6.3% 34Texas 22.2% 2 27.2% 2 37.1% 2Utah 5.3% 12 8.7% 11 13.8% 13Vermont 0.7% 48 1.1% 49 2.3% 49Virginia 2.7% 24 5.2% 22 10.8% 22Washington 3.3% 19 5.6% 19 11.3% 17West Virginia 0.6% 49 1.0% 50 2.2% 50Wisconsin 1.6% 34 2.9% 35 6.8% 33Wyoming 4.7% 14 5.9% 17 9.6% 27
Note: Data are ranked from highest to lowest value; this does not necessarily correspond to level of performance.
Data are rounded to the nearest whole percent on profile pages, which therefore may not exactly match the values in this table.
Population and Projections

2018 Across the States A-18
AARP Public Policy Institute August 2018
Percentage of 65+ Population That Is Black Non-Hispanic
State 2015 2030 2050
Value Rank Value Rank Value RankUnited States 8.8% blank 10.0% blank 11.0% blankAlabama 18.4% 7 21.3% 7 23.6% 6Alaska 2.2% 35 2.6% 38 3.0% 39Arizona 2.2% 35 4.1% 30 5.4% 30Arkansas 9.4% 16 11.8% 13 13.1% 14California 5.2% 25 5.6% 27 5.2% 32Colorado 2.7% 32 3.3% 34 3.8% 35Connecticut 6.5% 22 7.5% 22 9.4% 21Delaware 13.9% 10 16.5% 9 19.4% 8District of Columbia 58.3% 1 56.7% 1 38.5% 1Florida 8.2% 19 11.0% 15 13.9% 12Georgia 22.0% 5 24.9% 4 27.2% 3Hawaii 0.6% 43 0.7% 49 1.6% 45Idaho 0.2% 50 0.9% 46 1.4% 49Illinois 11.5% 12 11.7% 14 11.7% 15Indiana 6.0% 24 6.9% 24 8.1% 24Iowa 1.1% 40 2.0% 39 3.4% 37Kansas 3.7% 29 4.6% 29 5.3% 31Kentucky 5.2% 25 6.6% 25 7.5% 25Louisiana 23.6% 3 25.7% 3 27.1% 4Maine 0.4% 47 0.9% 46 1.7% 44Maryland 23.3% 4 24.6% 5 25.7% 5Massachusetts 4.3% 28 5.2% 28 6.7% 27Michigan 10.1% 14 10.3% 17 11.5% 17Minnesota 1.9% 38 3.3% 34 5.9% 28Mississippi 25.3% 2 29.0% 2 32.3% 2Missouri 7.6% 20 8.7% 20 9.8% 20Montana 0.1% 51 0.5% 51 1.2% 51Nebraska 2.4% 33 3.4% 33 4.5% 34Nevada 6.1% 23 7.3% 23 8.4% 23New Hampshire 0.5% 44 0.9% 46 1.5% 47New Jersey 9.9% 15 10.6% 16 11.6% 16New Mexico 1.3% 39 2.0% 39 2.4% 42New York 11.9% 11 12.8% 12 13.9% 12North Carolina 16.2% 8 18.2% 8 19.0% 9North Dakota 0.4% 47 1.2% 42 2.6% 40Ohio 8.7% 18 9.5% 19 10.6% 19Oklahoma 4.7% 27 6.1% 26 6.9% 26Oregon 1.0% 41 1.6% 41 2.1% 43Pennsylvania 7.0% 21 7.8% 21 9.0% 22Rhode Island 3.1% 30 4.1% 30 5.9% 28South Carolina 19.9% 6 21.9% 6 23.2% 7South Dakota 0.5% 44 1.2% 42 2.6% 40Tennessee 10.5% 13 13.0% 11 14.8% 11Texas 8.8% 17 10.3% 17 10.9% 18Utah 0.5% 44 1.2% 42 1.4% 49Vermont 0.3% 49 0.7% 49 1.5% 47Virginia 15.1% 9 16.5% 9 16.4% 10Washington 2.0% 37 3.0% 36 3.8% 35West Virginia 2.3% 34 2.9% 37 3.3% 38Wisconsin 2.9% 31 3.8% 32 5.0% 33Wyoming 0.9% 42 1.2% 42 1.6% 45
Note: Data are ranked from highest to lowest value; this does not necessarily correspond to level of performance.
Data are rounded to the nearest whole percent on profile pages, which therefore may not exactly match the values in this table.
Population and Projections

2018 Across the States A-19
AARP Public Policy Institute August 2018
Percentage of 65+ Population That Is Other Race/Ethnicity
State2015 2030 2050
Value Rank Value Rank Value RankUnited States 5.5% blank 6.7% blank 9.5% blankAlabama 1.9% 38 2.6% 39 3.7% 47Alaska 20.4% 2 21.1% 2 25.9% 2Arizona 4.8% 12 6.4% 12 9.1% 13Arkansas 2.2% 35 3.0% 34 4.6% 38California 16.9% 3 17.1% 3 19.5% 3Colorado 3.4% 20 4.2% 22 6.2% 26Connecticut 2.9% 25 4.1% 24 7.8% 19Delaware 3.2% 23 4.2% 22 7.3% 21District of Columbia 3.5% 19 4.7% 19 8.4% 15Florida 2.5% 31 3.9% 27 5.8% 31Georgia 3.4% 20 4.5% 21 6.9% 22Hawaii 69.8% 1 66.7% 1 68.9% 1Idaho 2.6% 29 3.4% 31 4.9% 34Illinois 4.8% 12 5.4% 17 8.1% 16Indiana 1.6% 45 2.3% 45 4.3% 41Iowa 1.2% 51 2.2% 47 4.6% 38Kansas 2.7% 28 3.8% 28 6.3% 25Kentucky 1.5% 47 2.0% 49 3.5% 48Louisiana 2.3% 34 2.9% 35 4.3% 41Maine 1.5% 47 2.1% 48 3.4% 49Maryland 6.1% 10 7.5% 10 11.1% 11Massachusetts 4.1% 17 5.8% 14 10.7% 12Michigan 2.6% 29 3.6% 30 6.4% 24Minnesota 2.9% 25 4.1% 24 8.0% 17Mississippi 1.4% 49 2.0% 49 2.9% 50Missouri 2.1% 37 2.8% 37 4.8% 36Montana 4.1% 17 5.0% 18 6.7% 23Nebraska 1.7% 43 2.7% 38 5.1% 33Nevada 10.7% 4 10.9% 4 12.6% 8New Hampshire 1.8% 39 2.5% 41 4.8% 36New Jersey 7.2% 7 9.2% 8 14.4% 5New Mexico 7.1% 9 8.3% 9 11.2% 10New York 7.2% 7 9.3% 7 13.1% 7North Carolina 2.8% 27 3.7% 29 6.0% 30North Dakota 3.1% 24 4.1% 24 6.1% 27Ohio 1.8% 39 2.5% 41 4.5% 40Oklahoma 9.1% 5 10.3% 6 13.4% 6Oregon 4.6% 14 6.1% 13 9.1% 13Pennsylvania 2.2% 35 3.1% 33 5.8% 31Rhode Island 2.5% 31 3.4% 31 6.1% 27South Carolina 1.7% 43 2.5% 41 3.8% 46South Dakota 4.3% 16 5.5% 15 8.0% 17Tennessee 1.8% 39 2.5% 41 4.0% 44Texas 4.5% 15 5.5% 15 7.6% 20Utah 3.3% 22 4.6% 20 6.1% 27Vermont 1.6% 45 2.3% 45 3.9% 45Virginia 5.4% 11 7.0% 11 11.3% 9Washington 8.6% 6 10.4% 5 15.2% 4West Virginia 1.4% 49 1.6% 51 2.6% 51Wisconsin 1.8% 39 2.6% 39 4.9% 34Wyoming 2.5% 31 2.9% 35 4.1% 43
Note: Data are ranked from highest to lowest value; this does not necessarily correspond to level of performance.
Data are rounded to the nearest whole percent on profile pages, which therefore may not exactly match the values in this table.
Population and Projections

2018 Across the States A-20
AARP Public Policy Institute August 2018
Population Characteristics
State
People Ages 75+ Living Alone (2016)
People Ages 65+ Living in Nonmetropolitan Areas (2016)
Number (1,000’s) Percent Rank
Number (1,000’s) Percent Rank
United States 6,515 31.6% blank 8,529 17.3% blankAlabama 105 32.8% 26 209 26.7% 24Alaska 7 28.2% 46 28 36.2% 16Arizona 140 28.8% 43 66 5.6% 43Arkansas 67 32.9% 25 218 44.7% 10California 612 27.1% 49 175 3.3% 46Colorado 92 32.3% 28 121 16.3% 34Connecticut 80 31.4% 34 36 6.2% 42Delaware 17 25.9% 50 0 0.0% 48District of Columbia 15 45.4% 1 0 0.0% 48Florida 507 27.9% 47 137 3.4% 45Georgia 152 29.4% 42 302 22.3% 26Hawaii 24 22.7% 51 51 21.0% 30Idaho 31 31.1% 38 76 30.0% 19Illinois 279 34.9% 11 285 15.3% 36Indiana 143 34.4% 13 254 25.6% 25Iowa 85 36.6% 5 250 48.7% 7Kansas 66 34.4% 13 164 37.6% 14Kentucky 95 34.2% 15 316 45.7% 8Louisiana 87 32.0% 32 120 17.8% 32Maine 33 31.4% 34 116 44.9% 9Maryland 109 30.4% 40 34 3.8% 44Massachusetts 157 34.0% 18 19 1.8% 47Michigan 234 34.8% 12 360 22.3% 26Minnesota 131 36.3% 7 247 29.7% 21Mississippi 59 31.7% 33 259 57.5% 4Missouri 140 33.5% 20 291 29.8% 20Montana 26 35.0% 10 125 67.5% 3Nebraska 47 37.3% 4 127 44.3% 11Nevada 46 27.5% 48 54 12.3% 40New Hampshire 32 35.2% 9 98 43.2% 12New Jersey 193 32.3% 28 0 0.0% 48New Mexico 46 32.8% 26 117 34.3% 17New York 450 34.1% 17 255 8.4% 41North Carolina 202 32.2% 30 422 26.9% 23North Dakota 20 38.5% 3 62 56.5% 5Ohio 275 34.2% 15 418 22.1% 28Oklahoma 82 33.0% 22 222 37.5% 15Oregon 91 33.2% 21 145 21.1% 29Pennsylvania 332 33.7% 19 294 13.2% 39Rhode Island 25 33.0% 22 0 0.0% 48South Carolina 98 30.9% 39 145 17.4% 33South Dakota 22 35.4% 8 78 56.3% 6Tennessee 131 31.3% 36 290 27.7% 22Texas 381 28.3% 45 541 16.1% 35Utah 37 28.6% 44 43 13.3% 38Vermont 18 38.8% 2 82 72.7% 1Virginia 154 31.2% 37 223 18.2% 31Washington 140 33.0% 22 154 14.2% 37West Virginia 45 32.1% 31 142 41.2% 13Wisconsin 145 36.5% 6 295 31.8% 18Wyoming 10 29.6% 41 62 70.4% 2
Note: Data are ranked from highest to lowest value; this does not necessarily correspond to level of performance.

2018 Across the States A-21
AARP Public Policy Institute August 2018
State
Below Poverty Level Ages 65+ (2016)
Below 250% of Poverty Level Ages 65+ (2016)
Median Household Income Ages 65+ (2016)
Number (1,000’s) Percent Rank
Number (1,000’s) Percent Rank Value Rank
United States 4,429 9.2% blank 18,097 37% blank $42,113 blankAlabama 76 10.0% 13 328 42% 5 $36,580 46Alaska 3 4.2% 51 18 24% 51 $59,705 2Arizona 104 9.0% 20 423 36% 28 $43,647 16Arkansas 50 10.5% 8 217 45% 3 $34,774 49California 541 10.3% 11 1,937 36% 28 $49,531 7Colorado 55 7.6% 41 230 31% 42 $48,285 11Connecticut 36 6.5% 49 162 28% 48 $51,847 4Delaware 11 6.9% 46 53 32% 39 $47,195 13District of Columbia 10 13.4% 1 27 34% 36 $48,536 10Florida 418 10.4% 10 1,643 40% 9 $40,772 25Georgia 134 10.1% 12 540 40% 9 $40,386 29Hawaii 21 8.9% 21 70 29% 47 $63,229 1Idaho 25 10.0% 13 103 40% 9 $39,338 38Illinois 166 9.2% 17 676 36% 28 $41,253 22Indiana 74 7.7% 40 370 37% 20 $39,568 33Iowa 34 6.9% 46 182 35% 34 $39,433 36Kansas 34 8.0% 35 144 33% 38 $41,015 24Kentucky 74 11.1% 6 294 43% 4 $35,215 48Louisiana 85 13.0% 2 312 46% 1 $33,632 50Maine 23 9.1% 18 102 40% 9 $37,344 45Maryland 70 8.2% 31 247 28% 48 $55,246 3Massachusetts 88 8.5% 28 342 32% 39 $45,893 14Michigan 127 8.1% 33 580 36% 28 $40,765 26Minnesota 58 7.2% 45 265 32% 39 $43,242 17Mississippi 54 12.3% 3 209 46% 1 $33,026 51Missouri 77 8.2% 31 365 37% 20 $39,143 39Montana 16 8.9% 21 70 38% 19 $37,616 43Nebraska 21 7.8% 37 97 34% 36 $40,762 27Nevada 38 8.7% 24 161 37% 20 $43,947 15New Hampshire 10 4.6% 50 64 28% 48 $48,960 9New Jersey 111 8.3% 30 426 31% 42 $49,656 6New Mexico 39 11.5% 4 144 42% 5 $39,454 35New York 335 11.4% 5 1,120 37% 20 $42,434 19North Carolina 143 9.4% 16 623 40% 9 $38,794 41North Dakota 8 7.9% 36 41 37% 20 $41,084 23Ohio 147 8.1% 33 692 37% 20 $39,423 37Oklahoma 49 8.6% 26 238 40% 9 $37,596 44Oregon 51 7.5% 44 251 36% 28 $42,779 18Pennsylvania 168 7.8% 37 828 37% 20 $39,780 32Rhode Island 15 9.1% 18 61 35% 34 $41,388 21South Carolina 70 8.6% 26 324 39% 16 $40,099 30South Dakota 14 10.9% 7 51 37% 20 $39,528 34Tennessee 91 8.9% 21 437 42% 5 $38,150 42Texas 341 10.5% 8 1,299 39% 16 $42,188 20Utah 21 6.7% 48 98 31% 42 $49,308 8Vermont 10 8.7% 24 45 40% 9 $40,565 28Virginia 94 7.8% 37 376 31% 42 $49,755 5Washington 81 7.6% 41 333 31% 42 $48,217 12West Virginia 32 9.5% 15 144 42% 5 $36,208 47Wisconsin 68 7.6% 41 337 36% 28 $38,948 40Wyoming 7 8.5% 28 34 39% 16 $39,806 31
Note: Data are ranked from highest to lowest value; this does not necessarily correspond to level of performance.
Population Characteristics

2018 Across the States A-22
AARP Public Policy Institute August 2018
People with Self-Care Difficulty (2016)
State
Ages 65+ Ages 18–64Number (1,000’s) Percent Rank
Number (1,000’s) Percent Rank
United States 3,900 8.1% blank 3,653 1.9% blankAlabama 74 9.7% 4 69 2.4% 10Alaska 6 8.1% 19 8 1.7% 28Arizona 80 6.9% 37 70 1.7% 28Arkansas 43 9.2% 9 47 2.7% 3California 530 10.1% 2 399 1.6% 35Colorado 37 5.0% 51 45 1.3% 47Connecticut 45 8.0% 22 28 1.3% 47Delaware 13 7.8% 24 12 2.0% 18District of Columbia 7 8.5% 15 7 1.4% 42Florida 290 7.2% 34 226 1.9% 22Georgia 108 8.1% 19 115 1.8% 26Hawaii 21 8.9% 10 10 1.2% 49Idaho 16 6.4% 41 19 2.0% 18Illinois 148 8.2% 18 124 1.6% 35Indiana 73 7.7% 26 85 2.1% 14Iowa 28 5.8% 45 27 1.4% 42Kansas 29 6.9% 37 30 1.7% 28Kentucky 63 9.5% 7 76 2.8% 2Louisiana 63 9.7% 4 72 2.6% 5Maine 14 5.8% 45 16 1.9% 22Maryland 58 6.8% 40 56 1.5% 39Massachusetts 78 7.5% 28 65 1.5% 39Michigan 118 7.5% 28 146 2.4% 10Minnesota 50 6.3% 42 52 1.5% 39Mississippi 50 11.4% 1 48 2.7% 3Missouri 71 7.5% 28 74 2.0% 18Montana 9 5.1% 49 12 2.0% 18Nebraska 16 6.0% 43 14 1.2% 49Nevada 32 7.4% 31 46 2.5% 7New Hampshire 11 5.1% 49 13 1.6% 35New Jersey 112 8.4% 16 79 1.4% 42New Mexico 32 9.6% 6 30 2.5% 7New York 260 8.9% 10 206 1.7% 28North Carolina 121 8.0% 22 131 2.1% 14North Dakota 6 5.5% 48 7 1.4% 42Ohio 147 8.1% 19 146 2.1% 14Oklahoma 50 8.8% 13 56 2.4% 10Oregon 56 8.3% 17 48 1.9% 22Pennsylvania 158 7.4% 31 162 2.1% 14Rhode Island 15 8.9% 10 17 2.6% 5South Carolina 62 7.7% 26 71 2.4% 10South Dakota 8 5.8% 45 7 1.4% 42Tennessee 90 8.8% 13 100 2.5% 7Texas 303 9.3% 8 293 1.7% 28Utah 19 6.0% 43 22 1.2% 49Vermont 8 7.2% 34 8 1.9% 22Virginia 89 7.4% 31 85 1.6% 35Washington 83 7.8% 24 79 1.7% 28West Virginia 33 9.9% 3 33 3.0% 1Wisconsin 62 6.9% 37 62 1.8% 26Wyoming 6 7.1% 36 6 1.7% 28
Note: Data are ranked from highest to lowest value; this does not necessarily correspond to level of performance.
Population Characteristics

2018 Across the States A-23
AARP Public Policy Institute August 2018
People with Cognitive Difficulty (2016)
State
Ages 65+ Ages 18-64Number (1,000’s) Percent Rank
Number (1,000’s) Percent Rank
United States 4,256 8.9% blank 8,932 4.5% blankAlabama 87 11.4% 3 182 6.2% 6Alaska 8 10.4% 8 20 4.3% 32Arizona 90 7.8% 38 181 4.5% 28Arkansas 51 10.8% 7 111 6.3% 3California 539 10.3% 10 868 3.6% 48Colorado 50 6.9% 45 135 3.9% 42Connecticut 45 8.1% 30 87 3.9% 42Delaware 13 8.2% 28 24 4.2% 35District of Columbia 7 9.7% 15 19 4.0% 39Florida 341 8.5% 23 537 4.4% 29Georgia 128 9.6% 16 289 4.6% 24Hawaii 26 11.0% 5 27 3.2% 51Idaho 21 8.3% 26 54 5.5% 15Illinois 150 8.3% 26 274 3.5% 49Indiana 88 9.1% 20 213 5.3% 19Iowa 33 6.7% 47 76 4.1% 38Kansas 32 7.5% 40 79 4.6% 24Kentucky 72 10.9% 6 200 7.5% 2Louisiana 68 10.4% 8 165 5.9% 10Maine 20 8.0% 32 51 6.3% 3Maryland 60 7.1% 42 144 3.9% 42Massachusetts 82 7.9% 35 197 4.6% 24Michigan 136 8.6% 21 346 5.7% 13Minnesota 50 6.2% 50 143 4.2% 35Mississippi 54 12.3% 1 107 6.1% 7Missouri 81 8.6% 21 207 5.7% 13Montana 13 7.1% 42 33 5.2% 20Nebraska 20 7.3% 41 47 4.2% 35Nevada 37 8.5% 23 82 4.6% 24New Hampshire 15 7.1% 42 37 4.4% 29New Jersey 106 8.0% 32 180 3.3% 50New Mexico 37 11.1% 4 71 5.8% 12New York 246 8.4% 25 467 3.8% 46North Carolina 146 9.5% 17 298 4.9% 22North Dakota 7 6.5% 48 19 4.0% 39Ohio 147 8.1% 30 382 5.4% 17Oklahoma 57 10.1% 12 137 5.9% 10Oregon 70 10.3% 10 137 5.5% 15Pennsylvania 170 7.9% 35 418 5.4% 17Rhode Island 13 8.0% 32 40 6.0% 8South Carolina 76 9.4% 18 154 5.2% 20South Dakota 7 5.6% 51 19 3.7% 47Tennessee 103 10.1% 12 240 6.0% 8Texas 322 9.9% 14 657 3.9% 42Utah 26 8.2% 28 76 4.3% 32Vermont 7 6.3% 49 25 6.3% 3Virginia 95 7.9% 35 206 4.0% 39Washington 98 9.2% 19 221 4.9% 22West Virginia 39 11.7% 2 85 7.8% 1Wisconsin 62 6.9% 45 152 4.3% 32Wyoming 7 7.8% 38 15 4.4% 29
Note: Data are ranked from highest to lowest value; this does not necessarily correspond to level of performance.
Population Characteristics

2018 Across the States A-24
AARP Public Policy Institute August 2018
People with Any Disability (2016)
State
Ages 65+ Ages 18-64Number (1,000’s) Percent Rank
Number (1,000’s) Percent Rank
United States 16,855 35.0% blank 20,761 10.6% blankAlabama 310 40.7% 5 421 14.4% 5Alaska 29 39.6% 8 50 11.0% 26Arizona 397 34.3% 29 432 10.7% 29Arkansas 190 40.4% 6 270 15.3% 3California 1,867 35.6% 21 2,024 8.3% 49Colorado 228 31.3% 46 308 8.9% 44Connecticut 176 31.7% 44 192 8.6% 47Delaware 51 31.1% 49 57 9.9% 33District of Columbia 26 34.0% 32 45 9.5% 38Florida 1,330 33.1% 37 1,255 10.3% 31Georgia 486 36.5% 16 698 11.1% 24Hawaii 82 34.3% 29 66 7.9% 50Idaho 91 36.1% 18 116 11.9% 19Illinois 611 33.8% 34 680 8.6% 47Indiana 355 37.1% 14 486 12.1% 16Iowa 157 31.9% 42 175 9.4% 39Kansas 146 34.9% 24 189 11.0% 26Kentucky 281 42.3% 2 440 16.4% 2Louisiana 259 39.5% 9 384 13.7% 8Maine 83 33.4% 36 109 13.5% 9Maryland 266 31.3% 46 335 9.0% 41Massachusetts 331 32.0% 41 391 9.0% 41Michigan 547 34.8% 25 764 12.6% 13Minnesota 251 31.3% 46 302 9.0% 41Mississippi 179 40.9% 4 259 14.7% 4Missouri 344 36.7% 15 468 12.8% 11Montana 62 34.5% 27 76 12.3% 15Nebraska 94 34.5% 27 112 9.9% 33Nevada 154 35.1% 23 199 11.1% 24New Hampshire 68 31.0% 51 88 10.5% 30New Jersey 428 32.1% 40 435 7.9% 50New Mexico 135 40.2% 7 154 12.6% 13New York 967 32.9% 38 1,109 8.9% 44North Carolina 547 35.8% 19 723 11.8% 20North Dakota 36 34.2% 31 43 9.3% 40Ohio 640 35.3% 22 852 12.1% 16Oklahoma 240 42.1% 3 334 14.4% 5Oregon 254 37.4% 13 303 12.1% 16Pennsylvania 741 34.6% 26 910 11.7% 21Rhode Island 53 31.6% 45 77 11.5% 22South Carolina 294 36.2% 17 388 13.2% 10South Dakota 44 33.7% 35 51 10.1% 32Tennessee 389 38.3% 11 559 13.9% 7Texas 1,261 38.7% 10 1,654 9.8% 35Utah 107 34.0% 32 159 8.9% 44Vermont 35 31.1% 49 49 12.7% 12Virginia 392 32.6% 39 497 9.7% 37Washington 378 35.7% 20 495 11.0% 26West Virginia 144 42.9% 1 195 17.8% 1Wisconsin 286 31.8% 43 344 9.8% 35Wyoming 32 37.9% 12 39 11.2% 23
Note: Data are ranked from highest to lowest value; this does not necessarily correspond to level of performance.
Population Characteristics

2018 Across the States A-25
AARP Public Policy Institute August 2018
Private Pay CostsAnnualized Private Pay Cost (2017)
StateNursing Facility, Private Room Nursing Facility, Shared Room Assisted Living
Value Rank Value Rank Value RankUnited States $97,455 blank $87,600 blank $45,000 blankAlabama $77,745 44 $73,000 42 $36,684 45Alaska $292,000 1 $292,000 1 $72,000 3Arizona $91,250 31 $76,650 36 $42,000 32Arkansas $69,350 48 $62,050 47 $36,156 48California $116,435 15 $97,367 20 $51,300 12Colorado $102,565 24 $91,958 24 $46,200 23Connecticut $162,060 2 $150,198 2 $55,200 10Delaware $132,130 6 $127,750 6 $72,180 2District of Columbia *
* 2016 data are used for assisted living costs in the District of Columbia; more recent data were not available.
$127,020 9 $118,443 9 $80,400 1Florida $106,580 21 $94,900 22 $37,200 44Georgia $80,665 40 $74,668 40 $33,600 50Hawaii $158,775 3 $137,240 4 $51,000 13Idaho $94,900 28 $88,695 25 $37,800 42Illinois $78,475 43 $68,255 44 $44,640 27Indiana $93,805 30 $80,300 33 $48,300 19Iowa $74,825 45 $68,894 43 $44,832 26Kansas $74,095 46 $66,613 46 $51,000 13Kentucky $88,330 35 $80,731 32 $41,340 36Louisiana $65,700 49 $62,050 47 $39,516 40Maine $117,165 14 $109,683 13 $58,680 7Maryland $118,990 13 $109,500 14 $49,800 16Massachusetts $149,650 4 $140,525 3 $67,188 5Michigan $103,295 23 $95,630 21 $42,000 32Minnesota $107,675 19 $98,094 19 $43,020 30Mississippi $79,935 41 $77,928 34 $39,984 39Missouri $65,700 49 $58,948 49 $32,400 51Montana $95,630 27 $86,505 27 $43,800 28Nebraska $81,395 39 $76,011 38 $45,420 24Nevada $99,645 25 $87,600 26 $40,800 38New Hampshire $127,020 9 $115,888 11 $58,260 8New Jersey $129,575 8 $120,450 8 $69,732 4New Mexico $89,060 34 $76,194 37 $48,000 20New York $140,525 5 $132,907 5 $47,856 22North Carolina $91,250 31 $82,125 30 $39,000 41North Dakota $130,305 7 $127,630 7 $36,216 47Ohio $91,250 31 $81,578 31 $50,136 15Oklahoma $63,510 51 $53,655 51 $36,396 46Oregon $111,325 18 $105,408 15 $48,840 18Pennsylvania $120,085 12 $111,325 12 $41,400 35Rhode Island $104,025 22 $101,835 18 $61,860 6South Carolina $82,125 37 $77,015 35 $34,380 49South Dakota $81,760 38 $75,599 39 $42,840 31Tennessee $79,205 42 $73,318 41 $43,140 29Texas $72,635 47 $54,750 50 $42,000 32Utah $83,585 36 $67,525 45 $37,800 42Vermont $111,690 17 $105,120 16 $49,524 17Virginia $94,900 28 $85,775 28 $54,096 11Washington $113,515 16 $102,930 17 $55,920 9West Virginia $123,005 11 $116,435 10 $45,000 25Wisconsin $107,310 20 $94,900 22 $48,000 20Wyoming $96,725 26 $84,939 29 $40,980 37
Note: Data are ranked from highest to lowest value; this does not necessarily correspond to level of performance.

2018 Across the States A-26
AARP Public Policy Institute August 2018
State
Annualized Private Pay Cost (2017) Private Long-Term Care Insurance Policies in Effect
(2015)Adult Day ServicesHome Health Aide 30 Hours/Week
Value Rank Value Rank Value Per 1,000 ages 40+ RankUnited States $18,200 blank $33,540 blank 7,543,471 50 blankAlabama $6,760 51 $26,286 50 87,045 37 40Alaska $43,680 1 $43,290 2 8,997 30 49Arizona $21,320 14 $35,100 24 111,582 35 45Arkansas $20,800 15 $28,080 47 45,035 32 48California $20,020 21 $39,000 10 806,828 46 27Colorado $17,940 30 $37,440 15 150,538 61 15Connecticut $20,800 15 $35,880 21 121,340 67 11Delaware $18,980 26 $34,710 27 29,177 62 13District of Columbia *
* 2015 data are used for adult day services costs in the District of Columbia; more recent data were not available.
$25,740 7 $31,200 39 43,720 164 1Florida $16,900 34 $31,200 39 390,232 37 40Georgia $15,600 44 $29,640 44 178,074 39 36Hawaii $18,200 29 $40,560 7 81,571 121 3Idaho $26,260 5 $33,540 30 26,338 35 45Illinois $18,720 27 $35,100 24 352,468 58 17Indiana $22,100 11 $32,698 36 119,575 38 39Iowa $16,380 39 $37,440 15 154,576 104 6Kansas $19,500 22 $32,760 33 115,398 87 7Kentucky $17,680 31 $30,420 43 79,974 37 40Louisiana $16,380 39 $23,790 51 78,223 37 40Maine $28,080 4 $36,660 19 41,992 57 20Maryland $20,280 19 $35,646 23 188,701 65 12Massachusetts $16,900 34 $40,560 7 194,171 58 17Michigan $20,280 19 $33,540 30 191,343 39 36Minnesota $21,580 13 $42,120 3 223,861 86 8Mississippi $11,700 49 $28,080 47 46,980 34 47Missouri $20,800 15 $32,760 33 180,728 62 13Montana $30,940 3 $38,033 14 30,010 58 17Nebraska $19,240 25 $37,440 15 101,819 118 5Nevada $19,500 22 $34,320 28 33,431 25 51New Hampshire $18,720 27 $41,153 6 34,707 49 23New Jersey $23,400 9 $35,880 21 230,084 52 22New Mexico $26,260 5 $32,370 37 44,847 46 27New York $20,800 15 $37,050 18 425,205 45 31North Carolina $13,780 48 $28,860 46 215,583 45 31North Dakota $25,480 8 $43,618 1 39,875 121 3Ohio $14,820 46 $33,056 32 261,659 46 27Oklahoma $15,600 44 $32,760 33 69,261 39 36Oregon $23,140 10 $38,220 13 94,074 48 24Pennsylvania $16,120 41 $34,320 28 289,032 44 33Rhode Island $19,500 22 $39,390 9 21,696 41 35South Carolina $14,300 47 $31,122 42 115,844 48 24South Dakota $17,680 31 $39,000 10 48,774 122 2Tennessee $16,900 34 $29,250 45 151,758 48 24Texas $9,100 50 $31,200 39 491,568 42 34Utah $16,120 41 $35,100 24 40,410 37 40Vermont $34,320 2 $39,000 10 17,536 53 21Virginia $17,680 31 $32,339 38 292,202 74 9Washington $16,900 34 $41,340 5 239,579 71 10West Virginia $16,120 41 $27,300 49 27,712 29 50Wisconsin $16,900 34 $36,660 19 165,968 59 16Wyoming $22,100 11 $42,120 3 12,370 46 27
Note: Data are ranked from highest to lowest value; this does not necessarily correspond to level of performance.
Private Pay Costs

2018 Across the States A-27
AARP Public Policy Institute August 2018
* *
Medicaid Long-Term Services and SupportsMedicaid HCBS Spending as a Percent of LTSS Spending for Older People and
Adults with Physical Disabilities
State2011 2016 Change 2011–2016 (percentage points)
Value Rank Value Rank Value RankUnited States 38% blank 45% blank +7.0% blankAlabama 17% 47 15% 48 -1.9% 44Alaska 60% 4 62% 5 +2.3% 30Arizona 45% 11 44% 17 -0.7% 41Arkansas 32% 24 34% 28 +2.1% 32California 56% 6 57% 8 +1.0% 37Colorado 46% 10 58% 7 +12.4% 5Connecticut 25% 32 40% 20 +14.4% 3Delaware 17% 47 35% 25 +18.4% 1District of Columbia 45% 11 49% 12 +4.2% 24Florida 22% 38 23% 44 +0.7% 39Georgia 29% 28 29% 32 +0.1% 40Hawaii 19% 42 26% 36 +6.9% 14Idaho 47% 9 45% 15 -2.4% 45Illinois 35% 20 46% 14 +10.2% 7Indiana 21% 40 18% 46 -3.5% 47Iowa 26% 31 25% 39 -1.1% 42Kansas 35% 20 39% 21 +3.4% 26Kentucky 19% 42 13% 51 -6.2% 51Louisiana 30% 27 24% 42 -5.9% 50Maine 33% 23 28% 34 -4.5% 48Maryland 23% 35 29% 32 +5.1% 18Massachusetts 45% 11 62% 5 +17.5% 2Michigan 23% 35 31% 29 +7.7% 12Minnesota 65% 1 70% 3 +5.1% 18Mississippi 19% 42 25% 39 +6.4% 15Missouri 38% 18 43% 18 +4.6% 21Montana 37% 19 38% 22 +1.2% 36Nebraska 24% 34 28% 34 +4.3% 23Nevada 35% 20 37% 23 +1.9% 33New Hampshire 19% 42 14% 50 -4.7% 49New Jersey 16% 49 20% 45 +3.9% 25New Mexico 65% 1 73% 1 +8.0% 10New York 43% 14 53% 10 +10.3% 6North Carolina 40% 17 41% 19 +0.9% 38North Dakota 14% 51 15% 48 +1.7% 34Ohio 31% 25 37% 23 +5.9% 16Oklahoma 31% 25 30% 31 -1.1% 42Oregon 57% 5 64% 4 +7.4% 13Pennsylvania 22% 38 35% 25 +13.0% 4Rhode Island 19% 42 24% 42 +5.9% 16South Carolina 28% 30 31% 29 +2.8% 27South Dakota 16% 49 18% 46 +1.6% 35Tennessee 25% 32 35% 25 +9.6% 8Texas 53% 7 56% 9 +2.8% 27Utah 21% 40 25% 39 +4.8% 20Vermont 43% 14 45% 15 +2.3% 30Virginia 41% 16 48% 13 +7.9% 11Washington 62% 3 71% 2 +9.6% 8West Virginia 29% 28 26% 36 -3.2% 46Wisconsin 48% 8 53% 10 +4.5% 22Wyoming 23% 35 26% 36 +2.8% 27
Note: Data are ranked from highest to lowest value; this does not necessarily correspond to level of performance.
* 2014 data used instead of 2016 for AK, CA, ID, KS; base year other than 2011 for 3 states: MA (2010/11 average), NJ (2012), NM (2010).

2018 Across the States A-28
AARP Public Policy Institute August 2018
Medicaid Long-Term Services and Supports
* *State
Medicaid HCBS Spending as a Percent of LTSS Spending: All Populations
(2016 )
Medicaid LTSS Spending for Older People and Adults with Physical Disabilities
(2016 )Value Rank Total (millions) Per Person Rank
United States 57% blank $103,578 $320 blankAlabama 43% 42 $1,118 $230 40Alaska 70% 5 $292 $394 13Arizona 70% 5 $815 $118 50Arkansas 52% 29 $1,068 $357 17California 64% 11 $10,519 $268 29Colorado 66% 9 $1,769 $320 22Connecticut 53% 22 $2,013 $561 4Delaware 48% 34 $405 $425 11District of Columbia 56% 18 $496 $725 2Florida 33% 49 $4,663 $226 41Georgia 47% 38 $1,868 $181 46Hawaii 42% 44 $400 $280 26Idaho 53% 22 $400 $238 37Illinois 49% 32 $2,326 $181 46Indiana 32% 50 $2,811 $424 12Iowa 50% 30 $912 $291 25Kansas 53% 22 $695 $239 36Kentucky 43% 42 $1,100 $248 34Louisiana 35% 48 $1,313 $280 26Maine 54% 21 $427 $321 21Maryland 56% 18 $1,673 $278 28Massachusetts 71% 4 $4,603 $674 3Michigan 40% 46 $2,522 $254 32Minnesota 76% 3 $3,031 $549 5Mississippi 27% 51 $1,016 $340 19Missouri 58% 13 $1,959 $322 20Montana 58% 13 $269 $259 31Nebraska 53% 22 $479 $251 33Nevada 57% 17 $368 $125 49New Hampshire 48% 34 $400 $299 24New Jersey 39% 47 $2,102 $234 38New Mexico 79% 2 $1,031 $494 7New York 63% 12 $17,211 $868 1North Carolina 45% 40 $2,381 $234 38North Dakota 42% 44 $284 $375 15Ohio 53% 22 $4,485 $386 14Oklahoma 47% 38 $796 $203 44Oregon 81% 1 $1,157 $506 6Pennsylvania 48% 34 $6,212 $486 8Rhode Island 55% 20 $483 $457 10South Carolina 49% 32 $882 $178 48South Dakota 48% 34 $174 $202 45Tennessee 53% 22 $1,398 $210 43Texas 58% 13 $6,892 $247 35Utah 53% 22 $262 $86 51Vermont 70% 5 $224 $360 16Virginia 58% 13 $1,880 $223 42Washington 68% 8 $2,198 $302 23West Virginia 45% 40 $862 $471 9Wisconsin 66% 9 $2,026 $351 18Wyoming 50% 30 $154 $263 30
Note: Data are ranked from highest to lowest value; this does not necessarily correspond to level of performance.
* 2014 data used instead of 2016 for Alaska, California, Idaho, and Kansas.

2018 Across the States A-29
AARP Public Policy Institute August 2018
* *State
Medicaid Nursing Facility Spending (2016 )
Medicaid HCBS Spending for Older People and Adults with Physical Disabilities
(2016 )Total (millions) Per Person Rank Total (millions) Per Person Rank
United States $56,729 $175 blank $46,849 $145 blankAlabama $952 $196 22 $166 $34 49Alaska $110 $148 33 $182 $246 7Arizona $455 $66 50 $360 $52 43Arkansas $706 $236 14 $362 $121 20California $4,521 $115 43 $5,998 $153 14Colorado $739 $134 38 $1,030 $186 10Connecticut $1,214 $338 6 $799 $223 8Delaware $262 $275 9 $143 $150 15District of Columbia $253 $369 2 $244 $356 6Florida $3,612 $175 28 $1,050 $51 44Georgia $1,325 $129 41 $543 $53 42Hawaii $296 $207 19 $104 $73 34Idaho $221 $132 39 $178 $106 23Illinois $1,266 $99 47 $1,060 $83 29Indiana $2,313 $349 3 $498 $75 32Iowa $680 $217 16 $232 $74 33Kansas $425 $146 34 $270 $93 26Kentucky $962 $217 16 $139 $31 50Louisiana $999 $213 18 $315 $67 38Maine $308 $231 15 $120 $90 27Maryland $1,196 $199 20 $477 $79 30Massachusetts $1,728 $253 12 $2,874 $421 2Michigan $1,751 $176 27 $771 $78 31Minnesota $914 $165 31 $2,118 $383 4Mississippi $757 $254 11 $259 $87 28Missouri $1,123 $184 25 $837 $137 18Montana $166 $160 32 $103 $99 24Nebraska $344 $180 26 $135 $71 36Nevada $233 $79 49 $135 $46 45New Hampshire $344 $258 10 $56 $42 47New Jersey $1,691 $188 24 $411 $46 45New Mexico $274 $131 40 $757 $363 5New York $8,110 $409 1 $9,101 $459 1North Carolina $1,405 $138 36 $976 $96 25North Dakota $240 $318 7 $43 $57 40Ohio $2,830 $244 13 $1,655 $142 16Oklahoma $556 $142 35 $240 $61 39Oregon $413 $101 46 $744 $405 3Pennsylvania $4,063 $318 7 $2,150 $168 12Rhode Island $365 $345 5 $118 $112 21South Carolina $606 $122 42 $276 $56 41South Dakota $143 $166 30 $32 $37 48Tennessee $915 $138 36 $483 $73 34Texas $3,050 $109 45 $3,842 $138 17Utah $195 $64 51 $67 $22 51Vermont $123 $197 21 $102 $163 13Virginia $969 $115 43 $912 $108 22Washington $633 $87 48 $1,565 $215 9West Virginia $635 $348 4 $226 $124 19Wisconsin $961 $167 29 $1,064 $184 11Wyoming $114 $194 23 $40 $69 37
Note: Data are ranked from highest to lowest value; this does not necessarily correspond to level of performance.
* 2014 data used instead of 2016 for Alaska, California, Idaho, and Kansas.
Medicaid Long-Term Services and Supports

2018 Across the States A-30
AARP Public Policy Institute August 2018
Medicaid Long-Term Services and Supports* *
State
Medicaid LTSS Spending for All Populations (2016 )
Medicaid Institutional Spending for All Populations (2016 )
Total (millions) Per Person Rank Total (millions) Per Person RankUnited States $166,680 $515 blank $72,273 $223 blankAlabama $1,803 $371 38 $1,033 $212 26Alaska $475 $640 16 $144 $194 31Arizona $1,747 $253 49 $517 $75 51Arkansas $2,086 $698 11 $1,000 $335 12California $15,642 $398 33 $5,597 $142 44Colorado $2,341 $423 32 $788 $142 44Connecticut $3,461 $965 4 $1,625 $453 4Delaware $562 $590 17 $293 $308 15District of Columbia $816 $1,192 2 $358 $524 1Florida $6,158 $298 47 $4,097 $198 30Georgia $2,615 $254 48 $1,381 $134 47Hawaii $523 $366 40 $306 $214 24Idaho $582 $347 43 $272 $162 40Illinois $4,202 $327 44 $2,124 $166 38Indiana $3,875 $584 18 $2,638 $398 6Iowa $2,132 $681 12 $1,056 $337 11Kansas $1,087 $374 37 $513 $176 36Kentucky $2,000 $451 30 $1,134 $256 19Louisiana $2,255 $481 26 $1,459 $311 13Maine $1,038 $780 8 $479 $360 8Maryland $3,111 $516 23 $1,362 $226 22Massachusetts $7,043 $1,032 3 $2,076 $304 16Michigan $3,164 $319 46 $1,898 $191 34Minnesota $4,835 $875 5 $1,174 $213 25Mississippi $1,472 $493 24 $1,074 $360 8Missouri $3,511 $576 19 $1,460 $240 21Montana $481 $463 29 $201 $194 31Nebraska $884 $464 28 $418 $219 23Nevada $698 $237 50 $302 $103 49New Hampshire $747 $559 22 $391 $293 17New Jersey $4,214 $469 27 $2,580 $287 18New Mexico $1,412 $677 13 $303 $145 43New York $26,454 $1,334 1 $9,866 $497 2North Carolina $3,681 $362 41 $2,022 $199 28North Dakota $604 $800 7 $352 $466 3Ohio $7,642 $658 15 $3,617 $311 13Oklahoma $1,371 $350 42 $722 $184 35Oregon $2,343 $573 20 $439 $108 48Pennsylvania $9,761 $763 10 $5,051 $395 7Rhode Island $851 $805 6 $381 $360 8South Carolina $1,616 $326 45 $823 $166 38South Dakota $337 $391 34 $177 $205 27Tennessee $2,463 $370 39 $1,148 $173 37Texas $10,795 $387 35 $4,515 $162 40Utah $581 $191 51 $276 $91 50Vermont $417 $669 14 $124 $199 28Virginia $3,185 $379 36 $1,344 $160 42Washington $3,169 $435 31 $1,000 $137 46West Virginia $1,398 $764 9 $774 $423 5Wisconsin $3,290 $570 21 $1,108 $192 33Wyoming $283 $484 25 $142 $243 20
Note: Data are ranked from highest to lowest value; this does not necessarily correspond to level of performance.
* 2014 data used instead of 2016 for Alaska, California, Idaho, and Kansas.

2018 Across the States A-31
AARP Public Policy Institute August 2018
*State
Medicaid HCBS Spending for All Populations (2016 )
State-funded HCBS Expenditures for Older People and Adults with Physical Disabilities
(2014)Total (millions) Per Person Rank Total (millions) Per Person Rank
United States $94,408 $292 blank $1,070.8 $3.36 blankAlabama $770 $158 44 <$0.1 $0.01 38Alaska $331 $446 9 $4.3 $5.82 11Arizona $1,230 $178 38 $0.0 $0.00 39Arkansas $1,086 $364 14 $0.0 $0.00 39California $10,046 $256 26 $0.0 $0.00 39Colorado $1,553 $281 23 $13.0 $2.42 24Connecticut $1,837 $512 6 $50.2 $13.99 3Delaware $269 $282 22 $1.5 $1.60 26District of Columbia $458 $669 3 $17.8 $26.95 1Florida $2,062 $100 50 $69.2 $3.48 19Georgia $1,234 $120 49 $11.2 $1.11 32Hawaii $217 $152 45 $8.0 $5.62 12Idaho $310 $185 36 $3.4 $2.11 25Illinois $2,078 $162 42 $178.5 $13.87 4Indiana $1,237 $187 34 $30.2 $4.58 17Iowa $1,076 $344 16 $8.0 $2.57 22Kansas $575 $198 31 $7.2 $2.47 23Kentucky $866 $195 33 $30.5 $6.91 9Louisiana $796 $170 39 $0.7 $0.14 36Maine $559 $420 11 $15.8 $11.88 5Maryland $1,749 $290 21 $0.0 $0.00 39Massachusetts $4,967 $728 2 $0.0 $0.00 39Michigan $1,267 $128 48 $25.7 $2.59 21Minnesota $3,661 $663 4 $0.0 $0.00 39Mississippi $398 $133 47 $1.0 $0.33 33Missouri $2,051 $337 18 $0.8 $0.13 37Montana $280 $270 24 $0.0 $0.00 39Nebraska $466 $244 27 $22.0 $11.67 6Nevada $395 $135 46 $13.4 $4.72 15New Hampshire $356 $267 25 $0.0 $0.00 39New Jersey $1,634 $182 37 $40.8 $4.57 18New Mexico $1,109 $532 5 $0.0 $0.00 39New York $16,589 $836 1 $108.2 $5.49 13North Carolina $1,659 $163 41 $84.7 $8.53 8North Dakota $252 $334 19 $6.6 $8.94 7Ohio $4,025 $346 15 $15.4 $1.33 30Oklahoma $648 $165 40 $10.6 $2.72 20Oregon $1,903 $466 8 $6.3 $1.58 27Pennsylvania $4,710 $368 13 $223.6 $17.48 2Rhode Island $470 $445 10 $0.0 $0.00 39South Carolina $794 $160 43 $0.0 $0.00 39South Dakota $161 $186 35 $5.6 $6.57 10Tennessee $1,315 $198 31 $8.6 $1.31 31Texas $6,281 $225 29 $5.0 $0.19 35Utah $306 $100 50 $4.0 $1.34 29Vermont $293 $471 7 $0.9 $1.47 28Virginia $1,841 $219 30 $2.0 $0.24 34Washington $2,169 $298 20 $33.3 $4.72 15West Virginia $624 $341 17 $0.0 $0.00 39Wisconsin $2,182 $378 12 $0.0 $0.00 39Wyoming $141 $242 28 $3.1 $5.29 14
Note: Data are ranked from highest to lowest value; this does not necessarily correspond to level of performance.
* 2014 data used instead of 2016 for Alaska, California, Idaho, and Kansas.
Medicaid Long-Term Services and Supports

2018 Across the States A-32
AARP Public Policy Institute August 2018
Medicaid Long-Term Services and Supports*
Percent Change in Medicaid LTSS Spending for Older People and Adults with Physical Disabilities (2011–2016 )
StateAll LTSS Nursing Facilities HCBS
Value Rank Value Rank Value RankUnited States +22% blank +8% blank +45% blankAlabama +3% 47 +6% 35 -9% 48Alaska -3% 50 -8% 49 +1% 45Arizona +3% 47 +4% 38 +1% 45Arkansas +16% 31 +13% 23 +24% 31California +5% 40 +2% 41 +6% 44Colorado +65% 3 +27% 8 +110% 3Connecticut +24% 23 0% 45 +94% 5Delaware +100% 1 +56% 2 +318% 1District of Columbia +4% 42 -4% 47 +13% 39Florida +26% 19 +25% 12 +30% 29Georgia +18% 28 +18% 18 +18% 36Hawaii +41% 8 +29% 7 +91% 6Idaho +5% 40 +10% 29 0% 47Illinois +4% 42 -12% 51 +34% 27Indiana +92% 2 +101% 1 +61% 10Iowa +25% 21 +27% 8 +20% 33Kansas +6% 39 0% 45 +16% 38Kentucky +4% 42 +12% 25 -30% 51Louisiana +10% 36 +20% 16 -11% 49Maine +29% 15 +37% 3 +11% 40Maryland +19% 25 +11% 27 +44% 21Massachusetts +57% 5 +7% 34 +118% 2Michigan +13% 33 +2% 41 +51% 17Minnesota +30% 14 +11% 27 +40% 24Mississippi +9% 37 +1% 44 +46% 20Missouri +37% 12 +27% 8 +53% 16Montana +4% 42 +2% 41 +7% 41Nebraska +19% 25 +12% 25 +40% 24Nevada +40% 9 +36% 4 +48% 19New Hampshire +4% 42 +10% 29 -22% 50New Jersey -3% 50 -7% 48 +21% 32New Mexico +62% 4 +25% 12 +82% 7New York +26% 19 +4% 38 +57% 13North Carolina +17% 30 +16% 20 +20% 33North Dakota +25% 21 +22% 14 +40% 24Ohio +18% 28 +8% 31 +41% 23Oklahoma +11% 35 +13% 23 +7% 41Oregon +48% 6 +22% 14 +67% 9Pennsylvania +29% 15 +8% 31 +106% 4Rhode Island +28% 17 +18% 18 +68% 8South Carolina +19% 25 +14% 22 +31% 28South Dakota +7% 38 +5% 36 +17% 37Tennessee +3% 47 -10% 50 +43% 22Texas +43% 7 +34% 5 +50% 18Utah +28% 17 +20% 16 +57% 13Vermont +13% 33 +8% 31 +19% 35Virginia +33% 13 +16% 20 +60% 12Washington +39% 10 +4% 38 +61% 10West Virginia +20% 24 +26% 11 +7% 41Wisconsin +15% 32 +5% 36 +25% 30Wyoming +39% 10 +34% 5 +55% 15
Note: Data are ranked from highest to lowest value; this does not necessarily correspond to level of performance.
* 2014 data used instead of 2016 for AK, CA, ID, KS; base year other than 2011 for 3 states: MA (2010/11 average), NJ (2012), NM (2010).

2018 Across the States A-33
AARP Public Policy Institute August 2018
Medicaid LTSS Users, Ages 65+ (2013)
StateAll Services Institutional Services Only
Value Per 1,000 Ages 65+ Rank Value Per 1,000 Ages 65+ RankUnited States 2,105,379 47 blank 965,596 22 blankAlabama xx xx xx xx xx xxAlaska 3,940 60 8 473 7 41Arizona xx xx xx 10,091 10 38Arkansas 25,019 55 10 13,166 29 11California 391,178 82 2 82,842 17 30Colorado xx xx xx xx xx xxConnecticut 38,003 70 3 20,932 38 1Delaware xx xx xx xx xx xxDistrict of Columbia xx xx xx xx xx xxFlorida 97,536 27 35 52,325 14 34Georgia 43,883 37 29 25,874 22 23Hawaii xx xx xx 2,883 13 36Idaho xx xx xx xx xx xxIllinois 111,951 64 7 29,944 17 30Indiana 37,966 42 23 28,908 32 7Iowa 25,396 53 12 13,099 27 14Kansas xx xx xx xx xx xxKentucky 23,593 37 29 17,998 28 13Louisiana 31,164 51 14 19,613 32 7Maine xx xx xx xx xx xxMaryland 24,643 31 33 14,702 19 29Massachusetts 87,490 89 1 30,312 31 9Michigan 60,618 41 25 30,500 21 26Minnesota xx xx xx xx xx xxMississippi 27,019 65 5 13,987 34 4Missouri 47,663 53 12 22,709 25 16Montana 5,303 32 32 3,227 20 28Nebraska 11,181 42 23 6,299 24 19Nevada 7,654 20 36 2,474 6 42New Hampshire 8,003 39 27 5,059 25 16New Jersey xx xx xx xx xx xxNew Mexico xx xx xx 4,428 14 34New York 198,935 70 3 107,281 38 1North Carolina 69,499 49 16 29,114 21 26North Dakota 4,765 46 19 3,537 34 4Ohio 97,485 56 9 50,139 29 11Oklahoma 27,750 51 14 13,613 25 16Oregon 26,419 44 21 4,729 8 40Pennsylvania 99,697 48 17 61,903 30 10Rhode Island 10,519 65 5 5,935 36 3South Carolina 22,827 31 33 11,705 16 33South Dakota 5,654 45 20 4,120 33 6Tennessee xx xx xx 22,452 24 19Texas 123,143 41 25 67,498 23 21Utah 5,035 18 37 2,868 10 38Vermont 5,577 54 11 2,251 22 23Virginia 37,151 34 31 18,966 17 30Washington 44,705 47 18 11,321 12 37West Virginia 14,109 44 21 8,299 26 15Wisconsin xx xx xx 19,524 23 21Wyoming 2,987 38 28 1,723 22 23
Note: Data are ranked from highest to lowest value; this does not necessarily correspond to level of performance.
xx Data not reported due to missing or unreliable data in the source.
Medicaid Long-Term Services and Supports

2018 Across the States A-34
AARP Public Policy Institute August 2018
Medicaid Long-Term Services and SupportsMedicaid LTSS Users, Ages 65+ (2013)
StateHCBS Only HCBS and Institutional Services
Value Per 1,000 Ages 65+ Rank Value Per 1,000 Ages 65+ RankUnited States 1,012,505 23 blank 127,278 2.8 blankAlabama xx xx xx xx xx xxAlaska 3,335 51 2 132 2.0 24Arizona xx xx xx xx xx xxArkansas 10,424 23 13 1,429 3.1 13California 287,278 60 1 21,058 4.4 7Colorado xx xx xx xx xx xxConnecticut 13,037 24 12 4,034 7.4 2Delaware xx xx xx xx xx xxDistrict of Columbia xx xx xx xx xx xxFlorida 42,240 12 29 2,971 0.8 36Georgia 16,576 14 25 1,433 1.2 33Hawaii xx xx xx xx xx xxIdaho xx xx xx xx xx xxIllinois 71,939 41 4 10,068 5.8 4Indiana 7,601 8 35 1,457 1.6 28Iowa 10,743 22 16 1,554 3.2 12Kansas xx xx xx xx xx xxKentucky 4,811 8 35 784 1.2 33Louisiana 10,768 18 18 783 1.3 32Maine xx xx xx xx xx xxMaryland 9,039 11 31 902 1.1 35Massachusetts 47,022 48 3 10,156 10.3 1Michigan 26,812 18 18 3,306 2.2 19Minnesota xx xx xx xx xx xxMississippi 12,032 29 7 1,000 2.4 18Missouri 22,369 25 11 2,585 2.9 14Montana 1,763 11 31 313 1.9 25Nebraska 3,985 15 23 897 3.4 11Nevada 4,939 13 27 241 0.6 37New Hampshire 2,488 12 29 456 2.2 19New Jersey xx xx xx xx xx xxNew Mexico xx xx xx xx xx xxNew York 75,285 27 8 16,369 5.8 4North Carolina 36,688 26 9 3,697 2.6 16North Dakota 1,009 10 33 219 2.1 23Ohio 40,134 23 13 7,212 4.1 8Oklahoma 12,218 22 16 1,919 3.5 10Oregon 19,336 32 6 2,354 3.9 9Pennsylvania 33,298 16 21 4,496 2.2 19Rhode Island 3,743 23 13 841 5.2 6South Carolina 9,968 14 25 1,154 1.6 28South Dakota 1,251 10 33 283 2.2 19Tennessee xx xx xx xx xx xxTexas 51,175 17 20 4,470 1.5 30Utah 1,663 6 37 504 1.8 27Vermont 2,677 26 9 649 6.3 3Virginia 16,640 15 23 1,545 1.4 31Washington 30,916 33 5 2,468 2.6 16West Virginia 5,214 16 21 596 1.9 25Wisconsin xx xx xx xx xx xxWyoming 1,038 13 27 226 2.9 14
Note: Data are ranked from highest to lowest value; this does not necessarily correspond to level of performance.
xx Data not reported due to missing or unreliable data in the source.

2018 Across the States A-35
AARP Public Policy Institute August 2018
Medicaid LTSS Users, All Ages (2013)
StateAll Services Institutional Services Only
Value Per 1,000 People Rank Value Per 1,000 People RankUnited States 5,186,077 16.4 blank 1,470,154 4.7 blankAlabama xx xx xx xx xx xxAlaska 11,296 15.3 21 1,785 2.4 39Arizona 60,347 9.1 37 18,544 2.8 36Arkansas 55,175 18.6 13 24,595 8.3 2California 798,485 20.8 7 129,746 3.4 31Colorado xx xx xx xx xx xxConnecticut 76,559 21.3 6 26,978 7.5 5Delaware xx xx xx xx xx xxDistrict of Columbia xx xx xx xx xx xxFlorida 186,607 9.5 36 66,879 3.4 31Georgia 87,803 8.8 39 32,586 3.3 33Hawaii 7,450 5.3 41 3,508 2.5 38Idaho xx xx xx xx xx xxIllinois 250,066 19.4 10 59,557 4.6 19Indiana 78,776 12.0 31 40,891 6.2 14Iowa 64,383 20.8 7 17,232 5.6 16Kansas xx xx xx xx xx xxKentucky 54,369 12.4 29 26,660 6.1 15Louisiana 86,291 18.7 12 41,473 9.0 1Maine xx xx xx xx xx xxMaryland 57,506 9.7 35 21,992 3.7 30Massachusetts 159,658 23.8 3 45,143 6.7 9Michigan 151,167 15.3 21 44,442 4.5 20Minnesota xx xx xx xx xx xxMississippi 52,813 17.7 15 23,090 7.7 4Missouri 122,101 20.2 9 30,918 5.1 17Montana 16,820 16.6 18 4,322 4.3 24Nebraska 23,088 12.4 29 8,478 4.5 20Nevada 23,275 8.4 40 4,795 1.7 42New Hampshire 21,853 16.5 20 5,857 4.4 23New Jersey xx xx xx xx xx xxNew Mexico 34,510 16.6 18 7,821 3.8 29New York 473,376 24.1 2 146,907 7.5 5North Carolina 148,091 15.0 25 40,565 4.1 26North Dakota 12,640 17.5 16 4,594 6.3 12Ohio 199,273 17.2 17 75,942 6.6 11Oklahoma 58,789 15.3 21 24,124 6.3 12Oregon 59,766 15.2 24 7,567 1.9 40Pennsylvania 245,556 19.2 11 99,383 7.8 3Rhode Island 23,483 22.3 5 7,904 7.5 5South Carolina 55,587 11.7 33 15,269 3.2 34South Dakota 12,051 14.3 27 5,692 6.7 9Tennessee 67,712 10.4 34 31,301 4.8 18Texas 312,576 11.8 32 107,292 4.1 26Utah 15,287 5.3 41 5,444 1.9 40Vermont 15,321 24.4 1 2,807 4.5 20Virginia 75,098 9.1 37 26,328 3.2 34Washington 91,902 13.2 28 17,870 2.6 37West Virginia 42,768 23.1 4 13,118 7.1 8Wisconsin 103,099 18.0 14 24,774 4.3 24Wyoming 8,712 15.0 25 2,322 4.0 28
Note: Data are ranked from highest to lowest value; this does not necessarily correspond to level of performance.
xx Data not reported due to missing or unreliable data in the source.
Medicaid Long-Term Services and Supports

2018 Across the States A-36
AARP Public Policy Institute August 2018
Medicaid Long-Term Services and SupportsMedicaid LTSS Users, All Ages (2013)
StateHCBS Only HCBS and Institutional Services
Value Per 1,000 People Rank Value Per 1,000 People RankUnited States 3,493,364 11.1 blank 222,559 0.7 blankAlabama xx xx xx xx xx xxAlaska 9,242 12.5 12 269 0.4 28Arizona 41,758 6.3 32 45 0.0 41Arkansas 28,131 9.5 23 2,449 0.8 11California 634,830 16.6 2 33,909 0.9 10Colorado xx xx xx xx xx xxConnecticut 42,977 12.0 14 6,604 1.8 2Delaware xx xx xx xx xx xxDistrict of Columbia xx xx xx xx xx xxFlorida 115,582 5.9 34 4,146 0.2 38Georgia 52,702 5.3 39 2,515 0.3 34Hawaii 3,837 2.7 42 105 0.1 39Idaho xx xx xx xx xx xxIllinois 175,958 13.7 8 14,551 1.1 6Indiana 34,471 5.2 40 3,414 0.5 26Iowa 44,782 14.5 6 2,369 0.8 11Kansas xx xx xx xx xx xxKentucky 25,969 5.9 34 1,740 0.4 28Louisiana 42,519 9.2 26 2,299 0.5 26Maine xx xx xx xx xx xxMaryland 33,802 5.7 36 1,712 0.3 34Massachusetts 99,662 14.9 4 14,853 2.2 1Michigan 100,394 10.1 21 6,331 0.6 19Minnesota xx xx xx xx xx xxMississippi 27,819 9.3 25 1,904 0.6 19Missouri 86,934 14.4 7 4,249 0.7 15Montana 11,738 11.6 15 760 0.7 15Nebraska 13,395 7.2 30 1,215 0.7 15Nevada 17,684 6.3 32 796 0.3 34New Hampshire 15,232 11.5 16 764 0.6 19New Jersey xx xx xx xx xx xxNew Mexico 26,512 12.7 11 177 0.1 39New York 298,986 15.2 3 27,483 1.4 4North Carolina 101,959 10.4 19 5,567 0.6 19North Dakota 7,623 10.5 18 423 0.6 19Ohio 110,352 9.5 23 12,979 1.1 6Oklahoma 31,723 8.2 27 2,942 0.8 11Oregon 48,456 12.3 13 3,743 1.0 9Pennsylvania 136,477 10.7 17 9,696 0.8 11Rhode Island 14,176 13.5 9 1,403 1.3 5South Carolina 38,176 8.0 28 2,142 0.4 28South Dakota 5,864 6.9 31 495 0.6 19Tennessee 36,279 5.6 37 132 0.0 41Texas 195,570 7.4 29 9,714 0.4 28Utah 8,736 3.0 41 1,107 0.4 28Vermont 11,592 18.5 1 922 1.5 3Virginia 45,758 5.5 38 3,012 0.4 28Washington 70,081 10.1 21 3,951 0.6 19West Virginia 27,682 14.9 4 1,968 1.1 6Wisconsin 76,420 13.3 10 1,905 0.3 34Wyoming 6,008 10.3 20 382 0.7 15
Note: Data are ranked from highest to lowest value; this does not necessarily correspond to level of performance.
xx Data not reported due to missing or unreliable data in the source.

2018 Across the States A-37
AARP Public Policy Institute August 2018
Family Caregivers
State
Number of Family Caregivers (2013)
Economic Value of Family Caregiving in Millions (2013)
Value Per 1,000 People Rank Value Per 1,000 People RankUnited States 40,000,000 127 blank $470,000 $1.49 blankAlabama 761,000 158 2 $7,720 $1.60 10Alaska 84,900 116 38 $1,190 $1.62 8Arizona 804,000 121 32 $9,430 $1.42 34Arkansas 452,000 153 3 $4,710 $1.59 11California 4,450,000 116 38 $57,700 $1.51 22Colorado 584,000 111 44 $7,430 $1.41 36Connecticut 459,000 128 22 $5,930 $1.65 7Delaware 123,000 133 12 $1,580 $1.71 4District of Columbia 75,200 116 38 $870 $1.35 44Florida 2,670,000 136 9 $29,700 $1.52 21Georgia 1,330,000 133 12 $14,000 $1.40 38Hawaii 154,000 110 45 $2,100 $1.50 24Idaho 196,000 122 31 $2,210 $1.37 42Illinois 1,560,000 121 32 $18,500 $1.43 31Indiana 837,000 127 25 $9,480 $1.44 30Iowa 317,000 103 48 $3,860 $1.25 48Kansas 345,000 119 34 $3,850 $1.33 47Kentucky 648,000 147 7 $6,980 $1.59 11Louisiana 660,000 143 8 $6,470 $1.40 38Maine 178,000 134 11 $2,220 $1.67 6Maryland 771,000 130 18 $9,390 $1.58 14Massachusetts 844,000 126 27 $11,600 $1.73 3Michigan 1,280,000 129 20 $14,500 $1.46 27Minnesota 585,000 108 46 $7,860 $1.45 28Mississippi 501,000 168 1 $5,380 $1.80 1Missouri 792,000 131 15 $8,490 $1.41 36Montana 118,000 116 38 $1,430 $1.40 38Nebraska 195,000 104 47 $2,510 $1.34 45Nevada 348,000 125 29 $4,270 $1.53 19New Hampshire 173,000 131 15 $2,330 $1.77 2New Jersey 1,120,000 126 27 $13,600 $1.53 19New Mexico 277,000 133 12 $3,140 $1.50 24New York 2,580,000 131 15 $31,300 $1.59 11North Carolina 1,280,000 130 18 $13,400 $1.36 43North Dakota 62,100 86 51 $860 $1.19 51Ohio 1,480,000 128 22 $16,500 $1.42 34Oklahoma 524,000 136 9 $6,070 $1.58 14Oregon 469,000 119 34 $5,700 $1.45 28Pennsylvania 1,650,000 129 20 $19,200 $1.50 24Rhode Island 134,000 128 22 $1,780 $1.70 5South Carolina 706,000 148 6 $7,550 $1.58 14South Dakota 84,600 100 50 $1,030 $1.22 50Tennessee 981,000 151 5 $10,300 $1.58 14Texas 3,350,000 127 25 $35,500 $1.34 45Utah 336,000 116 38 $4,150 $1.43 31Vermont 74,900 119 34 $1,010 $1.61 9Virginia 1,030,000 125 29 $11,800 $1.43 31Washington 828,000 119 34 $10,700 $1.54 18West Virginia 282,000 152 4 $2,790 $1.51 22Wisconsin 578,000 101 49 $7,070 $1.23 49Wyoming 66,200 114 43 $817 $1.40 38
Note: Data are ranked from highest to lowest value; this does not necessarily correspond to level of performance.

2018 Across the States A-38
AARP Public Policy Institute August 2018
Family Caregivers
State
Economic Value of Family Caregiving per Hour (2013)
Ratio of Economic Value of Family Caregiving to Medicaid HCBS Spending
(2013*)Value Rank Value Rank
United States $12.51 blank 6.2 blankAlabama $10.89 49 10.9 9Alaska $15.05 1 3.2 48Arizona $12.60 28 8.8 14Arkansas $11.20 48 5.3 35California $13.94 9 5.9 32Colorado $13.68 14 7.6 21Connecticut $13.87 10 4.2 42Delaware $13.86 11 8.1 18District of Columbia $12.44 31 1.8 51Florida $11.93 39 16.2 3Georgia $11.29 45 11.7 7Hawaii $14.59 4 11.1 8Idaho $12.06 36 7.7 20Illinois $12.77 27 8.8 14Indiana $12.17 35 10 13Iowa $13.08 22 4.1 44Kansas $12.01 37 6.2 28Kentucky $11.57 40 10.7 11Louisiana $10.53 51 6.8 24Maine $13.41 15 4.6 37Maryland $13.09 21 6.4 27Massachusetts $14.75 3 4.5 38Michigan $12.21 33 14 4Minnesota $14.45 6 2.7 49Mississippi $11.53 41 12.8 6Missouri $11.52 42 5.3 35Montana $12.97 26 6 31Nebraska $13.81 13 6.8 24Nevada $13.19 18 17.2 2New Hampshire $14.42 7 6.1 29New Jersey $13.07 23 10.8 10New Mexico $12.19 34 4.5 38New York $13.02 25 2.5 50North Carolina $11.27 46 6.9 23North Dakota $14.88 2 4.4 41Ohio $11.95 38 5.7 33Oklahoma $12.45 30 10.5 12Oregon $13.06 24 4.5 38Pennsylvania $12.47 29 5.5 34Rhode Island $14.26 8 3.7 46South Carolina $11.49 43 13.7 5South Dakota $13.12 20 7.3 22Tennessee $11.24 47 8.5 16Texas $11.39 44 8 19Utah $13.26 17 17.3 1Vermont $14.55 5 4 45Virginia $12.36 32 8.3 17Washington $13.83 12 6.6 26West Virginia $10.62 50 4.2 42Wisconsin $13.15 19 3.5 47Wyoming $13.27 16 6.1 29
Note: Data are ranked from highest to lowest value; this does not necessarily correspond to level of performance.
* 2014 Medicaid data are used for New Mexico because of incomplete 2013 data.

2018 Across the States A-39
AARP Public Policy Institute August 2018
Caregiver Support Ratio (number of people ages 45–64 per person ages 80+)
State2015 2050 projected
Value Rank Value RankUnited States 7.0 blank 2.9 blankAlabama 7.2 19 3.6 3Alaska 14.6 1 3.0 19Arizona 6.2 42 2.2 50Arkansas 6.6 32 3.2 12California 7.4 16 3.0 19Colorado 8.6 5 2.8 28Connecticut 6.4 40 2.8 28Delaware 6.8 27 2.6 40District of Columbia 7.2 19 4.3 1Florida 5.2 51 2.2 50Georgia 9.3 2 3.1 16Hawaii 5.3 50 2.3 49Idaho 7.2 19 2.6 40Illinois 7.0 23 3.2 12Indiana 7.1 22 3.3 8Iowa 5.6 47 2.9 23Kansas 6.1 43 2.8 28Kentucky 7.6 10 3.7 2Louisiana 7.8 8 3.6 3Maine 6.4 40 2.6 40Maryland 7.8 8 2.7 37Massachusetts 6.5 36 3.0 19Michigan 6.9 24 3.1 16Minnesota 6.7 30 2.7 37Mississippi 7.4 16 3.4 5Missouri 6.5 36 2.9 23Montana 6.5 36 2.6 40Nebraska 6.0 44 2.8 28Nevada 8.8 3 2.4 47New Hampshire 7.4 16 2.6 40New Jersey 6.9 24 2.9 23New Mexico 6.8 27 2.8 28New York 6.6 32 3.4 5North Carolina 7.5 14 2.8 28North Dakota 5.6 47 2.8 28Ohio 6.6 32 3.2 12Oklahoma 6.8 27 3.3 8Oregon 6.7 30 2.9 23Pennsylvania 5.8 46 3.0 19Rhode Island 5.9 45 2.8 28South Carolina 7.6 10 2.9 23South Dakota 5.6 47 2.5 46Tennessee 7.5 14 3.3 8Texas 8.7 4 3.2 12Utah 8.1 6 3.3 8Vermont 6.9 24 2.4 47Virginia 8.0 7 2.6 40Washington 7.6 10 3.1 16West Virginia 6.5 36 3.4 5Wisconsin 6.6 32 2.7 37Wyoming 7.6 10 2.8 28
Note: Data are ranked from highest to lowest value; this does not necessarily correspond to level of performance.
Family Caregivers
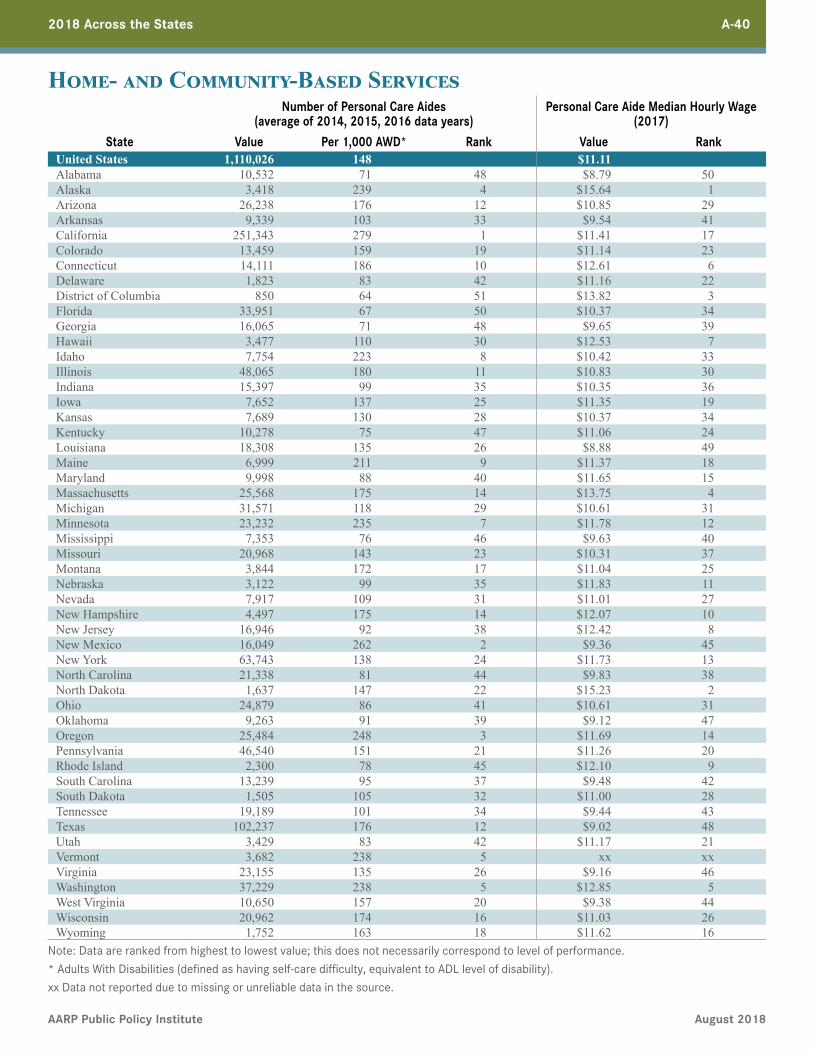
2018 Across the States A-40
August 2018
*
Home- and Community-Based Services
State
Number of Personal Care Aides (average of 2014, 2015, 2016 data years)
Personal Care Aide Median Hourly Wage (2017)
Value Per 1,000 AWD Rank Value RankUnited States 1,110,026 148 blank $11.11 blankAlabama 10,532 71 48 $8.79 50Alaska 3,418 239 4 $15.64 1Arizona 26,238 176 12 $10.85 29Arkansas 9,339 103 33 $9.54 41California 251,343 279 1 $11.41 17Colorado 13,459 159 19 $11.14 23Connecticut 14,111 186 10 $12.61 6Delaware 1,823 83 42 $11.16 22District of Columbia 850 64 51 $13.82 3Florida 33,951 67 50 $10.37 34Georgia 16,065 71 48 $9.65 39Hawaii 3,477 110 30 $12.53 7Idaho 7,754 223 8 $10.42 33Illinois 48,065 180 11 $10.83 30Indiana 15,397 99 35 $10.35 36Iowa 7,652 137 25 $11.35 19Kansas 7,689 130 28 $10.37 34Kentucky 10,278 75 47 $11.06 24Louisiana 18,308 135 26 $8.88 49Maine 6,999 211 9 $11.37 18Maryland 9,998 88 40 $11.65 15Massachusetts 25,568 175 14 $13.75 4Michigan 31,571 118 29 $10.61 31Minnesota 23,232 235 7 $11.78 12Mississippi 7,353 76 46 $9.63 40Missouri 20,968 143 23 $10.31 37Montana 3,844 172 17 $11.04 25Nebraska 3,122 99 35 $11.83 11Nevada 7,917 109 31 $11.01 27New Hampshire 4,497 175 14 $12.07 10New Jersey 16,946 92 38 $12.42 8New Mexico 16,049 262 2 $9.36 45New York 63,743 138 24 $11.73 13North Carolina 21,338 81 44 $9.83 38North Dakota 1,637 147 22 $15.23 2Ohio 24,879 86 41 $10.61 31Oklahoma 9,263 91 39 $9.12 47Oregon 25,484 248 3 $11.69 14Pennsylvania 46,540 151 21 $11.26 20Rhode Island 2,300 78 45 $12.10 9South Carolina 13,239 95 37 $9.48 42South Dakota 1,505 105 32 $11.00 28Tennessee 19,189 101 34 $9.44 43Texas 102,237 176 12 $9.02 48Utah 3,429 83 42 $11.17 21Vermont 3,682 238 5 xx xxVirginia 23,155 135 26 $9.16 46Washington 37,229 238 5 $12.85 5West Virginia 10,650 157 20 $9.38 44Wisconsin 20,962 174 16 $11.03 26Wyoming 1,752 163 18 $11.62 16
Note: Data are ranked from highest to lowest value; this does not necessarily correspond to level of performance.
* Adults With Disabilities (defined as having self-care difficulty, equivalent to ADL level of disability).
xx Data not reported due to missing or unreliable data in the source.
AARP Public Policy Institute

2018 Across the States A-41
August 2018
Home- and Community-Based Services
*State
Number of Home Health Aides (average of 2014, 2015, 2016 data years)
Home Health Aide Median Hourly Wage (2017)
Value Per 1,000 AWD Rank Value RankUnited States 778,457 104 blank $11.16 blankAlabama 7,470 51 42 $9.36 49Alaska 481 34 50 $16.49 1Arizona 6,579 44 46 $10.99 33Arkansas 6,899 76 31 $9.91 46California 41,007 46 44 $13.06 11Colorado 8,734 103 18 $11.90 19Connecticut 11,402 150 2 $12.70 13Delaware 2,146 97 20 $13.50 5District of Columbia 1,777 133 7 $13.60 4Florida 43,570 86 25 $10.97 34Georgia 13,868 62 38 $10.70 38Hawaii 1,961 62 38 $12.59 15Idaho 4,336 126 9 $10.75 37Illinois 24,768 93 21 $11.19 29Indiana 12,514 81 26 $11.04 31Iowa 4,102 73 33 $13.06 11Kansas 6,912 115 14 $11.57 23Kentucky 4,775 35 49 $11.21 28Louisiana 12,714 93 21 $9.22 50Maine 2,527 78 28 $11.98 18Maryland 9,000 80 27 $11.99 17Massachusetts 20,301 138 6 $14.30 3Michigan 24,833 93 21 $10.57 40Minnesota 10,511 106 17 $13.31 9Mississippi 5,090 52 41 $10.53 41Missouri 18,561 127 8 $10.78 36Montana 1,410 63 36 $11.72 22Nebraska 2,124 68 35 $10.81 35Nevada 2,680 37 47 $11.79 20New Hampshire 3,649 141 4 $13.38 8New Jersey 22,596 123 11 $11.11 30New Mexico 7,239 119 12 $10.61 39New York 156,555 340 1 $11.37 27North Carolina 28,779 109 16 $9.48 48North Dakota 409 37 47 $16.40 2Ohio 41,897 145 3 $10.33 44Oklahoma 7,971 78 28 $11.00 32Oregon 4,701 46 44 $11.43 26Pennsylvania 36,439 119 12 $11.75 21Rhode Island 2,972 103 18 $12.43 16South Carolina 9,656 69 34 $10.06 45South Dakota 242 17 51 $13.14 10Tennessee 9,717 51 42 $10.37 43Texas 82,024 141 4 $9.05 51Utah 2,506 61 40 $11.51 25Vermont 1,944 125 10 $13.49 6Virginia 19,810 115 14 $10.46 42Washington 9,850 63 36 $12.69 14West Virginia 5,018 74 32 $9.77 47Wisconsin 10,603 88 24 $11.55 24Wyoming 829 78 28 $13.44 7
Note: Data are ranked from highest to lowest value; this does not necessarily correspond to level of performance.
* Adults With Disabilities (defined as having self-care difficulty, equivalent to ADL level of disability).
AARP Public Policy Institute

2018 Across the States A-42
August 2018
People Receiving OAA Congregate Meals (2016)
People Receiving OAA Home Delivered Meals (2016)
State Value Per 1,000 Ages 65+ Rank Value Per 1,000 Ages 65+ RankUnited States 1,561,677 32 blank 857,154 17 blankAlabama 22,331 28 33 18,166 23 18Alaska 7,937 103 5 3,314 43 6Arizona 26,493 23 38 9,679 8 48Arkansas 21,910 45 21 14,294 29 12California 168,086 31 30 55,266 10 45Colorado 17,092 23 38 9,213 12 38Connecticut 16,674 29 31 6,227 11 43Delaware 9,810 59 14 3,828 23 18District of Columbia 5,503 70 8 3,230 41 7Florida 30,438 7 51 37,526 9 47Georgia 23,475 17 43 20,149 15 33Hawaii 3,202 13 46 3,140 13 37Idaho 13,690 54 16 4,012 16 31Illinois 87,404 47 19 31,364 17 30Indiana 15,607 16 44 7,855 8 48Iowa 22,205 43 22 11,470 22 21Kansas 23,684 54 16 11,498 26 15Kentucky 14,793 21 40 8,311 12 38Louisiana 17,478 26 35 19,288 29 12Maine 11,019 43 22 4,685 18 29Maryland 30,815 35 27 6,341 7 51Massachusetts 27,868 26 35 48,728 45 5Michigan 52,466 33 29 55,450 34 10Minnesota 38,503 46 20 10,274 12 38Mississippi 4,497 10 48 9,317 21 22Missouri 64,043 65 10 34,360 35 9Montana 19,545 106 4 7,110 38 8Nebraska 18,686 65 10 7,459 26 15Nevada 17,567 40 26 8,522 19 27New Hampshire 17,956 79 7 13,140 58 1New Jersey 27,123 20 41 20,357 15 33New Mexico 31,030 91 6 10,349 30 11New York 184,098 61 12 64,460 21 22North Carolina 23,526 15 45 18,185 12 38North Dakota 13,946 127 2 5,016 46 4Ohio 46,091 24 37 38,415 20 24Oklahoma 17,130 29 31 9,333 16 31Oregon 28,060 41 24 13,733 20 24Pennsylvania 63,314 28 33 32,005 14 35Rhode Island 5,867 34 28 2,100 12 38South Carolina 8,329 10 48 11,928 14 35South Dakota 8,369 60 13 2,803 20 24Tennessee 13,556 13 46 8,583 8 48Texas 66,777 20 41 63,872 19 27Utah 22,305 69 9 9,391 29 12Vermont 13,451 119 3 5,616 50 3Virginia 11,899 10 48 11,895 10 45Washington 44,588 41 24 11,481 11 43West Virginia 18,869 55 15 8,534 25 17Wisconsin 45,455 49 18 21,060 23 18Wyoming 17,117 195 1 4,822 55 2
Note: Data are ranked from highest to lowest value; this does not necessarily correspond to level of performance.
Home- and Community-Based Services

2018 Across the States A-43
August 2018
Home- and Community-Based Services
*State
Total OAA Meal Expenditures (2016)
Assisted Living and Residential Care Units (2014)
Value Per 1,000 Ages 65+ Rank Value
* Total capacity is rounded to the nearest hundred.
Per 1,000 Ages 75+ RankUnited States $1,532,247 $31 blank 1,000,000 52 blankAlabama $37,001 $47 14 9,700 31 41Alaska $10,479 $136 1 1,800 80 9Arizona $11,707 $10 51 24,900 56 17Arkansas $19,303 $40 20 5,800 29 43California $158,230 $30 28 127,000 59 15Colorado $17,254 $23 37 14,600 54 21Connecticut $15,315 $27 30 xx xx xxDelaware $6,089 $36 21 2,100 33 39District of Columbia $10,162 $129 2 700 21 48Florida $74,125 $18 43 75,100 44 31Georgia $32,491 $24 34 25,200 52 24Hawaii $5,221 $21 39 5,200 52 24Idaho $5,996 $24 34 8,300 88 6Illinois $57,234 $31 27 31,000 39 35Indiana $18,931 $19 40 20,300 50 28Iowa $20,991 $41 18 xx xx xxKansas $18,636 $43 16 12,100 64 12Kentucky $17,742 $26 31 12,500 47 30Louisiana $30,969 $46 15 5,300 20 49Maine $6,154 $24 34 6,500 63 14Maryland $16,635 $19 40 17,500 51 26Massachusetts $67,988 $63 7 13,600 30 42Michigan $51,744 $32 24 36,500 56 17Minnesota $21,697 $26 31 30,600 88 6Mississippi $8,233 $18 43 6,400 36 37Missouri $49,122 $50 13 19,900 49 29Montana $11,634 $63 7 5,900 83 8Nebraska $16,935 $59 11 11,300 90 5Nevada $5,468 $12 50 4,200 28 44New Hampshire $15,168 $67 5 4,800 55 20New Jersey $43,965 $32 24 21,300 36 37New Mexico $23,094 $67 5 4,200 32 40New York $184,281 $61 10 35,500 28 44North Carolina $26,318 $17 46 39,000 65 11North Dakota $8,669 $79 4 5,300 105 2Ohio $60,068 $32 24 42,800 54 21Oklahoma $17,777 $30 28 10,500 44 31Oregon $11,655 $17 46 31,500 121 1Pennsylvania $72,342 $33 23 62,900 64 12Rhode Island $3,855 $22 38 3,900 51 26South Carolina $15,358 $18 43 12,300 42 34South Dakota $8,814 $63 7 4,600 76 10Tennessee $14,631 $14 49 17,400 44 31Texas $83,691 $25 33 48,700 39 35Utah $13,825 $43 16 7,100 58 16Vermont $6,470 $57 12 2,400 54 21Virginia $23,946 $19 40 26,400 56 17Washington $16,670 $15 48 41,500 103 3West Virginia $14,090 $41 18 3,600 26 46Wisconsin $33,379 $36 21 36,100 92 4Wyoming $10,697 $122 3 800 25 47
Note: Data are ranked from highest to lowest value; this does not necessarily correspond to level of performance.

2018 Across the States A-44
AARP Public Policy Institute August 2018
Nursing Facilities
State
Total Nursing Facilities (2016)
Nursing Facility Beds (2016)
Value Per 1,000 Ages 75+ Rank Value Per 1,000 Ages 75+ RankUnited States 15,572 0.76 blank 1,656,232 80 blankAlabama 229 0.72 32 26,724 84 25Alaska 18 0.73 31 693 28 51Arizona 145 0.30 51 16,286 33 50Arkansas 229 1.13 10 24,538 121 8California 1,204 0.53 43 118,703 53 43Colorado 222 0.78 27 20,823 73 32Connecticut 224 0.88 24 27,006 107 14Delaware 45 0.67 35 4,807 72 33District of Columbia 18 0.54 42 2,574 78 29Florida 687 0.38 49 82,893 46 46Georgia 319 0.62 38 35,963 70 35Hawaii 45 0.43 48 4,318 41 48Idaho 78 0.77 28 5,860 58 42Illinois 740 0.93 20 90,537 113 10Indiana 551 1.33 6 53,104 128 2Iowa 438 1.88 1 31,068 133 1Kansas 337 1.76 3 23,862 124 5Kentucky 287 1.03 15 26,737 96 18Louisiana 277 1.02 17 34,204 126 4Maine 101 0.96 18 6,829 65 39Maryland 227 0.63 37 27,884 77 30Massachusetts 409 0.89 23 46,848 102 15Michigan 444 0.66 36 46,874 70 35Minnesota 379 1.05 14 29,222 81 28Mississippi 205 1.11 11 18,359 99 16Missouri 514 1.23 7 53,429 128 2Montana 77 1.03 15 6,569 88 20Nebraska 216 1.70 4 15,697 123 6Nevada 58 0.35 50 6,649 40 49New Hampshire 75 0.82 25 7,471 82 26New Jersey 363 0.61 39 52,462 88 20New Mexico 74 0.53 43 7,143 51 44New York 624 0.47 47 115,154 87 22North Carolina 425 0.68 34 44,512 71 34North Dakota 81 1.59 5 6,178 122 7Ohio 961 1.19 9 90,425 112 12Oklahoma 304 1.22 8 28,235 114 9Oregon 137 0.50 46 11,348 42 47Pennsylvania 702 0.71 33 88,220 89 19Rhode Island 84 1.09 13 8,720 113 10South Carolina 187 0.59 40 19,582 62 41South Dakota 109 1.78 2 6,795 111 13Tennessee 318 0.76 29 36,533 87 22Texas 1,216 0.90 21 133,048 99 16Utah 97 0.75 30 8,363 64 40Vermont 37 0.82 25 3,174 70 35Virginia 287 0.58 41 32,416 66 38Washington 221 0.52 45 21,090 50 45West Virginia 126 0.90 21 10,824 77 30Wisconsin 383 0.96 18 32,522 82 26Wyoming 38 1.10 12 2,957 86 24
Note: Data are ranked from highest to lowest value; this does not necessarily correspond to level of performance.

2018 Across the States A-45
AARP Public Policy Institute August 2018
Nursing Facilities
State
Nursing Facility Residents (2016)
Nursing Facility Occupancy Rate (2016)
Value Per 1,000 Ages 75+ Rank Value RankUnited States 1,340,485 65 blank 81% blankAlabama 22,528 70 23 84% 23Alaska 584 24 50 84% 23Arizona 11,391 23 51 70% 45Arkansas 17,661 87 12 72% 43California 101,623 45 41 86% 15Colorado 16,309 57 37 78% 33Connecticut 22,937 91 10 85% 18Delaware 4,201 63 31 87% 12District of Columbia 2,388 72 22 93% 1Florida 72,568 40 44 88% 8Georgia 29,914 58 32 83% 25Hawaii 3,649 35 47 85% 18Idaho 3,907 39 45 67% 47Illinois 68,119 85 15 75% 38Indiana 38,977 94 6 73% 42Iowa 23,962 103 2 77% 35Kansas 17,642 92 8 74% 41Kentucky 23,133 83 16 87% 12Louisiana 26,438 97 5 77% 35Maine 6,071 58 32 89% 6Maryland 24,525 68 27 88% 8Massachusetts 40,003 87 12 85% 18Michigan 38,781 58 32 83% 25Minnesota 25,146 70 23 86% 15Mississippi 16,053 87 12 87% 12Missouri 38,222 91 10 72% 43Montana 4,342 58 32 66% 48Nebraska 11,728 92 8 75% 38Nevada 5,057 31 48 76% 37New Hampshire 6,664 73 21 89% 6New Jersey 44,422 75 20 85% 18New Mexico 5,726 41 42 80% 31New York 104,149 79 17 90% 3North Carolina 36,601 58 32 82% 28North Dakota 5,545 109 1 90% 3Ohio 74,925 93 7 83% 25Oklahoma 18,758 76 19 66% 48Oregon 7,416 27 49 65% 50Pennsylvania 77,957 79 17 88% 8Rhode Island 7,888 102 3 90% 3South Carolina 16,809 53 40 86% 15South Dakota 6,169 101 4 91% 2Tennessee 27,429 66 29 75% 38Texas 92,608 69 25 70% 45Utah 5,377 41 42 64% 51Vermont 2,597 57 37 82% 28Virginia 27,686 56 39 85% 18Washington 16,583 39 45 79% 32West Virginia 9,509 68 27 88% 8Wisconsin 25,415 64 30 78% 33Wyoming 2,393 69 25 81% 30
Note: Data are ranked from highest to lowest value; this does not necessarily correspond to level of performance.

2018 Across the States A-46
AARP Public Policy Institute August 2018
State
Percent Change in Nursing Facility Residents
(2011*–2016)
Direct Care Nursing Hours per Resident Day
(2016)RN Hours per Resident Day
(2016)Value Rank Value Rank Value Rank
United States -3.9% blank 4.03 blank 0.79 blankAlabama -1.1% 12 4.26 15 0.71 43Alaska -2.7% 22 5.75 1 1.40 1Arizona -1.6% 16 4.45 9 0.96 13Arkansas -6.5% 39 4.30 11 0.55 48California -1.6% 16 4.31 10 0.75 37Colorado 0.6% 4 4.20 17 1.06 5Connecticut -10.2% 47 4.09 23 0.90 17Delaware -1.5% 15 4.25 16 1.03 9District of Columbia -8.8% 45 4.68 3 1.19 4Florida -0.3% 6 4.54 4 0.78 34Georgia -12.5% 49 3.67 49 0.53 49Hawaii -7.2% 42 4.27 14 1.24 3Idaho -7.0% 40 4.52 7 1.06 5Illinois -9.0% 46 3.66 50 0.87 20Indiana -1.3% 13 4.00 30 0.87 20Iowa -6.4% 37 3.79 44 0.76 35Kansas -7.8% 44 4.08 25 0.79 32Kentucky -0.4% 7 4.10 21 0.87 20Louisiana 1.8% 2 3.77 46 0.52 50Maine -5.8% 33 4.48 8 1.05 8Maryland -0.6% 9 4.06 27 0.86 25Massachusetts -6.4% 37 4.02 29 0.86 25Michigan -2.8% 23 4.13 19 0.84 30Minnesota -11.5% 48 4.09 23 0.87 20Mississippi -2.0% 19 4.07 26 0.72 41Missouri -0.4% 7 3.75 47 0.59 47Montana -7.7% 43 3.96 35 0.92 15Nebraska -6.0% 34 4.00 30 0.75 37Nevada 8.3% 1 4.19 18 0.89 18New Hampshire -4.4% 30 4.05 28 0.89 18New Jersey -2.1% 20 3.99 32 0.96 13New Mexico 1.3% 3 3.46 51 0.74 40New York -3.6% 29 3.87 41 0.68 45North Carolina -2.8% 23 3.94 37 0.70 44North Dakota -3.2% 27 4.53 5 0.87 20Ohio -4.7% 32 3.95 36 0.80 31Oklahoma -6.3% 35 3.86 42 0.48 51Oregon -0.9% 11 4.73 2 0.86 25Pennsylvania -2.8% 23 3.99 32 0.92 15Rhode Island -2.9% 26 3.88 39 0.99 11South Carolina -1.7% 18 4.30 11 0.79 32South Dakota -4.4% 30 3.68 48 0.86 25Tennessee -13.8% 50 3.93 38 0.72 41Texas -1.4% 14 3.77 45 0.60 46Utah -2.2% 21 4.52 6 1.32 2Vermont -7.1% 41 4.10 21 0.85 29Virginia -3.2% 27 3.97 34 0.75 37Washington -6.3% 35 4.28 13 1.02 10West Virginia -0.6% 9 3.84 43 0.76 35Wisconsin -14.5% 51 4.12 20 0.98 12Wyoming 0.6% 4 3.88 39 1.06 5
Note: Data are ranked from highest to lowest value; this does not necessarily correspond to level of performance.
* 2010 data used for baseline for West Virginia because of a suspected data anomaly.
Nursing Facilities

2018 Across the States A-47
AARP Public Policy Institute August 2018
Nursing Facilities
State
Number of Nursing Assistants (average of 2014, 2015, 2016 data years)
Nursing Assistant Median Hourly Wage (2017)
Value Per 1,000 Ages 75+ Rank Value RankUnited States 871,179 43 blank $13.23 blankAlabama 14,754 47 25 $10.84 49Alaska 839 36 37 $17.89 1Arizona 8,107 17 50 $14.23 15Arkansas 14,854 74 4 $11.21 48California 51,352 23 48 $14.84 12Colorado 8,606 31 44 $14.95 10Connecticut 13,234 52 21 $15.35 8Delaware 2,121 33 42 $14.01 20District of Columbia 1,158 35 40 $16.01 3Florida 46,940 27 45 $12.07 37Georgia 20,520 41 32 $11.47 45Hawaii 1,863 18 49 $15.67 6Idaho 3,107 32 43 $12.39 33Illinois 38,276 48 24 $12.75 29Indiana 22,409 55 14 $12.21 35Iowa 16,442 71 6 $13.31 25Kansas 12,669 66 8 $11.81 41Kentucky 15,131 55 14 $12.09 36Louisiana 16,548 62 9 $10.18 51Maine 5,500 53 17 $12.90 27Maryland 15,912 45 29 $14.25 14Massachusetts 23,083 51 23 $14.92 11Michigan 31,029 47 25 $13.91 21Minnesota 21,874 62 9 $15.37 7Mississippi 9,679 53 17 $10.50 50Missouri 24,765 60 11 $11.55 44Montana 2,792 38 36 $12.67 30Nebraska 8,989 71 6 $13.00 26Nevada 2,354 15 51 $15.84 4New Hampshire 4,757 53 17 $14.56 13New Jersey 23,500 40 35 $13.73 23New Mexico 3,247 24 47 $12.58 31New York 61,246 47 25 $16.88 2North Carolina 28,983 47 25 $11.67 43North Dakota 4,611 91 1 $15.74 5Ohio 47,364 59 12 $12.54 32Oklahoma 13,347 55 14 $11.44 46Oregon 9,052 34 41 $15.05 9Pennsylvania 52,054 53 17 $14.13 17Rhode Island 5,784 75 3 $14.14 16South Carolina 12,867 42 31 $11.41 47South Dakota 4,768 78 2 $11.99 38Tennessee 16,588 41 32 $11.74 42Texas 53,069 41 32 $11.96 39Utah 3,251 26 46 $12.29 34Vermont 2,571 57 13 $13.91 21Virginia 17,202 36 37 $12.78 28Washington 14,824 36 37 $14.10 18West Virginia 7,257 52 21 $11.92 40Wisconsin 28,430 72 5 $13.64 24Wyoming 1,501 44 30 $14.02 19
Note: Data are ranked from highest to lowest value; this does not necessarily correspond to level of performance.
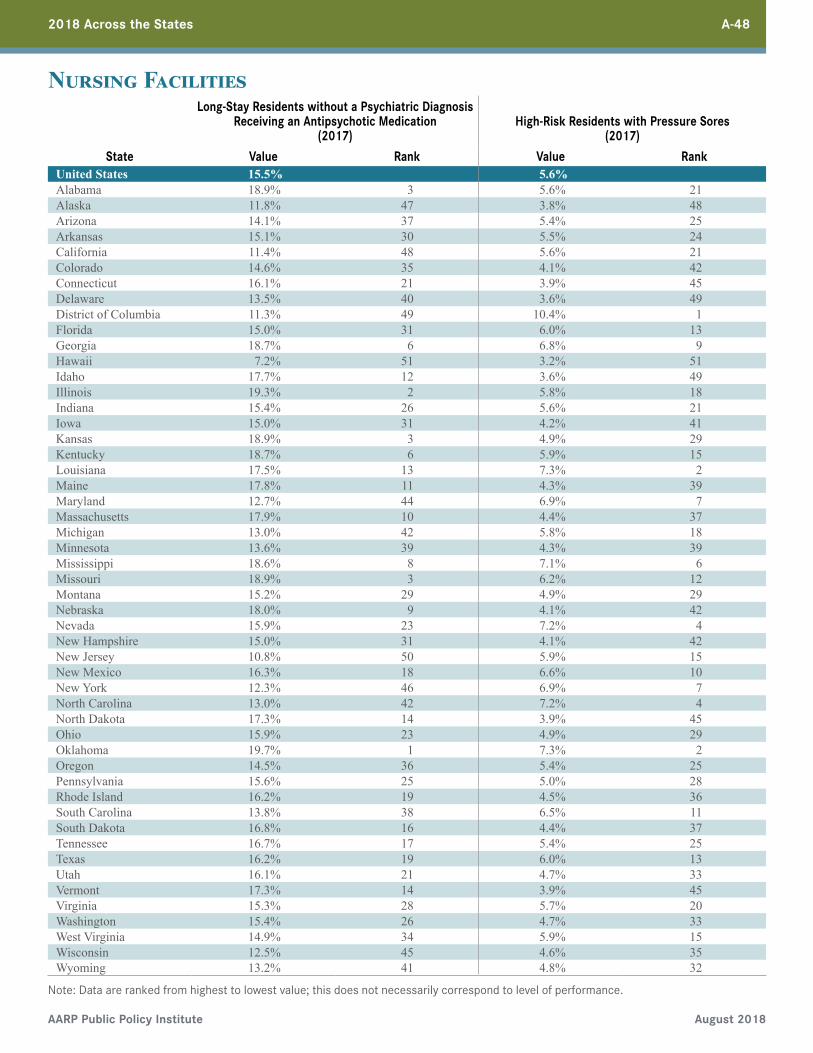
2018 Across the States A-48
AARP Public Policy Institute August 2018
State
Long-Stay Residents without a Psychiatric Diagnosis Receiving an Antipsychotic Medication
(2017)High-Risk Residents with Pressure Sores
(2017)Value Rank Value Rank
United States 15.5% blank 5.6% blankAlabama 18.9% 3 5.6% 21Alaska 11.8% 47 3.8% 48Arizona 14.1% 37 5.4% 25Arkansas 15.1% 30 5.5% 24California 11.4% 48 5.6% 21Colorado 14.6% 35 4.1% 42Connecticut 16.1% 21 3.9% 45Delaware 13.5% 40 3.6% 49District of Columbia 11.3% 49 10.4% 1Florida 15.0% 31 6.0% 13Georgia 18.7% 6 6.8% 9Hawaii 7.2% 51 3.2% 51Idaho 17.7% 12 3.6% 49Illinois 19.3% 2 5.8% 18Indiana 15.4% 26 5.6% 21Iowa 15.0% 31 4.2% 41Kansas 18.9% 3 4.9% 29Kentucky 18.7% 6 5.9% 15Louisiana 17.5% 13 7.3% 2Maine 17.8% 11 4.3% 39Maryland 12.7% 44 6.9% 7Massachusetts 17.9% 10 4.4% 37Michigan 13.0% 42 5.8% 18Minnesota 13.6% 39 4.3% 39Mississippi 18.6% 8 7.1% 6Missouri 18.9% 3 6.2% 12Montana 15.2% 29 4.9% 29Nebraska 18.0% 9 4.1% 42Nevada 15.9% 23 7.2% 4New Hampshire 15.0% 31 4.1% 42New Jersey 10.8% 50 5.9% 15New Mexico 16.3% 18 6.6% 10New York 12.3% 46 6.9% 7North Carolina 13.0% 42 7.2% 4North Dakota 17.3% 14 3.9% 45Ohio 15.9% 23 4.9% 29Oklahoma 19.7% 1 7.3% 2Oregon 14.5% 36 5.4% 25Pennsylvania 15.6% 25 5.0% 28Rhode Island 16.2% 19 4.5% 36South Carolina 13.8% 38 6.5% 11South Dakota 16.8% 16 4.4% 37Tennessee 16.7% 17 5.4% 25Texas 16.2% 19 6.0% 13Utah 16.1% 21 4.7% 33Vermont 17.3% 14 3.9% 45Virginia 15.3% 28 5.7% 20Washington 15.4% 26 4.7% 33West Virginia 14.9% 34 5.9% 15Wisconsin 12.5% 45 4.6% 35Wyoming 13.2% 41 4.8% 32
Note: Data are ranked from highest to lowest value; this does not necessarily correspond to level of performance.
Nursing Facilities

2018 Across the States A-49
AARP Public Policy Institute August 2018
Nursing Facilities
State
Long-Stay Residents with a Hospital Admission (2014)
Nursing Facility Residents with Low Care Needs (2014)
Value Rank Value RankUnited States 17.0% blank 11.5% blankAlabama 19.0% 14 12.7% 20Alaska 11.1% 44 xx xxArizona 8.2% 49 10.9% 28Arkansas 24.3% 3 15.9% 9California 18.5% 17 10.7% 30Colorado 8.5% 48 13.4% 15Connecticut 13.9% 32 13.5% 14Delaware 15.6% 27 13.2% 17District of Columbia 19.4% 10 xx xxFlorida 21.7% 5 8.7% 35Georgia 17.4% 19 10.0% 31Hawaii 5.0% 51 4.3% 48Idaho 12.1% 39 10.8% 29Illinois 19.9% 8 18.0% 5Indiana 17.0% 20 8.1% 39Iowa 15.2% 29 16.8% 6Kansas 19.3% 13 20.1% 3Kentucky 21.0% 7 7.0% 43Louisiana 26.8% 2 16.5% 8Maine 11.9% 41 4.1% 49Maryland 15.9% 25 7.4% 41Massachusetts 12.6% 38 11.0% 27Michigan 16.9% 21 9.8% 32Minnesota 7.0% 50 15.1% 11Mississippi 28.2% 1 13.4% 15Missouri 18.8% 16 23.7% 1Montana 12.0% 40 18.8% 4Nebraska 15.7% 26 14.8% 13Nevada 19.4% 10 9.8% 32New Hampshire 13.7% 33 13.2% 17New Jersey 19.7% 9 11.1% 26New Mexico 15.0% 30 13.0% 19New York 14.1% 31 8.7% 35North Carolina 16.4% 23 6.8% 44North Dakota 13.7% 33 15.0% 12Ohio 13.3% 37 11.2% 25Oklahoma 22.8% 4 22.8% 2Oregon 8.8% 46 8.7% 35Pennsylvania 13.6% 36 7.4% 41Rhode Island 8.6% 47 12.6% 21South Carolina 19.0% 14 5.2% 46South Dakota 15.5% 28 16.8% 6Tennessee 19.4% 10 6.4% 45Texas 21.4% 6 12.1% 23Utah 11.3% 43 5.0% 47Vermont 13.7% 33 7.6% 40Virginia 17.6% 18 9.1% 34Washington 11.1% 44 8.4% 38West Virginia 16.8% 22 12.2% 22Wisconsin 11.7% 42 11.8% 24Wyoming 16.4% 23 15.2% 10
Note: Data are ranked from highest to lowest value; this does not necessarily correspond to level of performance.
xx Data not reported due to missing or unreliable data in the source.

2018 Across the States A-50
AARP Public Policy Institute August 2018
State
Residents with Medicaid as Primary Payer
(2016)
Residents with Medicare as Primary Payer
(2016)
Residents with “Other” as Primary Payer
(2016)Value Rank Value Rank Value Rank
United States 62% blank 14% blank 25% blankAlabama 67% 8 12% 27 21% 36Alaska 82% 1 7% 51 11% 49Arizona 60% 32 15% 15 25% 22Arkansas 66% 9 12% 27 22% 32California 62% 23 14% 19 24% 24Colorado 61% 30 11% 36 28% 14Connecticut 70% 7 12% 27 18% 44Delaware 63% 19 16% 10 21% 36District of Columbia 79% 2 13% 23 8% 51Florida 58% 39 20% 1 23% 26Georgia 72% 6 11% 36 16% 46Hawaii 62% 23 8% 47 29% 10Idaho 64% 16 16% 10 21% 36Illinois 58% 39 14% 19 28% 14Indiana 62% 23 15% 15 23% 26Iowa 46% 51 8% 47 46% 1Kansas 53% 45 11% 36 36% 4Kentucky 66% 9 14% 19 20% 41Louisiana 74% 5 11% 36 15% 47Maine 66% 9 13% 23 21% 36Maryland 62% 23 19% 2 19% 43Massachusetts 63% 19 11% 36 26% 16Michigan 60% 32 17% 6 22% 32Minnesota 53% 45 11% 36 36% 4Mississippi 76% 3 14% 19 10% 50Missouri 65% 13 9% 45 26% 16Montana 59% 37 12% 27 29% 10Nebraska 53% 45 12% 27 35% 6Nevada 56% 43 17% 6 26% 16New Hampshire 63% 19 16% 10 21% 36New Jersey 57% 41 17% 6 26% 16New Mexico 66% 9 11% 36 23% 26New York 63% 19 13% 23 23% 26North Carolina 64% 16 15% 15 20% 41North Dakota 52% 48 8% 47 40% 2Ohio 60% 32 11% 36 29% 10Oklahoma 65% 13 12% 27 22% 32Oregon 57% 41 15% 15 29% 10Pennsylvania 65% 13 10% 44 26% 16Rhode Island 61% 30 8% 47 32% 8South Carolina 62% 23 16% 10 23% 26South Dakota 51% 49 9% 45 40% 2Tennessee 59% 37 17% 6 24% 24Texas 62% 23 13% 23 25% 22Utah 51% 49 18% 3 31% 9Vermont 64% 16 18% 3 18% 44Virginia 60% 32 16% 10 23% 26Washington 60% 32 18% 3 22% 32West Virginia 75% 4 12% 27 13% 48Wisconsin 55% 44 12% 27 33% 7Wyoming 62% 23 12% 27 26% 16
Note: Data are ranked from highest to lowest value; this does not necessarily correspond to level of performance.
Nursing Facilities

About The AARP Public Policy Institute
AARP’s Public Policy Institute informs and stimulates public debate on the issues we face as we age. Through research, analysis, and dialogue with the nation’s leading experts, PPI promotes development of sound, creative policies to address our common need for economic security, health care, and quality of life.
The views expressed herein are for information, debate, and discussion, and do not necessarily represent official policies of AARP.
To learn more about new publications when they become available, visit the AARP’s website and register to receive email alerts.
AARP Public Policy Institute601 E Street, NW
Washington, DC 20049202-434-3890
http://www.aarp.org/ppi

Public Policy Institute601 E Street, NW
Washington, DC 20049202-434-3890aarp.org/ppi