Across-bridgemechanismcanexplainthethixotropic short ...sensorone.com/PDF Word Documents/short_range...
22
Transcript of Across-bridgemechanismcanexplainthethixotropic short ...sensorone.com/PDF Word Documents/short_range...
The precise control of posture and movement imposes severe
constraints on the human neuromuscular system. In
particular, to maintain stability, the motor control system
must continually react to proprioceptive feedback as the
body is perturbed by unpredictable external forces. In this
type of control mechanism there is an inevitable time delay
(due to e.g. nerve conduction and electromechanical
coupling) between the sensing of the perturbation and the
completion of the corrective movement. The delays in the
feedback loop are destabilizing and may result in tremulous
movement (McMahon, 1984). A small resistance to movement
inherent in the muscle fibres themselves would provide
Journal of Physiology (1998), 510.3, pp.941—962 941
A cross-bridge mechanism can explain the thixotropic
short_range elastic component of relaxed frog skeletal muscle
K. S. Campbell and M. Lakie
Applied Physiology Research Group, School of Sport and Exercise Sciences,
University of Birmingham, Birmingham B15 2TT, UK
(Received 25 March 1998; accepted 1 April 1998)
1. The passive tension and sarcomere length of relaxed frog skeletal muscle fibres were
measured in response to imposed length stretches. The tension response to a constant-
velocity stretch exhibited a clear discontinuity. Tension rose more rapidly during the initial
•0·4% LÑ of the stretch than during the latter stages (whereLÑ is the resting length of the
fibre). This initial tension response is attributed to the short-range elastic component (SREC).
2. The use of paired triangular stretches revealed that the maximum tension produced during
the SREC response of the second stretch was significantly reduced by the first stretch. This
history-dependent behaviour of the SREC reflects thixotropic stiffness changes that have
been previously described in relaxed muscle.
3. The biphasic nature of the SREC tension response to movement was most apparent during
the first imposed length change after a period at a fixed length, irrespective of the direction
of movement.
4. If a relaxed muscle was subjected to an imposed triangular length change so that the muscle
was initially stretched and subsequently shortened back to its original fibre length, the resting
tension at the end of the stretch was reduced relative to its initial pre-stretch value. Following
the end of the stretch, tension slowly increased towards its initial value but the tension
recovery was not accompanied by a contemporaneous increase in sarcomere length. This
finding suggests that the resting tension of a relaxed muscle fibre is not entirely due topassive
elasticity. The results are compatible with the suggestion that a portion of the resting tension
— the filamentary resting tension (FRT) — is produced by a low level of active force generation.
5. If a second identical stretch was imposed on the muscle at a time when the resting tension
was reduced by the previous stretch, the maximal tension produced during the second
stretch was the same as that produced during the first, despite the second stretch
commencing from a lower initial resting tension.
6. In experiments using paired triangular length changes, an inter-stretch interval of zero did
not produce a substantially greater thixotropic reduction in the second stretch elastic limit
force than an inter-stretch interval in the range 0·5—1 s.
7. A theoretical model was developed in which the SREC and FRT arise as manifestations of a
small number of slowly cycling cross-bridges linking the actin and myosin filaments of a
relaxed skeletal muscle. The predictions of the model are compatible with many of the
experimental observations. If the SREC and FRT are indeed due to cross-bridge activity, the
model suggests that the cross-bridge attachment rate must increase during interfilamentary
movement. A mechanism (based on misregistration between the actin binding sites and the
myosin cross-bridges) by which this might arise is presented.
7399
Keywords: Muscle mechanics, Muscle stretch

mechanical damping. This would increase postural stability
(Grillner, 1972) without markedly affecting the body’s
ability to produce large rapid movements under voluntary
control.
Even when movements are generated it is often only a
relatively small number of motor units in the agonist
muscles which are activated. Such movements inevitably
stretch the fibres of the antagonist muscle groups and
passively shorten unrecruited fibres in the agonist muscles.
The neuromuscular control system must allow for these
passive mechanical properties if it is to control movements
with precision. A better understanding of the mechanical
properties of inactive muscle would thus be useful in a
holistic description of the neuromuscular control system.
In 1968, D. K. Hill demonstrated that relaxed frog sartorii
exhibited both a small actively generated resting tension —
the filamentary resting tension (FRT) — and a dis-
proportionately high resistance to the initial stages of an
imposed length stretch — the short-range elastic component
(SREC). Further work (e.g. L�annergren, 1971; Herbst,
1976; Lakie & Robson, 1988a,b, 1990; Campbell & Lakie,
1995a, 1996) has shown that both the initial resistance of
the SREC and the tension generated by the FRT depend
crucially on the mechanical history of the muscle. Prior
movements applied to the muscle temporarily reduce its
initial stiffness during a subsequent stretch by as much as
50% (Lakie & Robson, 1988a,b). This behaviour, which
characterizes a mechanical system in which the state depends
on the history of movement, is thixotropic (Buchthal &
Kaiser, 1951; Lakie, Walsh &Wright, 1984).
The precise mechanism underlying the SREC and FRT in
relaxed frog skeletal muscle remains uncertain.Hill believed
that the SREC and FRT were manifestations of a low level
of cross-bridge activity in relaxed skeletal muscle. More
recent work (although not specifically investigating the
SREC and FRT) suggests that many of the mechanical
properties of relaxed muscle may be attributed to either
viscous and visco-elastic behaviour (Bagni, Cecchi, Colomo
& Garzella, 1992, 1995; Mutungi & Ranatunga, 1996a,b) or
to titin filaments (Linke, Bartoo, Ivemeyer & Pollack, 1996;
Bartoo, Linke & Pollack, 1997). This paper describes some
measurements of the SREC and FRT in relaxed frog skeletal
muscle fibres. It also presents a simple theoretical model, the
‘Cross-bridge Population Displacement Mechanism’, which
predicts the mechanical behaviour of a relaxed muscle in
which the actin and myosin filaments are linked by a small
number of slowly cycling cross-bridges. The predictions of
the model are in good qualitative agreement with the
experimental observations. It is undeniable that either
visco-elastic mechanisms or titin filaments may dominate
the mechanical properties of relaxed skeletal muscle under
certain conditions. However, this work does show that the
SREC and FRT are fully compatible with Hill’s original
cross-bridge hypothesis, and moreover, that the hypothesis
provides a succinct explanation for many of the complex
mechanical properties of relaxed skeletal muscle.
METHODSExperimental measurements
Frogs (Rana temporaria and Rana pipiens)were stunned, killed by
decapitation and pithed. Single twitch muscle fibres and small
bundles of muscle fibres (2—6 twitch fibres) were isolated from the
tibialis anterior, iliofibularis and semitendinosus muscles. The fibres
were dissected in a polycarbonate trough containing standard
Ringer solution (mÒ: NaCl, 115; KCl, 2·5; CaClµ, 1·8; NaHµPOÚ,
0·85; NaµHPOÚ, 2·15; pH 7·2). The entire dissecting trough was
then transferred to the experimental apparatus and clamped to a
stainless steel baseplate mounted on a Peltier-effect heat pump. The
Peltier device was regulated by a feedback circuit which controlled
the temperature of the bathing Ringer solution. The hooks of the
force transducer and puller were lowered into the trough and the
fibre connected between these using small clips cut from gold foil
(thickness •25 ìm). The clips crimped tightly around the tendinous
sheets within 0·5 mm of each end of the fibre. The hooks (bent from
stainless steel wire, AISI 316 (Goodfellow, UK), diameter 250 ìm)
were shaped to form a footplate which held the clips horizontal and
helped to prevent the fibre from sagging under its own weight.
A number of different force transducers were used in these
experiments. Each was constructed from an extended silicon beam
sensor element (AE801, SensoNor, Norway) and had a resonant
frequency in the range 400—1000 Hz. Although the resonant
frequency of each modified sensor was not particularly high, the
sensors were more than adequate for the stretch rise times (25 ms to
30 s) used in this work. The advantage of increased sensitivity
obtained by extending the force transducer beam, outweighs the
disadvantage of the accompanying reduction in resonant frequency
for these experiments. The puller was a precision servo-controlled
motor (Model 308B, Cambridge Technology Inc., Cambridge, MA,
USA) with a modified, low inertia arm.
The fibres were illuminated near the force transducer with a 5 mW
HeNe laser (LGK7267, Zeiss). A first-order diffracted beam was
imaged through a cylindrical lens (focal length 0·3 m) onto a linear
position-sensitive detector (SL76-1, United Detector Technology,
Orlando, FL, USA) mounted 1·4 m distant from the fibre. This
allowed measurement of the mean sarcomere length within the
illuminated fibre segment (• 0·7 mm in length).
The puller system was interfaced with a PC (466ÏMX, Dell) through
a combined ADC and DAC device (1401, Cambridge Electronic
Design, UK). Pre-programmed stretches could be applied via the
puller using the DAC module while the resulting force, fibre length
and sarcomere length signals were recorded via the ADC module
and saved to computer files for off-line analysis. A sampling
frequency appropriate to the stretch duration was used, and ranged
between 100 Hz and 10 kHz. The ADC and DAC operations were
controlled by commercially available software (Spike2, Cambridge
Electronic Design).
The experimental results revealed no obvious, consistent differences
between preparations obtained from different muscles. Similar
experimental trends were shown in many experiments on both
single fibres and small bundles of fibres. There is, however,
considerable variation in thepassive stiffness of frog skeletal muscle
e.g. seasonal changes of as much as 50% (Robson, 1990) and,
together with the difficulty of accurately normalizing for fibre cross-
K. S. Campbell and M. Lakie J. Physiol. 510.3942
Administrator
(AE801,

sectional areas, this significantly complicates comparisons between
different fibre preparations. Consequently the data shown in this
paper were derived from individual preparations.
Modelling
A cross-bridge population displacement mechanism. A
theoretical model has been developed in which the SREC and FRT
arise as a manifestation of a small number of slowly cycling cross-
bridges in relaxed muscle fibres. Briefly, the ‘Cross-bridge
Population Displacement Mechanism’ consists of three components:
a cross-bridge component, a parallel elastic component and a series
elastic component. This three-component structure has previously
been used to analyse experimental data (Haugen & Sten-Knudsen,
1981) but the dynamics of the cross-bridge component (and thus the
model’s predictive ability) have been developed during the course of
this work. The two main assumptions underpinning the cross-
bridge mechanism are that the detachment rate constant for an
individual cross-bridge is dependent on the strain in its elastic
linkage and that the attachment rate constant increases with the
speed of interfilamentary movement (an effect which we attribute
to a ‘movement enhancement’ mechanism). Full details of the
Cross-bridge Population Displacement Mechanism are given in the
Appendix to this paper.
The simulation algorithm was translated into source code for the C
programming language and simulations were performed using a
66 MHz 486 PC. Simulating 1 s of the muscle’s response took
approximately 1 min of computation time.
RESULTS
Experimental measurements
Paired stretches. Figure 1 is a typical example of the
tension and sarcomere length responses of a relaxed skeletal
muscle fibre to a pair of identical constant-velocity
triangular stretches. In agreement with previous results (e.g.
Hill, 1968; Bagni et al. 1995) the tension response to the
first stretch consisted of two distinct phases. Initially, the
muscle presented considerable resistance to the imposed
stretch and the tension rose sharply and approximately
proportionately with the applied length change.
As the length stretch continued there was a transient drop
in tension. This drop was small compared with the overall
tension response. The drop (while a common experimental
finding e.g. Hill, 1968; L�annergren, 1971; Herbst, 1976) is
not a feature which can be observed in all fibre preparations.
Even if it is present at short sarcomere lengths it can be
removed by stretching the muscle to a longer initial length
(Haugen & Sten-Knudsen, 1981). It would thus appear to be
critically dependent on the initial tension andÏor length of
the muscle.
Beyond this transient drop the tension continued to rise but
at a slower rate and the tension reached a maximal value at
Tension responses of relaxed skeletal muscleJ. Physiol. 510.3 943
Figure 1. Force and sarcomere length responses to two identical constant-velocity triangular
stretches
Single relaxed semitendinosus muscle fibre. In all figuresLÑ is the fibre length which corresponds to a mean
sarcomere length of 2·2 ìm. Stretch length •0·01LÑ. Stretch velocity •0·01LÑ s¢. Two stretches
separated by 1·0 s. The fibre had been held at a constant length for 1 min before the first stretch was
initiated. Tensions were measured from a baseline (arbitrarily assigned to be zero force) which corresponded
to the mean resting tension in the 0·5 s period preceding the first stretch. Thus measured tension values
could be less than, as well as greater than, the prevailing resting tension. Dashed lines show the tension
baseline and the corresponding initial sarcomere length. The initial phase (SREC) proceeded until an elastic
limit was reached. In the first stretch, this elastic limit occurred at a sarcomere length of 2·180 ìm and a
tension of 2·4 ìN. The corresponding values in the second stretch were 2·180 ìm and 1·2 ìN. Temperature
5·0°C.
Administrator
tension of 2·4 ìN.
Administrator
and 1·2 ìN.
the extreme stretch length. During the shortening phase of
the triangular stretch, the tension fell with a concave profile
and discontinuities in the tension response were much less
pronounced than during the lengthening phase.
Although the fibre was restored to its original length at the
end of the triangular stretch, the resting tension was
reduced below its initial value. Much of this tension deficit
was recovered during the first few hundred milliseconds
after the end of the stretch but it is clear that neither the
resting tension nor the sarcomere length recovered
completely to their initial levels during the 1 s interval
before a second identical stretch was imposed on the muscle.
During the inter-stretch interval, fibre length was fixed,
whereas sarcomere length progressively shortened with an
associated rise in fibre tension. The rise in resting tension
during the inter-stretch interval could only be attributed to
an extension of passive elastic structures if sarcomere length
increased simultaneously. The experimental results show
that during the inter-stretch interval, sarcomere length
shortened slightly, and thus the rise in tension cannot be
attributed to an increased stretch of elastic non-cross-bridge
components within the sarcomere. An increasing tension
accompanied by sarcomeric shortening suggests to us that
the contractile apparatus may be responsible.
In accordance with Hill’s chosen nomenclature (1968) we
refer to the initial phase of the tension response as the
‘short-range elastic component’ (SREC) and the length
increment required to produce the tension transient as the
elastic limit. An additional term, the elastic limit force, is
defined in this work as the tension increment produced by
the SREC phase of the response. The muscle’s resting
tension is considered to include both actively and passively
generated components. Passive resting tension is elastic and
reflects stretch of non-cross-bridge components. The actively
generated portion of the resting tension is known as the
filamentary resting tension (FRT). The tension in a relaxed
muscle at any instant is thus the sum of the stress in the
parallel elastic component and the force due to the attached
cross-bridges. At physiological sarcomere lengths, the
precise magnitudes of these components are difficult to
determine but they are unlikely to be zero. As A. V. Hill
(1952) pointed out, ‘the tension of a resting muscle
diminishes continually with decreasing length; there is no
sharp end point and it is impossible to define a length at
which the tension becomes zero.’
The SREC stiffness was calculated as a Young’s Modulus
from the increase in stress produced by the relative fibre
length change during the initial linear phase of the response.
The mean SREC stiffness calculated in these experiments
was 1·98 ² 10Ç N m−2
(s.e.m. ±0·44 ² 10Ç N m−2
, n = 16
preparations, stretch velocity •0·01LÑ s¢, where LÑ is the
fibre length which corresponds to a mean sarcomere length
of 2·2 ìm, minimum pre-stretch interval 60 s, temperature
5—7°C). This is in excellent agreement with other published
values e.g. Hill (1968: frog sartorius, 1·3 ² 10Ç N m¦Â, 20°C),
L�annergren (1971: frog iliofibularis, 2·3 ² 10Ç N m−2
, 20—
24°C), Halpern & Moss (1976: frog semitendinosus,
K. S. Campbell and M. Lakie J. Physiol. 510.3944
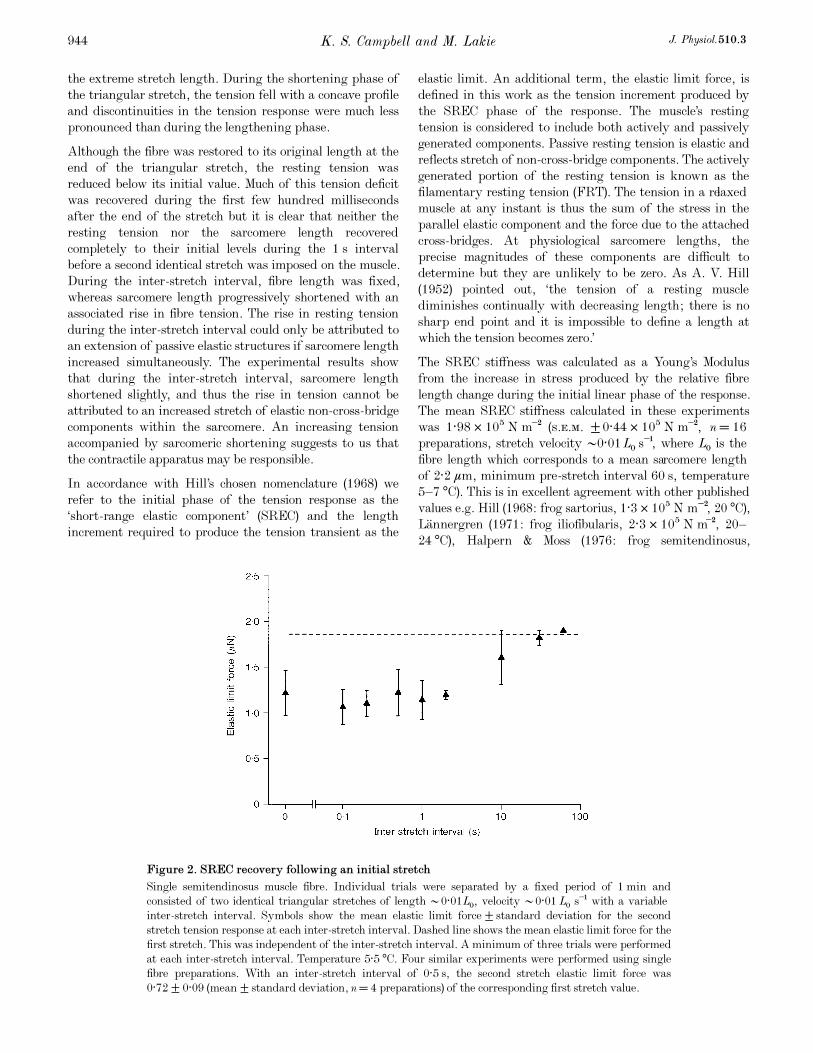
Figure 2. SREC recovery following an initial stretch
Single semitendinosus muscle fibre. Individual trials were separated by a fixed period of 1 min and
consisted of two identical triangular stretches of length •0·01LÑ, velocity •0·01LÑ s¢ with a variable
inter-stretch interval. Symbols show the mean elastic limit force ± standard deviation for the second
stretch tension response at each inter-stretch interval. Dashed line shows the mean elastic limit force for the
first stretch. This was independent of the inter-stretch interval. A minimum of three trials were performed
at each inter-stretch interval. Temperature 5·5°C. Four similar experiments were performed using single
fibre preparations. With an inter-stretch interval of 0·5 s, the second stretch elastic limit force was
0·72 ± 0·09 (mean ± standard deviation, n= 4 preparations) of the corresponding first stretch value.

2·0 ² 10Ç N m−2
, 3 °C) and Lakie & Robson (1990: frog
iliofibularis 1·8 ² 10Ç N m−2
, 3 °C).
The second stretch produced a qualitatively similar biphasic
tension response to the first (Fig. 1). However there were
clear and consistent differences between the responses to the
first and second stretches. In the second stretch, the SREC
tension rose more slowly and from a slightly lower baseline
than during the first stretch. Furthermore, the transient
drop in tension at the elastic limit was no longer present and
the elastic limit force was considerably reduced. In the two
stretches, there was no consistent difference in either the
maximal tension or the maximal sarcomere length attained.
The extent of the reduction of the second stretch elastic
limit force depends on the time interval between the
stretches. Figure 2 shows the recovery time course of the
elastic limit force. The thixotropic reduction observed when
the second stretch followed immediately after the first (i.e.
an inter-stretch interval of 0 s) was not substantially greater
than that produced by an inter-stretch interval in the range
0·5—1 s. As the inter-stretch interval was increased above
1 s, the elastic limit force recovered relatively slowly
towards a saturating value. The finding that for inter-
stretch intervals of greater than •1 s, the elastic limit force
recovered at a progressively declining rate is in agreement
with other published work (Buchthal & Kaiser, 1951;
L�annergren, 1971; Lakie & Robson, 1988b).However, in the
present experiments, the recovery in the elastic limit force
for inter-stretch intervals of less than •1 s was slight. This
consistent finding is a feature of the experimental results
which does not appear to have been previously reported.
Any physical explanation proposed to underlie the SREC
and FRT of relaxed skeletal muscle must account for these
unusual mechanical properties. Figures 3 and 4 illustrate
additional experimental evidence which imposes constraints
on proposed theoretical mechanisms.
Figure 3 shows the tension and sarcomere length responses
of an isolated single fibre to a pair of identical triangular
stretches. The responses are plotted not against time but as
an X—Y plot of tension against sarcomere length. ThisX—Y
plot highlights the fact that the muscle is not purely elastic;
in a purely elastic system tension is a single-valued function
of length. Furthermore, the X—Y plot clearly shows that
the FRT of the fibre was reduced by the first stretch and
that it did not completely recover to its initial value in the
1 s interval between the imposed stretches. Any reduction
in the maximal tension produced by each stretch was much
less than the substantial reduction of around 1 ìN in the
FRT. This finding has been previously described (Campbell
& Lakie, 1996).
Figure 4 shows the tension and sarcomere length responses
of a single relaxed fibre to three identical consecutive
triangular stretches. Although the second stretch SREC
stiffness and elastic limit force values were reduced relative
to the first stretch values, no systematic differences between
the second and third stretch values were apparent. Indeed
when more than three stretches were imposed on the muscle,
no progressive differences were observed between the second
and subsequent stretch responses. This finding suggests that
the underlying physical mechanism is in an identical state at
the end of the first, second and any subsequent stretch.
Response to length changes where shortening preceded
lengthening. The biphasic nature of the tension response is
most sharply delineated if the muscle has been maintained
at a constant length for a relatively long period of time.
Tension responses of relaxed skeletal muscleJ. Physiol. 510.3 945
Figure 3. X—Y plot of force against sarcomere length for two constant-velocity triangular
stretches
Single intact iliofibularis muscle fibre. Stretch length •0·011LÑ. Stretch velocity •0·011LÑ s¢. Two
stretches separated by 1·0 s. The fibre had been held at a constant length for 1 min before the first stretch
was initiated. Temperature 6·0°C.

Using triangular stretches where lengthening preceded
shortening, the SREC was always more obvious in the
lengthening phase (Fig. 5, thick lines). However if the
triangle was reversed and the muscle was initially shortened
from its resting length, the discontinuities in the tension
response were much more evident during the shortening
phase (Fig. 5, thin lines).
While the resting tension following a triangular stretch
where lengthening preceded shortening was temporarily
reduced below its initial value, in the converse situation
where shortening preceded lengthening the resting tension
was slightly increased at the end of the triangular stretch
(Fig. 5).
Velocity dependence. Figure 6 shows the tension and
sarcomere length responses of a relaxed single fibre to two
triangular stretches of constant length but different velocity.
Both the elastic limit force and the tension at the extreme
stretch length were substantially greater for the faster
stretch. It is clear therefore that the magnitude of the
biphasic tension response is affected by the rate of
stretching.
The precise nature of the velocity dependence of the tension
responses of relaxed skeletal muscles to imposed movements
may shed light on the responsible mechanisms. In the
present experiments, tension responses were measured
using stretches with velocities ranging from 5 ² 10¦Æ to
K. S. Campbell and M. Lakie J. Physiol. 510.3946
Figure 5. Force and sarcomere length
responses to triangular stretches of
opposite polarity
Single relaxed iliofibularis muscle fibre. Thick
lines show the tension and sarcomere length
responses to a triangular stretch where
lengthening preceded shortening. Thin lines
show responses to a triangular stretch where
shortening preceded lengthening. Stretch
magnitude •0·01LÑ. Stretch velocity
•±0·01 LÑ s¢. The fibre had been held at a
constant length for 1 min before each stretch
was initiated. Dashed lines show the tension
baseline (defined as in Fig. 1) and the
corresponding initial sarcomere length.
Temperature 7·0°C.
Figure 4. Force and sarcomere length responses to three identical constant-velocity triangular
stretches
Single intact iliofibularis muscle fibre. Stretch length •0·011LÑ. Stretch velocity •0·011LÑ s¢. The fibre
had been held at a constant length for 1 min before the first stretch was initiated. Temperature 5·0°C.
2 LÑ s¢. The maximum shortening velocity of frog skeletal
muscles is of the order of 2LÑ s¢ near 5°C, and it seems
likely that the range of stretch velocities used in the present
experiments encompasses those which the intact muscle
would be subjected to under normal physiological conditions.
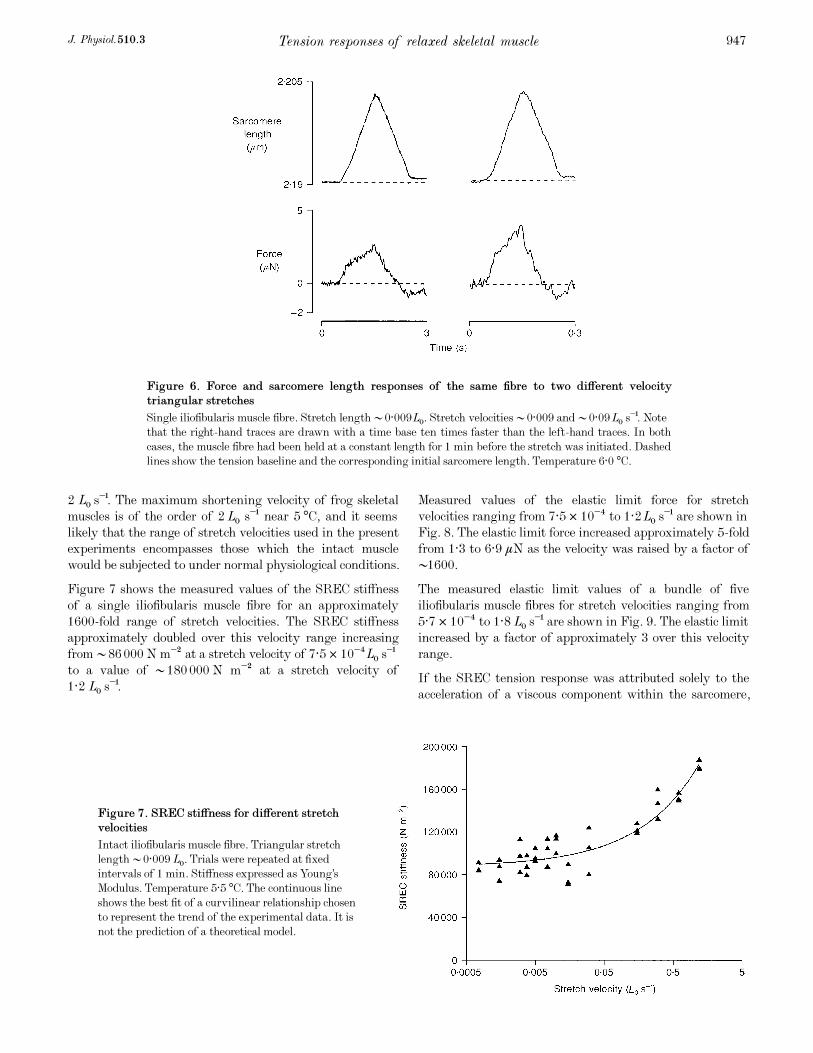
Figure 7 shows the measured values of the SREC stiffness
of a single iliofibularis muscle fibre for an approximately
1600-fold range of stretch velocities. The SREC stiffness
approximately doubled over this velocity range increasing
from •86000 N m¦Â at a stretch velocity of 7·5 ² 10¦ÆLÑ s¢
to a value of •180000 N m¦Â at a stretch velocity of
1·2 LÑ s¢.
Measured values of the elastic limit force for stretch
velocities ranging from 7·5 ² 10¦Æ to 1·2LÑ s¢ are shown in
Fig. 8. The elastic limit force increased approximately 5-fold
from 1·3 to 6·9 ìN as the velocity was raised by a factor of
•1600.
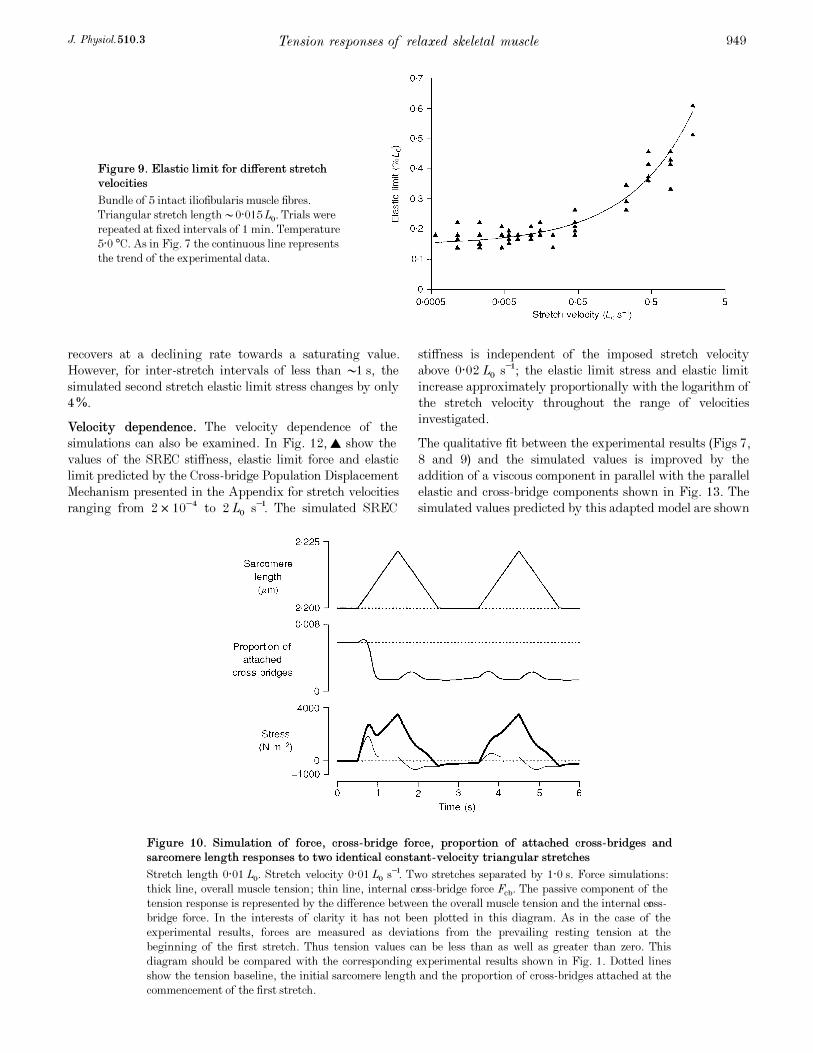
The measured elastic limit values of a bundle of five
iliofibularis muscle fibres for stretch velocities ranging from
5·7 ² 10¦Æ to 1·8 LÑ s¢ are shown in Fig. 9. The elastic limit
increased by a factor of approximately 3 over this velocity
range.
If the SREC tension response was attributed solely to the
acceleration of a viscous component within the sarcomere,
Tension responses of relaxed skeletal muscleJ. Physiol. 510.3 947
Figure 6. Force and sarcomere length responses of the same fibre to two different velocity
triangular stretches
Single iliofibularis muscle fibre. Stretch length •0·009LÑ. Stretch velocities •0·009 and •0·09LÑ s¢. Note
that the right-hand traces are drawn with a time base ten times faster than the left-hand traces. In both
cases, the muscle fibre had been held at a constant length for 1 min before the stretch was initiated. Dashed
lines show the tension baseline and the corresponding initial sarcomere length. Temperature 6·0°C.
Figure 7. SREC stiffness for different stretch
velocities
Intact iliofibularis muscle fibre. Triangular stretch
length •0·009LÑ. Trials were repeated at fixed
intervals of 1 min. Stiffness expressed as Young’s
Modulus. Temperature 5·5°C. The continuous line
shows the best fit of a curvilinear relationship chosen
to represent the trend of the experimental data. It is
not the prediction of a theoretical model.
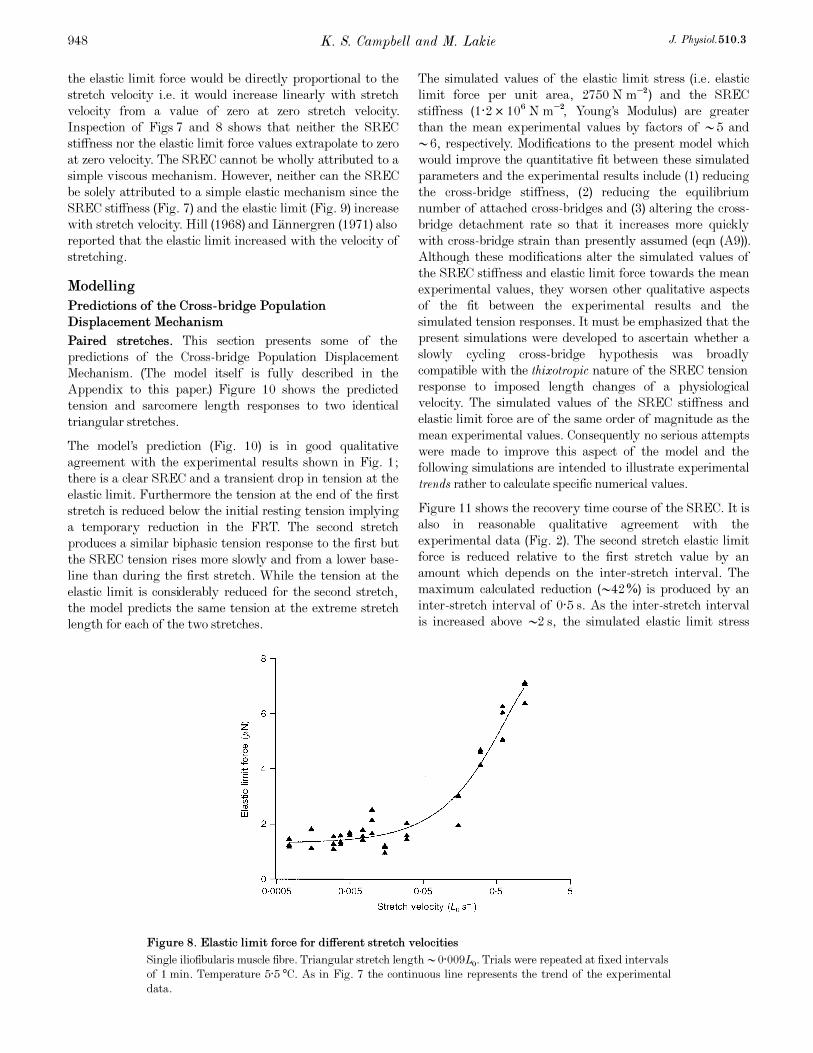
the elastic limit force would be directly proportional to the
stretch velocity i.e. it would increase linearly with stretch
velocity from a value of zero at zero stretch velocity.
Inspection of Figs 7 and 8 shows that neither the SREC
stiffness nor the elastic limit force values extrapolate to zero
at zero velocity. The SREC cannot be wholly attributed to a
simple viscous mechanism. However, neither can the SREC
be solely attributed to a simple elastic mechanism since the
SREC stiffness (Fig. 7) and the elastic limit (Fig. 9) increase
with stretch velocity. Hill (1968) and L�annergren (1971) also
reported that the elastic limit increased with the velocity of
stretching.
Modelling
Predictions of the Cross-bridge Population
Displacement Mechanism
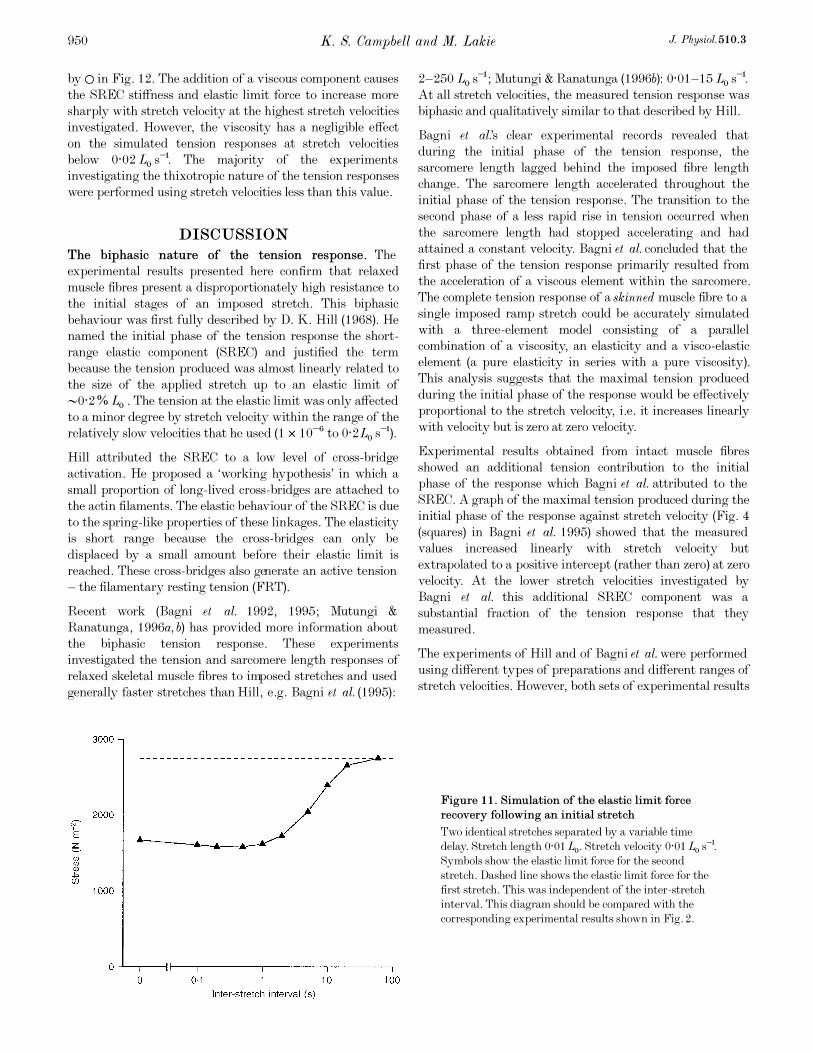
Paired stretches. This section presents some of the
predictions of the Cross-bridge Population Displacement
Mechanism. (The model itself is fully described in the
Appendix to this paper.) Figure 10 shows the predicted
tension and sarcomere length responses to two identical
triangular stretches.
The model’s prediction (Fig. 10) is in good qualitative
agreement with the experimental results shown in Fig. 1;
there is a clear SREC and a transient drop in tension at the
elastic limit. Furthermore the tension at the end of the first
stretch is reduced below the initial resting tension implying
a temporary reduction in the FRT. The second stretch
produces a similar biphasic tension response to the first but
the SREC tension rises more slowly and from a lower base-
line than during the first stretch. While the tension at the
elastic limit is considerably reduced for the second stretch,
the model predicts the same tension at the extreme stretch
length for each of the two stretches.
The simulated values of the elastic limit stress (i.e. elastic
limit force per unit area, 2750 N m¦Â) and the SREC
stiffness (1·2 ² 10É N m¦Â, Young’s Modulus) are greater
than the mean experimental values by factors of •5 and
•6, respectively. Modifications to the present model which
would improve the quantitative fit between these simulated
parameters and the experimental results include (1) reducing
the cross-bridge stiffness, (2) reducing the equilibrium
number of attached cross-bridges and (3) altering the cross-
bridge detachment rate so that it increases more quickly
with cross-bridge strain than presently assumed (eqn (A9)).
Although these modifications alter the simulated values of
the SREC stiffness and elastic limit force towards the mean
experimental values, they worsen other qualitative aspects
of the fit between the experimental results and the
simulated tension responses. It must be emphasized that the
present simulations were developed to ascertain whether a
slowly cycling cross-bridge hypothesis was broadly
compatible with the thixotropic nature of the SREC tension
response to imposed length changes of a physiological
velocity. The simulated values of the SREC stiffness and
elastic limit force are of the same order of magnitude as the
mean experimental values. Consequently no serious attempts
were made to improve this aspect of the model and the
following simulations are intended to illustrate experimental
trends rather to calculate specific numerical values.
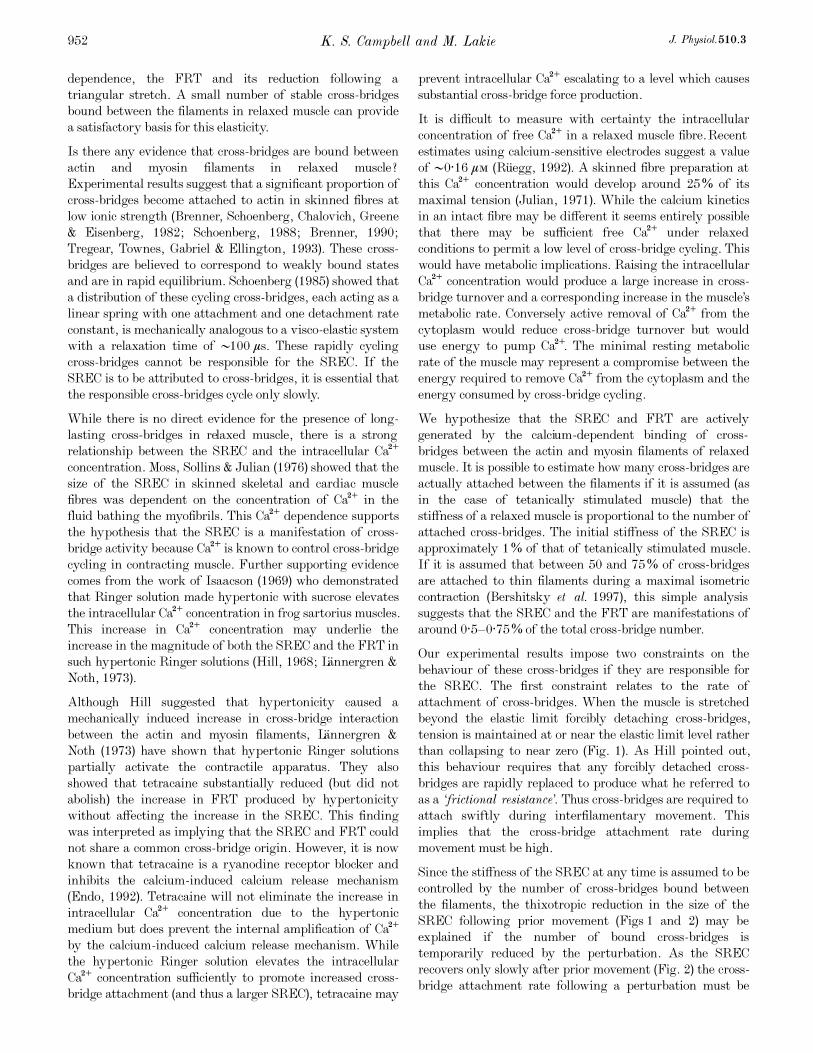
Figure 11 shows the recovery time course of the SREC. It is
also in reasonable qualitative agreement with the
experimental data (Fig. 2). The second stretch elastic limit
force is reduced relative to the first stretch value by an
amount which depends on the inter-stretch interval. The
maximum calculated reduction (•42%) is produced by an
inter-stretch interval of 0·5 s. As the inter-stretch interval
is increased above •2 s, the simulated elastic limit stress
K. S. Campbell and M. Lakie J. Physiol. 510.3948
Figure 8. Elastic limit force for different stretch velocities
Single iliofibularis muscle fibre. Triangular stretch length •0·009LÑ. Trials were repeated at fixed intervals
of 1 min. Temperature 5·5°C. As in Fig. 7 the continuous line represents the trend of the experimental
data.
recovers at a declining rate towards a saturating value.
However, for inter-stretch intervals of less than •1 s, the
simulated second stretch elastic limit stress changes by only
4%.
Velocity dependence. The velocity dependence of the
simulations can also be examined. In Fig. 12, 8 show the
values of the SREC stiffness, elastic limit force and elastic
limit predicted by the Cross-bridge Population Displacement
Mechanism presented in the Appendix for stretch velocities
ranging from 2 ² 10¦Æ to 2LÑ s¢. The simulated SREC
stiffness is independent of the imposed stretch velocity
above 0·02 LÑ s¢; the elastic limit stress and elastic limit
increase approximately proportionally with the logarithm of
the stretch velocity throughout the range of velocities
investigated.
The qualitative fit between the experimental results (Figs 7,
8 and 9) and the simulated values is improved by the
addition of a viscous component in parallel with the parallel
elastic and cross-bridge components shown in Fig. 13. The
simulated values predicted by this adapted model are shown
Tension responses of relaxed skeletal muscleJ. Physiol. 510.3 949
Figure 10. Simulation of force, cross-bridge force, proportion of attached cross-bridges and
sarcomere length responses to two identical constant-velocity triangular stretches
Stretch length 0·01LÑ. Stretch velocity 0·01LÑ s¢. Two stretches separated by 1·0 s. Force simulations:
thick line, overall muscle tension; thin line, internal cross-bridge force Fcb. The passive component of the
tension response is represented by the difference between the overall muscle tension and the internal cross-
bridge force. In the interests of clarity it has not been plotted in this diagram. As in the case of the
experimental results, forces are measured as deviations from the prevailing resting tension at the
beginning of the first stretch. Thus tension values can be less than as well as greater than zero. This
diagram should be compared with the corresponding experimental results shown in Fig. 1. Dotted lines
show the tension baseline, the initial sarcomere length and the proportion of cross-bridges attached at the
commencement of the first stretch.
Figure 9. Elastic limit for different stretch
velocities
Bundle of 5 intact iliofibularis muscle fibres.
Triangular stretch length •0·015LÑ. Trials were
repeated at fixed intervals of 1 min. Temperature
5·0°C. As in Fig. 7 the continuous line represents
the trend of the experimental data.
by 1 in Fig. 12. The addition of a viscous component causes
the SREC stiffness and elastic limit force to increase more
sharply with stretch velocity at the highest stretch velocities
investigated. However, the viscosity has a negligible effect
on the simulated tension responses at stretch velocities
below 0·02 LÑ s¢. The majority of the experiments
investigating the thixotropic nature of the tension responses
were performed using stretch velocities less than this value.
DISCUSSION
The biphasic nature of the tension response. The
experimental results presented here confirm that relaxed
muscle fibres present a disproportionately high resistance to
the initial stages of an imposed stretch. This biphasic
behaviour was first fully described by D. K. Hill (1968). He
named the initial phase of the tension response the short-
range elastic component (SREC) and justified the term
because the tension produced was almost linearly related to
the size of the applied stretch up to an elastic limit of
•0·2% LÑ . The tension at the elastic limit was only affected
to a minor degree by stretch velocity within the range of the
relatively slow velocities that he used (1 ² 10¦É to 0·2LÑ s¢).
Hill attributed the SREC to a low level of cross-bridge
activation. He proposed a ‘working hypothesis’ in which a
small proportion of long-lived cross-bridges are attached to
the actin filaments. The elastic behaviour of the SREC is due
to the spring-like properties of these linkages. The elasticity
is short range because the cross-bridges can only be
displaced by a small amount before their elastic limit is
reached. These cross-bridges also generate an active tension
— the filamentary resting tension (FRT).
Recent work (Bagni et al. 1992, 1995; Mutungi &
Ranatunga, 1996a,b) has provided more information about
the biphasic tension response. These experiments
investigated the tension and sarcomere length responses of
relaxed skeletal muscle fibres to imposed stretches and used
generally faster stretches thanHill, e.g. Bagni et al. (1995):
2—250 LÑ s¢; Mutungi & Ranatunga (1996b): 0·01—15 LÑ s¢.
At all stretch velocities, the measured tension response was
biphasic and qualitatively similar to that described by Hill.
Bagni et al.’s clear experimental records revealed that
during the initial phase of the tension response, the
sarcomere length lagged behind the imposed fibre length
change. The sarcomere length accelerated throughout the
initial phase of the tension response. The transition to the
second phase of a less rapid rise in tension occurred when
the sarcomere length had stopped accelerating and had
attained a constant velocity. Bagni et al. concluded that the
first phase of the tension response primarily resulted from
the acceleration of a viscous element within the sarcomere.
The complete tension response of askinned muscle fibre to a
single imposed ramp stretch could be accurately simulated
with a three-element model consisting of a parallel
combination of a viscosity, an elasticity and a visco-elastic
element (a pure elasticity in series with a pure viscosity).
This analysis suggests that the maximal tension produced
during the initial phase of the response would be effectively
proportional to the stretch velocity, i.e. it increases linearly
with velocity but is zero at zero velocity.
Experimental results obtained from intact muscle fibres
showed an additional tension contribution to the initial
phase of the response which Bagni et al. attributed to the
SREC. A graph of the maximal tension produced during the
initial phase of the response against stretch velocity (Fig. 4
(squares) in Bagni et al. 1995) showed that the measured
values increased linearly with stretch velocity but
extrapolated to a positive intercept (rather than zero) at zero
velocity. At the lower stretch velocities investigated by
Bagni et al. this additional SREC component was a
substantial fraction of the tension response that they
measured.
The experiments of Hill and of Bagni et al. were performed
using different types of preparations and different ranges of
stretch velocities. However, both sets of experimental results
K. S. Campbell and M. Lakie J. Physiol. 510.3950
Figure 11. Simulation of the elastic limit force
recovery following an initial stretch
Two identical stretches separated by a variable time
delay. Stretch length 0·01LÑ. Stretch velocity 0·01LÑ s¢.
Symbols show the elastic limit force for the second
stretch. Dashed line shows the elastic limit force for the
first stretch. This was independent of the inter-stretch
interval. This diagram should be compared with the
corresponding experimental results shown in Fig. 2.

suggest that the maximal tension produced during the
initial phase of the response in intact muscle fibres increases
with stretch velocity but is not zero at zero velocity. These
results and the present experimental results suggest to us
that the initial phase of the tension response may be
dominated by elastic properties at low stretch velocities and
by viscous properties at high stretch velocities.
A similar partly viscous, partly elastic tension response to
stretch velocities of less than 2LÑ s¢ is suggested by
Mutungi & Ranatunga’s experimental results (1996b) for
mammalian fibres.
Any complete theory underlying the biphasic tension
response of relaxed muscle must explain not only the
viscous and elastic components of the tension response but
also their dependence on mechanical history (Fig. 2). The
three-element model suggested by Bagni et al. to explain
their experimental results does not provide a satisfactory
explanation for all of the experimental results presented in
this paper. Firstly Bagni et al.’s three-element model does
not explain the positive tension component which they
attribute to the SREC. In the present experiments the
equivalent positive intercept is a substantial part of the
measured tension responses. Secondly, Bagni et al.’s model
cannot account for the thixotropic nature of the observed
tension responses. Only the visco-elastic element could
produce a tension response which is dependent on the prior
history of movement. The visco-elastic relaxation time of
•1 ms calculated from their results is at least two orders of
magnitude too short to account for the thixotropic tension
response shown in Fig. 2. This relaxation time is also too
short to account for the long-lived reduction in FRT
following the end of an imposed triangular stretch (Fig. 1).
While viscous and visco-elastic systems must dominate the
tension and sarcomere length responses at very high stretch
velocities, they cannot be the dominant mechanisms
underlying the experimental observations using the
physiological stretch velocities described in this work.
A cross-bridge basis for the SREC and FRT? At the
relatively low stretch velocities described in this work, the
SREC produces a tension which is approximately
proportional to the applied length change below the elastic
limit. This is characteristic of a response dominated by an
elastic mechanism. Further evidence of the elastic nature of
the SREC mechanism is the presence of a clear elastic limit
in the tension response even when extremely slow stretches
are used (e.g. 8 ² 10¦É LÑ s¢, M. Lakie & K. S. Campbell,
unpublished observations). A full explanation of the elasticity
must account for its limited range, its mechanical history
Tension responses of relaxed skeletal muscleJ. Physiol. 510.3 951
Figure 12. Simulation of the velocity dependence
of the tension responses
A, SREC stiffness (Young’s Modulus).B, elastic limit
stress. C, elastic limit. Stretch length 0·02LÑ. 8, values
simulated by the Cross-bridge Population
Displacement Mechanism presented in the Appendix.
1, simulated values when a viscous component is
added in parallel with the cross-bridge and parallel
elastic components shown in Fig. 13. The viscosity
produces a forceF = çv where ç represents the viscous
coefficient (1·82 ² 109
N m−3
s per half-sarcomere) and
v is the interfilamentary sliding velocity in metres per
second. The viscous component has a negligible effect
on the simulated values for stretch velocities less than
0·02 LÑ s¢.
dependence, the FRT and its reduction following a
triangular stretch. A small number of stable cross-bridges
bound between the filaments in relaxed muscle can provide
a satisfactory basis for this elasticity.
Is there any evidence that cross-bridges are bound between
actin and myosin filaments in relaxed muscle?
Experimental results suggest that a significant proportion of
cross-bridges become attached to actin in skinned fibres at
low ionic strength (Brenner, Schoenberg, Chalovich, Greene
& Eisenberg, 1982; Schoenberg, 1988; Brenner, 1990;
Tregear, Townes, Gabriel & Ellington, 1993). These cross-
bridges are believed to correspond to weakly bound states
and are in rapid equilibrium. Schoenberg (1985) showed that
a distribution of these cycling cross-bridges, each acting as a
linear spring with one attachment and one detachment rate
constant, is mechanically analogous to a visco-elastic system
with a relaxation time of •100 ìs. These rapidly cycling
cross-bridges cannot be responsible for the SREC. If the
SREC is to be attributed to cross-bridges, it is essential that
the responsible cross-bridges cycle only slowly.
While there is no direct evidence for the presence of long-
lasting cross-bridges in relaxed muscle, there is a strong
relationship between the SREC and the intracellular Ca¥
concentration. Moss, Sollins & Julian (1976) showed that the
size of the SREC in skinned skeletal and cardiac muscle
fibres was dependent on the concentration of Ca¥ in the
fluid bathing the myofibrils. This Ca¥ dependence supports
the hypothesis that the SREC is a manifestation of cross-
bridge activity because Ca¥ is known to control cross-bridge
cycling in contracting muscle. Further supporting evidence
comes from the work of Isaacson (1969) who demonstrated
that Ringer solution made hypertonic with sucrose elevates
the intracellular Ca¥ concentration in frog sartorius muscles.
This increase in Ca¥ concentration may underlie the
increase in the magnitude of both the SREC and the FRT in
such hypertonic Ringer solutions (Hill, 1968; L�annergren &
Noth, 1973).
Although Hill suggested that hypertonicity caused a
mechanically induced increase in cross-bridge interaction
between the actin and myosin filaments, L�annergren &
Noth (1973) have shown that hypertonic Ringer solutions
partially activate the contractile apparatus. They also
showed that tetracaine substantially reduced (but did not
abolish) the increase in FRT produced by hypertonicity
without affecting the increase in the SREC. This finding
was interpreted as implying that the SREC and FRT could
not share a common cross-bridge origin. However, it is now
known that tetracaine is a ryanodine receptor blocker and
inhibits the calcium-induced calcium release mechanism
(Endo, 1992). Tetracaine will not eliminate the increase in
intracellular Ca¥ concentration due to the hypertonic
medium but does prevent the internal amplification of Ca¥
by the calcium-induced calcium release mechanism. While
the hypertonic Ringer solution elevates the intracellular
Ca¥ concentration sufficiently to promote increased cross-
bridge attachment (and thus a larger SREC), tetracaine may
prevent intracellular Ca¥ escalating to a level which causes
substantial cross-bridge force production.
It is difficult to measure with certainty the intracellular
concentration of free Ca¥ in a relaxed muscle fibre. Recent
estimates using calcium-sensitive electrodes suggest a value
of •0·16 ìÒ (R�uegg, 1992). A skinned fibre preparation at
this Ca¥ concentration would develop around 25% of its
maximal tension (Julian, 1971). While the calcium kinetics
in an intact fibre may be different it seems entirely possible
that there may be sufficient free Ca¥ under relaxed
conditions to permit a low level of cross-bridge cycling. This
would have metabolic implications. Raising the intracellular
Ca¥ concentration would produce a large increase in cross-
bridge turnover and a corresponding increase in the muscle’s
metabolic rate. Conversely active removal of Ca¥ from the
cytoplasm would reduce cross-bridge turnover but would
use energy to pump Ca¥. The minimal resting metabolic
rate of the muscle may represent a compromise between the
energy required to remove Ca¥ from the cytoplasm and the
energy consumed by cross-bridge cycling.
We hypothesize that the SREC and FRT are actively
generated by the calcium-dependent binding of cross-
bridges between the actin and myosin filaments of relaxed
muscle. It is possible to estimate how many cross-bridges are
actually attached between the filaments if it is assumed (as
in the case of tetanically stimulated muscle) that the
stiffness of a relaxed muscle is proportional to the number of
attached cross-bridges. The initial stiffness of the SREC is
approximately 1% of that of tetanically stimulated muscle.
If it is assumed that between 50 and 75% of cross-bridges
are attached to thin filaments during a maximal isometric
contraction (Bershitsky et al. 1997), this simple analysis
suggests that the SREC and the FRT are manifestations of
around 0·5—0·75% of the total cross-bridge number.
Our experimental results impose two constraints on the
behaviour of these cross-bridges if they are responsible for
the SREC. The first constraint relates to the rate of
attachment of cross-bridges. When the muscle is stretched
beyond the elastic limit forcibly detaching cross-bridges,
tension is maintained at or near the elastic limit level rather
than collapsing to near zero (Fig. 1). As Hill pointed out,
this behaviour requires that any forcibly detached cross-
bridges are rapidly replaced to produce what he referred to
as a ‘frictional resistance’. Thus cross-bridges are required to
attach swiftly during interfilamentary movement. This
implies that the cross-bridge attachment rate during
movement must be high.
Since the stiffness of the SREC at any time is assumed to be
controlled by the number of cross-bridges bound between
the filaments, the thixotropic reduction in the size of the
SREC following prior movement (Figs 1 and 2) may be
explained if the number of bound cross-bridges is
temporarily reduced by the perturbation. As the SREC
recovers only slowly after prior movement (Fig. 2) the cross-
bridge attachment rate following a perturbation must be
K. S. Campbell and M. Lakie J. Physiol. 510.3952

relatively slow. There are thus conflicting requirements for a
fast cross-bridge attachment rate during a stretch and a
slow cross-bridge attachment rate between stretches. This
can be resolved if the probability of cross-bridge attachment
is increased during interfilamentary movement as a result
of a ‘movement enhancement’ mechanism (Campbell &
Lakie, 1995b). A number of mechanisms by which this
might arise can be envisaged. Hill (1968) suggested that
forcibly detached cross-bridges might immediately reattach
further along the actin filament. A similar mechanism has
been proposed for contracting muscle by Lombardi &
Piazzesi (1990). Alternatively, it is possible to speculate that
interfilamentary movement might ‘dislodge’ some
tropomyosin molecules, temporarily exposing an increased
number of binding sites on the actin filament, or that
movement of the sarcoplasmic reticulum releases calcium
ions into the sarcoplasm, thereby increasing cross-bridge
activity. The present simulations are based on an alternative
geometrical argument relating to misregistration between
the cross-bridges on the myosin filaments and the binding
sites on the actin filaments — see Appendix for details.
The second constraint is imposed by the form of the velocity
dependence of the SREC. If the cross-bridges possessed
both a single attachment and a single detachment rate
constant, they would produce a visco-elastic response to
stretch (Schoenberg, 1985). During imposed ramp stretches,
the cross-bridges would produce a force which rose to a
saturating plateau value directly proportional to the stretch
velocity. Inspection of Fig. 8 shows that while the elastic
limit force increases with stretch velocity it is very far from
being directly proportional to it, i.e. doubling the stretch
velocity produces less than double the initial elastic limit
force. A simple way of explaining the relatively weak
velocity dependence of the SREC is if cross-bridges detach
more rapidly when pulled to more strained configurations.
This hypothesis (that the cross-bridge detachment rate is
dependent on strain) is consistent with most theories of
active muscle contraction, e.g. Huxley (1957).
The maximal tensions produced by paired stretches are
almost identical, despite the reduction in the prevailing
resting tension at the commencement of the second stretch
(Figs 1 and 3). As the two stretches commence at identical
fibre lengths, the reduction in prevailing tension must
reflect changes in actively generated tension (FRT), rather
than in the tension produced by the passive stretch of non-
cross-bridge components. If the imposed stretch produces
the same tension increment during the first and second
stretches, the maximal tension should be depressed to the
same extent as the resting tension. Figures 1 and 3 clearly
show that any reduction in the maximal tensions produced
by the two stretches is much less than the substantial
reduction of around 1 ìN in the FRT. The hypothesis that
the SREC and FRT are manifestations of a low level of
cross-bridge activity in relaxed muscle provides a possible
explanation for this result. After a long period with no
interfilamentary movement, the cross-bridges linking the
actin and myosin filaments evolve to a stable equilibrium
distribution (Fig. 15). An applied stretch displaces these
cross-bridges and distorts the equilibrium distribution. If
the stretch is sufficiently long, the mechanical memory of
the initial equilibrium distribution is lost and the continuing
stretch maintains a skewed but steady-state dynamic
distribution (Fig. 15). After the first stretch, the cross-
bridge distribution takes many seconds to re-attain its
initial equilibrium distribution. This altering distribution
underlies the slow recovery of the FRT. The second applied
stretch skews this partially recovered population which
eventually re-attains the same steady-state dynamic
distribution as during the first stretch. Once this steady-
state distribution is achieved the tension responses for the
two stretches are identical. The cross-bridge distributions
are different at the beginning and end of the first stretch.
However, the distributions are pulled into the same state at
the end of the first, second and any subsequent identical
stretch. This mechanism thus explains the difference
between the tension responses to the first and second
stretches, and the similarity of the tension responses to the
second and third stretches shown in Fig. 4.
The biphasic nature of the tension response is most sharply
delineated if the muscle has been maintained at a constant
length for a relatively long period of time before the length
change is imposed. Hill (1968), measuring the tension
responses to imposed ramp stretches, observed equally clear
discontinuities with shortening or lengthening stretches. In
the present experiments, using triangular stretches where
lengthening preceded shortening, the SREC was always
more obvious in the lengthening phase (Fig. 5). However, if
the triangle was reversed and the muscle was initially
shortened from its resting length, the discontinuities were
much more evident during the shortening phase (Fig. 5).
Thus, the SREC is most evident during the first imposed
length change, regardless of the direction of movement.
This symmetrical behaviour, which to our knowledge has
not previously been satisfactorily explained, is predicted by
the Cross-bridge Population Displacement Mechanism.
When a muscle is subjected to an imposed length change,
the magnitude of the cross-bridge force increases and, if the
stretch continues for a sufficient period, is maintained at a
constant level. This change in cross-bridge force represents a
redistribution of cross-bridges from the equilibrium
distribution to the steady-state dynamic distribution
(Fig. 15) produced by the imposed length change. It is
greatest when the cross-bridges are displaced from the
narrow stable equilibrium distribution (Fig. 15). This
explains the sharp SREC response to the first movement
after a long time interval at a fixed length. The biphasic
nature of the tension response is less obvious if the cross-
bridges are redistributed from the broad steady-state
distribution produced by movement. The Cross-bridge
Population Displacement Mechanism confers on resting
muscle a time-dependent elasticity which is self-resetting at
all physiological lengths.
Tension responses of relaxed skeletal muscleJ. Physiol. 510.3 953
The Cross-bridge Population Displacement
Mechanism
The model presented in this work predicts that the initial
phase of the tension response to imposed stretches increases
with stretch velocity but is decreased by prior movement.
The form of the predictions of the model for the mechanical
history dependence (Fig. 11) and the velocity dependence
(Fig. 12) of the tension responses are in general agreement
with the experimental results described in the present work
(Figs 2, 7, 8 and 9) and elsewhere in the literature, e.g. Hill
(1968) and L�annergren (1971).
The model also provides possible explanations for (1) a
period of sarcomere length acceleration which was sometimes
observed during the initial phase of the tension responses
(Figs 1 and 10) and (2) the relationship between the SREC
and the FRT.
Thixotropy. If a muscle is subjected to two identical
stretches, the elastic limit force produced during the second
stretch depends on the inter-stretch interval. If the two
stretches are separated by less than •10 s the elastic limit
force produced during the second stretch is reduced relative
to that of the first (Fig. 2). The model attributes this
thixotropic effect to a temporary reduction in the number of
cross-bridges bound between the filaments. During an
imposed stretch interfilamentary displacement skews the
cross-bridge distribution (Fig. 15), and although highly
strained cross-bridges are continually detaching, movement
enhancement ensures that they are rapidly replaced by
other less strained cross-bridges so that the number of
attached cross-bridges remains constant (Fig. 10). At the
end of the stretch a large number of cross-bridges are left in
highly strained states. These cross-bridges detach. However,
since there is relatively little interfilamentary movement,
the movement enhancement mechanism can no longer
provide rapid replacements for these detaching cross-bridges
and the number of cross-bridges bound between the
filaments falls slightly (Fig. 10). If the muscle is held at a
constant length for a long period of time, the cross-bridge
population gradually redevelops and evolves towards its
stable equilibrium distribution (Fig. 15). However, this takes
many seconds and if a second stretch is imposed before the
population has completely redeveloped, the initial effect of
the imposed stretch is to displace a reduced number of cross-
bridges. This produces a reduced SREC.
The Cross-bridge Population Displacement Mechanism
predicts that the reduction in the elastic limit force for inter-
stretch intervals of zero is not substantially greater than
that for short inter-stretch intervals in the range 0·5—1 s
(Fig. 11). This prediction is supported by the experimental
results (Fig. 2). An inter-stretch interval of 0·5 s produces
the greatest simulated thixotropic reduction in the elastic
limit force (Fig. 11) because the strained cross-bridges do not
detach instantaneously once the imposed movement stops.
It requires a short time interval for the strained cross-bridge
population to fall. The maximum SREC reduction is
produced by an inter-stretch interval which is long enough
for highly strained cross-bridges to detach and yet short
enough that the cross-bridge population does not recover
significantly between the stretches.
Velocity dependence. The Cross-bridge Population
Displacement Mechanism was developed to investigate
whether Hill’s cross-bridge hypothesis could be extended to
account for the thixotropic nature of the tension responses
to paired stretches. The model produced a satisfactory
simulation of the thixotropic nature of the tension responses
(Fig. 10). However, it is also desirable that the model
satisfactorily simulates the form of the velocity dependence
of the SREC. Inspection of Figs 7 and 8 shows that at the
higher stretch velocities examined in this work, the relative
increase in the measured values of the SREC stiffness and
elastic limit force with stretch velocity is greater than that
predicted by the cross-bridge mechanism (Fig. 12, 8). The
qualitative fit of the Cross-bridge Population Displacement
Mechanism predictions (Fig. 12) to the velocity dependence
data at high stretch velocities is improved if a viscous
component is added in parallel with the cross-bridge and
parallel elastic components shown in Fig. 13. This addition
does not substantially change the simulated values of the
SREC stiffness, elastic limit force and elastic limit at stretch
velocities less than 0·02LÑ s¢. Neither does the viscous
component affect the thixotropic nature of the simulated
tension responses.
It must be emphasized that in the present model, the
biphasic nature of the SREC tension response is attributed
solely to the skewing of the cross-bridge distribution to the
steady-state dynamic distribution produced by the imposed
movement. At velocities much higher than those investigated
here, the viscous resistance would dominate the simulated
tension responses. However, at stretch velocities less than
0·02 LÑ s¢, the viscous resistance is negligible compared
with that produced by the cross-bridge component. Thus for
stretch velocities less than 0·02LÑ s¢, the velocity
dependence of the tension responses can be attributed solely
to the effect of stretch velocity on the skewing of the cross-
bridge distribution. In Fig. 12, the velocity dependence of
the SREC parameters simulated with (1) and without (8)
the viscous component have been plotted separately to
clarify this point.
The effect of stretch velocity on the displacement of the
cross-bridge distribution is relatively complicated. Fast
stretches displace cross-bridges further before they detach
than slow stretches. This explains why the simulated elastic
limit increases with stretch velocity (Fig. 12C). Examination
of the parameters simulated without a viscous component
shows that the effect of stretch velocity on the SREC
stiffness is relatively weak (Fig. 12A). This is because the
stiffness of the cross-bridge component is dominated by the
number of cross-bridges bound at the beginning of the
imposed movement — a number which cannot be influenced
by the stretch itself. Thus to some extent, the velocity
dependence of the elastic limit force (Fig. 12B) at stretch
K. S. Campbell and M. Lakie J. Physiol. 510.3954

velocities less than 0·02LÑ s¢ is characteristic of that of a
predominantly elastic system with an elastic limit which
increases with the velocity of stretching.
Sarcomere length acceleration. Bagni et al. (1992, 1995)
showed that sarcomere length accelerates throughout the
initial stages of a fast stretch. Sarcomere length acceleration
could sometimes be observed in the present experiments
with stretch velocities as low as 0·01LÑ s¢. It appeared to
be influenced by the prior mechanical history and was
normally more apparent in the first of repeated stretches. It
is interesting to note that the present model suggests that
(at least for the slower stretches used in the present work)
sarcomere length could accelerate as a result of changes in
the cross-bridge force.
If the muscle is held in a fixed position for a long time, the
cross-bridge population of the three-component model
evolves to its stable equilibrium distribution (Fig. 15). If a
length stretch is imposed on the muscle, the cross-bridge
component initially presents considerable resistance to
movement. The apparent stiffness of the combination of the
parallel elastic element and the cross-bridges is relatively
high and the applied stretch produces a relatively small
increase in the length of the parallel elastic element. A
significant proportion of the applied length change extends
the series elastic element.
As the stretch continues, cross-bridges start to detach more
rapidly due to their increased strain (Fig. 10). The combined
stiffness of the parallel elastic element and the reduced
cross-bridge population is now less than at the beginning of
the stretch and the continuing fibre length change produces
a proportionately greater elongation in the parallel elastic
element than at the beginning of the stretch. This is
sarcomere length acceleration.
If a second stretch is imposed on the muscle before the cross-
bridge population has fully redeveloped (Fig. 10), the cross-
bridge component will produce less resistance to the initial
stages of the imposed stretch. The parallel elastic element
will extend more rapidly at the beginning of the stretch and
the subsequent sarcomere length acceleration will be reduced.
The model thus provides a possible explanation both for
sarcomere length acceleration and its dependence on the
mechanical history of the muscle during stretches of a
physiological velocity.
The relationship between the SREC and FRT.The time
course of the redevelopment of the SREC and FRT after an
imposed stretch are clearly different (Fig. 1 and Hufschmidt
& Schwaller, 1987). This disparity has been used as evidence
to suggest that the SREC, the FRT, or both, must be
generated by structures other than cross-bridges, e.g. Helber
(1980) and L�annergren (1971).
A further strength of the Cross-bridge Population
Displacement Mechanism is that it provides an explanation
for this difference. The reduction in resting tension
following a triangular stretch is largely because the mean
cross-bridge displacement is negative; most of the cross-
bridges are compressed. Tension recovery occurs as a result
of two distinct mechanisms. Immediately after the stretch,
negatively strained cross-bridges detach rapidly and the
cross-bridge force rises. Thus the early phase of rising
tension corresponds to a redistribution of the cross-bridge
population. A second slower phase of the tension rise is due
to the reattachment of cross-bridges as the population
reattains its stable distribution.
The time course of the redevelopment of the FRT is
controlled largely by the rate at which the cross-bridge
Tension responses of relaxed skeletal muscleJ. Physiol. 510.3 955
Figure 13. Three-component model. A, parallel elastic and cross-bridge components in
conjunction with a series elastic component.B,mathematical definitions
A, the series elastic component represents the tendon attachments. The parallel elastic component
represents the effect of the sarcolemma, sarcoplasmic reticulum, titin filaments and other passive structures
within the sarcomere. The parallel and series components are modelled as linear springs. The cross-bridge
component is more complicated and simulates the cross-bridge interactions between actin and myosin
filaments in a half-sarcomere. It acts both as a tension generator and a short-range elastic element.B, the
model’s state is defined by the parallel component lengthXp, the parallel component stiffnesskp, the series
component lengthXs, the series component stiffness ks and the cross-bridge forceFcb. The overall lengthX
and tension F are defined in terms of these parameters. The parallel component lengthXp corresponds to
the mean half-sarcomere length of a real muscle.

distribution re-evolves to a symmetrical distribution around
xÑ . The stiffness of the SREC is proportional to the number
of cross-bridges attached between the filaments at any time.
Thus, the SREC and FRT, while sharing a common origin,
redevelop at different rates.
Possible objections to a cross-bridge basis for the SREC.
It has long been known that the size of the SREC is not
proportional to filament overlap (Hill, 1968). This observation
has been used to suggest that the SREC cannot arise from a
cross-bridge mechanism (Sandow, 1970). Experimental
evidence shows that the SREC stiffness and tension actually
peak in frog muscle fibres at a sarcomere length of around
3 ìm (Haugen & Sten-Knudsen, 1981) rather than around
2·2 ìm where maximal active tension is generated. This is
despite the fact that filament overlap is reduced to around
50% of its maximum value at 3 ìm. If cross-bridge activity
in relaxed muscle was only proportional to the number of
actin binding sites within interacting range of cross-bridge
heads, then the size of a cross-bridge-generated SREC
would scale directly with filament overlap. However, at low
Ca¥ concentrations the sarcomere length for optimal tension
generation is increased to around 3 ìm (Endo, 1973). This
length would lie on the descending limb of the length—
tension relationship obtained during maximal activation
and suggests that the number of active cross-bridges at low
Ca¥ concentrations is not simply proportional to filament
overlap. The length sensitivity of the contractile apparatus
to Ca¥ has been reviewed by Stephenson & Wendt (1984).
The increase in calcium sensitivity at long sarcomere
lengths may be a consequence of a number of mechanisms,
e.g. length-dependent changes in myofilament lattice
spacing or the differential distribution of troponin-C affinity
for Ca¥ along the thin filament (Martyn, Coby, Huntsman &
Gordon, 1993). Thus the overlap dependence of a cross-
bridge-generated SREC may be quite different from that of
active tension.
Similar uncertainties complicate the analysis of experiments
utilizing 2,3-butanedione 2-monoxime (BDM). BDM is
believed to depress, reversibly, actively generated tension
both by reducing calcium release and by suppressing cross-
bridge cycling. The mode of action appears to be different in
different muscles and in those of different species (Lyster &
Stephenson, 1995). BDM does not appear to influence the
tension response of relaxed rat skeletal muscle to stretch
(Mutungi & Ranatunga, 1996b). Before clear conclusions can
be drawn from this result it is vital that the precise mode of
action of BDM, whether through its effect on calcium release
or on cross-bridge cycling, is established in rat skeletal
muscle. If BDM mainly affects calcium release in activated
muscle this may not significantly change resting calcium
levels in relaxed muscle. Alternatively, if BDM only stops a
proportion of bound cross-bridges undergoing a power-
stroke and generating tension it may not have a significant
effect on the SREC.
Hill (1968) concluded that since the SREC was considerably
less stiff than either the tendons or the sliding filaments ‘the
material responsible for the elastic response must be located
between the filaments’. Strictly speaking, Hill’s argument
does not lead inevitably to this conclusion and the SREC
response could, in principle, arise from any connection
between the Z-lines of the sarcomere. The significance of
this clarification is increased following recent suggestions
(Mutungi & Ranatunga, 1996a,b; Linke et al. 1996; Bartoo
et al. 1997) that the visco-elastic properties of relaxed
skeletal muscle are dominated by titin filaments (the
exceptionally large proteins which link the thick myosin
filaments to their adjacent Z-lines).
We believe that titin filaments may bear a substantial
portion of the resting tension at long sarcomere lengths
(Horowits, Kempner, Bisher & Podolsky, 1986; Keller, 1997)
but cannot wholly account for the properties of the SREC
and FRT described in this paper. The evidence supporting
this viewpoint is compelling. First, if titin controlled the
mechanical history-dependent FRT, it would have to bear
tension at the short (•2·2 ìm) sarcomere lengths at which
the present experiments were performed. The experimental
evidence suggests that this is not the case. Radiation-
induced damage to titin causes a dose-dependent reduction
in the resting tension of rabbit psoas muscles stretched
beyond a sarcomere length of 2·6 ìm but does not affect the
mean sarcomere length of a slack fibre (Horowitset al. 1986).
Furthermore, the segmental extension model (Wang,
McCarter, Wright, Beverley & Ramirez-Mitchell, 1991)
suggests that titin behaves as a dual-stage molecular spring
so that moderate stretches extend theI-band portion of titin
with an accompanying exponential rise in tension (Linkeet
al. 1996). However, Wang et al. (1991) reported that skeletal
muscles fibres showed no significant increase in passive
resting tension below sarcomere lengths of 2·5 ìm. These
findings imply that titin does not normally contribute to
passive resting tension near slack length. Secondly, if titin
produced the biphasic SREC tension response it would have
to be disproportionately stiff for small movements. Titin
would have to have the characteristics of a softening spring.
Again, the present experimental evidence is not consistent
with this behaviour. Recent experiments (Tskhovrebova,
Trinick, Sleep & Simmons, 1997) in which the force—
extension relationship of a single titin molecule was
measured using an optical-tweezers technique show that
titin behaves as a non-linear stiffening elastic element for
dynamic stretches. Tskhovrebova et al. (1997) interpreted
their results as suggesting that at short lengths, the I-band
region of titin adopted a random-coil configuration. Imposed
stretches first straightened the molecule and then extended
the polypeptide chain of the PEVK region (Tskhovrebova &
Trinick, 1997). At extreme stretch lengths, there was the
possibility of the stiffer immunoglobulin domains unfolding
(Labeit & Kolmerer, 1995; Keller, 1997). In summary,
experimental results suggest that during the initial stages of
K. S. Campbell and M. Lakie J. Physiol. 510.3956

an imposed stretch titin produces less resistance to
movement than it does during the latter stages. Titin
molecules thus appear to possess the opposite mechanical
properties to those required to generate the SREC.
An alternative judgement has been reached by Bartooet al.
(1997) who concluded that the passive mechanical properties
(though not specifically the SREC and FRT) of relaxed
skeletal and cardiac muscle fibres were dominated by titin
filaments at all sarcomere lengths. If this is indeed the case,
titin must possess complicated short-range elastic
properties. Bartoo et al. measured the tension response to
sinusoidal length perturbations of varying amplitude. The
apparent stiffness of the myofibrils increased as the size of
the length perturbation was reduced. This amplitude
dependence persisted even when the mean sarcomere length
was increased to a length at which there was ‘negligible
thick and thin filament overlap’ (Bartoo et al. 1997) and the
authors thus concluded that the effect could not be due to
cross-bridge activity. However careful inspection of their
Fig. 1 shows that the proportional increase in stiffness was
greatest at the short sarcomere lengths corresponding to full
filament overlap. (For oscillations ranging from 80 to 5 nm
per half-sarcomere, stiffness increased by 260% at a
sarcomere length of 1·90 ìm. The corresponding increase at
3·61 ìm was just 40%.) This striking dependence on
filament overlap strongly suggests to us that the
phenomenon may be partially attributed to the forcible
detachment of stable cross-bridges by the imposed length
perturbations. The residual 40% increase at long sarcomere
lengths could either arise from titin (as suggested by Bartoo
et al.) or, if there were sarcomere length inhomogeneities,
from a degree of filament overlap in some sarcomeres.
Bartoo et al.’s observations of an increased stiffness for small
movements in myofibrils are very similar to those described
by Buchthal & Kaiser (1951) in intact fibres. If, as we believe
is likely, the increased stiffness for small movements is
synonymous with the SREC, it may arise either from titin
(but see comments above) or from cross-bridges. However,
we entirely agree with Bartoo et al. that the behaviour
cannot arise as a result of weakly binding rapidly cycling
cross-bridges — it is an essential requirement of the Cross-
bridge Population Displacement Mechanism that the
responsible cross-bridges cycle only slowly — see ‘A cross-
bridge basis for the SREC and FRT?’ for further discussion.
Conclusion. We conclude that the SREC and FRT are
manifestations of a low level of cross-bridge activity in
relaxed muscle. Although the proposed dynamics of the
cross-bridge distribution are quite complicated, a useful
simplification is that the initial stage of the tension response
to stretch is dominated by the time at rest, while the latter
stage is dominated by the stretch velocity. The existence of
bonds linking the actin and myosin filaments, and the
presence of a FRT may imply a small but significant energy
consumption in relaxed muscles. The molecular motors of
muscle may be idling rather than switched off when the
muscle is relaxed.
APPENDIX
A cross-bridge population displacement mechanism
The theoretical model presented in this work consists of
three mechanical components: a cross-bridge component, a
parallel elastic component and a series elastic component
(Fig. 13).
It is axiomatic that tension is continuous throughout the
three-component model. Following the nomenclature
defined in Fig. 13, the tension in the muscle is given as
F = ksXs = kpXp + Fcb, (A1)
subject to the constraint that
X = Xp + Xs. (A2)
The thixotropic SREC response arises as a result of time-
dependent changes in the cross-bridge forceFcb. The cross-
bridge force is calculated by simulating the behaviour of
slowly cycling cross-bridges, each of which acts as a linear
spring of stiffness kcb, as the actin and myosin filaments are
displaced relative to each other by interfilamentary
movement. Although in reality cross-bridge interactions
would occur at many sites along the actin and myosin
filaments, the simulation regards all cross-bridge linkages as
equivalent and the state of an individual cross-bridge is
defined solely by its displacement x from the position
corresponding to zero strain.
Under equilibrium conditions the cross-bridges produce a
small force (the FRT) which acts in such a direction as to
increase filament overlap. In this model it is assumed that
the FRT arises as a result of a slight binding asymmetry. It
is hypothesized that under equilibrium conditions cross-
bridges are bound symmetrically around a mean
displacement xÑ so that an undisturbed population of n
attached cross-bridges produces a cross-bridge forcenkcbxÑ.
An alternative explanation for the FRT might be that a
small proportion of the attached cross-bridges undergoes a
power stroke and generates tension as a result of a
conformational change.
Cross-bridges continually attach to and detach from binding
sites on the actin filament. If n(x, t) is defined as the cross-
bridge number density (so that n(x, t)äx represents the
number of cross-bridges attached with displacements
between x and x + äx) it follows that (see for example
Schoenberg, 1985):
�n(x, t)þ
�n(x, t)(–––) = A(x)(N − �n(x, t)�x) − D(x)n(x, t) − (–––)v, (A3)�t x −þ �x t
where A(x) is the attachment rate constant for cross-bridges
binding with displacements between x and x + äx, D(x) is
the corresponding detachment rate constant, N is the total
number of cross-bridges available to interact and v is the
interfilamentary velocity (defined as positive for stretch).
The number density of attached cross-bridgesn(x, t) can be
calculated by integrating eqn (A3) once the initial conditions
have been specified. In turn, the cross-bridge forceFcb(t) can
Tension responses of relaxed skeletal muscleJ. Physiol. 510.3 957
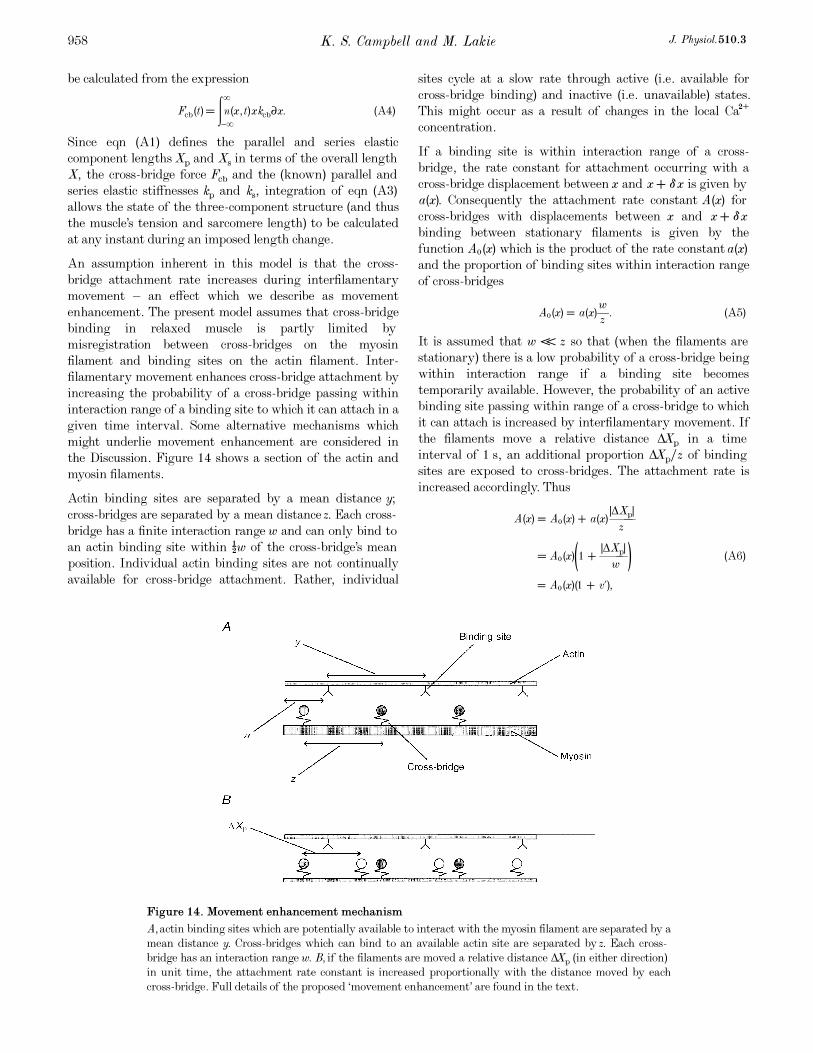
be calculated from the expressionþ
Fcb(t) = �n(x, t)xkcb�x. (A4)−þ
Since eqn (A1) defines the parallel and series elastic
component lengthsXp and Xs in terms of the overall length
X, the cross-bridge force Fcb and the (known) parallel and
series elastic stiffnesses kp and ks, integration of eqn (A3)
allows the state of the three-component structure (and thus
the muscle’s tension and sarcomere length) to be calculated
at any instant during an imposed length change.
An assumption inherent in this model is that the cross-
bridge attachment rate increases during interfilamentary
movement — an effect which we describe as movement
enhancement. The present model assumes that cross-bridge
binding in relaxed muscle is partly limited by
misregistration between cross-bridges on the myosin
filament and binding sites on the actin filament. Inter-
filamentary movement enhances cross-bridge attachment by
increasing the probability of a cross-bridge passing within
interaction range of a binding site to which it can attach in a
given time interval. Some alternative mechanisms which
might underlie movement enhancement are considered in
the Discussion. Figure 14 shows a section of the actin and
myosin filaments.
Actin binding sites are separated by a mean distance y;
cross-bridges are separated by a mean distancez. Each cross-
bridge has a finite interaction rangew and can only bind to
an actin binding site within ½w of the cross-bridge’s mean
position. Individual actin binding sites are not continually
available for cross-bridge attachment. Rather, individual
sites cycle at a slow rate through active (i.e. available for
cross-bridge binding) and inactive (i.e. unavailable) states.
This might occur as a result of changes in the local Ca¥
concentration.
If a binding site is within interaction range of a cross-
bridge, the rate constant for attachment occurring with a
cross-bridge displacement betweenx and x + äx is given by
a(x). Consequently the attachment rate constant A(x) for
cross-bridges with displacements between x and x + äx
binding between stationary filaments is given by the
function AÑ(x) which is the product of the rate constanta(x)
and the proportion of binding sites within interaction range
of cross-bridges
wAÑ(x) = a(x)–. (A5)
z
It is assumed that w << z so that (when the filaments are
stationary) there is a low probability of a cross-bridge being
within interaction range if a binding site becomes
temporarily available. However, the probability of an active
binding site passing within range of a cross-bridge to which
it can attach is increased by interfilamentary movement. If
the filaments move a relative distance ÄXp in a time
interval of 1 s, an additional proportion ÄXpÏz of binding
sites are exposed to cross-bridges. The attachment rate is
increased accordingly. Thus
|ÄXp|A(x) = AÑ(x) + a(x)–––
z
|ÄXp|= AÑ(x)(1 + –––) (A6)
w
= AÑ(x)(1 + v'),
K. S. Campbell and M. Lakie J. Physiol. 510.3958
Figure 14. Movement enhancement mechanism
A, actin binding sites which are potentially available to interact with the myosin filament are separated by a
mean distance y. Cross-bridges which can bind to an available actin site are separated byz. Each cross-
bridge has an interaction rangew. B, if the filaments are moved a relative distance ÄXp (in either direction)
in unit time, the attachment rate constant is increased proportionally with the distance moved by each
cross-bridge. Full details of the proposed ‘movement enhancement’ are found in the text.
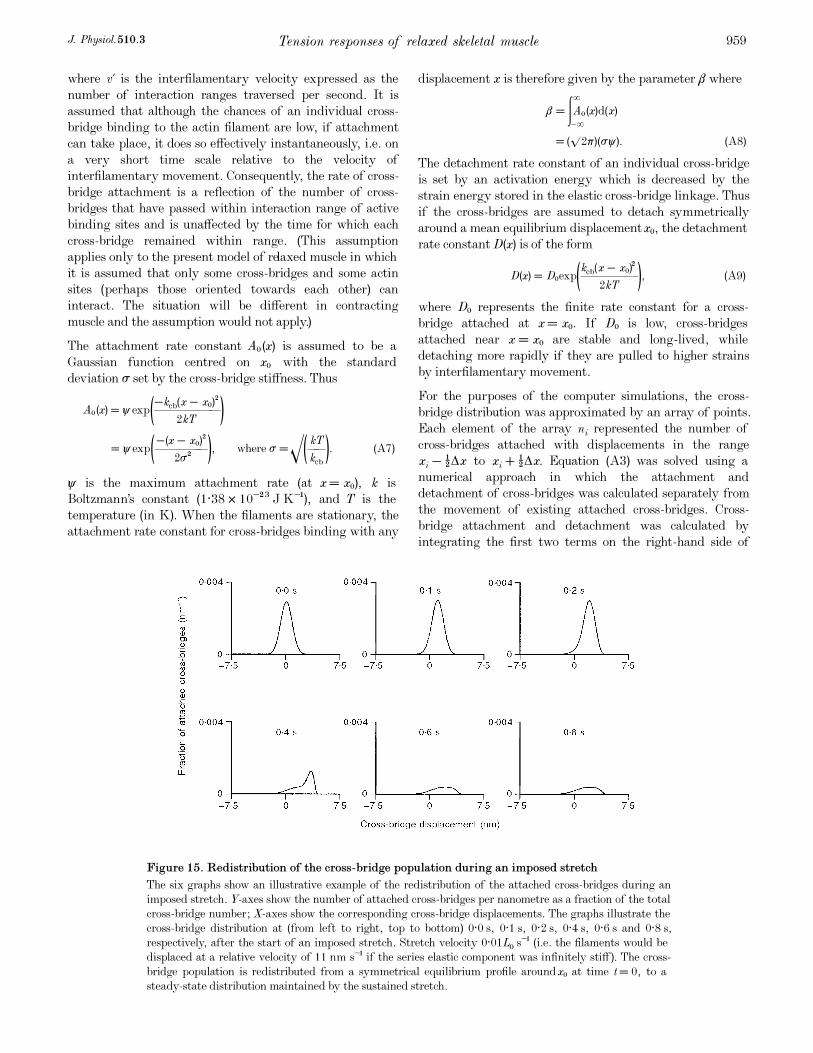
where v' is the interfilamentary velocity expressed as the
number of interaction ranges traversed per second. It is
assumed that although the chances of an individual cross-
bridge binding to the actin filament are low, if attachment
can take place, it does so effectively instantaneously, i.e. on
a very short time scale relative to the velocity of
interfilamentary movement. Consequently, the rate of cross-
bridge attachment is a reflection of the number of cross-
bridges that have passed within interaction range of active
binding sites and is unaffected by the time for which each
cross-bridge remained within range. (This assumption
applies only to the present model of relaxed muscle in which
it is assumed that only some cross-bridges and some actin
sites (perhaps those oriented towards each other) can
interact. The situation will be different in contracting
muscle and the assumption would not apply.)
The attachment rate constant AÑ(x) is assumed to be a
Gaussian function centred on xÑ with the standard
deviation ó set by the cross-bridge stiffness. Thus
−kcb(x − xÑ)ÂAÑ(x) = øexp(––––––)
2kT
−(x − xÑ)Â kT= øexp(–––––), where ó =�(––). (A7)
2óÂ kcb
ø is the maximum attachment rate (at x = xÑ), k is
Boltzmann’s constant (1·38 ² 10¦ÂÅ J K¢), and T is the
temperature (in K). When the filaments are stationary, the
attachment rate constant for cross-bridges binding with any
displacement x is therefore given by the parameter â whereþ
â = �AÑ(x)d(x)−þ
= (�2ð)(óø). (A8)
The detachment rate constant of an individual cross-bridge
is set by an activation energy which is decreased by the
strain energy stored in the elastic cross-bridge linkage. Thus
if the cross-bridges are assumed to detach symmetrically
around a mean equilibrium displacementxÑ, the detachment
rate constantD(x) is of the form
kcb(x − xÑ)ÂD(x) = DÑexp(–––––), (A9)
2kT
where DÑ represents the finite rate constant for a cross-
bridge attached at x = xÑ. If DÑ is low, cross-bridges
attached near x = xÑ are stable and long-lived, while
detaching more rapidly if they are pulled to higher strains
by interfilamentary movement.
For the purposes of the computer simulations, the cross-
bridge distribution was approximated by an array of points.
Each element of the array ni represented the number of
cross-bridges attached with displacements in the range
xi − ½Äx to xi + ½Äx. Equation (A3) was solved using a
numerical approach in which the attachment and
detachment of cross-bridges was calculated separately from
the movement of existing attached cross-bridges. Cross-
bridge attachment and detachment was calculated by
integrating the first two terms on the right-hand side of
Tension responses of relaxed skeletal muscleJ. Physiol. 510.3 959
Figure 15. Redistribution of the cross-bridge population during an imposed stretch
The six graphs show an illustrative example of the redistribution of the attached cross-bridges during an
imposed stretch. Y-axes show the number of attached cross-bridges per nanometre as a fraction of the total
cross-bridge number;X-axes show the corresponding cross-bridge displacements. The graphs illustrate the
cross-bridge distribution at (from left to right, top to bottom) 0·0 s, 0·1 s, 0·2 s, 0·4 s, 0·6 s and 0·8 s,
respectively, after the start of an imposed stretch. Stretch velocity 0·01LÑ s¢ (i.e. the filaments would be
displaced at a relative velocity of 11 nm s¢ if the series elastic component was infinitely stiff). The cross-
bridge population is redistributed from a symmetrical equilibrium profile aroundxÑ at time t = 0, to a
steady-state distribution maintained by the sustained stretch.

eqn (A3) using Euler’s method (Press, Teukolsky, Vetterling
& Flannery, 1992) with an iterative time step Ät. The
movement of existing attached cross-bridges was controlled
by calculating the interfilamentary movement which
occurred during each time step and shifting the array
elements ni by an appropriate number of places in the
requisite direction. This procedure helped to minimize the
effect of truncation errors inherent in the computational
procedures. The attachment and detachment rate constants
were considered constant within the interval Äx. In the
majority of simulations presented in this work
Äx = 0·0075 nm and Ät = 1 ms. Simulations were always
performed with Äx and Ät sufficiently small that further
reductions did not affect the numerical results of the
computer simulations. The resting length of the fibre was
assumed to correspond to a mean sarcomere length of
2·20 ìm.
Figure 15 shows an illustrative example of the redistribution
of the cross-bridge population during an imposed stretch
from the stable equilibrium profile to the skewed but steady-
state distribution maintained by the sustained inter-
filamentary movement.
The model is summarized in Table 1.
Preliminary simulations revealed that thethixotropic nature
of the SREC tension response was not critically dependent
on the precise manner in which the attachment and
detachment rate constants varied as functions of the cross-
K. S. Campbell and M. Lakie J. Physiol. 510.3960
––––––––––––––––––––––––––––––––––––––––––––––––––––––––––––––––––––––––––––––––––––––––––––
Table 1. Propositions of the Cross-bridge Population Displacement Mechanism
––––––––––––––––––––––––––––––––––––––––––––––
(1) In a relaxed muscle, the actin and myosin filaments arelinked by a relatively small number of cross-
bridges, each of which behaves as a linear spring for both extension and compression.
(2) Only cross-bridges with displacements corresponding to a defined interaction range can bind between
the filaments.
(3) The attachment probability is increased by interfilamentary movement.
(4) Unstrained cross-bridges are stable and relatively long-lived, whereas cross-bridges with high strains
detach more rapidly.
(5) Interfilamentary displacement skews the cross-bridge distribution.
(6) The mean cross-bridge displacement of an undisturbed population is slightly positive. This bias
produces a force which acts to increase filament overlap and contributes to the muscle’s resting
tension.
––––––––––––––––––––––––––––––––––––––––––––––––––––––––––––––––––––––––––––––––––––––––––––
Table 2. Model parameters
––––––––––––––––––––––––––––––––––––––––––––––
Parameter Definition Value Units
––––––––––––––––––––––––––––––––––––––––––––––
kcb Cross-bridge stiffness 3·0 ² 10¦Å N m¢
kp Parallel elastic component stiffness 3·0 ² 1011 a
Nm¢ per m fibre area
ks Series elastic component stiffness 1·5 ² 1013 a
Nm¢ per m fibre area
xÑ Binding asymmetry 1·0 ² 10¢Àb
m
w Interaction width 3·0 ² 10¦Íc
m
â Attachment rate constant 0·001 s¢
DÑ Detachment rate constant 0·12 s¢
N Cross-bridge number density 5 ² 1016 d
m¦Â per half-sarcomere
k Boltzmann’s constant 1·38 ² 10¦Â3
J K¢
T Temperature 278 K
––––––––––––––––––––––––––––––––––––––––––––––a
kp and ks were assumed to be proportional to the cross-sectional area of the preparation. The value ofkp
was chosen to produce an appropriate rise in tension beyond the elastic limit relative to the cross-bridge
response.b
xÑ was chosen to produce a FRT which was a comparable proportion of the SREC tension
response to that evident from the experimental results.c
With a Gaussian attachment rate constant, the full
interaction width extends to x = ±þ, although the probability of attachment occurring at extreme values
of x is vanishingly small. w (which controls the magnitude of movement enhancement) was arbitrarily set
to 3 nm. This range encompasses 81% of the attachment probability and 94% of the attached cross-bridges
under equilibrium conditions. The parametersy and z (Fig. 14) do not appear explicitly in eqn (6). However,
it is assumed that w << z (only one cross-bridge can interact with a given binding site) and thatw << y
(there is a low probability of a cross-bridge being within interaction range when the filaments are at rest).
With w = 3 nm, the above conditions are satisfied if it is assumed thatz = 43 nm (i.e. the distance between
cross-bridges projecting from the thick filament in the same direction) and thaty = 37 nm (i.e. the distance
separating cross-overs between the two right-handed helical strands of actin; Edman, M�ansson & Caputo,
1997).d
Flitney & Hirst (1978).
––––––––––––––––––––––––––––––––––––––––––––––––––––––––––––––––––––––––––––––––––––––––––––
bridge displacement x. The parameters used in the present
simulations (defined in Table 2) seem plausible but no claim
is made that they produce the optimal fit with the
experimental data.
Bagni, M. A., Cecchi, G., Colomo, F. & Garzella, P. (1992). Are
weakly binding bridges present in resting intact muscle fibers?
Biophysical Journal 63, 1412—1415.
Bagni, M. A., Cecchi, G., Colomo, F. & Garzella, P. (1995).
Absence of mechanical evidence for attached weakly binding cross-
bridges in frog relaxed muscle fibres. Journal of Physiology 482,391—400.
Bartoo, M. L., Linke, W. A. & Pollack, G. H. (1997). Basis of
passive tension and stiffness in isolated rabbit myofibrils.AmericanJournal of Physiology 273, C266—276.
Bershitsky, S. Y., Tsturyan, A. K., Bershitskaya, O. N.,
Mashanov, G. I., Brown, P., Burns, R. & Ferenczi,M. A. (1997).
Muscle force is generated by myosin heads stereospecifically
attached to actin. Nature 388, 186—190.
Brenner, B. (1990). Muscle mechanics and biochemical kinetics. In
Molecular Mechanisms in Muscular Contraction, ed. Squire, J. M.,pp. 77—150. Macmillan Press, London.
Brenner, B., Schoenberg, M., Chalovich, J. M., Greene, L. E. &
Eisenberg, E. (1982). Evidence for cross-bridge attachment in
relaxed muscle at low ionic strength. Proceedings of the NationalAcademy of Sciences of the USA79, 7288—7291.
Buchthal, F. & Kaiser, E. (1951). The rheology of the cross striated
muscle fibre with particular reference to isotonic conditions. DetKongelige Danske Videnskabernes Selskab Biologiske Meddelser,Copenhagen 21, 1—307.
Campbell, K. S. & Lakie, M. (1995a). Tension responses to imposed
length changes in isolated relaxed muscle fibre bundles fromRanatemporaria. Journal of Physiology 487.P, 155—156P.
Campbell, K. S. & Lakie, M. (1995b). Can the short range elastic
component and thixotropy both be due to cross-bridge activity in
relaxed muscle? Journal of Physiology 491.P, 130—131P.
Campbell, K. S. & Lakie, M. (1996). Sarcomere length measurement
during thixotropic tension responses in relaxed amphibian muscle.
Journal of Physiology 495.P, 162P.
Edman, K. A. P., M�ansson, A. & Caputo, C. (1997). The biphasic
force—velocity relationship in frog muscle fibres and its evaluation in
terms of cross-bridge function. Journal of Physiology 503,141—156.
Endo, M. (1973). Length dependence of activation of skinned muscle
fibres by calcium. Cold Spring Harbour Symposium on QuantitativeBiology 37, 505—510.
Endo, M. (1992). The calcium-induced calcium release mechanism in
skeletal muscle and its modification by drugs. In MuscularContraction, ed. Simmons, R. M., pp. 67—82. Cambridge UniversityPress, Cambridge.
Flitney, F. W. & Hirst, D. G. (1978). Filament sliding and energy
absorbed by the cross-bridges in active muscle subjected to cyclical
length changes. Journal of Physiology 276, 467—479.
Grillner, S. (1972). The role of muscle stiffness in meeting the
changing postural and locomotor requirements for force
development by the ankle extensors.Acta Physiologica Scandinavica86, 92—108.
Halpern, W. & Moss, R. L. (1976). Elastic modulus and stress
relationships in stretched and shortened frog sartorii. AmericanJournal of Physiology 230, 205—210.
Haugen, P. & Sten-Knudsen, O. (1981). The dependence of the
short-range elasticity on sarcomere length in resting isolated frog
muscle fibres. Acta Physiologica Scandinavica 112, 113—120.
Helber, R. (1980). Elastic and inelastic behaviour of resting frog
muscle fibres. Pfl�ugers Archiv 387, 261—268.
Herbst, M. (1976). Studies on the relation between latency relaxation
and resting cross-bridges of frog skeletal muscle. Pfl�ugers Archiv364, 71—76.
Hill, A. V. (1952). The thermodynamics of elasticity in resting
striated muscle. Proceedings of the Royal SocietyB 139, 464—497.
Hill, D. K. (1968). Tension due to interaction between the sliding
filaments in resting striated muscle. The effect of stimulation.
Journal of Physiology 199, 637—684.
Horowits, R., Kempner, E. S., Bisher, M. E. & Podolsky, R. J.
(1986). A physiological role for titin and nebulin in skeletal muscle.
Nature 323, 160—164.
Hufschmidt, A. & Schwaller, I. (1987). Short-range elasticity and
resting tension of relaxed human lower leg muscles. Journal ofPhysiology 391, 451—465.
Huxley, A. F. (1957). Muscle structure and theories of contraction.
Progress in Biophysics and Biophysical Chemistry7, 255—318.
Isaacson, A. (1969). Caffeine-induced contractures and related
calcium movements of muscle in hypertonic media.Experientia 25,1263—1265.
Julian, F. J. (1971). The effect of calcium on the force—velocity
relation of briefly glycerinated frog muscle fibres. Journal ofPhysiology 218, 117—145.
Keller, T. C. S. III (1997). Molecular bungees. Nature 387, 233—235.
Labeit, S. & Kolmerer, B. (1995). Titins: Giant proteins in charge of
muscle ultrastructure and elasticity. Science 270, 293—296.
L�annergren, J. (1971). The effect of low-level activation on the
mechanical properties of isolated frog muscle fibers. Journal ofGeneral Physiology 58, 145—162.
L�annergren, J. & Noth, J. (1973). The effect of bathing solution
tonicity on resting tension in frog muscle fibers. Journal of GeneralPhysiology 62, 737—755.
Lakie, M. & Robson, L. G. (1988a). Thixotropy: the effect of stretchsize in relaxed frog muscle. Quarterly Journal of ExperimentalPhysiology 73, 127—129.
Lakie, M. & Robson, L. G. (1988b). Thixotropy: stiffness recoveryrate in relaxed frog muscle. Quarterly Journal of ExperimentalPhysiology 73, 237—239.
Lakie, M. & Robson, L. G. (1990). Thixotropy in frog single muscle
fibres. Experimental Physiology 75, 123—125.
Lakie, M., Walsh, E. G. & Wright, G. W. (1984). Resonance at the
wrist demonstrated by the use of a torque motor: an instrumental
analysis of muscle tone in man. Journal of Physiology 353,265—285.
Linke, W. A., Bartoo, M. L., Ivemeyer, M. & Pollack, G. H.
(1996). Limits of titin extension in single cardiac myofibrils.Journalof Muscle Research and Cell Motility 17, 425—438.
Lombardi, V. & Piazzesi, G. (1990). The contractile response during
steady lengthening of stimulated frog muscle fibres. Journal ofPhysiology 431, 141—171.
Lyster, D. J. K. & Stephenson, D. G. (1995). Contractile activation
and measurements of intracellular Ca¥ concentration in cane toad
twitch fibres in the presence of 2,3-butanedione monoxime.
Experimental Physiology 80, 543—560.
McMahon, T. A. (1984). Muscles, Reflexes, and Locomotion,pp. 155—160. Princeton University Press, Princeton.
Tension responses of relaxed skeletal muscleJ. Physiol. 510.3 961
Martyn, D. A., Coby, R., Huntsman, L. L. & Gordon, A. M. (1993).
Force—calcium relations in skinned twitch and slow-tonic frog
muscle fibres have similar sarcomere length dependencies. Journalof Muscle Research and Cell Motility 14, 65—75.
Moss, R. L., Sollins, M. R. & Julian, F. J. (1976). Calcium
activation produces a characteristic response to stretch in both
skeletal and cardiac muscle.Nature 260, 619—621.
Mutungi, G. & Ranatunga, K. W. (1996a). The viscous, viscoelasticand elastic characteristics of resting fast and slow mammalian (rat)
muscle fibres. Journal of Physiology 496, 827—836.
Mutungi, G. & Ranatunga, K. W. (1996b). The visco-elasticity of
resting intact mammalian (rat) fast muscle fibres.Journal of MuscleResearch and Cell Motility 17, 357—364.
Press, W. H., Teukolsky, S. A., Vetterling, W. T. & Flannery,
B. P. (1992). Numerical Recipes in C — The Art of ScientificComputing, pp. 707—724. Cambridge University Press, Cambridge.
Robson, L. G. (1990). Thixotropic and time dependent mechanical
properties of relaxed skeletal muscles of the frogRana temporaria.PhD Thesis, University of St Andrews.
R�uegg, J. C. (1992). Calcium in Muscle Contraction, 2nd edn, p. 62.
Springer-Verlag, Berlin.
Sandow, A. (1970). Skeletal muscle. Annual Review of Physiology 32,87—138.
Schoenberg, M. (1985). Equilibrium muscle cross-bridge behavior.
Theoretical considerations. Biophysical Journal 48, 467—475.
Schoenberg, M. (1988). Characterization of the myosin adenosine
triphosphate (M.ATP) crossbridge in rabbit and frog skeletal muscle
fibers. Biophysical Journal 54, 135—148.
Stephenson, D. G. & Wendt, I. R. (1984). Length dependence of
changes in sarcoplasmic calcium and myofibrillar calcium sensitivity
in striated muscle fibres. Journal of Muscle Research and CellMotility 5, 243—272.
Tregear, R. T., Townes, E., Gabriel, J. & Ellington, C. (1993).
Inferences concerning crossbridges from work on insect flight
muscle. InMechanism of Myofilament Sliding in Muscle Contraction,ed. Sugi, H. & Pollack, G. H., pp. 557—565. Plenum Press, New
York.
Tskhovrebova, L. & Trinick, J. (1997). Direct visualization of
extensibility in isolated titin molecules. Journal of MolecularBiology 265, 100—106.
Tskhovrebova, L., Trinick, J., Sleep, J. A. & Simmons, R. M.
(1997). Elasticity and unfolding of single molecules of the giant
muscle protein titin. Nature 387, 308—312.
Wang, K., McCarter, R., Wright, J., Beverley, J. & Ramirez-
Mitchell, R. (1991). Regulation of skeletal muscle stiffness and
elasticity by titin isoforms: A test of the segmental extension model
of resting tension. Proceedings of the National Academy of Sciencesof the USA 88, 7101—7105.
Acknowledgements
K.S.C. was supported by aWellcome Prize Studentship.
Corresponding author
M. Lakie: Applied Physiology Research Group, School of Sport and
Exercise Sciences, University of Birmingham, Birmingham
B15 2TT, UK.
Email: m.d. [email protected]
Author’s present address
K. S. Campbell: Department of Physiology, 1300 University
Avenue, University of Wisconsin-Madison, Madison, WI 53706,
USA.
K. S. Campbell and M. Lakie J. Physiol. 510.3962