AcqDemo Pay Pool Analysis Tool (PAT) User...
30
AcqDemo Pay Pool Analysis Tool (PAT) User Guide December 2014 The spreadsheet is a Microsoft Excel workbook called PAT 2014 v1.0 consisting of eighteen tabbed worksheets. The PAT was created for AcqDemo to analyze the results of the pay pool process; it provides a view across pay pools. AcqDemo Personnel Policy Boards may use this tool to analyze aggregated pay pool results. Individual pay pool managers may benefit by using the PAT to review results also as it offers an analysis that goes beyond the functions of the Compensation Management Spreadsheet (CMS). This user guide details how to use the functionalities of the PAT and describes the available reports. The seventeen tabbed worksheets are described in this document in the order in which they appear along the bottom of the workbook. Page Getting Started…………………………………….....2 Instructions Worksheet….............................................4 Data Worksheet……………………………................7 Statistics Worksheet………………………………….10 Rating Statistics Worksheet………………………….11 Distribution by Group Worksheet……………………12 Zone Distribution by Group Worksheet………….......13 Payout Statistics Worksheet...………………………..14 Payout Charts Worksheet…………………………….15 Payout Stats by Group Worksheet………………..….16 Payout Charts by Group Worksheet…………………17 Payout Charts by Wildcard Worksheet……………...18 Funding Statistics Worksheet………………………..19 Funding Charts Worksheet…………………………..20 Net Draw Analysis Worksheet………………………21 Net Draw Charts Worksheet………………………...22 CP-PB Counts Worksheet…………………………...23 Salary Worksheet………………………………….....24 Rail Report Worksheet………………………………25 Generating an Aggregate Report…………………….26 Copying and Pasting into PowerPoint and Excel…....27 Prepared by: SRA International, Inc. 1777 Northeast Loop 410, Suite 510 San Antonio, TX 78217 The views, opinions, and findings contained in this document are those of the authors and should not be construed as an official Department of Defense position, policy, or decision unless so designated by other official documentation.
Transcript of AcqDemo Pay Pool Analysis Tool (PAT) User...

AcqDemo Pay Pool Analysis Tool (PAT)
User Guide
December 2014
The spreadsheet is a Microsoft Excel workbook called PAT 2014 v1.0 consisting of eighteen
tabbed worksheets. The PAT was created for AcqDemo to analyze the results of the pay pool
process; it provides a view across pay pools. AcqDemo Personnel Policy Boards may use this
tool to analyze aggregated pay pool results. Individual pay pool managers may benefit by using
the PAT to review results also as it offers an analysis that goes beyond the functions of the
Compensation Management Spreadsheet (CMS). This user guide details how to use the
functionalities of the PAT and describes the available reports. The seventeen tabbed worksheets
are described in this document in the order in which they appear along the bottom of the
workbook.
Page
Getting Started…………………………………….....2
Instructions Worksheet….............................................4
Data Worksheet……………………………................7
Statistics Worksheet………………………………….10
Rating Statistics Worksheet………………………….11
Distribution by Group Worksheet……………………12
Zone Distribution by Group Worksheet………….......13
Payout Statistics Worksheet...………………………..14
Payout Charts Worksheet…………………………….15
Payout Stats by Group Worksheet………………..….16
Payout Charts by Group Worksheet…………………17
Payout Charts by Wildcard Worksheet……………...18
Funding Statistics Worksheet………………………..19
Funding Charts Worksheet…………………………..20
Net Draw Analysis Worksheet………………………21
Net Draw Charts Worksheet………………………...22
CP-PB Counts Worksheet…………………………...23
Salary Worksheet………………………………….....24
Rail Report Worksheet………………………………25
Generating an Aggregate Report…………………….26
Copying and Pasting into PowerPoint and Excel…....27
Prepared by:
SRA International, Inc.
1777 Northeast Loop 410, Suite 510
San Antonio, TX 78217
The views, opinions, and findings contained in this document are those of the authors and should not be
construed as an official Department of Defense position, policy, or decision unless so designated by other
official documentation.

2
Getting Started
The PAT workbook may be downloaded from the Pay Pool Notices section of CAS2Net located
at https://acqdemoii.army.mil/. User access to CAS2Net is authenticated by DoD’s e-
Authentication system upon log-in.
Enable Macros
The macros must be enabled each time you open the spreadsheet in order for the functions to
operate correctly. When opening the spreadsheet, you will likely receive a Security Warning.
Select “Enable Content” to enable the macros.
Add-Ins Menu Bar
The PAT has a custom tool bar that appears at the top of each worksheet. Click on the “Add-ins”
tab on the menu to view the options for displaying, organizing and printing data.
Import – Import data using this button or the “Import” link on the Instructions worksheet.
Hide Column – The user may hide columns from view by selecting any cell in the columns to be
hidden and then clicking on this button. Single columns are selected by clicking on any cell in
2014 v1

3
the column. Multiple columns are selected by holding down the <Ctrl> key while clicking on
any cells in the columns. A range of columns is selected by clicking and dragging across any
row of cells in the range of columns. The first two columns (A and B) cannot be hidden by this
method.
Unhide Column – Clicking this button will unhide columns you have just hidden as long as you
have not moved the cursor. You can also unhide a specific column or range of columns by
highlighting cells in the columns on either side of the hidden column or range of columns, and
then clicking this button.
Unhide All Columns – This button restores to view all hidden columns.
Hide Row – The user may hide rows from view by selecting any cell in the row or rows to be
hidden and then clicking on this button. A single row is selected by clicking on any cell in the
row. Multiple rows are selected by holding down the <Ctrl> key while clicking on any cells in
the rows. A range of rows is selected by clicking and dragging up or down any column of cells.
Unhide Row – Clicking this button will unhide rows you have just hidden as long as you have
not moved the cursor. You can also unhide a specific row or range of rows by highlighting cells
in the rows on either side of the hidden rows or range of rows, and then clicking this button.
Unhide All Rows – This button restores to view all hidden rows.
Clear All Filters – This button clears all filters you have set, including filters on worksheets
other than the one you are currently on. You cannot import data into the workbook with filters
set. When you click the “Import” link on the Contents sheet, all filters are automatically cleared.
Sort – Allows the user to sort the rows in the worksheet by any combination of up to three
columns. Sorts may be in either ascending or descending order. The sorts are specified using
the standard Excel sort function. You must know the letters of the columns you want to sort on
because the column headings cannot be included in the sort range.
Main Menu – This takes you to the Instructions worksheet with quick links to the worksheets.
Wildcard Stats – A window appears allowing you to select the Wildcard columns to be used in
statistical reports. The Wildcard values are pulled from the Data tab.
Customize – You can reorder and rename pay pools with this button. You can also move
Wildcards in the desired order.
Output Charts – Brings up a user form that allows output of any/all chart into Excel or
PowerPoint format. Charts are exported as pictures only.
Generate Aggregate Report – Pay pools provide summary feedback to the workforce. This
button generates a report that displays aggregate data for rail zones, OCS, delta OCS, salary
increases and awards.

4
Instructions Worksheet
The Instructions worksheet (shown below) is the first sheet in the workbook. It provides a brief
description of the workbook, its purpose, and contents. The Import function to upload the data to
be analyzed is initiated on this sheet. The Table of Contents lists the worksheets that are
available to aid in your analysis. You may navigate to each sheet by clicking on the name in the
Table of Contents list or by using the tabs at the bottom of the workbook.
Scroll down the Instructions sheet and you’ll find status information for the data contained in
your workbook, including the last Wildcard analyzed and the names (office symbol and alias if
assigned) of the pay pools currently loaded into the PAT.
2014 v1

5
The pay pool alias name is an option you may use if you are interested in giving your pay pools
more meaningful names. Go to the Add-ins menu bar and select the “Customize” button. Use
the “Rename” feature to assign an alias name.
Import
The PAT initially comes “empty” and must be populated with data by importing one or more
export files from CMS spreadsheets. You may import more than one file at the same time. As a
reminder, all files you want to import must be in the same folder as the PAT.
Use the following steps to import data:
1. Open the PAT and enable the macros.
2. Ensure the CMS export files you want to import are in the same folder as the PAT.
3. Select the Import function on the Instructions worksheet.
4. See the available files listed in the left-hand box in the Import window.

6
5. Double click on the file you want to import or use the double-right facing arrow. This
moves a copy of the file to the right-hand box for import. Repeat for each file you want
to import.
6. Use the “Move up” and “Move down” buttons to reorder your selections. Order the pay
pool files here as you would like to see them displayed in the PAT worksheets.
7. Use the radio buttons to indicate if you want the imported data to replace all existing data
or if you want to append (add) the import file(s) to existing data.
8. Select the “Open” button to import the selected files to the PAT.
9. A pop-up box will appear letting you know the import was successful. Select “Yes” to
save the spreadsheet.
Once you have selected the files, it will take the workbook up to several minutes (depending on
the size of your file) to import the data and run the many macros required to format it properly.
ppNew_to_Master_11_23_2014.cvs ppNew_to_Master_11_23_2014.cvs
ppXYZ_to_Master_11_20_2014.cvs

7
Data Worksheet
The Data worksheet contains pay pool data from the CMS. There are 53 columns in the
worksheet. The columns contain data such as ratings, salary increases and awards that were
calculated during the pay pool process using the CMS. Columns are read-only with the
exception of the Wildcard columns. E1 and E2 displays the number of pay pools and employees
loaded in the PAT.
Wildcard Columns
There are 8 Wildcard columns spaced across the worksheet and they are open for editing.
Wildcards may be used to review subsets of data to aid in your analysis. You may want to
review the results by geographic regions, work teams, or some other criteria not defined by an
existing column on the spreadsheet. Wildcards data that existed in the files you imported will be
available in the PAT.

8
You can change the wildcard groupings used in the PAT by selecting the “Wildcard Stats”
button on the Add-ins menu bar (see above). Only those wildcard columns with data in them
will show as available to use and the others will be grayed out. Click on the Wildcard column to
be used and select “Run Statistics.” You’ll receive a message indicating the action was
successful. Note that you can also remove previously generated statistics by the Wildcard
columns in this box.
Remove Name and ID
You may elect to keep your analysis at the summary level. If so, then names and IDs of
individuals may not be required. You can permanently hide names and IDs by selecting the
“Remove Name and ID” button.

9
A warning pop-up window will ask if you want to continue. Clicking “Yes” will permanently
hide columns A, B and C from the PAT. A box will appear in the upper left-side corner of the
Data worksheet to confirm the names and IDs are securely hidden.

10
Statistics Worksheet
The Statistics worksheet provides the average rating, average delta OCS, number of employees
and number of employees rated by supervisor, sub-panel manager, pay pool and Wildcard if this
option was selected.
11
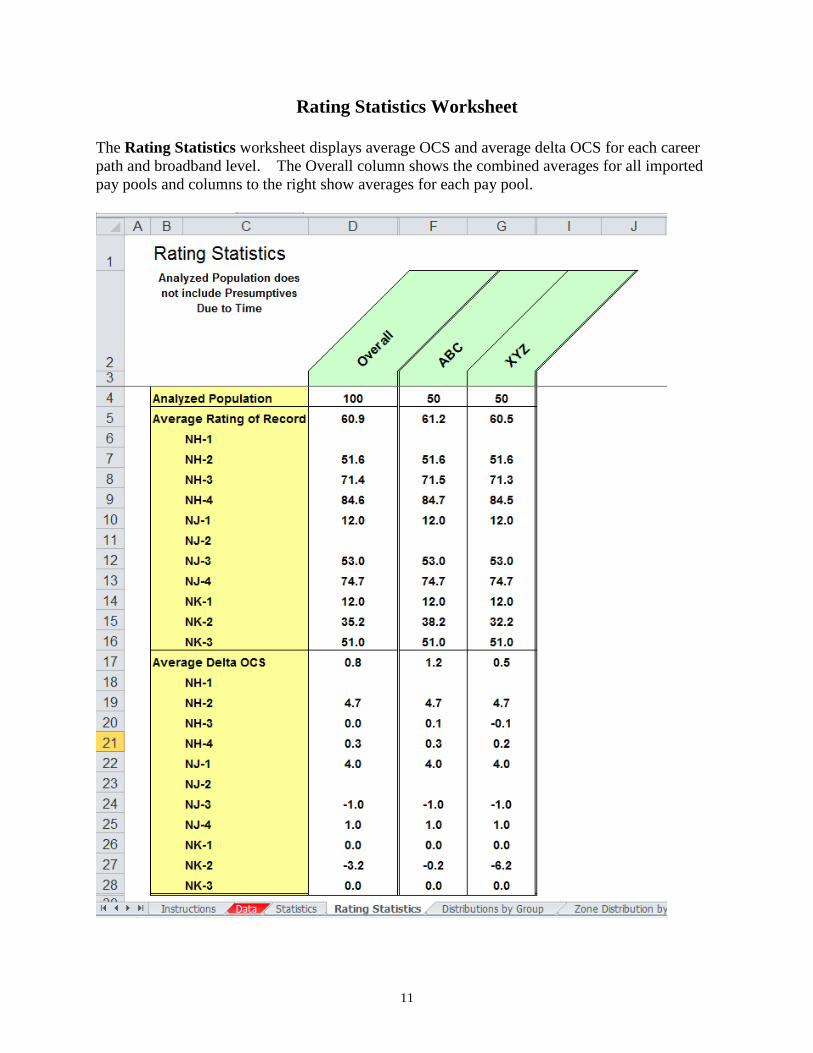
Rating Statistics Worksheet
The Rating Statistics worksheet displays average OCS and average delta OCS for each career
path and broadband level. The Overall column shows the combined averages for all imported
pay pools and columns to the right show averages for each pay pool.

12
Distributions by Group Worksheet
The Distributions by Group worksheet provides counts and percentages of employees by rail
position for various groups. Distributions are shown by pay pool, career path, broadband, career
path/band, Wildcard, and the entire population.
Rail Positions
A = above the upper rail
B = below the lower rail
C1 = above the standard pay line but below the upper rail
C2 = on or below the standard pay line but above the lower rail

13
Zone Distribution by Group Worksheet
The Zone Distribution by Group worksheet displays zone distribution charts by pay pool and
wildcard. The top chart is a bar graph displaying zone distributions overall and by each pay pool
loaded in the PAT. The bottom chart shows the distribution by the Wildcard groupings. Both
charts have a trend line showing the average across the groupings.
Rail Positions
A = above the upper rail
B = below the lower rail
C1 = above the standard pay line but below the upper rail
C2 = on or below the standard pay line but above the lower rail

14
Payout Statistics Worksheet
The Payout Statistics worksheet provides statistics on salary increases, awards and related data
across all pay pools and by each pay pool. The majority of the worksheet provides the
minimum, average, median, and maximum in terms of dollar amounts and percentages for salary
increases and awards. Specifically, the following data elements are provided:
Analyzed Population – Overall and by each individual pay pool loaded in the PAT
Average OCS
Average Delta OCS
Alpha 1 – Percent applied to delta salary to buy back the difference between employees’
current salaries and the target salaries for CRI
Alpha 2 – Percent applied to delta salary to buy back the difference between employees’
current salaries and the target salaries for CA
Salary Increase $ - Minimum (non zero), Average, Median, Maximum
Salary Increase % - Minimum (non zero), Average, Median, Maximum
Flags – Override CRI, Override CA, Disable Rollover, Force Rollover
Control Points – Number with Control Points Entered, Number Stopped at Control Point
Carryover Award $ – Number of Carryover Awards, Minimum (non-zero), Average,
Median, Maximum
Carryover Award % - Minimum (non-zero), Average, Median, Maximum
CA Award $ - Minimum (non-zero), Average, Median, Maximum
CA Award % - Minimum (non-zero), Average, Median, Maximum
Award (Carryover + CA) Total - Minimum (non-zero), Average, Median, Maximum
Award Total % - Minimum (non-zero), Average, Median, Maximum

15
Payout Charts Worksheet
The Payout Charts worksheet displays the payout statistics provided in the Payout Statistics
worksheet in chart form. The charts are bar graphs showing average percent and average dollar
amount by pay pool. A trend line shows the average across pay pools. This worksheet contains
the following charts:
Alpha 1
Alpha 2
Average Salary Increase
Average Carryover Award
Average Contribution Award
Average Total Award

16
Payout Statistics by Group Worksheet
The Payout Statistics by Group worksheet provides statistics on salary increase and award,
both dollar amount and percent, by various groups and Wildcard. Statistics are shown for the
entire population and by pay pool, career path, broadband, career path/band, and Wildcard.

17
Payout Charts by Group Worksheet
The Payout Charts by Group displays bar charts of the statistics ($ and %) provided by Payout
Statistics by Group worksheet. A trend line shows the average across pay pools. This
worksheet contains the following charts:
Average Salary Increase by Career Path
Average Salary Increase by Band
Average Salary Increase by Career Path/Band
Average Total Award by Career Path
Average Total Award by Band
Average Total Award by Career Path/Band
Average Carryover Award by Career Path
Average Carryover Award by Band
Average Carryover Award by Career Path/Band

18
Payout Charts by Wildcard Worksheet
The Payout Charts by Wildcard worksheet displays bar charts of the statistics ($ and %) for the
Wildcard selected for analysis on the Payout Statistics by Group worksheet. A trend line
shows the average across groups. This worksheet contains the following charts:
Average Salary Increase by Wildcard
Average Carryover Award by Wildcard
Average Total Award by Wildcard

19
Funding Statistics Worksheet
The Funding Statistics worksheet provides statistics on funding amounts budgeted and
allocated through the pay pool process. The budget is represented in the Inputs section and the
allocations are represented in the Outputs section. Data is provided across pay pools and by
individual pay pool.
Number of employees and total base salaries are presented at the top of the sheet. A code of
1=Yes and 0=No indicates if CA was used. Inputs include the dollar amount and percent
budgeted for salary increases and awards. Outputs include the approved salary increases/awards
totals and the difference between the budgeted amount and the amount allocated. This section
also provides the percent of total base salary spent on salary increases and carryover and the
percent of adjusted salary spent on awards.

20
Funding Charts Worksheet
The Funding Charts worksheet displays bar charts of the statistics (%) provided by the
Funding Statistics worksheet. A trend line shows the average across pay pools. This worksheet
contains the following charts by pay pool:
Salary Increase (CRI) Funding
CRI Expenditure – carryover amount identified
Award (CA) Funding
Award Expenditure
Alpha 1 (CRI)
Alpha 2 (CA)

21
Net Draw Analysis Worksheet
The Net Draw Analysis worksheet provides a summary of net draw statistics by career
path/band, career path, broadband, Wildcard, and the entire population. This analysis considers
the difference between the amount of an employee’s payout and the dollar amount that was
contributed to the pay pool fund based on the employee’s base salary and the funding criteria.
The formula is as follows:
Net Draw % = (Received – Contribution) / Base Pay
If an employee receives a payout greater than the dollar amount that was contributed to the pay
pool fund as a percent of their base salary, then the net draw is a positive percent. The net draw
percent is a negative if the employee receives a lesser amount in a payout than what was
contributed to the pay pool fund as a percent of their base salary.
Example
An employee earns $60,000. The pay pool is funded at 2% of total base salaries. The employee
contributed $1,200 to the fund which represents 2% of her base salary. The employee received a
$2,000 payout resulting in a positive net draw – she received a greater payout than was her
contribution to the pay pool fund. Had the employee received a $1,000 payout, her net draw
would be a negative percent.
Number of Employees Analyzed

22
Net Draw Charts Worksheet
The Net Draw Charts worksheet displays bar charts of the statistics (%) provided by the Net
Draw Analysis worksheet. This worksheet contains the following charts:
Net Draw by Career Path/Band
Net Draw by Career Path
Net Draw by Band
Net Draw by Wildcard
The bars above the axis are groups that have contributed less in base salary dollars than they
received in payouts. Groups with bars below the axis contributed more than they received in
payouts.

23
CP-BP Counts Worksheet
The CP-BP Counts worksheet displays counts by career path and broadband combinations
overall and by pay pool.

24
Salary Worksheet
The Salary worksheet provides the average salary by career path and broadband for the entire
population and for each pay pool.

25
Rail Report Worksheet
The Rail Report Worksheet displays a report of rail zones and an OCS chart that is used for the
Aggregate Report generated from the Add-Ins menu bar.
You may take a glance at the OCS chart and rail zone distribution on this worksheet for your
information but it is recommended that you use the Generate Aggregate Report function in the
Add-Ins menu bar to create the summary charts to present aggregate data.

26
Generating an Aggregate Report
The Generate Aggregate Report button in the Add-Ins menu bar creates a report that displays
aggregate data for rail zones, OCS, delta OCS, salary increases and awards. When you select
this button, a PowerPoint file opens and you receive a prompt to name and save the file. The
charts are imported into PowerPoint as pictures.
AcqDemo Results FY14
AcqDemo Results FY14

27
Copying and Pasting into PowerPoint and Excel
You can output charts directly from the PAT into PowerPoint presentations and into Excel.
There is an Output Charts function in the Add-Ins menu bar. Using this function ensures charts
placed into the applications are minus the underlying data.
Copying Charts into PowerPoint
To copy charts from the PAT into PowerPoint:
1. Click on the “Output Charts” button in the Add-Ins menu bar. This opens a selection
window listing the available worksheets and charts.
2. Select the worksheet and the specific chart(s) you want to capture.
3. Under Applications Options, select the radio button for “Paste into PowerPoint.”
4. Select the “Export Charts” button. This opens a new PowerPoint file with your selected
charts and a prompt to name and save the file. Charts are imported into PowerPoint as
pictures.

28
Copying Charts into Excel
To copy charts from the PAT into Excel:
1. Click on the “Output Charts” button in the Add-Ins menu bar. This opens a selection
window listing the available worksheets and charts.
2. Select the worksheet and the specific chart(s) you want to capture.
3. Under Applications Options, select the radio button for “Paste into Excel.”
4. Select the “Export Charts” button. This opens an Excel file with your selected charts and
a prompt to name and save the file. Charts are imported into Excel as pictures.

29
Copying Data from Worksheets
You can copy and paste data from the PAT to another Excel file to conduct additional analysis or
to create additional views.
To copy selected data to a new spreadsheet:
1. Select the cells you want to copy.
2. Select “Copy” from the Home menu bar or right click and select “Copy.”
3. Open the spreadsheet you want to copy the data into.
4. Select “Paste Special” from the Home menu bar or right click and select “Paste Special.”
5. Select the “Values” radio button under Paste in the Paste Special window and click
“OK.” The data will be pasted as it exists in the PAT worksheet including any hidden
columns.
6. As an extra step to allow the data to look more presentable in the new location,
immediately select “Paste Special” again and select “Formats.”

30