Acoustic Side-Channel Attacks on Additive Manufacturing...
10
Acoustic Side-Channel Attacks on Additive Manufacturing Systems Mohammad Abdullah Al Faruque, Sujit Rokka Chhetri, Arquimedes Canedo † , Jiang Wan {alfaruqu, schhetri, jiangwan}@uci.edu † [email protected] Department of Electrical Engineering and Computer Science University of California, Irvine, California, USA ABSTRACT Additive manufacturing systems, such as 3D printers, emit sounds while creating objects. Our work demonstrates that these sounds carry process information that can be used to indirectly reconstruct the objects being printed, without re- quiring access to the original design. This is an example of a physical-to-cyber domain attack, where information gath- ered from the physical domain, such as acoustic side-channel, can be used to reveal information about the cyber domain. Our novel attack model consists of a pipeline of audio signal processing, machine learning algorithms, and context-based post-processing to improve the accuracy of the object recon- struction. In our experiments, we have successfully recon- structed the test objects (designed to test the attack model under various benchmark parameters) and their correspond- ing G-codes with an average accuracy for axis prediction of 78.35% and an average length prediction error of 17.82% on a Fused Deposition Modeling (FDM) based additive manu- facturing system. Our work exposes a serious vulnerability in FDM based additive manufacturing systems exploitable by physical-to-cyber attacks that may lead to theft of Intel- lectual Property (IP) and trade secrets. To the best of our knowledge this kind of attack has not yet been explored in additive manufacturing systems. CCS Concepts •Computer systems organization → Embedded and cyber-physical systems; •Security and privacy → Side- channel analysis and countermeasures; Keywords Side-Channel Attack, Security, Additive Manufacturing Sys- tems, 3D Printer, Cyber-Physical Systems 1. INTRODUCTION Additive manufacturing Cyber-Physical Systems (CPSs) fuse materials layer by layer with varying thickness to pro- duce 3D objects. Fused Deposition Modeling (FDM) is one of the technologies used in additive manufacturing, where plastic or metal filaments, heated slightly above its melting temperature, is deposited to construct a 3D object. Due to their capability to rapidly prototype 3D objects in free- form, they provide a cost-effective solution for automated fabrication. Several sectors, such as medical and aerospace, are increasingly adopting the use of these additive manufac- turing systems [1–3]. In addition, agencies like the US Air Force, Navy, and NASA are also incorporating them [2,4,5]. In fact, the revenue of the additive manufacturing industry is expected to exceed $21B by 2020 [6]. As per the IBM 2015 security research report [7], manufac- turing has consistently been among the top three industries facing high security incident rates, with 17.79% of the total incidents in 2014. Attackers who target additive manufac- turing systems are motivated by either industrial espionage of Intellectual Property (IP), alteration of data, or denial of process control [8, 9]. The world economy relies heavily on IP-based industries, which produce and protect their de- signs through IP rights. In the US alone, the IP-intensive industries have been known to account for 34.8% of the U.S. gross domestic product [10]. IP in additive manufacturing consists of the internal and external structure of the object, the process parameters, and the machine specific tuning pa- rameters [11]. To produce a 3D object, design information (which contains IP) is supplied to the manufacturing system in the form of G-code. G-code, a programming language along with M-code, is primarily used to control the system components and parameters such as speed, temperature, and extrusion amount [12]. If these designs are stolen, they can be manipulated to harm the image of the company, or even worse, can cause the company to lose its IP (as it is stolen before production) [13]. Currently, IP theft mainly occurs through the cyber do- main (e.g. Operation Aurora, GhostNet) [14, 15], but IP information can also be leaked through the physical domain (side-channels). A common example of this is to use side- channel information (e.g. timing data, acoustics, power dis- sipation, and electromagnetic emission) from devices per- forming cryptographic computation to determine their se- cret keys [16]. We believe that our work, is the first to perform an acoustic side-channel attack (a physical-to-cyber domain attack) on additive manufacturing, where IP theft can be the final outcome. The main objective of this work is to motivate researchers to incorporate side-channel leakage during the design time [17,18] to secure their CPS. Research Challenges and Our Novel Contributions: One of the challenges for securing CPS is being able to un- derstand the new threats unique to CPS [19]. Our novel contribution aids the CPS security research by providing a new attack methodology not considered earlier in additive manufacturing systems. We contribute by providing: • Analysis of Components Leaking Side-Channel In- formation (Section 3.1) where we show the relationship between the cyber domain data (G-code) and its corre- sponding effect in the physical domain (acoustics) in ad-
Transcript of Acoustic Side-Channel Attacks on Additive Manufacturing...

Acoustic Side-Channel Attacks on Additive ManufacturingSystems
Mohammad Abdullah Al Faruque, Sujit Rokka Chhetri, Arquimedes Canedo†, Jiang Wan{alfaruqu, schhetri, jiangwan}@uci.edu
†[email protected] of Electrical Engineering and Computer Science
University of California, Irvine, California, USA
ABSTRACT
Additive manufacturing systems, such as 3D printers, emitsounds while creating objects. Our work demonstrates thatthese sounds carry process information that can be used toindirectly reconstruct the objects being printed, without re-quiring access to the original design. This is an example ofa physical-to-cyber domain attack, where information gath-ered from the physical domain, such as acoustic side-channel,can be used to reveal information about the cyber domain.Our novel attack model consists of a pipeline of audio signalprocessing, machine learning algorithms, and context-basedpost-processing to improve the accuracy of the object recon-struction. In our experiments, we have successfully recon-structed the test objects (designed to test the attack modelunder various benchmark parameters) and their correspond-ing G-codes with an average accuracy for axis prediction of78.35% and an average length prediction error of 17.82% ona Fused Deposition Modeling (FDM) based additive manu-facturing system. Our work exposes a serious vulnerabilityin FDM based additive manufacturing systems exploitableby physical-to-cyber attacks that may lead to theft of Intel-lectual Property (IP) and trade secrets. To the best of ourknowledge this kind of attack has not yet been explored inadditive manufacturing systems.
CCS Concepts
•Computer systems organization → Embedded andcyber-physical systems; •Security and privacy→ Side-channel analysis and countermeasures;
Keywords
Side-Channel Attack, Security, Additive Manufacturing Sys-tems, 3D Printer, Cyber-Physical Systems
1. INTRODUCTIONAdditive manufacturing Cyber-Physical Systems (CPSs)
fuse materials layer by layer with varying thickness to pro-duce 3D objects. Fused Deposition Modeling (FDM) is oneof the technologies used in additive manufacturing, whereplastic or metal filaments, heated slightly above its meltingtemperature, is deposited to construct a 3D object. Dueto their capability to rapidly prototype 3D objects in free-form, they provide a cost-effective solution for automatedfabrication. Several sectors, such as medical and aerospace,are increasingly adopting the use of these additive manufac-turing systems [1–3]. In addition, agencies like the US Air
Force, Navy, and NASA are also incorporating them [2,4,5].In fact, the revenue of the additive manufacturing industryis expected to exceed $21B by 2020 [6].
As per the IBM 2015 security research report [7], manufac-turing has consistently been among the top three industriesfacing high security incident rates, with 17.79% of the totalincidents in 2014. Attackers who target additive manufac-turing systems are motivated by either industrial espionageof Intellectual Property (IP), alteration of data, or denialof process control [8, 9]. The world economy relies heavilyon IP-based industries, which produce and protect their de-signs through IP rights. In the US alone, the IP-intensiveindustries have been known to account for 34.8% of the U.S.gross domestic product [10]. IP in additive manufacturingconsists of the internal and external structure of the object,the process parameters, and the machine specific tuning pa-rameters [11]. To produce a 3D object, design information(which contains IP) is supplied to the manufacturing systemin the form of G-code. G-code, a programming languagealong with M-code, is primarily used to control the systemcomponents and parameters such as speed, temperature, andextrusion amount [12]. If these designs are stolen, they canbe manipulated to harm the image of the company, or evenworse, can cause the company to lose its IP (as it is stolenbefore production) [13].
Currently, IP theft mainly occurs through the cyber do-main (e.g. Operation Aurora, GhostNet) [14, 15], but IPinformation can also be leaked through the physical domain(side-channels). A common example of this is to use side-channel information (e.g. timing data, acoustics, power dis-sipation, and electromagnetic emission) from devices per-forming cryptographic computation to determine their se-cret keys [16]. We believe that our work, is the first toperform an acoustic side-channel attack (a physical-to-cyberdomain attack) on additive manufacturing, where IP theftcan be the final outcome. The main objective of this work isto motivate researchers to incorporate side-channel leakageduring the design time [17,18] to secure their CPS.Research Challenges and Our Novel Contributions:One of the challenges for securing CPS is being able to un-derstand the new threats unique to CPS [19]. Our novelcontribution aids the CPS security research by providing anew attack methodology not considered earlier in additivemanufacturing systems. We contribute by providing:• Analysis of Components Leaking Side-Channel In-
formation (Section 3.1) where we show the relationshipbetween the cyber domain data (G-code) and its corre-sponding effect in the physical domain (acoustics) in ad-

ditive manufacturing.• Acoustic Attack Model (Section 3.2) which describes
our novel attack methodology. It consists of exploration oftime and frequency domain features, learning algorithmstrained to acquire specific information (axis of movement,speed of the nozzle) about the G-code, and algorithmsused to reconstruct the G-code by reverse engineering.• Additive Manufacturing Context Based Post Pro-
cessing (Section 3.3) which will show how the attackmodel can utilize the information from additive manufac-turing to improve its accuracy for G-code reconstruction.
The rest of the paper is organized as follows: Backgroundand related work is presented in Section 2. Attack method-ology is described in Section 3. Attack model training andevaluation are presented in Section 4. Results and case studyanalysis are provided in Section 5. Challenges and futureworks are discussed in Section 6 before concluding this pa-per in Section 7.
2. BACKGROUND AND RELATED WORK
CAD Tool
STL Files
Slicing Tools
Layer Description
Files
3D Model Design
Printer Firmware
Printing Process
Cyber Domain
Physical Domain
CAD Design Process
CAM Design Process
Manufacturing Process
IP InformationPhysical Attack
Figure 1: Physical Attack during Lifecycle of Additive
Manufacturing Systems.
A typical lifecycle of an additive manufacturing system ispresented in Figure 1. Designers can start their design of3D objects by modeling tools such as Sketchup [20]. Next,a Computer-Aided Design (CAD) tool generates a standardSTereoLithography (STL) for the manufacturing purpose.Computer Aided Manufacturing (CAM) process is then re-quired to slice the STL file into layer-by-layer description file(e.g. G-code, cube, etc.). Then, the layer description file willbe sent to the manufacturing system (e.g. 3D printer) forproduction [12].
In the physical domain of the additive manufacturing,components such as stepper motor, fan, extruder, base plateetc, carry out operations on the basis of information pro-vided by the cyber domain (G-code). In carrying out theoperation, these physical components leak cyber domain in-formation (G-code) from the side-channels, such as acousticand power, which can be used to steal IP by performingphysical-to-cyber domain attack. The issues regarding thetheft of IP and the framework for preventing IP theft havebeen studied in [11, 21]. The study of attack in the pro-cess chain, starting from the 3D object design to its cre-ation, along with a case study of cyber attacks in STL file,is presented in [22]. However, the potential attacks from thephysical domain are not well studied by the existing works.
We have come across some works utilizing the side-channelinformation to gather data related to the cyber domain inother systems. Work in [23] has used the acoustics emanatedfrom the dot matrix printer while printing to recover thetext it was sent to print. Authors in [24] have been able todecode the keys pressed in the Enigma machine by analyz-ing the sound made by the device while pressing the keys.Recently, researchers from MIT have found that even theminor movement of physical devices can leak information
about the cyber domain. In [25], they have successfully re-trieved digital audio being played by capturing the vibrationof objects near a sound source by a high speed camera. Au-thors in [26] have considered using side-channel for providingsecurity but they have not demonstrated any methodologyfor using it to steal the IP.
3. OUR ATTACK METHODOLOGY
i) Audio Speaker ii) Stepper Motor
SS
NN
F
F
S
S
N
Ma
gnet
ic F
ield
F
FRotor
StatorPermanent Magnets
Electromagnets
Figure 2: Motor and Audio Speaker Comparison.
State-of-the-art 3D printers use stepper motors for actu-ating controlled movement. The rotors of these motors arepermanent magnets, where as the stator generally consistsof two phased winding to generate the electromagnetic fieldused to guide the rotor either in clockwise or anticlockwisedirection. Pulse Width Modulation (PWM) technique isused to supply the current to these stators. This is thecause for most of the high frequency sound produced by thestepper motor. Due to the presence of permanent magnet(rotor) and an electromagnet (stator) driven by varying rateof constant current supply, the whole setup behaves like anaudio speaker capable of producing audible sound (see Fig-ure 2).
3.1 Acoustic Side-Channel InformationState-of-the-art 3D printers consists of four hybrid stepper
motors. Three of them are used to provide the movementof printer nozzle in each of the axes (X, Y and Z) [27]. Thefourth motor is used to extrude the filament while printing.The Z motor moves the nozzle vertically up or down. Whileprinting, the 3D printer firmware translates the G-code tosignals which are then sent to different actuators accord-ingly. The information provided by the G-code is as follows:I.1 Whether the movement is in the X, Y or Z axis;I.2 Direction of movement in each axis;I.3 The speed at which the nozzle is moving;I.4 The distance traveled in each axis; andI.5 Whether the printer should print or align the nozzle.Corresponding to the G-code, the stepper motors leak infor-mation about the axis of movement (by producing differentsound while moving each motor) and the speed of the nozzle(through varying the frequency of the sound). The steppermotors used in 3D printers are mostly the same, however theload moved by each stepper motor is different. This affectsthe sound emitted by each motor. There are many worksdescribing the relationship among current, load, and audi-ble sound produced by the motors [28,29], however, we willprovide an analogy with respect to G-code specific informa-tion leaked by the stepper motors. The torque required bythe motor can vary for different loads.
T ∝ F (1)where T is the torque and F is the force exerted by theload. On the other hand, the torque produced in the motoris proportional to the magnetic flux generated in the winding

of the stator.T ∝ H (2)
where H is the magnetic field intensity calculated as:H = (N × i)÷ l (3)
where N is the number of winding turns in stator, i is thecurrent supplied, and l is the magnetic flux path length.The higher magnetic intensity affects the force experiencedby the rotor, and this in turn affects the vibration producedby the rotor. For this reason, even though all the steppermotors used in the 3D printer are the same, they emit dif-ferent sounds for similar movements if they have a differentload (I.1) i.e. the motor that moves nozzle in X-axis, pro-duces different sound than the motor that moves the nozzlein Y-axis or Z-axis.
The other information leaked by the stepper motor is thespeed at which each stepper motor is rotating (I.3, I.4).In order to rotate the motor faster, more current should besupplied to the stator. From Equation 3, we can see thatit in turn affects the magnetic field intensity experienced bythe rotor. Hence the faster rotation in turn produces higheramplitude and higher frequency sound.
Time (min)
Fre
qu
ency
(k
Hz)
Po
we
rFre
qu
en
cy (
dB
/Hz)Higher Frequency
being Introduced with Higher
Speed
Separation Between Frequency Components
is also Increasing
20
18
16
14
12
10
8
6
4
2
00 1.2 1.4 1.6 1.8 2 2.2 2.4 2.6 2.8
-140
-120
-100
-80
-60
-40
Figure 3: Spectrogram Corresponding to Varying Speed.
Figure 3 shows the spectrogram of an audio collected whilethe speed of the stepper motor is increased from 500 mm/minto 4800 mm/min with increasing time. We can see that withthe increase in the motor speed, the higher frequency compo-nents are gradually being introduced into the spectrogram.
The vibration from the stepper motor is conducted throughout the printer. Therefore, every moving object in turn be-haves as a moving sound source. Hence, by analyzing theenergy (spectral energy for different motors), we can deter-mine the direction of movement in each axis (I.2). We havealso observed that the printer nozzle moves at a higher speedwhen aligning compared to while it is printing (I.5).
3.2 Attack Model DesignOur acoustic attack model is presented in Figure 4. An
attacker may place an audio device (such as a smart phone)close to the 3D printer and record the sound emitted byit while printing an object. The attacker must have previ-ously trained the learning algorithms of the attack model toreconstruct the G-code with a similar printer. As an out-come, he/she will acquire the valuable IP of the object beingprinted. In our attack methodology (see Figure 5), there aretwo phases: a training phase and an attack phase. Inthe training phase, audio signals are recorded, pre-processed,and the features extracted from them are mapped to theircorresponding G-codes. Next, these G-code mapped fea-tures are supplied to a regression model and a classificationmodel for training their learning algorithms. The regres-sion model is trained to predict the speed of the nozzle,whereas the classification model is used to predict the axis
AcousticData
Acquisitionv
Training Model
Target Machine
AcquisitionAcquisition
Side Channel(Medium)
G-code
Reconstruction
Attacker
AcAcAcAcousticicData
Action
IP TheftResult
Tool(Learning Algorithm)
Figure 4: Acoustic Side-Channel Attack Model.
on which the nozzle is moving. In the attack phase, the audiocollected, while an object is being printed, is pre-processedand the features extracted from them are passed to the re-gression and classification models. The predicted data fromthese models along with the output of the direction predic-tion model is then used to reconstruct the G-code.
Pre-processing
Feature Extraction
Regression Model
Classification Model
Window Size,
Step Size
SpeedAxis
Information
G-codeReconstruction
Model Recreation
G-code Mapping
Data Acquisition
Additive Manufacturing
System
Distance Direction Prediction
Model
Post Processing
Training Phase
Figure 5: Acoustic Side-Channel Attack Methodology.
The attack methodology is described as follows:Acoustic Data Acquisition: In this stage, audio informa-tion is captured using an audio device. The sampling fre-quency of the recording device must be higher than 40 kHz tocapture the sound in the audible range to avoid aliasing [30].Pre-processing: In order to remove unwanted low frequencyalternating current power line noise and high frequency noisegenerated by the stepper motor when it is in the idle, butcharged state, the audio recorded is passed to a band passfilter with the passband between 70 Hz and 20 kHz.Feature Extraction: For training the learning algorithms,features commonly used in speech pattern recognition [31]are explored in both the time and frequency domains. In thetime domain, the features extracted are frame energy, ZeroCrossing Rate (ZCR), and energy entropy [31]. The featuresextracted from the frequency domain are spectral entropy,spectral flux, Mel-Frequency Cepstral Coefficients (MFFC),and energy of Short-Time Fourier Transform (STFT) di-vided linearly into frequency intervals [31]. The features areextracted from a set of frames with fixed frame size of 50ms. However, better timing resolution can be obtained bymaking the frame size smaller, and for frequency resolution,larger frame size is required. Thus, the size of the frame issubjective to the type of features being extracted [32]. Fromeach frame, we extract features and create a feature vector

to supply the training algorithm. For a given frame of lengthFL with audio signals x(i) = 1, 2...FL, different features areextracted as follows:
Frame Energy (E) =
FL∑
i=1
| x(i) |2 (4)
Frame energy is enough to predict direction when the printeris only printing in one axis, however spectral energy is re-quired while predicting the direction in multiple axes move-ment. ZCR is calculated as follows:
ZCR =1
2FL
FL∑
i=1
| sign[x(i)]− sign[x(i− 1)] |2 (5)
ZCR is high when the printer is not making any sound, dueto the noise, and low when it is printing. For energy entropy,we divide the frame into short frames of length K. If Ej isthe energy of the jth short frame, then we have:
Energy Entropy = −K∑
j=1
ejlog2(ej) (6)
where ej =Ej∑K
i=1 Ei
Energy entropy measures the abrupt change in the energy ofthe signal, and can be used to detect the change of motion.For frequency domain data, let Xi(k), k = 1, ..., FL be themagnitude of the Fast Fourier Transform (FFT) coefficientof the given frame. For spectral entropy, we divide the spec-trum into L sub bands. Let Ef be the energy of the f th subband then we have:
Spectral Entropy = −L−1∑
f=1
nf log2(nf ) (7)
where nf =Ef∑L−1j=1 Ej
Spectral flux measures spectral change between two succes-sive frames, and can be used to detect the change of speedof the nozzle while printing within each layer.
Spectral F luxi,i−1 =
FL∑
k=1
(ENi(k)− ENi−1(k))2 (8)
where ENi(k) =Xi(k)∑FL−1
j=1 Xi(j)
To gather more information from the spectral data, we havecalculated cepstrum (inverse FFT of the log magnitude ofthe FFT of a signal) features. MFFC, which uses non lin-ear separation of frequency intervals (perceived as equallyspaced by human ears), are more efficient in audible soundpattern recognition [33], hence we have incorporated MFFCin our feature vector.
Regression Model
for Y MotorRegression
Model for Z
Motor
Regression Model
for X Motor
Output from
the Classifiers
Feature
Processing
Speeds
(Xυ,Yυ, Zυ)
One Axis Two Axes One Axis Two Axes
Regression Model
Features
Figure 6: Regression Model for Motor Speed Prediction.
We have also computed features by linearly dividing theSTFT of the audio signals in an interval of 100 Hz, and
placing the average of the energy in this interval in onebin. These features are more efficient to implement thanthe MFFC while performing spectral subtraction when twomotors are running simultaneously.Regression Model : Regression model consists of collec-tion of models each using a supervised learning algorithmfor regression as shown in Figure 6. The speed of the print-ing, also known as travel feedrate is determined by trainingthese regression algorithms [34]. After gaining the informa-tion about the travel feedrate, we can calculate the distancemoved by the nozzle as follows:
Distance = Frame size (ms)× Speed (mm/ms) (9)When the nozzle is moving in only one axis, the regressionmodel can just take the features directly without furtherprocessing, however, when the nozzle is moving in two ormore axes, the audio signal from one motor is combinedwith the others. Hence it becomes imperative to separatethese signals before the regression model can be used topredict the speed. We use the STFT calculated earlier toperform spectral subtraction for separating the signals.
Algorithm 1: Feature Processing and Speed Calcula-tion with Motion in XY Axes.Input: Feature Vectors XYβ, Xβ , Yβ
// β → Total featuresOutput: Speed Yϑ, Xϑ // ϑ→ Speed
1 Xϑimeanβj= 1
Ni
∑Nin=1 Xβn,j
// j = 1 −→ βn Ni −→ Total data for speed i
2 Yϑimeanβj= 1
Ni
∑Nin=1 Yβn,j
3 for each XY do4 for ϑi in range(v1, vn)
// n:Total number of speed used in training5 do6 XYbeta(xy−y) = XYbeta − Yϑimeanβ
7 Xϑi← RegressionModel1(XYbeta(xy−y))
8 XYbeta(xy−x) = XYbeta −Xϑimeanβ
9 Yϑ ← RegressionModel2(XYbeta(xy−x))10 diffi =| Yϑ − ϑi |11 Yϑ = ϑiwith minimum diffi12 Xϑ = Xϑi
with minimum diffi
13 return Yϑ, Xϑ
Algorithm 1 provides the pseudo code for performing thespectral subtraction necessary when motion is involved inboth the X and Y axes. It takes features, extracted fromthe audio when both the X and Y motors are running, andthe features from the training phase for individual motor Xand Y as the input. Spectral subtraction is not performedfor Z motor because it only moves one layer at a time and thedistance it moves is normally fixed for a given object. Whiletraining, n number of speeds, in incremental number is takento train the regression models. For each of these speeds,line 1 and 2 calculate the average magnitude of spectralfeatures. Then for each of the speed, in line 6 the speed ofthe Y motor is assumed and the spectral components aresubtracted from the combined spectral features of X and Y.By subtraction, we remove the spectral components presentin Y from the combination of these features. Line 7 gives thepredicted speed for the given value of speed in Y direction.We use this speed to subtract the spectral features of X inthe particular speed and again use this value to predict thespeed for motion in Y axis. In line 11 and 12, the speed ofX and Y that gives the minimum difference in the predictedspeed and output speed in Y axis is chosen as an output.

Classification Model: As show in in Figure 7, to deter-mine the axis in which the nozzle is moving, the classifica-tion model consists of collection of classifiers to convert theclassification problem into two-class separation model. Wehave found that this model gives us better prediction resultcompared to multi-class classifier models.
Features
Z|Z’Classifier
1D|2D Classifier
X|YClassifier XYsame|XYdiff
Estimate the Movement of Different Motors
Axis Information (Ax, Ay, Az, θ1D, θ2D, Layerflag, XYspeedflag)
Classification Model
Ф1 Ф2 Ф3 Ф4
Figure 7: Classification Model for Axis Prediction.
Each of these classifiers consists of supervised learning algo-rithms for classification. Algorithm 2 gives the pseudo code,which takes the output from the classifiers to determine theaxis of movement. It also gives information such as whetherthe layer has changed or not, and whether the nozzle is mov-ing in X and Y axis with the same speed or different speed.
Algorithm 2: Estimate the Axis of Movement.
Input: Classifier Outputs φ1,φ2,φ3,φ4
Output: Axis ParametersAx, Ay, Az,Θ1D,Θ2D, Layerflag, XYspeedflag
1 Θ1D = 0,Θ2D = 0 // A −→ axis,Θ −→ dimension2 Layerflag = 0, XYspeedflag = 03 Ax = 0, Ay = 0, Az = 0 // Initialize to zero4 if φ1 == 1 then5 Layerflag = 1, Az = 1
6 else7 if φ2 == 1 // One dimension movement8 then9 Θ1D = 1
10 if φ3 == 1 // Movement in X-axis11 then12 Ax = 1
13 else14 Ay = 1 // Movement in Y-axis
15 else16 Θ2D = 1, Ax = 1, Ay = 117 if φ4 == 1 // X and Y move with same speed18 then19 XYspeedflag = 1
20 else21 XYspeedflag = 0 // Different speed
22 return Ax, Ay, Az,Θ1D,Θ2D, Layerflag, XYspeedflag
Frame Energy
Median Filter
ComparatorFeature
ProcessingFeature
Output from Regression and Classification
Model 1 0
Store Value Average
Value
Direction (δ)
Feature Comparison
Direction Change
Post Processing
Figure 8: Direction Prediction Model.
Direction Prediction Model: Most of the 3D printershave motors in a fixed location. However, the base plate,the nozzle or combination of both are always in motion while
printing. Therefore, vibration is conducted from the motorto the nozzle and the base plate of the printer. This meansthat the audio source physically gets closer or away fromthe recording device while printing. We can use the frameenergy of the audio signal to check the direction of motion.For multiple motor movements, we utilize the difference offeature in frequency domain to calculate the energy of onlythose spectral components that represent the specific motor.In order to suppress the high fluctuation, median filteringis applied to the sequence of frame energies to smooth thecurve of frame energies. The prediction model will output1 if the frame energy is increasing and 0 if the frame en-ergy is decreasing. In order to aid the direction predictionmodel and post-processing, a feature comparison block willmeasure the distance (euclidean distance) between consecu-tive frame features. If the motion of direction changes thenthere will be large difference in the features between the con-secutive frames. We use this spike to detect the change indirection of motion of the nozzle.
Algorithm 3: Calculate Distance Moved in Each Axis,and Check Extrusion.Input: Output from Classifier and Regression Models
xϑ, yϑ, zϑ,w, Ax, Ay, Az, δx, δy , δzOutput: Distance Values dx, dy , dz, dE
// d→ Distance, xϑ → Speed in X-axis// w→ Frame length,A→ AxisF lag, δ → Direction
1 dx = 0, dy = 0, dz = 02 for each i in x, y, z do3 if Ai == 1 // Axis flag set4 then5 if δi == 1 then6 di = iϑ ×w // Positive distance
7 else8 di = ¬iϑ × w // Negative distance
9 if xϑ >= SpeedHigh || yϑ >= SpeedHigh then10 dE = 0 // No extrusion in high speed
11 else12 dE = ed // ed −→Machine specific extrusion
13 return dx, dy, dz, dE
Model Recreation: For reconstructing the G-code, we needto determine whether the 3D printer nozzle is actually ex-truding the filament or not. From our analysis, we havefound that the printer nozzle moves at higher speed when itis not extruding the filament. Hence the task of determiningwhether printing or not printing becomes task of finding outthe speed at which the nozzle is moving. This informa-
Algorithm 4: Generate G-code of the Object.
Input: Distance and Frame Length dx, dy , dz, dE,wOutput: G-code
// Initialize to zero1 drx = 0, dry = 0, drz = 0, drE = 0
2 ϑ =
√d2x+d2y+d2z
w// Travel feedrate
3 drx = drx + dx // Distance moved in X-axis4 dry = dry + dy // Distance moved in Y-axis5 drz = drz + dz // Distance moved in Z-axis6 drE = drE + dE // Extrusion amount7 G-code← G1 F (ϑ) X(drx) Y (dry) Z(drz) E(drE)8 return G-code
tion will be acquired from the regression model. Extrusionamount for a given segment is machine specific, and can becalculated as a function of layer height, and nozzle diameter.
After acquiring the output from the regression model, clas-sification model, and direction prediction model, positive ornegative distance movement is calculated using Algorithm3 and the the G-code for the object is reconstructed usingAlgorithm 4.
3.3 Post-Processing for Model RecreationWe have found a high mutual information between the G-
code and the sound retrieved from the physical medium. ForG-codes, let G be a discrete random variable with f(g) as itsprobability distribution function at g. Let A be a discreterandom variable representing the feature extracted from theacoustics with f(a) as its probability distribution function.Then the entropy of each of these random variables can begiven as:
H(G) = −∑
g∈G
f(g)log2f(g) (10)
H(A) = −∑
a∈A
f(a)log2f(a) (11)
If f(g, a) and f(g|a) are the joint and conditional probabilityof the random variables respectively, then the conditionalentropy H(G|A) is calculated as:
H(G|A) = −∑
a∈A
∑
g∈G
f(g, a)log2f(g|a) (12)
The conditional entropy measures the amount of informa-tion required to describe the outcome of random variableG, given the information about the random variable A. Inthis context, beside the information gathered from A, theamount of additional additive manufacturing context basedinformation required to reconstruct the G-code will be di-rectly related to the mutual information calculated as:
I(G;A) = H(G)−H(G|A) (13)We have found that the uncertainty of reconstruction of G-code or the entropy H(G|A) increases when the distance ofthe microphone is further away from the printer or whenthere is added noise in the environment. It also increaseswhen the speed of the printer is high and there are moreshort and rapid movements. During these scenarios, we canuse the properties of additive manufacturing to post-processthe data achieved from the learning algorithms. Specifically,we have used two post-processing stages which utilizes spe-cific additive manufacturing context based information.Post-Processing Stage I : In this stage, we reduce H(G|A)by utilizing the fact that until the change of motion occurs,the nozzle moving in one particular dimension with a par-ticular speed will have similar feature vector. By taking theoutput from the feature comparison model, we segment theacquired acoustic data into sections with similar movement.In this post-processing stage, we will then choose the out-put of the classifiers to be the highest occurring value inthe given segment, and for regression we will average thespeed obtained within the same section. This is similar toaveraging used in digital signal processing to increase theSignal-to-Noise Ratio (SNR).
SNRdB = 10log10(Powersignal
PowerNoise
) (14)
When we increase the SNR, the entropy of the signal willbe reduced. As there is high correlation among the featuresextracted from successive frames of the audio collected fromthe 3D printer, averaging the output of the classification andthe regression model will increase the SNR and thus reduceH(G|A).Post-Processing Stage II : In this stage, after applying
post-processing I, we measure the similarity between the twolayers. The similarity of two layers are measured in terms ofnumber of segments, the sequence of motions in each layers,and the length of each segment. This post-processing stagewill then help the attack model in reducing the error due tomiscalculated direction and fluctuating lengths by taking theaverage of segment lengths and direction among the similarlayers of the 3D object.
4. ATTACK MODEL TRAINING AND EVAL-
UATION
4.1 Testbed for Training and Testing
Audio Recorder
(Zoom H6)
Printer Software
(Cura 15.04)
3D Printer
(Printrbot)
Y
XX
Z
Figure 9: Setup for Training and Testing.
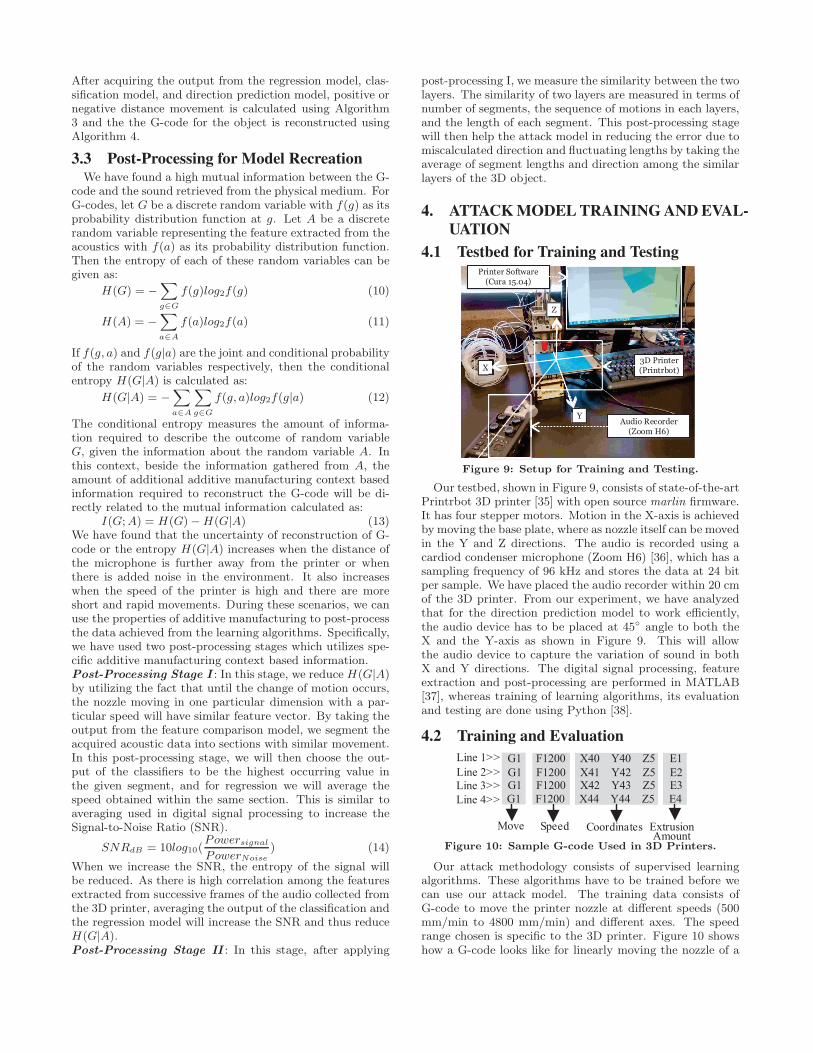
Our testbed, shown in Figure 9, consists of state-of-the-artPrintrbot 3D printer [35] with open source marlin firmware.It has four stepper motors. Motion in the X-axis is achievedby moving the base plate, where as nozzle itself can be movedin the Y and Z directions. The audio is recorded using acardiod condenser microphone (Zoom H6) [36], which has asampling frequency of 96 kHz and stores the data at 24 bitper sample. We have placed the audio recorder within 20 cmof the 3D printer. From our experiment, we have analyzedthat for the direction prediction model to work efficiently,the audio device has to be placed at 45◦ angle to both theX and the Y-axis as shown in Figure 9. This will allowthe audio device to capture the variation of sound in bothX and Y directions. The digital signal processing, featureextraction and post-processing are performed in MATLAB[37], whereas training of learning algorithms, its evaluationand testing are done using Python [38].
4.2 Training and Evaluation
G1 F1200 X40 Y40 Z5 E1Line 1>>
Line 2>>
Line 3>>
Line 4>>
Move Speed Coordinates Extrusion Amount
G1 F1200 X41 Y42 Z5 E2G1 F1200 X42 Y43 Z5 E3
G1 F1200 X44 Y44 Z5 E4
Figure 10: Sample G-code Used in 3D Printers.
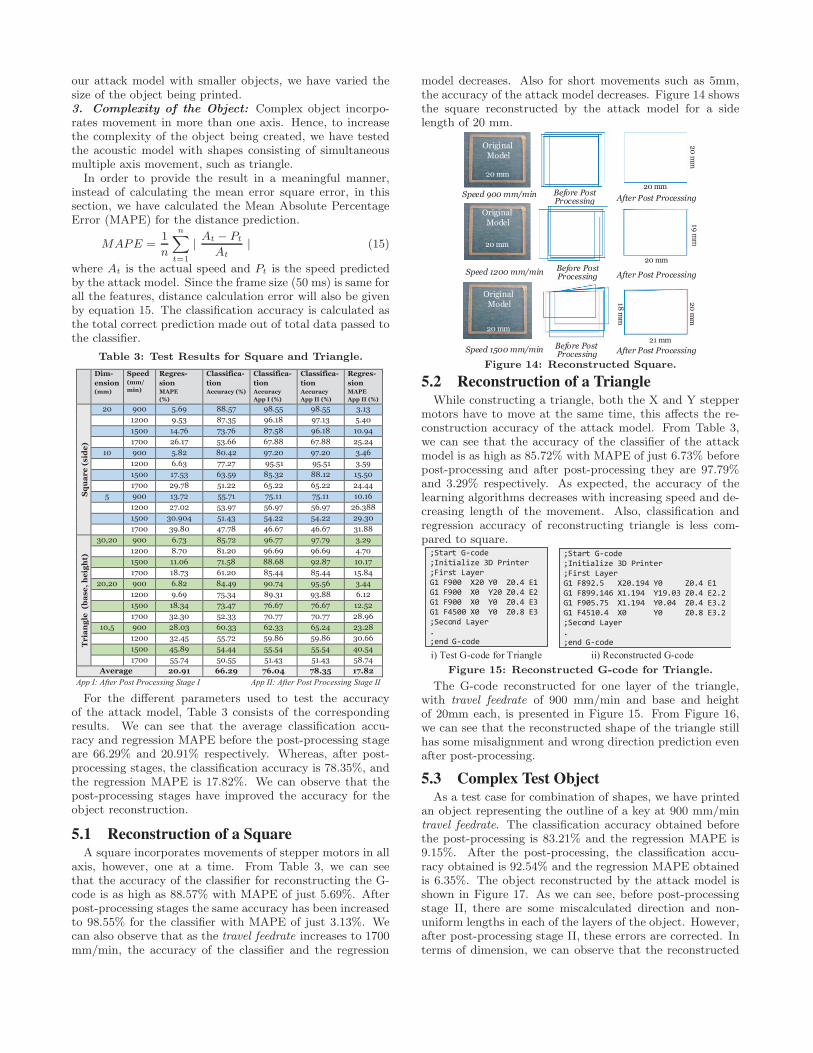
Our attack methodology consists of supervised learningalgorithms. These algorithms have to be trained before wecan use our attack model. The training data consists ofG-code to move the printer nozzle at different speeds (500mm/min to 4800 mm/min) and different axes. The speedrange chosen is specific to the 3D printer. Figure 10 showshow a G-code looks like for linearly moving the nozzle of a

3D printer. The G-code for training phase consists of move-ment in just one axis (X, Y, and Z), two axes (XY, XZ,and YZ), and all three axes (XYZ). The audio signal corre-sponding to each of these G-codes is pre-processed and la-beled for training the learning algorithms. The total lengthof audio recorded for training is 1 hour 48 minutes. Thetotal numbers of features extracted excluding the STFT is109. For spectral subtraction using STFT, we used the fre-quency range of 70 Hz to 10 kHz to extract the features. Wefound that this range is sufficient for the given printer. Forregression model, we have used Decision Trees, boosted us-ing Gradient Boosting algorithm, where as for classificationmodel we have used Decision Tree Classifier, boosted usingAdaBoost algorithm [34].
ii) Confusion Matrix for 1D|2D
i) Confusion Matrix for Z|Z’
iv) Confusion Matrix for XY Same and Different Speed
iii) Confusion Matrix for X|Y
4575
63229
6
Predicted Label
Tr
ue L
ab
el
01
0 1
2814
33254
4 3
Predicted Label
Tr
ue L
ab
el
01
0 1
795
8470
1
Predicted Label
Tr
ue L
ab
el
01
0 1
3860
205251
15
Predicted Label
Tr
ue L
ab
el
01
0 1
Figure 11: Confusion Matrix for Different Classifiers.
We have trained the learning algorithms and have per-formed K-fold cross validation, with k = 6, to test the ef-ficiency of the learners as well as avoid over or under fit-ting the learning algorithms. In our experiment, regressionmodel is trained only for the nozzle movements in the X andY directions. This is because the Z motor moves one layer ata time, and the amount it moves is always fixed (the layerheight) for a given object. Figure 11 shows the confusionmatrix obtained for different classifiers.
Table 1: Accuracy of Classifiers.
Classification Model Classifying Accuracy (%)
Ф1
Ф2
Ф3
Ф4
Z or ~Z Axis 99.86
1D or 2D Axis 99.88
X or Y Axis 99.93
XYsame or XYdifferent 98.89
Each of the classifier has different number of training datadue to the variation in the number of possible motion thatshould be considered while training them. We can see thatthe true positive and true negative values in the diagonalare larger than the false positive and false negative values.From Figure 11, we can calculate the classification accuracyof all the classifiers as shown in Table 1. As the collectionof classifiers are arranged in a hierarchy, the bottleneck interms of accuracy is the longest path followed while makingthe decision. In this case, the longest path involves all theclassifiers.
The accuracy of the regression model is measured in termsof Mean Square Error (MSE) with the data normalized withzero mean and unit variance. From Table 2, we can see that
Table 2: Accuracy of Regression Models.
Regression Model Movement Axis MSE (Normalized)
XYXY
Only X 0.00616Only Y 0.01874
Both X and Y 0.1658Both X and Y 0.4290
the MSE is relatively higher for the value predicted by theregression model for the motion in Y axis when the motion isoccurring at two axes. However, this error can be removedduring the post-processing stage as the travel feed rate isgenerally similar between consecutive frames in each layerof printing. Hence, we can determine the speed of the Ymotor if we know the speed of the X motor.
4500
3500
2500
1500
500500 1500 2500 3500 4500
Real Speed (mm/min)
Pre
dic
ted
Sp
eed
(m
m/m
in)
i) Motion in just X Axis ii) Motion in just Y Axis
4500
3500
2500
1500
500500 1500 2500 3500 4500
Real Speed (mm/min)Pre
dic
ted
Sp
eed
(m
m/m
in)High Linearity
Between Real and Predicted
Speed
Outliers
Outliers
Figure 12: Prediction Results for Regression Models.
In Figure 12, we see that there is a linear relationship be-tween the real speed and the predicted speed computed bythe regression model.
i) Distance Between Features of Consecutive Frames
ii) Peak Extracted from the Distance Measurement
Time (ms)
Eu
clid
ean
D
ista
nce
Time (ms)TTiime (( ))
Time ( )
Threshold for Detecting Change
of Motion
Large Distance due to Change of Signal
1
0
Extracted Peaks
Different Motions
Similar Motion
Figure 13: Features Segmented with Varying Motion.
Figure 13 shows the feature comparison conducted for theaudio recorded while the 3D printer is printing an object.We can observe when the nozzle changes its direction byanalyzing the distance of features between successive frames.In order to extract the peaks, threshold determined duringthe training phase, is applied to the distance. Value higherthan the threshold is assigned value 1 and less than it isassigned 0.
5. RESULTS AND CASE STUDY ANALYSISIn order to test our attack model, we define various bench-
mark parameters which affect the accuracy of the attackmodel as follows:1. Speed of Printing: The fixed frame rate affects thetemporal and spectral features extracted from the audio.With the increase in the speed, faster rate of change of spec-tral features will not be captured and this can degrade theperformance of the attack model. Hence, speed of printingis varied to test the accuracy of the attack model.2. Dimension of the Object: With smaller objects,shorter nozzle movements are present. To represent theseshorter movements, temporal resolution of the features haveto be increased by making the frame size smaller. To test
our attack model with smaller objects, we have varied thesize of the object being printed.3. Complexity of the Object: Complex object incorpo-rates movement in more than one axis. Hence, to increasethe complexity of the object being created, we have testedthe acoustic model with shapes consisting of simultaneousmultiple axis movement, such as triangle.
In order to provide the result in a meaningful manner,instead of calculating the mean error square error, in thissection, we have calculated the Mean Absolute PercentageError (MAPE) for the distance prediction.
MAPE =1
n
n∑
t=1
| At − Pt
At
| (15)
where At is the actual speed and Pt is the speed predictedby the attack model. Since the frame size (50 ms) is same forall the features, distance calculation error will also be givenby equation 15. The classification accuracy is calculated asthe total correct prediction made out of total data passed tothe classifier.
Table 3: Test Results for Square and Triangle.
App I: After Post Processing Stage I App II: After Post Processing Stage II
Dim-
ension (mm)
Speed (mm/
min)
Regres-
sion MAPE
(%)
Classifica-
tion Accuracy (%)
Classifica-
tion
Accuracy
App I (%)
Classifica-
tion Accuracy
App II (%)
Regres-
sion MAPE
App II (%)
Sq
ua
re
(s
ide
)
20 900 5.69 88.57 98.55 98.55 3.13
1200 9.53 87.35 96.18 97.13 5.40
1500 14.76 73.76 87.58 96.18 10.94
1700 26.17 53.66 67.88 67.88 25.24
10 900 5.82 80.42 97.20 97.20 3.46
1200 6.63 77.27 95.51 95.51 3.59
1500 17.53 63.59 85.32 88.12 15.50
1700 29.78 51.22 65.22 65.22 24.44
5 900 13.72 55.71 75.11 75.11 10.16
1200 27.02 53.97 56.97 56.97 26.388
1500 30.904 51.43 54.22 54.22 29.30
1700 39.80 47.78 46.67 46.67 31.88
Tr
ian
gle
(b
as
e,
he
igh
t)
30,20 900 6.73 85.72 96.77 97.79 3.29
1200 8.70 81.20 96.69 96.69 4.70
1500 11.06 71.58 88.68 92.87 10.17
1700 18.73 61.20 85.44 85.44 15.84
20,20 900 6.82 84.49 90.74 95.56 3.44
1200 9.69 75.34 89.31 93.88 6.12
1500 18.34 73.47 76.67 76.67 12.52
1700 32.30 52.33 70.77 70.77 28.96
10,5 900 28.03 60.33 62.33 65.24 23.28
1200 32.45 55.72 59.86 59.86 30.66
1500 45.89 54.44 55.54 55.54 40.54
1700 55.74 50.55 51.43 51.43 58.74
Average 20.91 66.29 76.04 78.35 17.82
For the different parameters used to test the accuracyof the attack model, Table 3 consists of the correspondingresults. We can see that the average classification accu-racy and regression MAPE before the post-processing stageare 66.29% and 20.91% respectively. Whereas, after post-processing stages, the classification accuracy is 78.35%, andthe regression MAPE is 17.82%. We can observe that thepost-processing stages have improved the accuracy for theobject reconstruction.
5.1 Reconstruction of a SquareA square incorporates movements of stepper motors in all
axis, however, one at a time. From Table 3, we can seethat the accuracy of the classifier for reconstructing the G-code is as high as 88.57% with MAPE of just 5.69%. Afterpost-processing stages the same accuracy has been increasedto 98.55% for the classifier with MAPE of just 3.13%. Wecan also observe that as the travel feedrate increases to 1700mm/min, the accuracy of the classifier and the regression
model decreases. Also for short movements such as 5mm,the accuracy of the attack model decreases. Figure 14 showsthe square reconstructed by the attack model for a sidelength of 20 mm.
Before Post Processing After Post ProcessingSpeed 900 mm/min
20
mm
20 mm
20 mm
19 m
m
21 mm
18 m
m
Original Model
20 mm
Before Post Processing After Post ProcessingSpeed 1200 mm/min
Original Model
20 mm
Before Post Processing After Post ProcessingSpeed 1500 mm/min
Original Model
20 mm
20
mm
Figure 14: Reconstructed Square.
5.2 Reconstruction of a TriangleWhile constructing a triangle, both the X and Y stepper
motors have to move at the same time, this affects the re-construction accuracy of the attack model. From Table 3,we can see that the accuracy of the classifier of the attackmodel is as high as 85.72% with MAPE of just 6.73% beforepost-processing and after post-processing they are 97.79%and 3.29% respectively. As expected, the accuracy of thelearning algorithms decreases with increasing speed and de-creasing length of the movement. Also, classification andregression accuracy of reconstructing triangle is less com-pared to square.
;Start G-code
;Initialize 3D Printer
;First Layer
G1 F892.5 X20.194 Y0 Z0.4 E1
G1 F899.146 X1.194 Y19.03 Z0.4 E2.2
G1 F905.75 X1.194 Y0.04 Z0.4 E3.2
G1 F4510.4 X0 Y0 Z0.8 E3.2
;Second Layer
.
;end G-code
;Start G-code
;Initialize 3D Printer
;First Layer
G1 F900 X20 Y0 Z0.4 E1
G1 F900 X0 Y20 Z0.4 E2
G1 F900 X0 Y0 Z0.4 E3
G1 F4500 X0 Y0 Z0.8 E3
;Second Layer
.
;end G-code
i) Test G-code for Triangle ii) Reconstructed G-code
Figure 15: Reconstructed G-code for Triangle.
The G-code reconstructed for one layer of the triangle,with travel feedrate of 900 mm/min and base and heightof 20mm each, is presented in Figure 15. From Figure 16,we can see that the reconstructed shape of the triangle stillhas some misalignment and wrong direction prediction evenafter post-processing.
5.3 Complex Test ObjectAs a test case for combination of shapes, we have printed
an object representing the outline of a key at 900 mm/mintravel feedrate. The classification accuracy obtained beforethe post-processing is 83.21% and the regression MAPE is9.15%. After the post-processing, the classification accu-racy obtained is 92.54% and the regression MAPE obtainedis 6.35%. The object reconstructed by the attack model isshown in Figure 17. As we can see, before post-processingstage II, there are some miscalculated direction and non-uniform lengths in each of the layers of the object. However,after post-processing stage II, these errors are corrected. Interms of dimension, we can observe that the reconstructed

Before Post Processing After Post ProcessingSpeed 900 mm/min
19 mm
19 m
m19
mm
18 mm
26
mm
19 mm
20 mm
20
mm
Speed 1500 mm/min
20 mm
20
mm
Before Post Processing After Post Processing
Original model
20 mm
20
mm
Original model
Original model
Before Post Processing After Post ProcessingSpeed 1200 mm/min
Figure 16: Reconstructed Triangle.
key varies in length and width compared to the original ob-ject. Nevertheless, the general outline of the key is recon-structed accurately. Moreover, the accuracy in terms of thelength obtained after the post-processing stage is 89.72%,which is calculated by dividing the difference between theoriginal length and the predicted length of each segment ineach of the layers by the total length of all the segments inall the layers.
80 mm
40
mm
i) Original 3D-Printed Key
ii) Reconstructed Key Before Post Processing
iii) Reconstructed Key After Post Processing
60
mm
38
mm
38
mm
85 mm85 mm
Figure 17: Reconstruction of a Key as a Case Study.
6. CHALLENGES AND FUTURE WORK
6.1 Limitations of the Attack MethodologyAlthough we have shown that the attack model is capable
of reconstructing the G-code with high accuracy there aresome caveat to this methodology described below:Distance of Microphone: In our current experimentalsetup, microphone should be placed close enough to be ableto detect the variation of the sound received for determiningthe direction of the motion. The direction prediction modelin our attack model relies in the sound/vibration conductedby the motor to the moving part of the printer. If enoughsound/vibration is not conducted then the audio device willnot be able to capture the variation. In this case, someother sensors can be incorporated along with the audio de-vice, such as proximity sensors, to detect the direction. Weleave this for our future work.Short and Rapid Movements: Due to the fixed framesize incorporated for feature extraction in our experiment,the accuracy of the attack model is reduced for higher speedand smaller dimension. In order to capture smaller move-ments, the temporal resolution of the features extracted haveto be increased by making the frame size smaller. However,for faster speeds, we need larger frame size to increase thefrequency resolution for better spectral features. This trade-off dictates that we should incorporate adaptive frame sizeto increase the accuracy of the attack model. We will incor-porate this in our future work.
Feature Separation during Multiple Axis Movement
and Noise: The separation of sound source from combina-tion of sound is a well known problem in speech processing.In our attack model, we have incorporated spectral subtrac-tion to acquire features that are unique to each of the steppermotors. However, there are other methods in separating thesources of sound [39, 40] . Incorporating them in the at-tack model may increase the accuracy of the G-code beingreconstructed. We leave this for our future work.
Table 4: 3D Printers Available in the Market.
3D PrinterMotors
(Number) X
Makergear M2 (www.makergear.com)
FlashForge (www.flashforge-usa.com)
Ultimaker 2 (www.ultimaker.com)
LulzBot TAZ (www.lulzbot.com)
4 1
5 1
4 1
5 1
Y
1
1
1
1
Z
1
1
1
1
E
1
2
1
1
6.2 3D Printer VariationAs we can see in Table 4, most of the Fused Deposition
Modeling (FDM) based 3D printers available in the marketconsists of an equal number of stepper motors. These modelsalso have Z motor to control the layer height. They only varyin speed and the resolution of printing. Our attack method-ology can be used on any of these printers. However, thisattack methodology needs to be tested against other typesof printers based on selective laser sintering and selectivelaser melting, as their structure varies from the FDM based3D printers. We leave this for our future work.
6.3 Counter MeasuresSimilar Loads on Each Motor: If each of the stepper mo-tor moves equal load, then the acoustic features emanatedwill be similar for all the motors. In this scenario, the attackmodel will not be able to distinguish the movement of onemotor from the another. However, making loads equal ineach motor requires restructuring the design of the printers.Hence, printer design methodology has to consider impactof structural design on side-channel leakage as a parameterfor designing secure additive manufacturing system.G-code variation: To make the G-code reconstruction pro-cess harder, randomness in the movements of the motors canbe incorporated in the G-code. However, this countermea-sure will delay the total printing time by adding redundancyin the G-code while improving security against the acousticside-channel attack. Further research is required for design-ing efficient algorithms that slice the 3D models to increasethe entropy of the signals leaked through the side-channel.Acoustic Shielding: Shielding the 3D printer with a sound-proofing material can suppress sound emanated from theprinter. However, shielding must be able to suppress allrange of sound spectrum. With large additive manufactur-ing systems, this could add an extra cost.
7. CONCLUSIONWe have presented a novel acoustic side-channel attack
model for additive manufacturing system to reconstruct cy-ber domain data, which includes IP. Additionally, we havetested our attack model with a state-of-the-art 3D printerto reconstruct objects with different benchmark parameterssuch as speed, dimension, and complexity. We have suc-cessfully performed the acoustic side-channel attack with

an average axis prediction accuracy of 66.29%, and aver-age length prediction error of 20.91%. Furthermore, withpost-processing we have achieved a moderately high averageaxis prediction accuracy of 78.35% and average length pre-diction error of 17.82%. Specifically, our attack model hasachieved a high axis prediction accuracy of 92.54% and asmall length prediction error of 6.35%, when testing it witha complex object such as a key. In addition to testing andvalidating our attack model, we also have discussed some ofits limitations and countermeasures. Nonetheless, our workserves as a proof of concept of a serious physical-to-cyberdomain attack, which acquires and utilizes side-channel in-formation (such as acoustic signals) from additive manufac-turing systems ) to steal the valuable cyber domain data.
8. ACKNOWLEDGMENTThis work was partially supported by NSF CPS grant
CNS-1546993.
9. REFERENCES[1] B. Leukers et al., “Hydroxyapatite scaffolds for bone
tissue engineering made by 3D printing,” Journal ofMaterials Science: Materials in Medicine, vol. 16,no. 12, pp. 1121–1124, 2005.
[2] I. Platform and F. Recycling, “NASA advancedmanufacturing technology,” 2014.
[3] M. Tomlin and J. Meyer, “Topology optimization ofan additive layer manufactured (alm) aerospace part,”in Proceeding of the 7th Altair CAE technologyconference, pp. 1–9, 2011.
[4] P. Kobryn and S. Semiatin, “The laser additivemanufacture of ti-6al-4v,” JOM, vol. 53, no. 9,pp. 40–42, 2001.
[5] B. Short, “Quality metal additive manufacturing(QUALITY MADE) enabling capability.”www.navy.mil, 2015.
[6] T. Wohlers, “Wohlers report 2014-3D printing andadditive manufacturing-state of the industry,”WohlersAssociates, 2014.
[7] “IBM cyber security intelligence index.” IBM., 2015.[8] “Cyber Security for Advanced Manufacturing,” tech.
rep., National Defense Industrial Association, 05 2014.[9] “Manufacturing: A persistent and prime cyber attack
target,” www.cohnreznick.com, 2015.[10] Economics and Statistics Administration, “Intellectual
property and the u.s. economy: Industries in focus,”2012.
[11] M. Yampolskiy et al., “Intellectual property protectionin additive layer manufacturing: Requirements forsecure outsourcing,” in Proceedings of the 4th ProgramProtection and Reverse Engineering Workshop, p. 7,ACM, 2014.
[12] I. Gibson, D. W. Rosen, B. Stucker, et al., Additivemanufacturing technologies. Springer, 2010.
[13] W. Ashford, “21 percent of manufacturers hit byintellectual property theft,” August 2014.
[14] D. S. WaII et al., “Intellectual property crime and theinternet: cyber-piracy and stealing informationintangibles,”Handbook of internet crime, p. 255, 2010.
[15] T. Branigan, “Google to end censorship in china overcyber attacks,” The Guardian, pp. 01–12, 2010.
[16] F.-X. Standaert et al., “A unified framework for theanalysis of side-channel key recovery attacks,” in
Advances in Cryptology-EUROCRYPT, pp. 443–461,Springer, 2009.
[17] M. Al Faruque et al., “Design methodologies forsecuring cyber-physical systems,” in Proceedings of the10th International Conference on Hardware/SoftwareCodesign and System Synthesis, IEEE, 2015.
[18] J. Wan et al., “Security-aware functional modeling ofcyber-physical systems,” in Emerging Technologies &Factory Automation (ETFA), pp. 1–4, IEEE, 2015.
[19] A. Cardenas et al., “Challenges for securing cyberphysical systems,” in Workshop on future directions incyber-physical systems security, 2009.
[20] “SketchUp Make.” www.sketchup.com, 2015.[21] T. R. Holbrook and L. Osborn, “Digital patent
infringement in an era of 3D printing,”UC Davis LawReview, Forthcoming, 2014.
[22] L. Sturm et al., “Cyber-physical vunerabilities inadditive manufacturing systems,” Context, 2014.
[23] M. Backes et al., “Acoustic side-channel attacks onprinters.,” in USENIX Security Symposium,pp. 307–322, 2010.
[24] E. Toreini, B. Randell, and F. Hao, “An acoustic sidechannel attack on enigma,” 2015.
[25] A. Davis et al., “The visual microphone: Passiverecovery of sound from video,”ACM Trans. Graph,vol. 33, no. 4, p. 79, 2014.
[26] H. Vincent et al., “Trojan detection and side-channelanalyses for cyber-security in cyber-physicalmanufacturing systems,”
[27] B. Evans, Practical 3D printers: The science and artof 3D printing. Apress, 2012.
[28] P. Vijayraghavan and R. Krishnan, “Noise in electricmachines: a review,” in Industry ApplicationsConference, vol. 1, pp. 251–258, 1998.
[29] J. Hendershot, “Causes and sources of audible noise inelectrical motors,” in Proc. 22nd Incremental MotionControl Systems and Devices Symposium, pp. 259–270,1993.
[30] A. V. Oppenheim et al., Discrete-time signalprocessing, vol. 2. Prentice-hall Englewood Cliffs, 1989.
[31] S. Theodoridis et al., Introduction to PatternRecognition: A Matlab Approach: A Matlab Approach.Academic Press, 2010.
[32] Q. Zhu and A. Alwan, “On the use of variable framerate analysis in speech recognition,” in IEEEInternational Conference on Acoustics, Speech, andSignal Processing, 2000. ICASSP’00. Proceedings.,vol. 3, pp. 1783–1786, 2000.
[33] J. H. Martin and D. Jurafsky, “Speech and languageprocessing,” International Edition, 2000.
[34] F. Pedregosa et al., “Scikit-learn: Machine learning inPython,” Journal of Machine Learning Research,vol. 12, pp. 2825–2830, 2011.
[35] “Printrbot 3D Printers.” www.printrbot.com, 2015.[36] “Zoom H6 Handy Recorder.” www.zoom-na.com, 2015.[37] “MATLAB R2015a.” www.mathworks.com, 2015.[38] “Python 2.7.10.” www.python.org, 2015.[39] D. Barry et al., “Real-time sound source separation:
Azimuth discrimination and resynthesis,” AudioEngineering Society, 2004.
[40] M. S. Pedersen et al., “A survey of convolutive blindsource separation methods,”Multichannel SpeechProcessing Handbook, pp. 1065–1084, 2007.