Acoustic monitoring of a prestressed concrete beam ...
9
HAL Id: hal-01639156 https://hal.archives-ouvertes.fr/hal-01639156 Submitted on 20 Nov 2017 HAL is a multi-disciplinary open access archive for the deposit and dissemination of sci- entific research documents, whether they are pub- lished or not. The documents may come from teaching and research institutions in France or abroad, or from public or private research centers. L’archive ouverte pluridisciplinaire HAL, est destinée au dépôt et à la diffusion de documents scientifiques de niveau recherche, publiés ou non, émanant des établissements d’enseignement et de recherche français ou étrangers, des laboratoires publics ou privés. Acoustic monitoring of a prestressed concrete beam reinforced by adhesively bonded composite Sylvain Chataigner, Laurent Gaillet, Yannick Falaise, Jean-François David, Richard Michel, Christophe Aubagnac, Adrien Houel, Didier Germain, Jean-Philippe Maherault To cite this version: Sylvain Chataigner, Laurent Gaillet, Yannick Falaise, Jean-François David, Richard Michel, et al.. Acoustic monitoring of a prestressed concrete beam reinforced by adhesively bonded composite. SMAR 2017, the fourth International Conference on Smart Monitoring, Assessment and Rehabilitation of Civil Structures, Sep 2017, ZURICH, Switzerland. 8p. hal-01639156
Transcript of Acoustic monitoring of a prestressed concrete beam ...

HAL Id: hal-01639156https://hal.archives-ouvertes.fr/hal-01639156
Submitted on 20 Nov 2017
HAL is a multi-disciplinary open accessarchive for the deposit and dissemination of sci-entific research documents, whether they are pub-lished or not. The documents may come fromteaching and research institutions in France orabroad, or from public or private research centers.
L’archive ouverte pluridisciplinaire HAL, estdestinée au dépôt et à la diffusion de documentsscientifiques de niveau recherche, publiés ou non,émanant des établissements d’enseignement et derecherche français ou étrangers, des laboratoirespublics ou privés.
Acoustic monitoring of a prestressed concrete beamreinforced by adhesively bonded composite
Sylvain Chataigner, Laurent Gaillet, Yannick Falaise, Jean-François David,Richard Michel, Christophe Aubagnac, Adrien Houel, Didier Germain,
Jean-Philippe Maherault
To cite this version:Sylvain Chataigner, Laurent Gaillet, Yannick Falaise, Jean-François David, Richard Michel, et al..Acoustic monitoring of a prestressed concrete beam reinforced by adhesively bonded composite. SMAR2017, the fourth International Conference on Smart Monitoring, Assessment and Rehabilitation of CivilStructures, Sep 2017, ZURICH, Switzerland. 8p. �hal-01639156�
Acoustic monitoring of a prestressed concrete beam reinforced by adhesively bonded composite
Sylvain Chataigner1, Laurent Gaillet
1, Yannick Falaise
1, Jean-François David
1, Richard Michel
1,
Christophe Aubagnac2, Adrien Houel
2, Didier Germain
2, Jean-Philippe Maherault
2
1 French Institute of Science and Technology for Transport, Development and Networks, IFSTTAR,
Bouguenais, FRANCE 2 National Centre for Studies and Expertise on Risks, Environment, Mobility and Urban and Country
Planning, CEREMA, France
ABSTRACT: The use of adhesively bonded composite reinforcement is relatively widely used
for concrete structures. Yet, some questions remain regarding its use in the case of prestressed
concrete structures especially in relation with the influence of existing cracking and the
verification of the encountered damage phenomena at real scale. French National Organism
Cerema with the help of French motorway bridge owners association ASFA and French
National Research Organism IFSTTAR realized several real size experimental investigations of
an old prestressed concrete beam coming from a deconstructed bridge to answer these questions
(Project CLERVAL). Both flexure and shear tests up to failure were carried out and several
measurement methods were used to understand the role of the composite reinforcement on the
behavior of the structure and the damage scenario. Acoustic emission was one of these methods
and two different systems were investigated. The proposed communication will first describe
the two used acoustic systems and their dedication. A specific development will then be
presented aiming at optimizing the obtained acoustic phenomena localization. Finally, main
results will then be presented for both flexure and shear tests. The obtained results are currently
compiled with the results from the other measurement methods. This should allow to better
understand the damage process of reinforced prestressed concrete beams and to assess the
precision of existing reinforcement design methods.
1 DESCRIPTION OF THE PROJECT “CLERVAL”
In France, many precast prestressed concrete beam bridges were built in the 1970s. They may
suffer from the corrosion of the prestressed cables and from a lack of passive reinforcement that
may induce brittle failure. In addition, the traffic increase may require their strengthening. For
all these situations, the use of adhesively bonded composite reinforcement represents a good
alternative to realize the required reinforcement or to ensure structural safety (AFGC, 2011;
Benzarti et al., 2011).
Though many studies have been carried out to check the adequacy of such reinforcement
methods, there are still some issues regarding reinforcement of damaged prestressed concrete
beams with existing cracks. There are also very few real scale tests, more particularly on aged
beams and it was consequently decided to carry out such a test in a project called “CLERVAL”.
This project was led by CEREMA (National centre for studies and expertise on risks,
environment, mobility and urban and country planning) in collaboration with ASFA (French

motorway owners association) and IFSTTAR (French Institute of Science and Technology for
Transport, Development and Networks.
1.1 Presentation of the beam being tested
The used prestressed concrete beam comes from a viaduct over the river Doubs at Clerval that
was erected between 1952 and 1954 and demolished in 2002. This beam was 30 m long and 1.3
m high and it had two initial bend cracks with a maximum opening of 0.2 mm (sections S2 and
S4). Prestressing cables are not straight and their position is not symmetric (figure 1). The
prestressing system is STUP 12 Phi5.
Figure 1. Photo of the studied beam and scheme of the prestressing cables position on one side of the beam
Several investigations took place on the beam before the realization of the test program to
identify existing defects, characterize the concrete, check the exact reinforcement and
prestressing cables position and amount, assess residual prestress level and prestressing ducts
injection quality (Houel et al., 2015).
1.2 Test program
In order to obtain a maximum of information from the realized investigations, the test program
was divided in several steps.
Figure 2. Scheme of the flexural reinforcement applied on the flange of the beam
First steps were dedicated to the study of flexural reinforcement (using adhesively bonded
pultruded composite lamellas: 50 x 1.2 mm², 165 GPa) (Figure 2) in 3-point bending
configuration (span: 29.34 m and force applied 12.9 m from support) and included:
- First loading before reinforcement (up to 240 kN): This phase allowed identifying and
localizing crack activation along the beam.
- Loading after first flexural reinforcement (2*3 50 mm wide plates) (up to 300 kN): This
phase allowed studying the role of flexural reinforcement in cracked sections. After this
series of test, reinforcement was cut at section S2 in order to decrease locally the
capacity of the beam.
- Loading up to failure after second flexural reinforcement (4*3 50 mm wide plates) (up
to 614 kN): This allowed identifying the failure process and assessing predictive
approaches.
Second steps were realized on third of the beam and dedicated to the study of shear
reinforcement (using adhesively bonded carbon sheet: five 150mm-wide U-sheets with a
spacing around 300 mm, and one specific horizontal edge reinforcement, 105 GPa) in 3-point
bending configuration (span: 9.7 m, and force applied at 1.54 m from support) and included:
- First loading (up to 1100 kN): This phase allowed identifying and localizing crack
activation along the beam.
- Second loading after additional reinforcement up to failure (up to 1970 kN): this
allowed identifying failure process and its localization.
1.3 Monitoring during the test
Many different monitoring systems were settled on the beam during the different test steps in
order to be able to compare modeling or design theories with the actual beam behavior with or
without composite reinforcement. More traditional sensors included rotation, temperature,
resistive strain, crack opening, and displacement sensors. Less usual systems were also applied
as curvature measurement, optical fiber strain measurement, and acoustic techniques. The
present article focuses on the results obtained with this last method. Two different acoustic
systems were used and are described in the next part.
2 DESCRIPTION OF THE USED ACOUSTIC SYSTEMS
2.1 Overall acoustic survey
The first acoustic system that was applied for each test up to failure aimed at investigating the
overall failure process focusing on high energy release phenomena detection. The system is
currently used for cable-stayed bridges survey in France (Le Cam et al., 2009) and is
commercialized by A3IP. It relies on the use of accelerometer sensors with a natural frequency
of 22 kHz, and a specific synchronizing system Pegase. The system allows obtaining 1D
localization of high energy phenomena mostly encountered at steel wire failures. The detection
threshold was fixed at 2G and three sensors must detect the phenomenon before obtaining an
acoustic event.
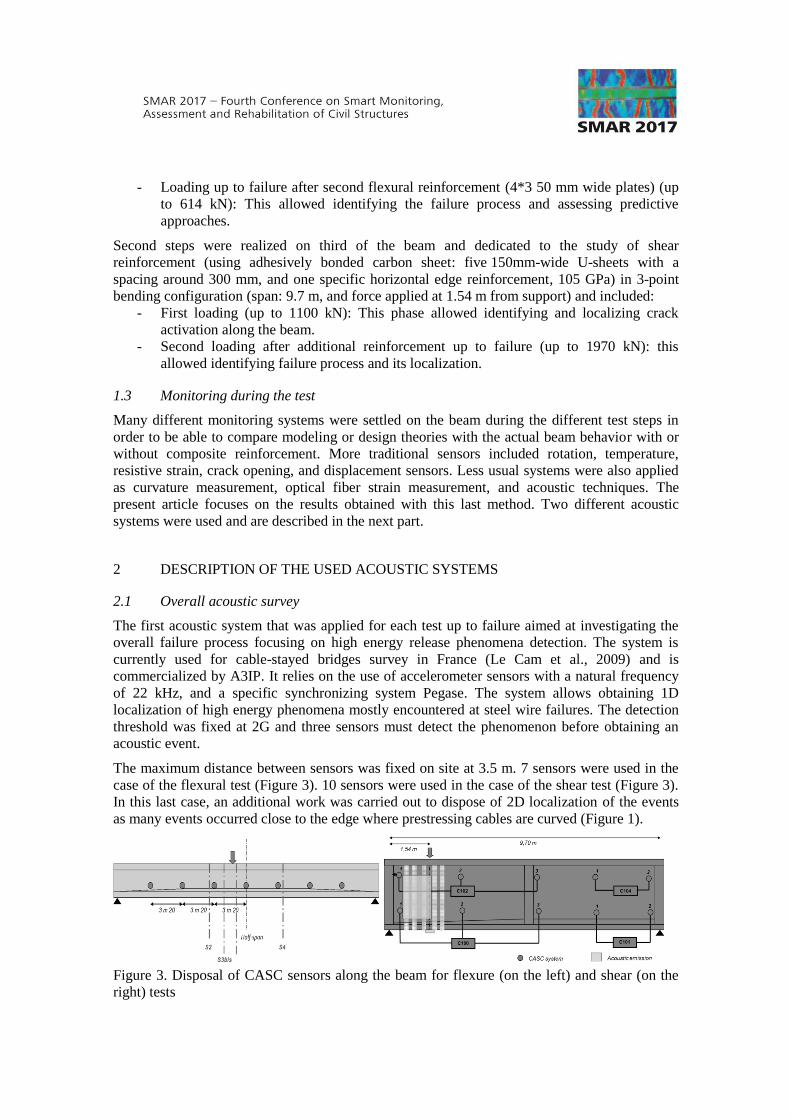
The maximum distance between sensors was fixed on site at 3.5 m. 7 sensors were used in the
case of the flexural test (Figure 3). 10 sensors were used in the case of the shear test (Figure 3).
In this last case, an additional work was carried out to dispose of 2D localization of the events
as many events occurred close to the edge where prestressing cables are curved (Figure 1).
Figure 3. Disposal of CASC sensors along the beam for flexure (on the left) and shear (on the
right) tests

2.2 Localized acoustic emission
The localized acoustic emission system used during this test is a commercialized by MISTRAS
and relies on the use of piezoelectric sensors having a natural frequency of 150 kHz. The system
allows the synchronization of up to 16 sensors and 2D localization of the events. A threshold of
35 dB was used and the speed of acoustic wave was calibrated before each test campaign. Other
acoustic parameters were chosen according to experience obtained in experimental campaigns
in (Rossi et al., 2012) and (Ramadan et al., 2008).
Figure 4. Disposal of localized acoustic emission sensors for flexure (on the left) and shear (on
the right) tests
In the case of the flexure test, 3 zones were more particularly studied: sections S2 and S4 above
areas where cracks were identified and section S3/S31 (Figure 4). In the case of the shear test,
the edge zone reinforced with composite and between the applied force and the support was
more particularly studied.
3 MAIN RESULTS OBTAINED DURING FLEXURE TESTS
It will not be possible to present here all the results from the flexural test campaign. Yet, several
main results from both systems will be highlighted to address the potentiality of these methods
and their comparison with more traditional monitoring systems.
3.1 Identification of the crack activation using localized acoustic emission
In the case of flexural tests, the localized acoustic emission system was mainly aimed at
identifying the crack propagation in pre-determined cracked areas (sections S2 and S4). Though,
from calculation, during flexural test before reinforcement, crack propagation should have
occurred first in section S2, it was proved that it actually started in section S4. This was detected
both from acoustic emission, crack opening sensor and strain gage measurements. It was
checked that the localization of acoustic events was similar to the visual crack identification
made after the initial flexural test (Figure 5).
Besides, for the three flexural phases, acoustic emission data was compared with crack opening
measures (Figure 6). It can be seen that both are not always correlated. Acoustic emission
allows following crack propagation, though crack opening measure may not induce crack
propagation. It can also be seen that the reinforcement has slightly delayed the onset of crack
propagation. Acoustic emission technique seems thus to be a good indicator to check the
activity of a crack on-site and to detect the crack tip localization. It may also be used to assess
the quality of reinforcement or repair.

Figure 5. Comparison of 2D localization of events and the visual crack identification after the
test at S4 section during initial flexure tests
Figure 6. Number of acoustic events and measured crack opening in function of the applied
force before reinforcement, after first flexural reinforcement and after final flexural
reinforcement at section S4
3.2 Identification of the failure process using overall acoustic survey
The overall acoustic survey with CASC system was carried out during the final test up to
failure. It allows detecting main acoustic events and proposing corresponding failure
phenomenon depending on the measured parameters (number of sensors detecting the event,
wave speed, maximum amplitude). To do this, it was decided to rely on the methodology
proposed in (Robert et al., 1999) to determine events corresponding to one prestressing steel
wire failure, several prestressing steel wires failure and a bunch of prestressing steel wire
failures).
All the 1D localized events with the corresponding energy have been reported on figure 7. First
events were detected from 400 kN to 480 kN in section S4 and in a section where corrosion was
detected before the realization of the test. It seems that the encountered failures of prestressing
steel wires induced a strong change in the behavior of the beam. Then, several prestressing steel
wires broke before the final failure that occurred at 615 kN (composite peeling-off in section
S2). Acoustic survey allowed with the other monitoring devices to determine the failure process.
All the detected acoustic events seem in that case to be attributed to prestressing steel wires
failures (when composite peeling-off occurred the beam was maybe too much damaged for the
acoustic system to detect it).

Figure 7. 1D acoustic events along the beam during flexure test
4 MAIN RESULTS OBTAINED DURING SHEAR TESTS
It is important to note that the shear test was carried out on one third of the previous beam that
had already been submitted to flexural test up to failure. Yet, the test has been made on a part at
the edge that has been little damaged and where no major acoustic event has been detected.
4.1 Identification of the damage in the edge zone using localized acoustic emission
Figure 8. Localized acoustic emission events during shear test up to failure (carbon sheets and
prestressing cables are visualized)

The localized acoustic emission system was settled in the reinforced area between the load
application and the support. It allowed localizing the acoustic events during the shear test in this
area during the whole test (Figure 8). Four main periods were determined. During the first
period up to 1700 kN, acoustic events mainly occurred under the load application demonstrating
flexure damage rather shear damage. At the end of this period, flexural composite plates peeled-
off. From 1700 kN to 1900 kN, most of acoustic events were detected in the corner close to the
edge. This corresponds to a crack that was visually detected at the end of the test in this zone.
From 1900 kN to the ultimate capacity (1970 kN), the acoustic emission was gain localized
under the applied load. At failure, a main crack was observed under the applied load.
Though, some investigations are still under progress, acoustic emission allowed in that case
identifying different failure steps during the test. The results were compared with visual
inspection led during and after the test and good match was obtained. However, no particular
acoustic emission could be revealed under the bonded carbon sheets indicating though high
mechanical stresses have been measured on them with strain gages.
4.2 Identification of the failure process using overall acoustic survey
In the case of the shear test, two lines of 5 sensors have been disposed along the beam (Figure
3). The system being settled to carry out 1D localization, it was possible to localize the detected
events along the beam. Yet, in the case of the shear test, as main failure occurs at the edges
where most of prestressing cables are not linear (Figure 1), it was decided to develop the
existing system to realize a 2D localization of the events.
This was done in (Thobie, 2016) and relied on a hyperbolic triangulation taking into account the
anisotropy of the structure caused by the inclination of prestressing steel wires. The precision of
the method was assessed through pre-test calibration investigations to be around 16 cm.
Some acoustic events were detected during first shear loading phase. It actually corresponded to
a concrete crack propagation induce by a poor mechanical link between the top flange and the
rest of the beam. Such a detection seems surprising as it is often too low energy to be detected
using such a system. Additional shear reinforcement was applied before the realization of the
final shear test to avoid this unexpected damage mode.
The detected events during the shear test have been localized in Figure 9. A similar work to the
one carried out in the case of the flexure test was done here. The events 1, 2, 3, 4 and 7 proved
to have too low propagation speed to be attributed to prestressing steel wire failure. They may
be attributed to flexural composite peeling-off in flexure or high energy fretting. Events 6, 8, 9
and 10 may be attributed to prestressing steel wire failure. They are all localized in the same
area (cable 19).
Figure 9. 2D localization of acoustic events during shear test up to failure

5 CONCLUSIONS
Though additional investigations are currently still under progress to validate the made
observations or to compare the results obtained from different measurement systems, this article
aimed at highlighting the main information gathered from acoustic monitoring during the
different mechanical tests that were realized on a real-scale prestressed concrete beam coming
from a real bridge and therefore in realistic ageing conditions. Acoustic techniques proved to be
complementary with other monitoring techniques. Two different systems were used to get
interest in specific locations (localized acoustic emission) or on the overall beam behavior
during the test (CASC system).
The localized acoustic emission allowed checking the activation of existing cracks during the
different phases of the flexural test and is one of the most adapted techniques for such an issue.
It also allowed studying the edge zone during the shear test to propose a damage scheme of the
beam.
The CASC system allowed to localize in 1D the most energetic events and a specific
methodology was used to match the event with a physical phenomenon (mainly prestressing
steel wire failure). It allowed proposing a damage process in flexure that matched well with the
other measurement. In shear, the obtained results are still under study and it was observed that
the acoustic events may not be only attributed in that case to prestressing steel wire failures.
Some additional investigations are under progress taking into account additional exploitation
methodologies proposed in (Grosse et al., 2008) and (Nair et al., 2010). In addition, the results
will be soon compared with modeling under progress and with the results of an autopsy of the
beam led by hydro demolition.
The authors wish to acknowledge the support of ASFA (French motorway owners association).
6 REFERENCES
AFGC. 2011. Réparation et renforcement des structures en béton au moyen des matériaux composites –
recommandations provisoires, Association Française de Génie Civil.
Benzarti K., Quiertant M., 2011, Preface for special issue on composite materials and adhesive bonding
technology, Construction and Building Materials, 25(2):409-410.
Grosse C.U., Ohtsu M., 2008. Acoustic emission testing, Springer.
Houel A., Aubagnac C., Germain D., Maherault J.P., 2015, Experimental breaking of a prestressed
concrete bridge beam reinforced with bonded FRP, Implementing innovative ideas in structural
engineering and project management, Edited by Saha S., Lloyd N., Yazdani S. and Singh A., ISEC
Press.
Le Cam V., Gaillet L., 2009. A smart and wireless sensors network for cable health monitoring,
Proceedings of NDTCE’09, Non-destructive Testing in Civil Engineering, Nantes, France.
Nair A., Cai C.S., 2010. Acoustic emission monitoring of bridges: review and case studies, Engineering
Structures, 32: 1704-1714
Ramadan S., Gaillet L., Tessier C., Idrissi H., 2008. Detection of stress corrosion cracking of high-
strength steel used in prestressed concrete structures by acoustic emission technique, Applied surface
science, 254:2255-2261.
Robert J.L., Brevet P., Bruhat D., Gervais J.P., 1999. La surveillance acoustique appliquée au Pont Neuf
à Foix (Ariège), Report PB/MMC 99-353, LCPC, 1999.
Rossi P., Tailhan J.L., Le Maou F., Gaillet L., Martin E., 2012. Basic creep behavior of concretes
investigation of the physical mechanisms by using acoustic emission, Cement and concrete research,
42:61-73.
Thobie F., 2016. Traitement des données issues de capteurs acoustiques lors d’un essai à rupture sur une
poutre de pont en béton précontraint, Master Thesis, INP Grenoble.