
Acoustic Emission Investigation of Coating Fracture … · ACOUSTIC EMISSION INVESTIGATION OF...
13
J. Acoustic Emission, 26 (2008) 1 © 2008 Acoustic Emission Group ACOUSTIC EMISSION INVESTIGATION OF COATING FRACTURE AND DELAMINATION IN HYBRID CARBON FIBER REINFORCED PLASTIC STRUCTURES MARKUS G. R. SAUSE 1 , DANIEL SCHULTHEIß 2 and SIEGFRIED HORN 1 1 University of Augsburg, Institute for Physics, Experimentalphysik II, D-86135 Augsburg, Germany; 2 BMW Group Forschung und Technik, D-80788 München, Germany Abstract Nickel-copper-coated and uncoated carbon-fiber reinforced plastic specimens were investi- gated by acoustic emission (AE) analysis during four-point bending tests and subsequently char- acterized by scanning electron microscopy. As a function of applied loading, AE originating from coating failure consisting of crack initiation, crack growth and delamination was detected. The evolution of coating failure observed by AE is consistent with the degradation detected by electron microscopy. In particular, the AE originating from coating failure turns out to be distin- guishable from signals arising from failure of the carbon-fiber reinforced plastic. The combina- tion of pattern recognition techniques and advanced frequency-spectrum analysis shows promise to distinguish between different failure mechanisms and, therefore, could be a valuable tool for the investigation of comparable hybrid materials. 1. Introduction In recent years, the aerospace and automotive industry has developed a lively interest in lightweight applications. Reducing overall weight is the key for energy efficiency, a larger carry- ing capacity and, therefore, greater competitiveness. In this context, the European project StorHy (Hydrogen Storage Systems for Automotive Application) investigates a liquid-hydrogen tank system made of carbon-fiber reinforced plastic (CFRP). While the required mechanical strength of such tank systems can be achieved by usage of CFRP [StorHy, 2007], the gas permeability is remarkably higher than in conventional metallic storage systems [Schultheiß, 2007]. The most encouraging approach to decrease gas permeation through CFRP is to apply a metallic coating, a so-called liner. Recently several liner materials and methods for coating of CFRP vessels were investigated in StorHy. The best liner solution turned out to be chemically deposited copper, followed by an electroplated copper layer. A closely related liner system also investigated in StorHy is a nickel-copper coating [Schultheiß, 2007]. The characterization of adhesive strength and of maximum allowable strain during mechanical loading of such liner materials is of great importance to optimize the method of liner application and to predict the gas-tightness of a liner under real environmental conditions. Commonly used surface-sensitive diagnostic methods like scanning electron microscopy (SEM) are insufficient tools for the detection of all possible failure sources. Due to the thickness of the metallic liner, which is in the range of 20 - 60 µm, we can only investigate the delamina- tion between liner and CFRP substrate by SEM after completion of mechanical loading and sub- sequent destruction of the sample. A direct correlation between the applied strain and the first appearance of delamination and its further progress is impossible. In contrast, acoustic emission (AE) analysis provides a suitable method to obtain the strain dependence of crack formation and crack growth within the liner and liner delamination. In the following, we refer to these mecha- nisms as coating failure.
Transcript of Acoustic Emission Investigation of Coating Fracture … · ACOUSTIC EMISSION INVESTIGATION OF...

J. Acoustic Emission, 26 (2008) 1 © 2008 Acoustic Emission Group
ACOUSTIC EMISSION INVESTIGATION OF COATING FRACTURE AND DELAMINATION IN HYBRID CARBON FIBER REINFORCED
PLASTIC STRUCTURES
MARKUS G. R. SAUSE1, DANIEL SCHULTHEIß2 and SIEGFRIED HORN1
1University of Augsburg, Institute for Physics, Experimentalphysik II, D-86135 Augsburg, Germany; 2BMW Group Forschung und Technik, D-80788 München, Germany
Abstract Nickel-copper-coated and uncoated carbon-fiber reinforced plastic specimens were investi-gated by acoustic emission (AE) analysis during four-point bending tests and subsequently char-acterized by scanning electron microscopy. As a function of applied loading, AE originating from coating failure consisting of crack initiation, crack growth and delamination was detected. The evolution of coating failure observed by AE is consistent with the degradation detected by electron microscopy. In particular, the AE originating from coating failure turns out to be distin-guishable from signals arising from failure of the carbon-fiber reinforced plastic. The combina-tion of pattern recognition techniques and advanced frequency-spectrum analysis shows promise to distinguish between different failure mechanisms and, therefore, could be a valuable tool for the investigation of comparable hybrid materials. 1. Introduction In recent years, the aerospace and automotive industry has developed a lively interest in lightweight applications. Reducing overall weight is the key for energy efficiency, a larger carry-ing capacity and, therefore, greater competitiveness. In this context, the European project StorHy (Hydrogen Storage Systems for Automotive Application) investigates a liquid-hydrogen tank system made of carbon-fiber reinforced plastic (CFRP). While the required mechanical strength of such tank systems can be achieved by usage of CFRP [StorHy, 2007], the gas permeability is remarkably higher than in conventional metallic storage systems [Schultheiß, 2007]. The most encouraging approach to decrease gas permeation through CFRP is to apply a metallic coating, a so-called liner. Recently several liner materials and methods for coating of CFRP vessels were investigated in StorHy. The best liner solution turned out to be chemically deposited copper, followed by an electroplated copper layer. A closely related liner system also investigated in StorHy is a nickel-copper coating [Schultheiß, 2007]. The characterization of adhesive strength and of maximum allowable strain during mechanical loading of such liner materials is of great importance to optimize the method of liner application and to predict the gas-tightness of a liner under real environmental conditions. Commonly used surface-sensitive diagnostic methods like scanning electron microscopy (SEM) are insufficient tools for the detection of all possible failure sources. Due to the thickness of the metallic liner, which is in the range of 20 - 60 µm, we can only investigate the delamina-tion between liner and CFRP substrate by SEM after completion of mechanical loading and sub-sequent destruction of the sample. A direct correlation between the applied strain and the first appearance of delamination and its further progress is impossible. In contrast, acoustic emission (AE) analysis provides a suitable method to obtain the strain dependence of crack formation and crack growth within the liner and liner delamination. In the following, we refer to these mecha-nisms as coating failure.

2
In the past, many papers concerning the distinction between AE signals due to different fail-ure mechanisms were published. Based on classical methods like AE activity changes, amplitude distribution and source localization, a change in AE signals during loading of CFRP specimens was observed [Ceysson, 1995], [Sato, 1986], [Komai, 1991]. A further assignment of AE signals to at least two distinct types of failure was achieved by measurement of waveform, wave mode and frequency distribution [deGroot, 1995], [Ni, 2007]. For fiber failure a significant spectral weight was observed at frequencies above 350 kHz, whereas the spectral weight of AE signals relating to matrix failure shifts to lower frequencies (< 350 kHz) [Bohse, 2001]. Several studies investigated crack formation, crack progress and delamination of metallic coatings on metallic substrates. Here AE signals were used to determine the quality of coatings [Fu, 2000]. It was demonstrated that AE signals due to different failure mechanisms can be sepa-rated using wave-mode analysis and AE activity analysis [Lin, 1997], [Ma, 2001], [Nikulin, 2005]. In [Miguel, 2003] fatigue evolution for tungsten-carbide/cobalt-coated steel specimens was investigated and four different stages of fracture could be distinguished. Unsupervised pattern recognition techniques provide a completely different approach to clas-sify AE data. Here, a set of N parameters characteristic for a waveform are extracted, and in the following this set is used to represent the respective AE signal. The values of these parameters are arranged into a N-dimensional space and are scanned for accumulation points using cluster-ing algorithms. According to [Anastassopoulos, 1995, 2000] optimization of numerical discrimi-nation between resulting clusters can be achieved using the heuristic ratios τ and Rij as a meas-ure. Rij is the mean value of the ratios, calculated from average within-cluster-distance to dis-tance between any pair of clusters, whereas τ is defined by the ratio of the minimum distance between any pair of clusters to the maximum of the average within-cluster distances. If the sepa-ration between the clusters is large enough the respective AE is likely to be of different origin. Numerical optimization (minimizing Rij, maximizing τ) of these heuristic ratios as a function of cluster numbers can be used to estimate the number of associated failure mechanisms recorded within the dataset [Anastassopoulos, 1995]. In Ativitavas [2006] and Anastassopoulos [2000], it is also shown that clustering techniques using neuronal network algorithms can successfully distinguish between failure mechanisms in complex CFRP structures and, therefore, are the most promising algorithms for pattern recognition in CFRP materials. In the present investigation we want to establish the potential of AE analysis as a method for quality assurance and health monitoring of coated CFRP tank systems. Based on advanced AE analysis techniques like pattern recognition, the long-term objective is to distinguish between AE signals arising from liner material failure and those due to failure of structural integrity of CFRP. In this report, we focus on failure mechanisms in the metallic liner. In our special case, we were able to distinguish AE signals originating from liner and CFRP by comparison of coated and uncoated specimens. 2. Experimental The present investigations were performed on rectangular CFRP-specimens according to DIN-EN-ISO 14125 (class IV type), i.e. specimen dimensions are (100±10) mm × (15±0.5) mm × (2±0.2) mm (l × w × h) [DIN14125]. The matrix consists of a polyurethane-based epoxy resin (Araldite: LY 564/HY 2954). Carbon fibers of type SIGRATEX KDK 8054/120 are arranged in

3
six plies (0°- 90° textured) of woven fabric. The CFRP substrates were coated by subsequent chemical deposition of a 10-µm electroless Ni-layer and an electroplated 50-µm Cu-layer. The position of the coating was slightly asymmetric with respect to the midpoint of the sample (coat-ing offset, see Fig. 1) with dimensions of (25±1) mm × (15±0.5) mm (l × w). This coating di-mension avoids contact between the lower supports and coating during four-point bending. Bending tests were also performed according to DIN-EN-ISO 14125 with an inner distance be-tween supports of (27±1) mm and an outer distance of (81±2) mm, respectively (see Fig. 1). An Instron machine (Type 8502) was used for loading of the specimens. For all measure-ments the specimen was oriented with the coating on the tensile loading side (specimen bottom), which corresponds to the outer side of a pressurized vessel. To ensure a statistically representa-tive result, five coated and five uncoated samples were investigated using AE analysis. Another eight coated specimens were subjected to different strain levels for investigation in an environ-mental SEM (Type XL30, FEI Company) to compare microscopic observations with results de-rived from AE-analysis.
Fig. 1: Schematic drawing of experimental setup (left) and photograph of specimen including dimensions (right). Acoustic emission was detected by two PAC-WD50 wideband sensors in linear geometry. For acoustic coupling Baysilone silicone grease (Bayer Material Science) of medium viscosity was used, the mechanical contact being provided by two clamps. To suppress detection of fric-tion noise a band-pass ranging from 20 kHz up to 3 MHz was used. In addition, hard rubber plates were positioned below the lower supports, to minimize hydraulic noise arising from the bending machine. The hard rubber plates had no significant influence on the mechanical loading properties due to their hardness in comparison to the maximum load level. The AE waveforms were recorded using a PAC PCI-2 data acquisition system with AEwin software at a sampling rate of 10 MS/s. Data reduction was performed using the software Noesis (Enviroacoustics). To analyze AE, the AE signals were localized in linear geometry and only the events within a dis-tance of 40 mm around the specimen center were considered in the investigation. As the exact phase and group velocities depend on the propagating medium and propagation direction [Lee, 2005], the sound velocity used for localization was calculated from automatic sensor tests (AST) [AEwin, 2002]. The so determined velocity varied between 5000 m/s and 6000 m/s. Based on the sensors diameter of 10 mm, a time window for delay-time determination was calculated, which corresponds to an uncertainty in sound velocity of the order of 1000 m/s. This uncertainty also includes an error assumption for delay-time determination. In total, the error estimation for linear location resulted in ±2.5 mm. The remaining AE signals were analyzed following a classical approach based on waveform parameters, signal location and activity changes. Following references [Anastassopoulos, 1995,

4
2000], [Noesis, 2006] and [Philippidis, 1998], the same waveform parameters were also investi-gated using unsupervised pattern recognition techniques to separate the AE of different failure mechanisms. For this purpose the heuristic discrimination of the AE signals dependent on cluster numbers was investigated. The heuristic ratios Rij and τ used for the determination of discrimina-tion efficiency during unsupervised pattern recognition are automatically calculated by Noesis for each partitioning applied to a dataset [Noesis, 2006]. Both values are heuristic criteria based on the ratio of average within-cluster distances to the distance between clusters. Rij is the mean value of the ratios, calculated from average within-cluster distance to the distance between any pair of clusters, whereas τ is defined by the ratio of the minimum distance between any pair of clusters to the maximum of the average within-cluster distances. Therefore, minimization of Rij and maximization of τ results in better discrimination of the resulting data partition. The 12 AE parameters were chosen to provide a correlation level between 16% and 80%. Eliminating wave-form parameters like threshold (constant), channels and runtime parameters, the remaining pa-rameters were projected on their principal component axis using a covariance analysis. K-means and Kohonen liquid vector quantizers (LVQ) were used as clustering algorithms with several weighting options for normalization procedures. Finally, using frequency power spectrum analy-sis a comparison between signal clusters obtained from pattern recognition was performed. For this purpose, a Fourier transform on each waveform with a rectangular window function and 0.1-µs resolution using the Danielson-Lanczos algorithm was performed. This yielded defined fre-quency power spectra. Subsequently the arithmetic average, standard deviation, maximum and minimum values were calculated for each cluster using self-written software. 3. Results and Discussion 3.1 Scanning Electron Microscopy
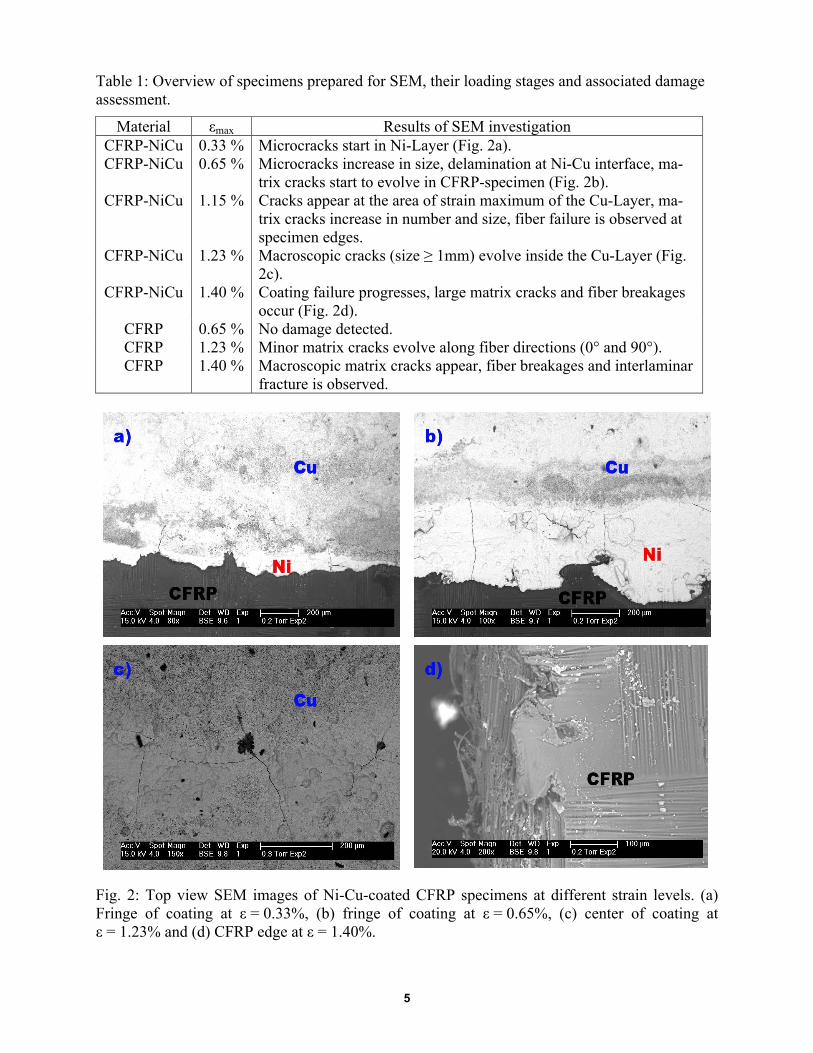
Five coated and three uncoated samples were loaded to different strain levels. Their AE was recorded and afterwards the structural damage was assessed by scanning electron microscopy. The SEM investigations were used to correlate AE signals and the corresponding failure mecha-nism. An overview of the maximum load levels (εmax) and the respective damage as found by SEM in top view is given in Table 1.
At low strain levels (ε = 0.33%), microcracks develop in the nickel layer (Fig. 2a). With in-
creased loading (ε = 0.65%), the cracks grow beneath the copper layer and cause extensive de-lamination at the interface region between copper and nickel (Fig. 2b). At even higher strain lev-els (ε = 1.23%), macroscopic cracks evolve in the maximum strain region of the coating and propagate over the whole specimen width (Fig. 2c). For a strain level of ε ≥ 1.40%, matrix cracks, fiber-matrix debonding and fiber breakage are observed (Fig. 2d). In uncoated CFRP specimens, similar evolution of matrix and fiber failure is observed, but, remarkably, the onset of such failures in coated CFRPs shifts to strain values below ε = 0.65%. This could be due to an additional tension caused by the coating or by CFRP degradation during the liner application process. In the following, the results of the microscopic investigation will be used to correlate the AE signal and the observed failure mechanisms of the coating. To this end, we use the strain level and the location, at which cracks and delamination develop, as well as their frequency of occurrence.
3.2 Classical Approach To compare AE signals between coated and uncoated specimens loaded to ε = 1.73%, the classical approach of AE-energy and amplitude distribution analysis was chosen. The waveform parameters discussed in this investigation are defined according to [AEwin, 2002] as maximum
5
Table 1: Overview of specimens prepared for SEM, their loading stages and associated damage assessment.
Material εmax Results of SEM investigation CFRP-NiCu 0.33 % Microcracks start in Ni-Layer (Fig. 2a). CFRP-NiCu 0.65 % Microcracks increase in size, delamination at Ni-Cu interface, ma-
trix cracks start to evolve in CFRP-specimen (Fig. 2b). CFRP-NiCu 1.15 % Cracks appear at the area of strain maximum of the Cu-Layer, ma-
trix cracks increase in number and size, fiber failure is observed at specimen edges.
CFRP-NiCu 1.23 % Macroscopic cracks (size ≥ 1mm) evolve inside the Cu-Layer (Fig. 2c).
CFRP-NiCu 1.40 % Coating failure progresses, large matrix cracks and fiber breakages occur (Fig. 2d).
CFRP 0.65 % No damage detected. CFRP 1.23 % Minor matrix cracks evolve along fiber directions (0° and 90°). CFRP 1.40 % Macroscopic matrix cracks appear, fiber breakages and interlaminar
fracture is observed.
Fig. 2: Top view SEM images of Ni-Cu-coated CFRP specimens at different strain levels. (a) Fringe of coating at ε = 0.33%, (b) fringe of coating at ε = 0.65%, (c) center of coating at ε = 1.23% and (d) CFRP edge at ε = 1.40%.

6
signal amplitude, absolute signal energy and root mean square (RMS) value of the waveform. Both the stress-strain curve (Fig. 3a) and the onset of AE activity indicate the start of failure in the uncoated CFRP substrates to occur at a strain level of ε = 1.0 - 1.2%. In contrast, a large number of additional AE signals arise for coated samples at ε ≤ 1.0% (see Fig. 3b). Since the CFRP samples are identical for both specimen series, these additional signals are attributed solely to coating failure. This is supported by the fact that the additional AE signals do not corre-spond to significant changes in the stress-strain curve (Fig. 3b) in contrast to CFRP failure (Fig. 3a). This is expected since the liner should have a negligible influence on the specimens´ me-chanical properties, which are dominated by the matrix-fiber interaction. Although AE signals from coating and CFRP failure are clearly distinguishable by the strain range of their occurrence, the distribution range of amplitude and energy is comparable (Figs. 3 and 4). For ε ≥ 1.0%, the highest amplitude and highest energy AE signals arise in both coated and uncoated samples, which go along with distinct dips in the stress-strain curve. Therefore, these correspond to severe failures inside the CFRP substrate like single or multiple fiber breakages. Comparable ampli-tudes and energies are also observed at strain levels ε ≤ 1.0% in coated CFRP specimens. Conse-quently, no clear distinction between liner and CFRP failure can be achieved based on the range of energy or amplitude distribution alone.
Fig. 3: Absolute energy of AE signal vs. strain (dots) and stress-strain diagram (line) in (a) un coated and (b) coated CFRP specimen.
Fig. 4: Amplitude of AE signal vs. strain (dots) and stress-strain diagram (line) in (a) uncoated and (b) coated CFRP specimen.
In the following we want to correlate the failure positions found by SEM to locations calcu-lated from the arrival time of the AE signals. In Fig. 5, a comparison between the x-location of the AE signals of coated and uncoated CFRPs is shown. For uncoated CFRP specimens, most

7
AE sources are located at two distinct positions, which correspond to the contact positions of the inner supports. At these positions, where the maximum stress level occurs, the highest damage level is observed in electron microscopy. In contrast, the locations of AE sources of the coated specimens are broadly distributed over the coated area (see Fig. 5b). SEM images as a function of loading show that cracks occur over the coated area with preferred direction perpendicular to the sensor alignment. In addition, at ε ≥ 0.65%, extensive delamination is observed. The delami-nation starts at the fringe of the coating and causes a large amount of AE signals from the coated area. Additionally, the distribution of the AE sources reflects the slightly asymmetric position of the coated area, with respect to the midpoint of the sample (coating offset). At the position of the inner supports, peaks with higher energies arise. These peaks also occur in uncoated CFRP specimens at equal stress levels and, consequently, are attributed to structural damage at the in-ner supports (see Fig. 5b).
Fig. 5: Absolute energy of AE signal vs. calculated x-position in (a) uncoated and (b) coated CFRP specimen. The previous discussion suggests that the AE signals detected below ε ≤ 0.8% arise solely from coating failure, and are therefore denoted “Coating AE signals” in the following. Further, AE signals recorded at bending tests of uncoated CFRP specimens are denoted “CFRP AE sig-nals”. In Fig. 6a, the absolute energy of the Coating AE signals (ε ≤ 0.80%) and CFRP AE sig-nals (ε ≤ 1.73%) of two representative datasets are plotted against their RMS-values. While for all Coating AE signal datasets, a well defined maximal RMS-threshold between 0.04 mV and 0.06 mV was found, the energy value range of the Coating AE signal and CFRP AE signal are not significantly different. All AE signals above this RMS threshold level are attributed to CFRP AE signals and arise at defined strain values, at which the stress-strain curve indicates partial or total structural failure of the CFRP specimen. CFRP AE signals with an RMS value below the threshold level are attributed to minor failures, like crack propagation through epoxy resin in fiber directions or between ply layers (Mode I and Mode II) [Bohse, 2001, 2004]. In summary, we attribute RMS-values above threshold level to structural failure, whereas signals due to coat-ing failure stay below the RMS-threshold. For other classical waveform parameters (durations, counts or calculated features like frequencies), no obvious distinction between AE signals of coating and CFRP failure was found. For both datasets discussed above (Coating AE signal and CFRP AE signal), all of the investi-gated waveform parameters are within the same range of values. This is exemplarily shown in Fig. 6b, in which the absolute energy is plotted against amplitude. All the conclusions discussed above apply to the complete set of specimens.

8
Fig. 6: (a) Absolute energy vs. RMS-value, including threshold value as discussed in text and (b) absolute energy vs. amplitude plot for two datasets. 3.3 Pattern Recognition Based on the conclusion that AE signals at low strain levels (up to ε = 0.8%) originate from coating failure, a sufficient number of AE signals is available to investigate the coating degrada-tion. In particular we will focus on the involved failure mechanisms of the coating. For this pur-pose, several datasets of Coating AE signals were investigated by unsupervised clustering algo-rithms, after manually eliminating AE signals arising from friction and electrical discharges. For all investigations an amount ≥ 98% of raw data was used. Following references [Anastassopoulos, 1995, 2000], [Noesis, 2006], [Philippidis, 1998], we investigated the discrimination behavior of each dataset by optimizing Rij and τ values. The re-spective dataset was partitioned into clusters using k-means and Kohonen LVQ algorithms avail-able in Noesis 5.1 [Noesis, 2006]. In the following, one representative dataset will be discussed. In Fig. 7a, the values of Rij and τ of this dataset obtained from both k-means and Kohonen LVQ algorithms are plotted against cluster numbers. In this investigation, a maximum of ten clusters was chosen, since saturation of Rij and τ values was already observed within this limit. Best numerical discrimination with a distinct minimum in Rij and a corresponding maximum in τ was achieved using Kohonen LVQ at four clusters (see Fig. 7a). For comparison, an analysis on the same dataset using k-means yielded no obvious discrimination optimum. An accompanying investigation of other datasets yielded similar results for Rij and τ, which are listed in Table 2. Figure 7b shows the partitioning based on the Kohonen LVQ in a suitable principal component covariance projection. The figure suggests that this procedure is suited to discriminate between recorded AE signals. In the following, AE signals belonging to the four clusters are marked by different colors. To further discuss the correlation between the obtained clusters and failure mechanisms we plot the absolute energy of AE signals vs. amplitude in Fig. 8a and the absolute energy vs. the strain, at which they occur in Fig. 8b. Additionally, the calculated x-location for each AE signal is plotted against its corresponding cluster number (marked by its designated color) in Fig. 9. AE signals belonging to cluster 1, which are only detected above ε = 0.3%, show the highest amplitudes and energies. As demonstrated in [Miguel, 2003], the highest signal amplitudes arise during rapid crack propagation and usually appear at medium stages of coating failure. The AE

9
Fig. 7: Optimization of Rij and τ values using k-means and Kohonen-LVQ algorithms (a) and dataset partitioning after clustering with Kohonen-LVQ in principal component projection (b).
Fig. 8: Optimal dataset partitioning in classical amplitude versus energy plot (a) and strain versus energy diagram (b).
Fig. 9: AE signal x-Location versus cluster number together with specimen dimensions.
sources of cluster 1 are located around the maximum stress region of a specimen and, therefore, the signals of this cluster can be associated with macroscopic crack propagation within the Cu-layer, consistent with SEM observations. In contrast, AE signals belonging to cluster 2 are broadly distributed in energy and ampli-tude. This cluster contains the largest number of AE signals. Based upon the micro-mechanical fracture model, it was shown in [Bohse, 2000] that energy release rate of Mode-I delamination is proportional to the crack velocity times specimen width. This corresponds to the delaminated coating area per time in our case. Due to the extensive delamination observed during loading this damage mechanism will produce a considerably higher amount of AE signals than crack propa-

10
gation. Because of the weak adhesion between coating and CFRP-substrate most specimens in-vestigated showed delamination in large areas. Even full-scale delamination was observed. The location of the corresponding AE sources shows a broad spatial distribution covering the whole coated area in agreement with SEM observations (see also 3.2). We, therefore, attribute AE sig-nals belonging to cluster 2 to coating delamination. An inspection of the recorded AE signals belonging to cluster 3 shows that they exhibit mul-tiple reflections or originate from transient noise. Reflections and transient noise strongly influ-ence the range of amplitude, energy and duration of AE signals. This can cause a large scattering of the values of these waveform parameters. Therefore, signals of this cluster are declared unde-fined and are ignored for further investigations. In fact applying the Kohonen LVQ algorithm to the different datasets resulted in either four or three distinguishable clusters as numerical opti-mum (see Table 2) depending on the quality of the respective dataset. The investigation of AE signals of cluster 4 also shows a large scattering of all classical waveform parameters. In contrast to cluster 3, AE signals of cluster 4 show a characteristic fre-quency composition and well-defined AE sources location. All signals belonging to cluster 4 originate from fringes of the coated area, and therefore can be correlated with a failure mecha-nism different from cluster 1 and 2. This correlation could not be achieved using waveform pa-rameters, but instead by investigating the AE power spectrum (see 3.4). Table 2: Parameters for dataset partitioning using Kohonen LVQ at numerical optimum and cor-responding number of clusters.
Specimen Number Rij τ Achieved Clusters 1 1.8454 0.72821 4 2 1.8577 0.81497 3 3 1.8621 0.94123 4 4 1.3941 0.95336 3 5 1.5313 0.91335 3
3.4 Power Spectrum Analysis The measured power spectrum is determined by the characteristics of the AE source and the transmitting medium. Due to anisotropic dispersion, anisotropic attenuation and frequency de-pendent attenuation in CFRP specimens [Bohse, 2004], the frequency distribution of the AE sig-nals is strongly dependent on its propagation path. To minimize this effect, our experimental setup ensures that the distance between AE source and sensor does not exceed 30 mm. At the same time, the used transducers provide a broad range of sensitivity. Based on these two meas-ures we can assume that both transducers are able to detect all frequency contributions to the AE signal within the used range of 20 kHz – 1 MHz. Hence we think that the influence of propaga-tion path length and frequency dependent dispersion and attenuation can be neglected. In the following an investigation of the averaged frequency power spectra was performed for each clus-ter derived from pattern recognition techniques. The respective power spectrum of each cluster averaged over all cluster members is shown in Fig. 10a for one representative dataset. In order to compare the power spectra of all clusters the intensity of the spectra was normalized to a major peak occurring at 267 kHz, which is common to all clusters. These normalized frequency power spectra are presented in Fig. 10b. Normalization procedure using the total area below the power spectrum yields the same result.

11
Fig. 10: Averaged power spectra for each cluster derived from pattern recognition (a) and after normalization (b). Due to its radiation direction, cracking (in-plane direction) is expected to cause more spectral weight at higher frequencies than delamination between coating and substrate (out-of-plane di-rection) [Bohse, 2004]. The average power spectrum of cluster 4 shows more weight at frequen-cies above 500 kHz, compared to both other clusters. As already discussed in 3.3, AE signals contributing to cluster 4 are located at the fringes of the applied coating. In this area the chemi-cally deposited nickel layer is not completely covered by copper and cracks in the nickel layer were observed in SEM imaging immediately at the onset of mechanical loading (see Figs. 2a and 2b). The fact that cracks appear immediately upon mechanical loading reflects the strain depend-ent evolution of AE signals contributing to cluster 4. These are also observed immediately at the onset and during mechanical loading. The fact that both sensors detected AE signals from both fringes of coating confirms our assumption that the effects of dispersion and frequency depend-ent attenuation are negligible in our experimental setup. Therefore we attribute cluster 4 to crack initiation and growth in the nickel-starting layer. The power spectra of clusters 1 and 2 behave similarly for frequencies above 500 kHz, but are distinctly different for frequencies below 140 kHz. Here cluster 2 shows more spectral weight than cluster 1. This difference in the power spectra reflects the difference of the corre-sponding failure mechanism as already discussed in 3.3. 4. Conclusions For metal-coated CFRP substrates investigated here, crack initiation and delamination be-tween coating and CFRP substrate could not be inferred from signatures in stress-strain curves and, therefore, could not be predicted solely from investigations of mechanical properties. In-stead, the onset of acoustic emission provides stress-dependent information about failure initia-tion in coatings applied to CFRP and can hence be used to determine its load limit. In addition, AE shows the ability to monitor the evolution of failure mechanisms in functional coatings as demonstrated by comparing SEM imaging and AE analysis as a function of loading. Based on RMS-values and localization of AE signals it appears to be possible to distinguish between struc-tural failure of the CFRP substrate and coating. An application of pattern recognition techniques to investigate the involved failure mecha-nisms of the coating yielded three distinct clusters of AE signals for all specimens investigated. A correlation of failure mechanisms (crack initiation, crack growth and delamination) observed in SEM investigations with AE signals could be obtained. This correlation shows good agree-

12
ment in location, time of origin and frequency of occurrence. AE signals corresponding to crack initiation and coating delamination are within the same range for most of the common waveform parameters. In contrast, the average power spectra calculated for each cluster were clearly distin-guishable, i.e., signals from coating cracks and delamination could be distinguished. In summary, we have shown that the combination of pattern recognition techniques and power spectrum analysis could be a powerful tool to identify failure mechanisms in hybrid mate-rials. This suggests that AE analysis is generally applicable for health monitoring and quality assurance of hybrid materials, as shown here in case of coated CFRP structures. Therefore, fur-ther investigations will focus on the determination of quality criteria of hybrid materials, e.g., to discriminate between failure mechanisms at the interface and in the bulk, respectively. References [AEwin, 2002] “AEwin Software”, User’s Manual, Physical Acoustics Corporation (2002). [Anastassopoulos, 1995] A. A. Anastassopoulos and T. P. Philippidis, “Clustering Methodology for the Evaluation of Acoustic Emission from Composites”, Journal of Acoustic Emission, 13, 11–21 (1995). [Anastassopoulos, 2000] A. Anastassopoulos, A. Tsimogiannis and D. Kouroussis, “Unsuper-vised Classification of Acoustic Emission Sources from Aerial Man Lift Devices”, World Con-ference on NDT -15th WCNDT, Roma, Italy (2000). [Ativitavas, 2006] N. Ativitavas, T. Pothisiri and T. J. Fowler, “Identification of Fiber-reinforced Plastic Failure Mechanisms from Acoustic Emission Data using Neural Networks”, Journal of Composite Materials, 40 (3), 193–226 (2006). [Bohse, 2000] J. Bohse, J. Chen and A. Brunner, “Acoustic Emission Analysis And Micro-Mechanical Interpretation of Mode I Fracture Toughness Tests On Composite Materials”, Frac-ture of Polymers and Composites and Adhesives, ESIS publication 27, pp. 15–26 (2000). [Bohse, 2001] J. Bohse and J. Chen, “Acoustic Emission Examination Of Mode I, Mode II and Mixed-Mode I/II Interlaminar Fracture Of Unidirectional Fiber-Reinforced Polymers”, Journal of Acoustic Emission, 19, 01–10 (2001). [Bohse, 2004] J. Bohse. “Acoustic Emission Examination Of Polymer-Matrix Composites”, Journal of Acoustic Emission, 22, 208–223 (2004). [Ceysson, 1995] O. Ceysson, M. Salvia and L. Vincent, “Damage Mechanisms Characterisation Of Carbon Fibre/Epoxy Composite Laminates By Both Electrical Resistance Measurements And Acoustic Emission Analysis”, Scripta Materialia, 34, 1273–1280 (1996). [deGroot, 1995] P. deGroot, P. Wijnen and R. Janssen. “Real-Time Frequency Determination Of Acoustic Emission For different Fracture Mechanisms In Carbon/Epoxy Composites”, Com-posites Science and Technology, 55, 405–412 (1995). [DIN14125] DIN-EN-ISO 14125, “Bestimmung der Biegeeigenschaften“ (1998).

13
[Fu, 2000] L. Fu, K. Khor, H. Ng and T. Teo, “Non-destructive evaluation of plasma sprayed functionally graded thermal barrier coatings”, Surface and Coatings Technology, 130, 233–239 (2000). [Komai, 1991] K. Komai, K. Minoshima and T. Shibutani, “Investigations of the Fracture Mechanism of Carbon/Epoxy Composites by AE Signal Analyses”, JSME International Journal, 34, 381–388 (1991). [Lee, 2005] J. Lee, Y. Kim and H. Kim, “Group Velocity of Lamb Wave S0 Mode in Laminated Unidirectional CFRP Plates”, Key Engineering Materials, 297-300, 2213–2218 (2005). [Lin, 1997] C. Lin, S. Leigh and C. Berndt, “Acoustic emission responses of plasma-sprayed alumina-3% deposits”. Thin Solid Films, 310, 108–114 (1997). [Ma, 2001] X. Q. Ma, H. Cho and M. Takemoto, “Acoustic emission source analysis of plasma sprayed thermal barrier coatings during four-point bend tests”, Surface and Coatings Technol-ogy, 139, 55–62 (2001). [Miguel, 2003] J. Miguel, J. Guilemany, B. Mellor and Y. Xu, “Acoustic emission study on WC/Co thermal sprayed coatings”, Materials Science and Engineering A, Vol. 352, pp. 55–63 (2003). [Ni, 2007] Q. Q. Ni and E. Jinen. “Fracture Behavior And Acoustic Emission In Bending Tests On Single-Fiber Composites”, Engineering Fracture Mechanics, 56, 779–796 (1997). [Nikulin, 2005] S. Nikulin, V. Khanzhin, A. Rozhnov, A. Babukin and V. Belov, “Analysis Of Crack Resistance And Quality Of Thin Coatings By Acoustic Emission”, Proc. The 8th Interna-tional Conference of the Slovenian Society for Non-Destructive Testing, Portoroz, Slovenia (2005). [Noesis, 2006] “NOESIS Advanced Acoustic Emission Data Analysis and Pattern Recognition & Neural Networks Software for Acoustic Emission Applications”, User’s Manual, Enviroacoustics S.E. (2006). [Philippidis, 1998] T. Philippidis, V. Nikolaidis and A. Anastassopoulos, “Damage Characterisa-tion of C/C laminates using Neural Network Techniques on AE signals”, NDT&E International, 31, 329–340 (1998). [Sato, 1986] N. Sato, T. Kurauchi and O. Kamigaito, “Fracture mechanism of unidirectional car-bon-fibre reinforced epoxy resin composite”, Journal of Material Science, 21, 1005–1010 (1986). [Schultheiß, 2007] D. Schultheiß, “Permeation Barrier for Lightweight Liquid Hydrogen Tanks”, PhD-thesis, University of Augsburg (2007). [StorHy, 2007] “StorHy - Hydrogen Storage Systems for Automotive Application”, 3rd Periodic Activity Report (2007).


![DEFORMATION AND FRACTURE ANALYSIS OF COATING … · the architecture and microstructure, as is the case for multilay-ers [2,3], and nanocomposite coatings [4,5], characterized by](https://static.fdocuments.net/doc/165x107/5e309f9efe4d8746143faf78/deformation-and-fracture-analysis-of-coating-the-architecture-and-microstructure.jpg)