ACM Survey on PhD Production in India in Computer Science · 2016-09-14 · ACM Survey on PhD...
8
ACM Survey on PhD Production in India in Computer Science Pankaj Jalote Director and Professor, IIIT Delhi PhD production in India in computer science has been an issue of concern over the last many years. In most discussions and reports, back-of-the-envelope calculations are used to estimate this data – often stated as less than 50. The purpose of this study is to collect reasonably reliable data on PhD production in CS in India, and then use it to identify useful trends and analyze these trends. This exercise is motivated by the Taulbee report in US [1]. Identifying the PhD Granting Institutions The first step in performing such a study is to identify a List of Institutions (Lol) whose data will be considered in the study. This step is needed because due to the widely variable quality of education offered by the large University setup in India, including all institutions giving PhD in computer science will not give a proper idea about the number of competent PhDs being produced. Restricting the study to a list of institutions ensures that the report focuses primarily on PhDs from places which are viewed as having the ability to produce decent quality PhDs. It should be added, however, that the number of PhDs being produced from other institutions not included in LoI is likely to be small as most of the well recognized institutions are included in the LoI and PhD programs of institutions which are not well recognized for research tend to be very small. The following approach was used for identify the LoI: Some institutions, by virtue of their standing and reputation, were included in LoI. Besides these institutions, of the institutions suggested, a review Board decided if they should be included (the criteria used for this was: if an institution has 5 or more faculty members with PhD in Computer Science, and is considered as worthy of inclusion by the review board, it was included in LoI. As it turns out at least one Institution that was included in the initial list did not satisfy this faculty criteria.) The Review Board consisted of HODs of CSE of original five IITs, IISc, and TIFR; heads of Microsoft Research, IBM research, TCS Labs, Infosys Labs; and some ACM India Council members. The Lol used for this study consists of 39 departments and is shown in Figure 1. Figure 1: List of Institutions (Lol) identified as having the ability to produce decent quality PhD’s in CS All IITs IISc Tata Institute of Fundamental Research (TIFR) Chennai Mathematical Institute (CMI) Institute of Mathematical Sciences (IMSc) NITs at Trichy, Surathkal, Warangal, MNIT Allahabad, Nagpur, Bhopal IIIT’s with PhD program: Allahabad, Bangalore, Hyderabad, Delhi Indian Statistical Institute, Kolkata Jadhavpur University Jawaharlal Nehru University
Transcript of ACM Survey on PhD Production in India in Computer Science · 2016-09-14 · ACM Survey on PhD...
ACM Survey on PhD Production in India in Computer Science
Pankaj Jalote Director and Professor, IIIT Delhi PhD production in India in computer science has been an issue of concern over the last many years. In most discussions and reports, back-of-the-envelope calculations are used to estimate this data – often stated as less than 50. The purpose of this study is to collect reasonably reliable data on PhD production in CS in India, and then use it to identify useful trends and analyze these trends. This exercise is motivated by the Taulbee report in US [1].
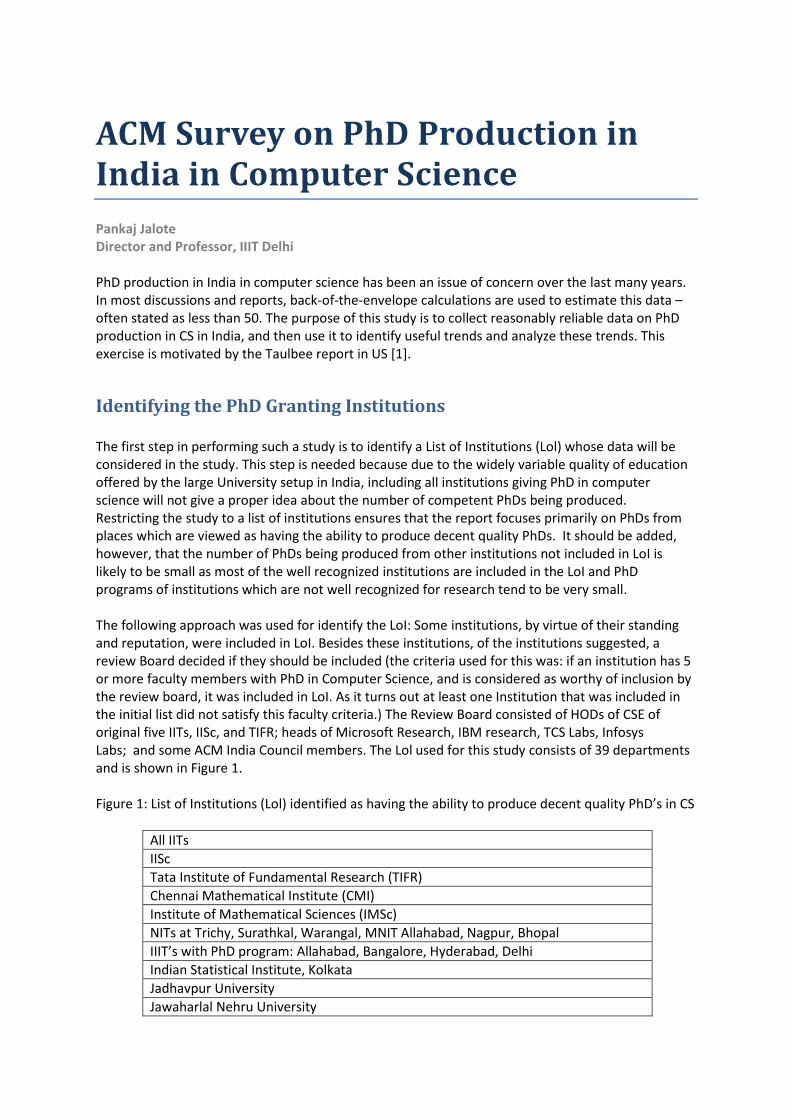
Identifying the PhD Granting Institutions The first step in performing such a study is to identify a List of Institutions (Lol) whose data will be considered in the study. This step is needed because due to the widely variable quality of education offered by the large University setup in India, including all institutions giving PhD in computer science will not give a proper idea about the number of competent PhDs being produced. Restricting the study to a list of institutions ensures that the report focuses primarily on PhDs from places which are viewed as having the ability to produce decent quality PhDs. It should be added, however, that the number of PhDs being produced from other institutions not included in LoI is likely to be small as most of the well recognized institutions are included in the LoI and PhD programs of institutions which are not well recognized for research tend to be very small. The following approach was used for identify the LoI: Some institutions, by virtue of their standing and reputation, were included in LoI. Besides these institutions, of the institutions suggested, a review Board decided if they should be included (the criteria used for this was: if an institution has 5 or more faculty members with PhD in Computer Science, and is considered as worthy of inclusion by the review board, it was included in LoI. As it turns out at least one Institution that was included in the initial list did not satisfy this faculty criteria.) The Review Board consisted of HODs of CSE of original five IITs, IISc, and TIFR; heads of Microsoft Research, IBM research, TCS Labs, Infosys Labs; and some ACM India Council members. The Lol used for this study consists of 39 departments and is shown in Figure 1. Figure 1: List of Institutions (Lol) identified as having the ability to produce decent quality PhD’s in CS
All IITs
IISc
Tata Institute of Fundamental Research (TIFR)
Chennai Mathematical Institute (CMI)
Institute of Mathematical Sciences (IMSc)
NITs at Trichy, Surathkal, Warangal, MNIT Allahabad, Nagpur, Bhopal
IIIT’s with PhD program: Allahabad, Bangalore, Hyderabad, Delhi
Indian Statistical Institute, Kolkata
Jadhavpur University
Jawaharlal Nehru University

Dhirubhai Ambani Institute of Information and Communication Technology
University of Pune
Amrita University
BHU IT
Birla Institute of Technology Pilani
IIT Bombay-Monash Academy
Data Collection To collect information regarding the PhD production in the institutions included in Lol, a form was created to collect data like full time faculty members with and without PhD, number of PhDs awarded between Aug 1, 2011 and July 30, 2012 in CS/IT, gender of students, area of PhD, nature of employment after PhD, number of PhDs in previous two academic years, number of full time PhD students currently enrolled, challenges and issues faced by the PhD program. This form was sent to the HODs of the institutions in the Lol. Reminders were also sent (it was also explained in the mails that if they do not provide the data, the study will estimate it.) A total of 26 gave the data (22 with filled form and others gave basic data on email) and rest did not reply. For the institutions that did not reply, information provided on its website about the total number of faculty members, and total number of PhD students enrolled was collected (generally data on graduating students is not available). However, while for 7 institutions we were able to get data on faculty as well as PhD students enrolled from their site, we were not able to get PhD enrollment data for the remaining 6 institutions but obtained data about their faculty size. In other words, we ended up having three groups of Institutions:
Group 1: Institutions which provided the data about number of Faculty, PhDs enrolled, and PhDs awarded
Group 2: Institutions which did not submit the filled form, but the number of Faculty, and the total number of PhDs enrolled was available on their website.
Group 3: Institutions which did not submit the form and we could not find information about the PhD students enrolled on their websites, but obtained information about CS faculty.
For Group 2 institutions we estimated the data on PhDs graduated in the last year as follows: From the Group 1 Institutions, we computed the ratio of the PhD graduated last year to total no of PhD students enrolled. Using this ratio (which is 0.12) and the data on total no of PhD students enrolled, we estimated the number of PhDs graduated last year. For group 3 institutions, we estimated the total no of PhD students as follows. We computed the ratio of total PhD students and faculty-with-PhD from group 1 and group 2 institutes (this ratio is 1.9). Using this ratio and information about the number of faculty with PhD, we estimated the total number of PhD students in these Institutes. Then using the method given above, we estimated the no of PhDs graduated in previous year.
Analysis In this section, we present the results of our analysis done on the obtained as well as estimated
data.
PhD production
The total number of PhDs granted between Aug 1 2011 and July 30 2012 was: 108 by the institutions in group 1, an estimated 11 by institutions in group 2, and an estimated 18) by institutions in group 3. The total for all institutions is 137, and total for institutions in group 1 and 2 is 119. Of the PhD students that graduated between Aug 1 2011 and July 30 2012 from institutions in group 1 which provided detailed data, appx 20% were female and 80% were male. Total number of enrolled PhD students in these institutions is as follows: 865 in institutions in group 1, 97 in institutions in group 2, and an estimated 155 in institutions in group 3. So, the total across all institutions is 1117, and across institutions in group 1 and 2 it is 962. Using this total, we can estimate the number of PhDs likely to be produced in the country in the coming years. We assume that 90% of these students will graduate over the next five years. If we expect that these graduations will be spread across 5 years with approximately uniform distribution, the number of PhDs graduating will come to around 200 per year for the coming five years. Since we know that the enrolment in PhD programs has been increasing over the past few years, we can expect the increase to be gradual. We assume that the increase in first year is x, in 2nd year is 2x… and in 5th year it is 5x. With this, we can estimate that the number of PhDs graduating will gradually increase to about 245 per year in about 5 years among all institutions, and about 210 per year from institutions in group 1 and 2. Overall, keeping in mind the likelihood of overestimation for institutions in group 2 and 3 (e.g. even for very young institutes, the estimated data gives some PhDs graduated last year, which is not the case), we can say that the PhD production in the Academic Year 2011-12 was around 125, and that PhD production is likely to grow gradually to about 225 per year in about 5 years.
Areas of Research
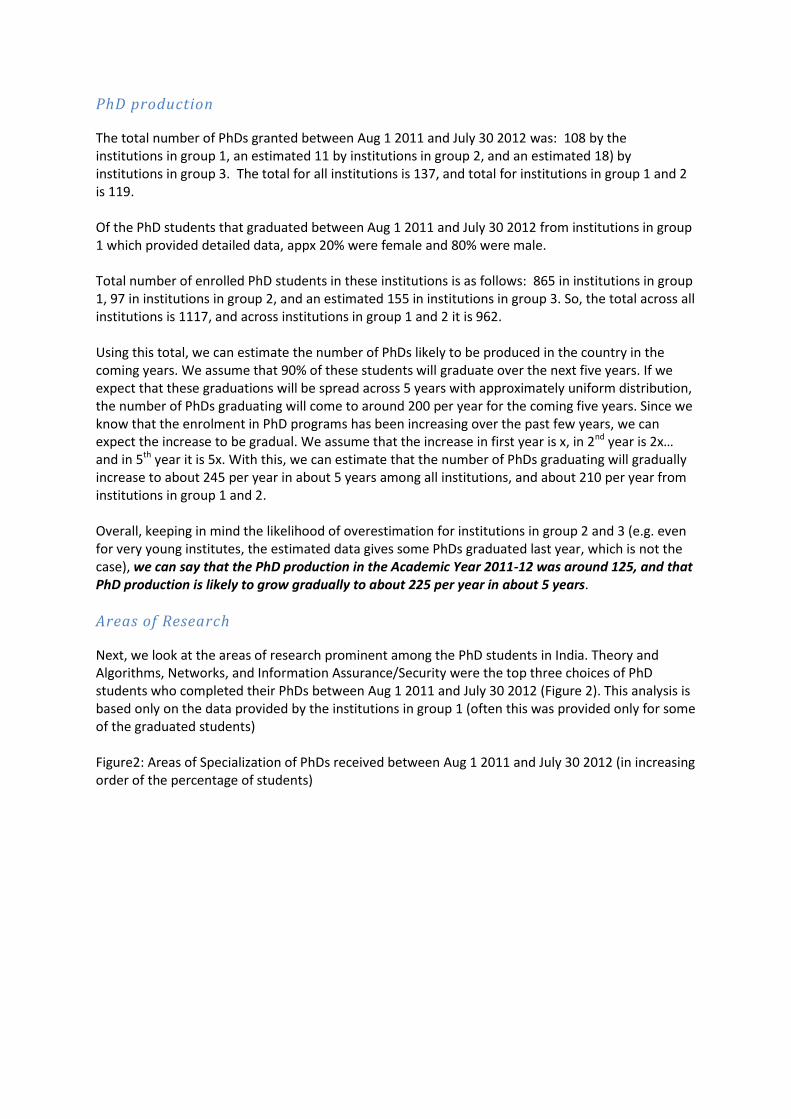
Next, we look at the areas of research prominent among the PhD students in India. Theory and Algorithms, Networks, and Information Assurance/Security were the top three choices of PhD students who completed their PhDs between Aug 1 2011 and July 30 2012 (Figure 2). This analysis is based only on the data provided by the institutions in group 1 (often this was provided only for some of the graduated students) Figure2: Areas of Specialization of PhDs received between Aug 1 2011 and July 30 2012 (in increasing order of the percentage of students)
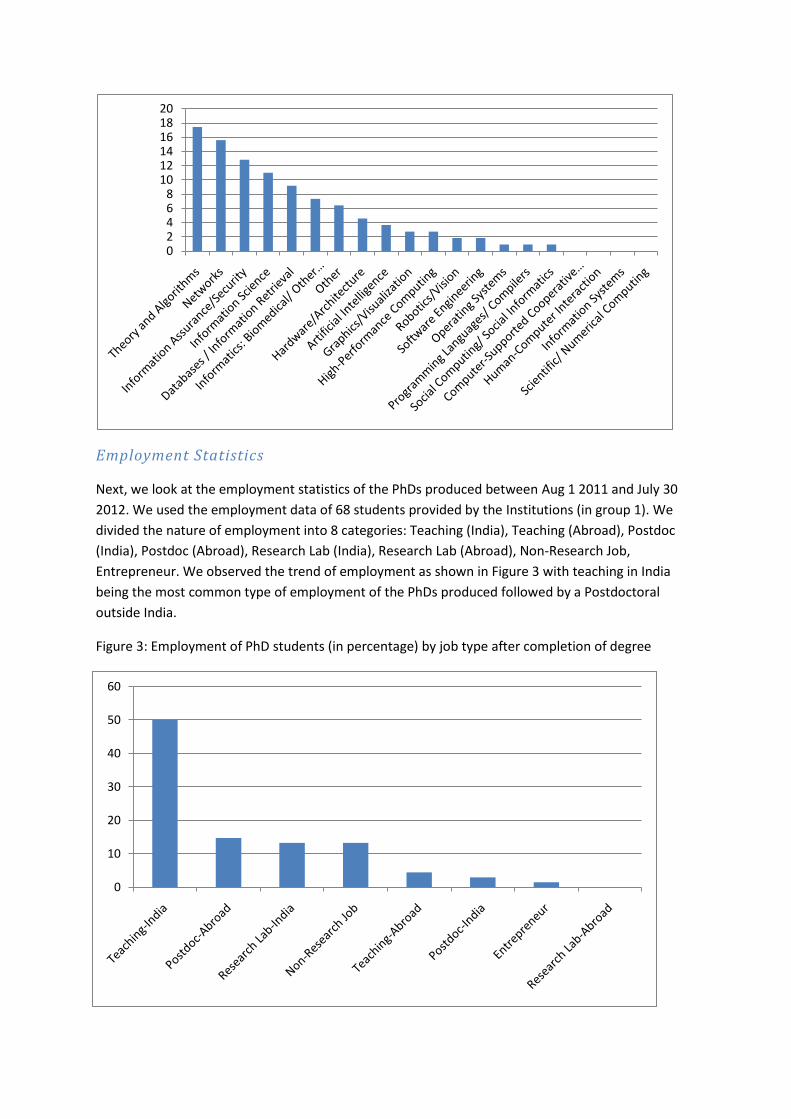
Employment Statistics
Next, we look at the employment statistics of the PhDs produced between Aug 1 2011 and July 30
2012. We used the employment data of 68 students provided by the Institutions (in group 1). We
divided the nature of employment into 8 categories: Teaching (India), Teaching (Abroad), Postdoc
(India), Postdoc (Abroad), Research Lab (India), Research Lab (Abroad), Non-Research Job,
Entrepreneur. We observed the trend of employment as shown in Figure 3 with teaching in India
being the most common type of employment of the PhDs produced followed by a Postdoctoral
outside India.
Figure 3: Employment of PhD students (in percentage) by job type after completion of degree
02468
101214161820
0
10
20
30
40
50
60

Stipend/Compensation for PhD students If we look at the stipend provided during the PhD, the highest was Rs. 25,000, minimum was Rs 14,000, and the average stipend that a PhD student can expect in India is Rs 18,418. The median stipend is Rs 18,000. (Based on data of 22 institutions from group 1 which provided this.)
Issues/Challenges for the PhD program
We also asked the departments of the institutions to provide a list of issues/challenges hampering the PhD program. 20 institutions provided this list. Out of the issues provided, Figure 4 shows those which were mentioned by more than one institution. The two most common issues were problems in attracting good quality PhD students and lack of financial support in terms of fellowships/scholarships and grants for travel to conferences. Figure 4: Issues faced by the departments providing PhDs (in increasing order of the percentage of departments facing the issue)
Faculty Size The total number of faculty-with-PhD in these Institutions is 584 and average size of faculty-with-
PhD in a department is about 15.
Future Surveys This survey is the starting point towards collecting reliable data on PhD production in India. In future
surveys, some of the challenges and issues that this study faced need to be addressed.
0
5
10
15
20
25
30
35
The main difficulty in such a study is getting the data. Despite reminders and personal contacts,
many institutes did not provide data. For future studies, this will have to be addressed – hopefully
with release of the first report, more institutions will be willing to report the data, but still special
measures will be needed to get data from all institutions.
This report included 39 Institutions, which were identified through inputs from a committee. While
this approach has included all the main institutions, it will be good to develop more objective criteria
for identifying the list of Institutions to include in the study. One possibility is to include all
institutions which grant PhD in CS in this study and in compilation separate the data from Institutes
that have mostly PhD-faculty from other Institutes. Suggestions regarding how to improve this study
in coming years may be sent to [email protected].
References 1. CRA Taulbee Survey. http://cra.org/resources/taulbee/.
Acknowledgements I would like to thank Mayank Pundir for his help in analyzing the data and in writing the report.
Appendix Table 1: Data for institutions in group 1
Name of institution Faculty with a PhD
Faculty without a PhD
PhDs awarded in 2011-2012
PhD students enrolled
IIT Kharagpur/CSE 24 1 11 50
IIT Kharagpur/ Scholl of IT 8 0 2 30
IIT Madras 24 0 11 76
IIT Guwahati 25 0 4 29
IIT Ropar 4 0 0 6
IIT Gandhinagar 1 0 0 2
IIIT Hyderabad 39 9 7 47
IIIT Delhi 32 0 0 44
IIIT Allahabad 36 9 6 76
IIIT Bangalore 25 0 0 17
Motilal Nehru National Institute of Technology, Allahabad
9 16 9 45
National Institute of Technology, Trichy 7 8 0 10
National Institute of Technology, Warangal 9 6 2 11
Visvesvaraya National Institute of Technology, Nagpur
5 8 1 4
Indian Institute of Science, Bangalore 40 4 15 103
TIFR 10 0 2 23
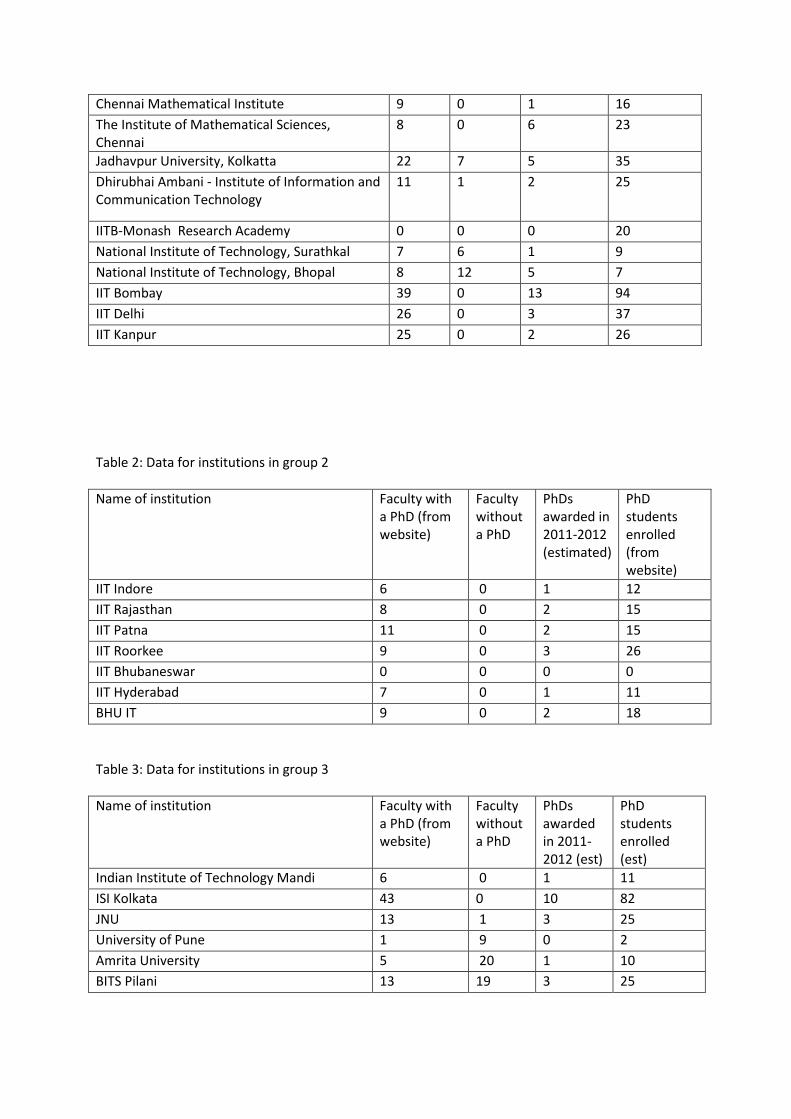
Table 2: Data for institutions in group 2
Name of institution Faculty with a PhD (from website)
Faculty without a PhD
PhDs awarded in 2011-2012 (estimated)
PhD students enrolled (from website)
IIT Indore 6 0 1 12
IIT Rajasthan 8 0 2 15
IIT Patna 11 0 2 15
IIT Roorkee 9 0 3 26
IIT Bhubaneswar 0 0 0 0
IIT Hyderabad 7 0 1 11
BHU IT 9 0 2 18
Table 3: Data for institutions in group 3
Name of institution Faculty with a PhD (from website)
Faculty without a PhD
PhDs awarded in 2011-2012 (est)
PhD students enrolled (est)
Indian Institute of Technology Mandi 6 0 1 11
ISI Kolkata 43 0 10 82
JNU 13 1 3 25
University of Pune 1 9 0 2
Amrita University 5 20 1 10
BITS Pilani 13 19 3 25
Chennai Mathematical Institute 9 0 1 16
The Institute of Mathematical Sciences, Chennai
8 0 6 23
Jadhavpur University, Kolkatta 22 7 5 35
Dhirubhai Ambani - Institute of Information and Communication Technology
11 1 2 25
IITB-Monash Research Academy 0 0 0 20
National Institute of Technology, Surathkal 7 6 1 9
National Institute of Technology, Bhopal 8 12 5 7
IIT Bombay 39 0 13 94
IIT Delhi 26 0 3 37
IIT Kanpur 25 0 2 26

Notes:
IITK, IITD, IITB provided basic data on email, which has been used.
Data from NIT Bhopal was received in an email after the initial report was sent – consequently, it moved to group 1.
Based on initial reports, IIT Indore confirmed that the total enrolled PhD students in Aug 2012 were 12 (and not 9) and the website may not have been fully updated.
ISI Calcutta has many different departments/centers which has CS faculty. We have counted relevant faculty from ACMU, MIU, CVPR, ECSU, ASU, BIRU, CoEC (as data not given on
site, obtained from a colleague.) MNNIT Allahabad clarified that they have graduated 9 PhDs last AY, and have a total of
about 45 PhD students enrolled.
Jhadhavpur data was checked on phone – they had earlier included CS-type PhDs from other departments. Data now is for CS and IT.
IISc’s data has been updated, as reported by them, to include also SERC’s faculty and PhDs.
Data on faculty for U Pune, Amrita, BITS, JNU was obtained from their sites. Data on faculty for group 2 was obtained earlier.
IIT G reported that they had made an error earlier and that they graduated 4 students (and gave their names)


![[ACM-ICPC] 0 - ACM-ICPC](https://static.fdocuments.net/doc/165x107/555603ead8b42a3f168b4838/acm-icpc-0-acm-icpc.jpg)