islandora.mlml.calstate.eduislandora.mlml.calstate.edu/islandora/object... · ACKNOWLEDGMENTS The...
142
SEDIMENTATION ACROSS THE OXYGEN MINIMUM ZONE ON THE CONTINENTAL SLOPE OFFSHORE CENTRAL CALIFORNIA A Thesis Presented to The Faculty of the Department of Geology San Jose State University In Partial Fulfillment of the Requirements for the Degree Master of Science By Thomas L. Vercoutere May, 1984
Transcript of islandora.mlml.calstate.eduislandora.mlml.calstate.edu/islandora/object... · ACKNOWLEDGMENTS The...
SEDIMENTATION
ACROSS THE OXYGEN MINIMUM ZONE
ON THE CONTINENTAL SLOPE
OFFSHORE CENTRAL CALIFORNIA
A Thesis
Presented to
The Faculty of the Department of Geology
San Jose State University
In Partial Fulfillment
of the Requirements for the Degree
Master of Science
By
Thomas L. Vercoutere
May, 1984

APPROVED FOR THE DEPARTMENT OF GEOLOGY
APPROVED FOR THE UNIVERSITY
ACKNOWLEDGMENTS
The undertaking of this study could not have been accomplished
without the encouragement, support, and guidance of many friends and
colleagues. Al Roberts, my friend and committee member, was the most
influential of all, providing the initial impetus for graduate work.
Committee chairman Hank Mullins provided the initial idea as well as
support and guidance throughout the study. The Petroleum Research Fund
of the American Chemical Society's ACS-PRF Type G grant #12923-GB2 to
H. T. Mullins provided financial support. Moss Landing Marine Labora-
tories provided use of the R/V CAYUSE and crew, without which this study
could not have been accomplished. A great deal of thanks goes to fellow
graduate students Dave Nagel, Rich Rasch, Dave Schwartz, and Joel
Thompson who generously assisted at sea.
I am indebted to the U.S. Geological Survey and my friends and col-..
leagues there for allowing me to use laboratory facilities where most of
the research was conducted. Special thanks are due Mike Torresan and
Kris Johnson, who provided instruction and assistance in physical
analyses of the sediments; Gerta Keller, Kris McDougall and John Barron,
who gave invaluable assistance in the identification and interpretation
of the foraminifers and diatoms; Jim Gardner and Brian Edwards, who
generously provided both unpublished data and helpful discussion; and
Karen Johnson who helped in the final preparation of the many figures in
this thesis.
I wish to thank Lorrie Duval and John Dern who labored through the
iii

manuscript in its formative stages, and to my committee membe.rs Hank
Mullins, Al Roberts and Cal Stevens for their critical review of the
manuscript.
Finally, I wish to thank Martha Dern for understanding and support
when it mattered.
iv

TABLE OF CONTENTS
ABSTRACT
INTRODUCTION
Previous Work
Study Area
Geologic Setting
Oceanographic Setting
METHODS
Field operations
Laboratories Techniques
RESULTS
Physical Properties Analyses
Carbon Analysis
Biostratigraphic Analysis
Clay Mineral Analysis
14c Analysis
X-radiography
Page
xii
1
3
4
5
5
11
11
14
14
15
15
16
17
17
18
Surface Sediments --------------------------------------- 18
Grain Size ---------------------------------------- 18
Sand Components
Carbonate and Total Organic Carbon
Clay Mineralogy
Lithostratigraphy ---------------------------------------Gravity Core Descriptions
Gravity Core Grain Size
v
18
21
21
26
26
27

Gravity Core Carbonate and Total Organic Carbon --- 27
Box Core Descriptions ----------------------------- 27
Box Core Grain Size ------------------------------- 30
Box Core Carbonate and Total Organic Carbon ------- 30
Box Core Sand Grain Constituents ------------------ 33
Biostratigraphy ----------------------------------------- 37
Planktonic Foraminifers --------------------------- 37
Diatoms ------------------------------------------- 48
Chronostratigraphy --------------------------------------
14c Age Determinations
50
50
DISCUSSION --------------------------------------------------- 51
Effect of Currents on Surface Sediment Texture
and Composition --------------------------------------- 51
Effect of Oxygen Content on Surface Sediment
Composition 55
Clay Mineral Assemblages in Surface Sediments ----------- 62
Total Organic Carbon Distribution in Surface
Sediments --------------------------------------------- 67
Correlation of Cores ------------------------------------ 68
Biostratigraphic Correlations
Carbonate Content Correlation
Lithostratigraphic Correlation
70
72
74
Clay Composition ----------------------------- 76
Sedimentation Rates ------------------------------------- 77
Rates Derived from 14c Data ----------------------- 77
vi
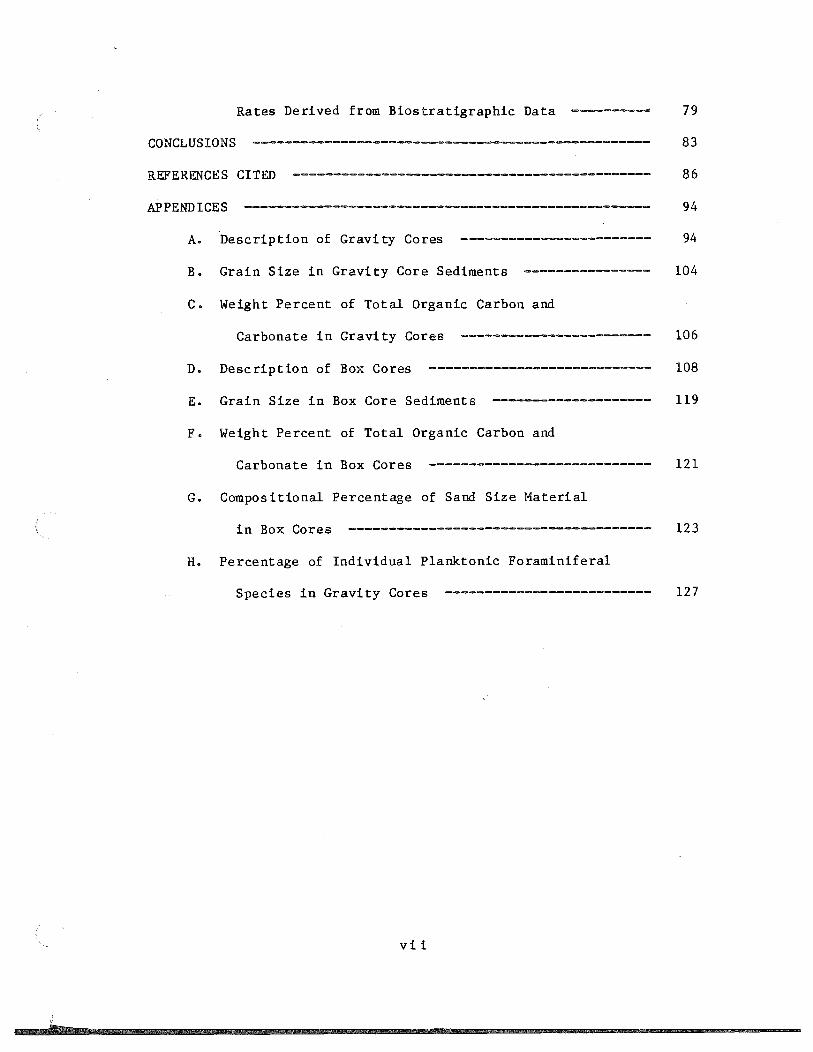
Rates Derived from Biostratigraphic Data ---------• 79
CONCLUSIONS -------------------------------------------------- 83
REFERENCES CITED --------------------------------------------- 86
APPENDICES --------------------------------------------------- 94
A. Description of Gravity Cores ------------------------ 94
B. Grain Size in Gravity Core Sediments ---------------- 104
C. Weight Percent of Total Organic Carbon and
Carbonate in Gravity Cores ------------------------ 106
D. Description of Box Cores ---------------------------- 108
E. Grain Size in Box Core Sediments -------------------- 119
F. Weight Percent of Total Organic Carbon and
Carbonate in Box Cores ---------------------------- 121
G. Compositional Percentage of Sand Size Material
in Box Cores -------------------------------------- 123
H. Percentage of Individual Planktonic Foraminiferal
Species in Gravity Cores 127
vii

Figure
1.
2.
3.
4.
LIST OF FIGURES
Bathymetric Map of Central California Continental Margin with Study Area. ----------------------------------
Oxygen Concentration Relative to Water Depth from Offshore Central California. -----------------------------
Central California Coast, 19 April 1979, Tiros N Satellite, VHRR Infrared Image Enhanced for Water Temperature. ---------------------------------------------
Bathymetry Map of Study Area Showing Bottom Sample
Locations. -----------------------------------------------
5. Surficial Sediment Texture from Box Cores Relative
Page
6
7
9
12
to Water Depth. ------------------------------------------ 19
6. Cumulative Percent Surficial Sand Components from Box Cores Relative to Water Depth. , --~--------------------
7. Weight Percent Total Organic Carbon and Carbonate in Surficial Sediments from Box Cores Relative to
··20
Water Depth. --------------------------------------------- 22
8.
9.
10.
Cumulative Percent Smectite, Illite, and Chlorite plus Kaolinite in Surficial Sediments from Box Cores Relative to Water Depth. ---------------------------
XRD Diffractogram of Glycolated and Magnesium Saturated Surface Clay Assemblages. ----------------------
Cumulative Percent Gravel, Sand, Silt, and Clay Relative to Depth in Core from Gravity Cores.
11. Weight Percent Total Organic Carbon (TOC) and
23
25
28
Carbonate Relative to Depth in Core from Gravity Cores. 29
12. Cumulative Percent Gravel, Sand, Silt, and Clay Relative to Depth in Core from Box Cores. ---------------- 31
13. Weight Percent Total Organic Carbon (TOC) and Carbonate Relative to Depth in Core from Box Cores. 32
14. Cumulative Percent Sand Components Relative to Depth in Core from Box Cores 1 through 4. ---------------------- 34
viii

Figure Page
15. Cumulative Percent Sand Components Relative to Depth in Core from Box Cores 5 through 8. ---------------------- 35
16. Cumulative Percent Sand Components Relative to Depth in Core from Box Cores 9 and 10. ------------------------ 36
17. Plots of Coiling Ratio of Neogloboquadrina pachyderma and Abundance of Selected Species of Planktonic Foraminifers from the Assemblages in Core GC-1. ---------- 39
18. Plots of Coiling Ratio of Neogloboquadrina pachyderma and Abundance of Selected Species of Planktonic Foraminifers from the Assemblages in Core GC-2. ---------- 40
19. Plots of Coiling Ratio of Neogloboquadrina pachyderma and Abundance of Selected Species of Planktonic Foraminifers from the Assemblages in Core GC-3. ---------- 41
20. Plots of Coiling Ratio of Neogloboquadrina pachyderma and Abundance of Selected Species of Planktonic Foraminifers from the Assemblages in Core GC-4. ---------- 42
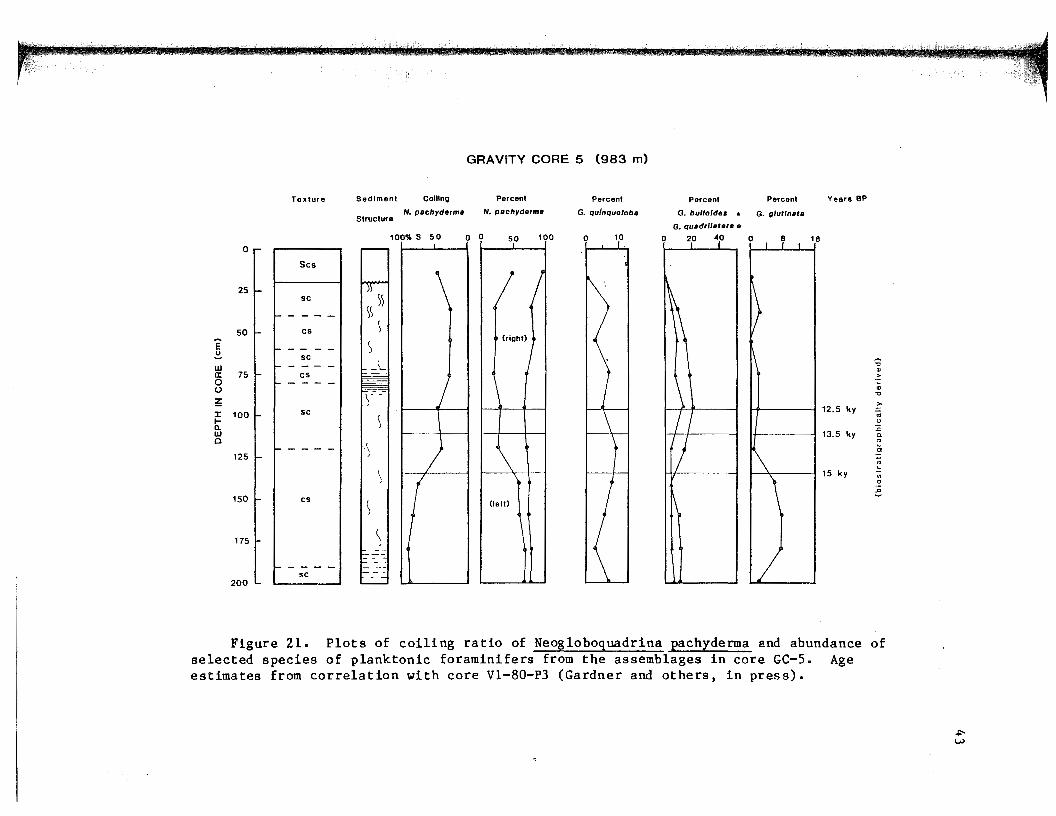
21. Plots of Coiling Ratio of Neogloboquadrina pachyderma and Abundance of Selected Species of Planktonic Foraminifers from the Assemblages in Core GC-5. ---------- 43
22. Plots of Coiling Ratio of Neogloboquadrina pachyderma and Abundance of Selected Species of Planktonic Foraminifers from the Assemblages in Core GC-6. ---------- 44
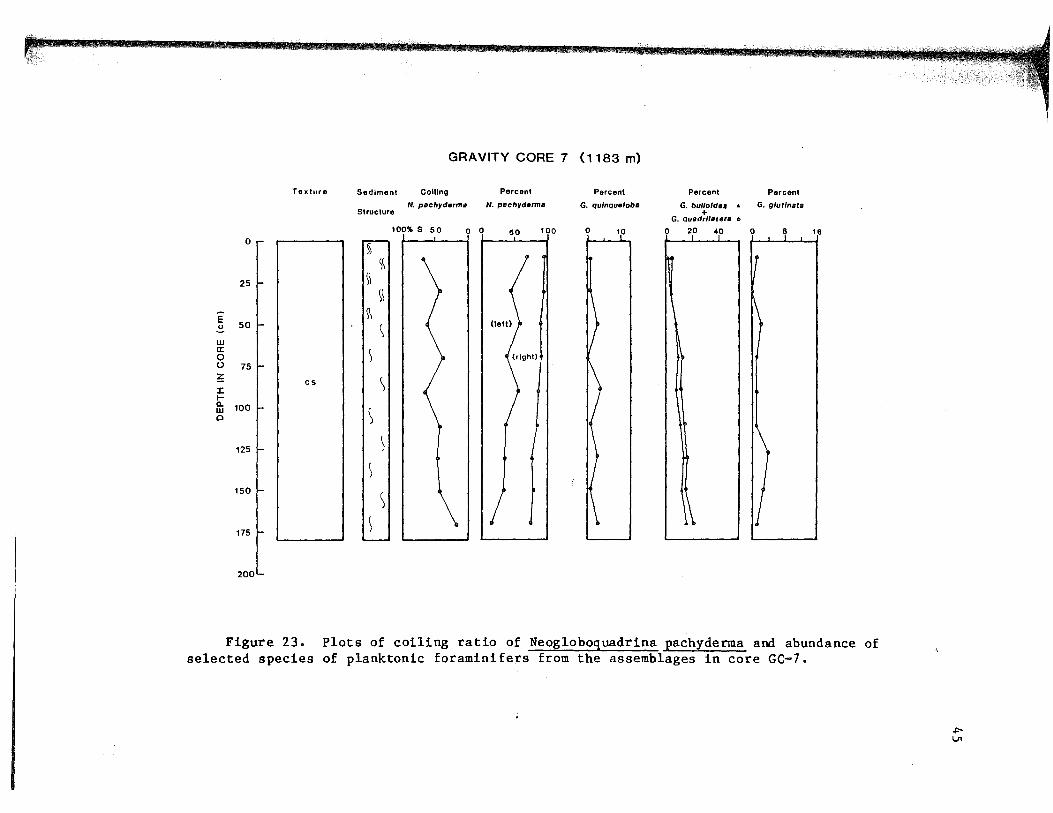
23. Plots of Coiling Ratio of Neogloboquadrina pachyderma and Abundance of Selected Species ·of Planktonic Foraminifers from the Assemblages in Core GC-7. ---------- 45
24. Plots of Coiling Ratio of Neogloboquadrina pachyderma and Abundance of Selected Species of Planktonic Foraminifers from the Assemblages in Core GC-8. ---------- 46
25. Plots of Coiling Ratio of Neogloboquadrina pachyderma and Abundance of Selected Species of Planktonic Foraminifers from the Assemblages in Core GC-9. ---------- 47
26. Plots of the Abundances of Selected Species of Planktonic Foraminifers that Display Systematic Variation with Age from the Assemblage in Core V1-80-P3. -------------------- 49
ix

Figure Page
27. Diagram Showing Effects of Current Velocities of the California Undercurrent During Typical Summer Conditions on the Distribution of Surficial Sediment Texture and Sand Composition. ---------------------------- 52
28. Current Velocities Required for Erosion, Transportation, and Deposition. ------------------------------------------ 53
29. Distribution of Surficial Total Organic Carbon, Carbonate, and Sand Components Relative to Water Depth and Their Possible Relation to an Impinging Oxygen Minimum Zone. ------------------------------------- 56
30. Percentage of Benthic Foraminifers in the Sand-size Fraction of Surface Samples Relative to Water Depth and Their Relation to the Oxygen Minimum Zone. ----------- 58
31. Percentage of Fecal Pellets in the Sand-size Fraction of Surface Samples Relative to Water Depth and Their Relation to the Oxygen Minimum Zone. ----------~---------- 59
32. Percentage of glauconite in the sand-size fraction of surface samples versus water depth and their relation to the oxygen minimum zone. --------------------- 61
33. Compositional Range of Clay Mineral Assemblages from Cores in the Study Area. --------------------------------- 66
34. Biostratigraphic Correlation of Gravity Cores.
35. Correlation Chart of Box and Gravity Cores from the Continental Slope Northwest of Point Sur, California.
X
71
75

Table
1.
2.
3.
4.
5.
6.
7.
LIST OF TABLES
Station Location, Water Depth and Depth of Penetration of Cores and Camera Stations. -----------
Semiquantitative Clay Mineral Assemblages of Surficial Sediments. -----------------------------
Occurrence of Planktonic Foraminifers in
Gravity Cores. --------------------------------------
Geochemical Classification of Marine Sedimentary Environments Based on Mineral Composition. ----------
Semiquantitative Clay Mineral Assemblages of Recent and late Pleistocene Sediments. --------------
Ratio of Planktonic to Benthic Foraminifers. --------
The Biostratigraphically Derived Sediment Accumulation Rates for the Holocene and late
Pleistocene. ----------------------------------------
xi
Page
13
24
38
62
64
73
80

ABSTRACT
Sedimentation on the continental slope northwest of Point Sur,
California has been affected by northerly flow of the California
Undercurrent and a persistent oxygen minimum zone (OMZ) associated with
seasonal coastal upwelling. To document and understand the geological
processes and their products associated with the OMZ in this area, 10
. box and 9 gravity core samples were collected at approximately lOD-m
depth intervals along a transect between 300 and 1400 m of water.
The depositional regime changes from that of erosion/nondeposition
on the slope swept by the California undercurrent exceeding the thresh
old velocity needed to transport/erode fine sediment, to that of depo
sition on the slope below the effect of the undercurrent. This change
occurs between 600 to 800 m and is indicated by: (1) a decrease in
glauconite content from >30 percent at 500 m to <5 percent at 700 m;
(2) location of a mudline between approximately 750 and 800 m; and (3)
an increase in fine-sand-size mica and siliceous microfossils from <5
percent to )18 percent and <2 percent to >6 percent, respectively,
between 650 and 800 m. The clay mineral assemblage displays a down
slope increase in percent smectite and decrease in percent illite and
chlorite plus kaolinite between approximately 600 to 700 m.
The biogenic and authigenic components of surface sediments have
been affected by impingement of the OMZ. The percentage of benthic
foraminiferal tests is at a minimum between 593 and 905 m where the
lowest oxygen content of the OMZ impinges the bottom. The maximum
xii

_,
percentages of glauconite and fecal pellets are at the upper (525 m)
and lower (1025 m) boundaries of the OMZ, respectively.
Total organic carbon (TOC) content of surface sediments, Which
increases down slope from a minimum of 0.6 weight percent at 279 m to a
maximum of 2.5 weight percent at 1200 m, is predominantly controlled by
the percentage of clay-size sediment rather than by the oxygen content
in the overlying water. The correlation coefficient for weight percent
TOC and percentage of clay in the sediment is 0.95 and for weight
percent TOC and oxygen content is 0.66.
Biostratigraphic and lithostratigraphic data indicate a late
Miocene to Holocene unconformity at the boundary between a glauconitic
sand and a non-glauconitic, silty sand, 15 to 25 em beneath the
sediment-water interface in cores frPffi approximately 500 m. An uncon-
formity caused by a depositional h~atus or a slide has resulted in the
absence of approximately a 7,00D-year section of Holocene sediment.
The distribution of modern sediment on the upper continental slope
within an area of seasonal coastal upwelling, a persistent OMZ, and an
eastern oceanic boundary current displays recognizable down-slope
changes controlled by these oceanographic conditions. Recognition of
similar sedimentological features in the rock record may be useful for
the interpretation of analogous depositional environment.
xiii

INTRODUCTION
The combined interaction of photosynthesis, respiration, oxidation
of organic material, and oceanic circulation result in a nonlinear
vertical distribution of oxygen in open oceanic water columns (Sverdrup
and others, 1952). A pronounced oxygen minimum zone (OMZ) typically
occurs at intermediate water depths with higher concentrations in both
shallower and deeper water (Richards, 1957). Oxygen minimum zones tend
to be best developed and most persistent in areas of coastal upwelling
along eastern boundaries of ocean basins where surface biological
productivity is highest. Demaison and Moore (1980) used the term
"anoxic" to define water within an OMZ containing less than 0.5 ml/1 of
dissolved oxygen. The 0.5 ml/1 concentration will be utilized to define
the upper and lower limit of the OMZ in this study.
The impingement of an oxygen minimum zone on the seafloor may be
reflected in the physical, chemical, and biological characteristics of
near-surface sediments if the zone is temporally and spatially persist
ent (Diester-Haass, 1978). Authigenic minerals, such as phosphorites
(Veeh and others, 1974;_ Burnett, 1977) and glauconite (McRae, 1972; Odin
and Matter, 1981), commonly form during early diagenesis either within
or at the boundaries of oxygen minimum zones. Organic carbon content in
the sediments may also be significantly higher in OMZ's than in
surrounding regions (Diester-Haass, 1978).
Biological activity in near-surface sediments also may be affected
by the impingement of an oxygen minimum zone (Thompson and others, in

prep.). Complete anoxia may inhibit all organisms except anaerobic
bacteria (Rhoads and Morse, 1971) resulting in the preservation of
short-term variability of sediment make-up and original depositional
structures owing to a lack of bioturbation (Calvert, 1964; Codispoti,
1983; Summerhayes, 1983).
The accumulation patterns, when viewed on a secular time scale, of
some petroleum source rocks, phosphorite deposits, glauconites, biogenic
silica, and sediments enriched in elements from the biogenic cycle,
appear to be strongly influenced by oxygen concentrations and produc
tivity of the water column superjacent to the .. depositional site (Fischer
and Arthur, 1977; Baturin, 1983). Sedimentary facies and biofacies
patterns within many ancient sedimentary units in which these types of
deposits are found have been interpreted as having formed in low oxygen
environments (McRae, 1972; Fischer and Arthur, 1977; Demaison and Moore,
1980; Sheldon, 1980; Odin and Matter, 1981).
Despite the importance of OMZ's on ancient sediments, a paucity
of literature exists concerning the effect of an impinging OMZ on
sedimentation and early diagenesis of modern sediments along the upper
and middle continental slope. Such studies have never before been
conducted on the central California continental slope even though
phosphorite and glauconite are present in this area (Galliher, 1935;
Chesterman, 1952; Rein and others, 1974; Mullins and Rasch, 1981)
coincident with seasonal upwelling and a persistent oxygen minimum zone
(Hickey, 1979; Broenkow and Greene, 1981). In light of these
deficiencies, this study was conducted particularly to identify
2

solutions to the following conditions or problems:
1. What are the near-surface sediment facies patterns across an open
ocean oxygen minimum zone? Specifically, what are the sources, rates,
concentrations, and distribution of sediment in this environment?
2. What, if any, early diagenetic products occur within this zone?
What are the diagenetic facies patterns across slope and down core?
Specifically, are phosphatic, glauconitic or other authigenic sediments
actively forming? If so, what are their relationships with the OMZ?
3. Is the sediment across the OMZ enriched in organic carbon? If so,
to what level is it concentrated and how does it vary spatially and
temporally?
4. What types of sedimentary structures are present across the OMZ?
5. What effect have sea level changes had on sediment distribution and
diagenesis?
Previous Work
A comprehensive examination of coastal upwelling and its sedimen
tary record is given in a two volume publication edited by Suess and
Thiede (1983). Individual papers deal with a wide spectra of subjects
including sedimentological and geochemical features in upwelling regions
(Baturin, 1983; Summerhayes, 1983) and constituents in the water column
(Codispoti, 1983; Fischer and others, 1983)~ The continental margins
off South West Africa and Peru-Chile have well developed OMZ's and have
been the primary sites for studies on the effects of oxygen concen
tration on phosphorite formation (Burnett, 1977; Baturin, 1978) and
3

sediment composition (Calvert and Price, 1971; Krissek and oth~rs,
1980).
Previous work in the study area can be divided into two groups:
geologic and oceanographic. Published geological investigations of the
continental slope between Point Sur and Monterey Canyon are few. The
most intensive investigation to date is the study by Greene (1977)
although an investigation of the source and dispersal of clay minerals
off Point Sur was conducted by Griggs and Hein (1980). A few seismic
reflection profiles of the margin off Point Sur have been published in
reports for leasing the outer continental shelf for oil exploration
(McCulloch and others, 1980).
Oceanographic investigations in the study area have dealt with
biological, chemical, and physical oceanography. The effects of oxygen
concentration on the biological community on the slope off Point Sur
were examined by Thompson (1983). Studies on particulate flux and
nutrient levels in the water column and oceanic circulation have been
conducted as part of the VERTEX program by Moss Landing Marine Labora
tories and the California Cooperative Oceanic Fisheries Investigations.
These include works by Broenkow and Smithie (1978), Broenkow and Greene
(1981), and Martin and Knauer (1983). Investigations of the California
Current System conducted by the Naval Postgraduate School in Monterey
include work by Wickman (1975) and Traganza and Conrad (1981).
Study Area
The area of investigation for this study is located on a north-
4

westerly transect down the continental slope from Point Sur, California
to the Monterey Canyon. Water depths range between 279 and 1420 m
(Figure 1).
Geologic Setting
The geologic structure and present physiography of the central
California continental margin was developed primarily since the early
Miocene by folding, faulting, sliding, and slumping (Curray, 1966;
Silver and others, 1971; Blake and others, 1978; Howell and others,
1980). Tectonic movement and fluctuations in sea level have exposed a
variety of rocks that provide a aource of sediment for modern conti
nental slope deposits, including river and stream input, seacliff
erosion, and relict shelf sediments (Griggs and Rein, 1980). Coastal
rivers have been the major source of fine-grained sediments during the
Holocene, providing as much as 80 percent of the sediment along the
northern and central California coast (Griggs and Rein, 1980). Using
LANDSAT imagery, Griggs and Rein (1980) identified sediment disperal
plumes emanating from the Russian River, San Francisco Bay, and Salinas
River as the major sources of suspended sediment along the central
California coast; only minor contributions from other rivers and creeks
entering along the coast.
Oceanographic Setting
Dissolved oxygen concentrations seaward of the Point Sur area
display a pronounced minimum (less than 0.5 ml/1; the OMZ) between 525
and 1025 m with a low of 0.27 ml/1 at 750 m (Figure 2) beneath the
5

122°30' 37°oo~·----~~--------------~----------------------------------37°oo'
~<V
'··' ~ ·-a·,. 7- .,
0 10
F--~ km
North
.- 11 seaside
Figure 1. Bathymetric map of central California continental margin with study area indicated by box. From NOAA bathymetric map NOS 1307-11B, (contours in meters).
6

Oxygen (mill)
0 0.5 1.0 1.5 2.0
400
- 600 CIJ .... Q) -Q)
E -.s:::. .... 0. Q)
0 800 .... Q) .... co ~
1000
1200
Figure 2. Oxygen concentration relative to water depth from offshore central California. Stippled area represents oxygen concentrations of (0.5 ml/1 {the oxygen minimum zone) between 525 and 1025 m. Data from Broenkow and Greene (1981).
7

surface expression of upwelling. There is little variation in the depth
of the oxygen minimum zone for a distance of 150 km offshore (Broenkow
and Gree~e, 1981), and this OMZ has persisted for at least the past 20
years along the central California margin (Churgin and Halminski, 1974).
The California Current system, which is the eastern limb of the
North Pacific gyre, is driven primarily by wind stress patterns over the
North Pacific Ocean (Halliwell and others, 1980). Strong, persistent,
southeastward-directed wind stress during the spring and summer and the
Coriolis effect. res~lt in a net water transport of near-surface layers
away from the coast. The displaced water is replenished by upwelling of
cold, nutrient-rich water from a subsurface zone less than approximately
200 to 300m deep (Sverdrup and others, 1952; Halliwell and others,
1980). Although the pattern of upwelling is complex ( Pirie and others,
1975; Hickey, 1979), satellite thermal imagery shows coastal upwelling
waters may become large scale cyclonic or elongate plumes with sharp
thermal fronts (Traganza and Conrad, 1981). One such area of intense
upwelling occurs in the study area northwest of Point Sur, (Figure 3;
Broenkow and Smithie, 1978).
Along the west coast of the u.s., an undercurrent flows northward
at depths from 200 to 500 m or more (Hickey, 1979). This undercurrent,
known as the California Undercurrent, is a subsurface northward flow
that occurs below the main pycnocline and seaward of the continental
shelf (Hickey, 1979); its water is characterized by higher temperatures
and salinity than the surrounding water (Wickman, 1975). Mean flow
velocities are usually low, on the order of 5-10 em/sec (Schwartzlose
8

Figure 3. Central California coast, 19 April 1979, Tiros
N Satellite, VHRR infrared image enhanced for water temperature
(white, 10° C; black, 20° C).
9
and Reid, 1972; Broenkow and Greene, 1981) although Wickman (197-5) has
determined that off Monterey, California, jets of equatorial water
occurring between 200 and 500 m may have northerly flow velocities as
high as 2D-40 em/sec. When seasonal upwelling weakens or ceases during
the winter, the core of the California Undercurrent propagates upward
toward the surface to become the major flow component of the northerly
flowing Davidson Current (Hickey, 1979). Year-round ocean current
velocity data along the central California coast are rare. A sequence
of measurements conducted in less than 500 m show seasonal changes in
both direction and magnitude (Wickman, 1975; Halliwell and others,
1980). For most of the period between November 1973 to February 1974,
southward flow over the slope was between 5 and 12 em/sec. In June and
July 1974, a northward countercurrent flow below approximately 200 m
developed over the slope with flow velocities as great as 8 em/sec (data
from Wickman, 1975, in Halliwell and others, 1980). Measurements taken
during August and September of 1980 (which include deeper measurements)
in the same region (Broenkow and Greene, 1981) generally confirm the
results of Wickman.
10

METHODS
Field Operations
During 1981 and 1982 the R/V Cayuse occupied 10 sites in the study
area at water depths between 279 and 1400 m. Box core and gravity core
samples and bottom photographs were recovered at approximately 100-m
depth intervals along the transect (Figure 4; Table 1) northwest of
Point Sur where the oxygen minimum zone impinges on the bottom.
A Benthos box corer equipped with a stainless steel box (20 x 30 x
60 em) was used to recover an undisturbed portion of the sea floor and a
9-cm diameter gravity corer was used to retrieve the upper 1-2.2 m of
sediment. Approximately 10 bottom photographs were taken at each
station from 2 m above the sediment with a Benthos deep-sea camera
system.
Each recovered box core was carefully removed from the box and an
18 x 2 em longitudinal slab was taken for X-radiography and subsamples
were taken at S-cm intervals with a 100 cm3 syringe. The 8-cm liner
containing the gravity core was removed from the barrel, sealed, and
returned to the laboratory.
During the study, ship location was determined by a LORAN-e coastal
navigation system supplemented by radar triangulation and satellite
navigation fixes. Station positions were recorded at the time of bottom
impact of the corer or camera, indicated by the winch tensiometer or
sonic alarm, respectively. Water depth was determined with a 12 kHz
precision depth recorder.

• Gravity Core
1111 Box Core
;.. Bottom Camera
Figure 4. Bathymetric map of study area showing bottom sample locations. From NOAA bathymetry map NOS 1307-11B, (contours in meters).
12

13
Table 1.--Station locations, water depths, and penetration of box
cores and gravity cores, and camera station locations
Sample Water Subsurface
Number Depth Penetration Latitude Longitude
(meters) (centimeters)
Box Cores
BC-1 279 (10 122° 05.1 I w 36° 19.3 1 N BC-2 390 35 122° 05.4 1 w 36° 21.0 1 N BC-3 510 10 122° 05.4 1 w 36° 21.9 1 N BC-4 593 23 122° 05.5 1 w 36° 22.3 1 N BC-5 690 36 122° 06.3' w 36° 23.0 I N BC-6 785 44 122° 08.3' w 36° 24.1' N BC-7 905 42 122° 10.7 1 w 36° 25.1 1 N BC-8 1020 43 122° 12.0 1 w 36° 25.7 1 N BC-9 1085 43 122° 12 • 5 I w 36° 26.3 1 N BC-10 1200 42 122° 13.0 1 w 36° 27.6 1 N
Gravity Cores
GC-1 505 91 122° 05.1 1 w 36° 21.8 I N
GC-2 717 130 122° 07.0 1 w 36° 23.0 1 N GC-3 832 230 122° 08.9 1 w 36° 25.1 1 N GC-4 862 225 122° 09.6 1 w 36° 25.4 1 N
GC-5 983 200 122° 10.8 1 w 36° 25.9 1 N GC-6 1072 176 122° ll.4 I w 36° 26.8 1 N GC-7 1183 180 122° 12.1' w 36° 27.6' N
GC-8 1277 198 122° 12.4 1 w 36° 29.0 1 N
GC-9 1420 215 122° 17.0 1 w 36° 30.6 1 N
Camera Stations
C-1 300 122° 05.5' w 36° 19.8 1 N C-2 452 122° 06.0' w 36° 21.3 I N
C-3 570 122° 07.0 1 w 36° 21.7 I N C-4 688 122° 07.1 1 w 36° 22.3 1 N
C-5 801 122° 08.6' w 36° 23.9 1 N c-6 903 122° 10.8 1 w 36° 24.7 1 N
C-7 1005 122° ll.4 1 w 36° 25.7 1 N C-8 1100 122° 12.0 1 w 36° 26.5 1 N
C-9 1210 122° 14.1' w 36° 26.5 1 N

Laboratory Techniques
Core samples were brought back to the lab at the u. s. Geological
Survey and stored vertically at 4° C and 100 percent humidity until they
were split, described, X-radiographed, photographed, subsampled (10-cm
intervals for gravity cores and 5-cm intervals for box cores), and
archived.
Physical Properties Analyses
Grain size (sand, silt, and clay) was determined by wet sieve and
pipette separation following the methods of Folk (1974). Textural clas
sification of sediments follows that of Shepard (1954), and symbols used
for graphic lithology and sedimentary structures are those used in the
Deep Sea Drilling Project initial reports. The sand component of box
cores was recovered, dried, and split to approximately 300 to 400 grains
for point counts with a binocular microscope. Grains were identified
and counted as 1 of 11 categories consisting of: (1) quartz and feld
spar; (2) mica; (3) opaque minerals (including authigenic pyrite); (4)
rock fragments; (5) glauconite; (6) fecal pellets; (7) planktonic foram
inifers; (8) benthic foraminifers; (9) siliceous microfossils; (10)
macrofaunal shell fragments; and (11) unidentified material including
organic debris. The term "glauconite" will be used in the morphological
sense to describe sand-sized greenish grains. Authigenic pyrite,
present in very small quantities (< 0.5 percent) in some early Holocene
and Pleistocene sediment, was counted as an opaque mineral.
14

Carbon Analysis
Total carbon values were determined on oven dried (65° C) and
powdered bulk samples with a LECO combustion carbon analyzer following
the methods of Kolpack and Bell (1968). Inorganic carbon values were
determined using an automatic coulometric titration apparatus following
the manufacturer's instructions (Coulometrics Incorporated, 1979).
Total organic carbon is the difference in the two carbon values, and
carbonate content is calculated from the inorganic carbon content
values. Precision between runs of three replicate samples is on the
order of 2-4 percent of the value of total carbon and 1-2 percent of the
value of inorganic carbon. Measurement accuracy was checked every 20
analyses with standard carbon rings or NBS standard SCo-1. In order to
separate trend movements in gravity core profiles, which may represent
Pleistocene to Holocene changes, from cyclical or analytical error
fluctuation, a third order smoothed line is shown. The line is plotted
from the mean value of a sequence of three numbers centered on the
middle number.
Biostratigraphic Analysis
Samples for planktonic foraminiferal biostratigraphy were collected
from the gravity cores at 20-cm intervals. Samples were washed on a 250
mesh (62 micron) sieve and allowed to air dry. Splits of approximately
300 individuals greater than 150 microns were separated to eliminate the
indistinguishable juvenile foraminfers. Individuals were identified to
species and counted for quantitative frequency distribution and coiling
direction of Neogloboquadrina pachyderma. Box core slabs were also
15
selectively subsampled for planktonic foraminiferal biostratigraphy and
were analysed in the same manner.
Clay Mineral Analysis
Samples for semiquantitative X-ray diffraction analysis of clay
minerals following the methods of Rein and others (1976) were collected
from the upper 2 em in all box and gravity cores and from within a
12,500 to 15,000 year BP interval and an 18,000 to 22,000 year BP
interval (determined from planktonic foraminiferal biostratigraphy) in
gravity cores GC-3, GC-4, GC-5, GC-8, and GC-9. Oriented mounts were
made from the <2 micron size fraction using the filter-membrane peel
technique of Drever (1973). They were X-rayed from 3° to 14° 29 at 1°
per minute to identify the clay minerals and- from 24° to 26° 2e at¥4
per minute to distinguish chlorite from kaolinite after being Mg
saturated and glycolated. Peak areas were measured with a planimeter
and relative abundances of individual clay minerals were calculated by
measuring the (001) peak area, and then multiplying by the weighting
factors of Biscaye (1965) and normalizing to 100 percent. Along the
central California margin, the expandable clay phase, with its charac
teristic 14-15 A peak, is commonly a smectite/illite mixed layer clay
with an average of 74 percent expandable layers (Griggs and Rein, 1980).
The expandable phase will be referred to as smectite. Glauconite and
fecal pellets were treated with R2o2 and Morgan's Solution, ultrason
ically disaggregated and dispersed, then mounted and X-rayed in the same
manner as clay samples.
16

14c Analyses
Six samples were submitted for 14c age determinations to Geochron
Labs in Cambridge Massachusetts where clay and organic matter were
recovered from whole sediment samples, then treated with hot dilute HCl
to remove any old, detrital carbonate. The remaining material was
filtered, washed, dried, and roasted in oxygen to recover carbon dioxide
from the organic matter for the analyses.
x-radiography
X-radiographs of the box and gravity cores were taken to examine
sedimentary structures. Recognition of structures on radiographs is
possible because changes in texture and density result in changes in
contrast on the radiograph (Bouma, 1969). A light table was used to
examine X-radiographs and identify sedimentary and biogenic structures.
17

RESULTS
Surface Sediments
Surficial sediments in this study are defined as the upper 5 em of
box core samples. Samples from the top of gravity cores were not used
because of uncertainty of sediment loss on impact of the corer.
Grain Size
Surficial sediments from water depths between 279 and 600 m are
dominated by sand-size material which comprises over 88 weight percent
of the sediment (Figure 5). Below 600 m the amount of sand decreases
and there is a concomitant increase in the weight percent of silt and
clay. Maximum values of 49 weight percent silt, 41 w~ight percent clay,
and a minimum value of 10 weight percent sand occur at 1200 m.
Sand Components
The 700-m bathymetric contour approximates a significant boundary
about which surficial sand compositions change (Figure 6). The per
centage of quartz and feldspar is variable over the entire depth range
but reaches a maximum near 700 m. Mica content, less than 5 percent on
the upper slope, increases to greater than 15 percent below 700 m.
Fecal pellets are not found in sediments above 700 m but become a major
component below comprising as much as 20 percent of the sediments at
1020 m. Rock fragments are only present in sediments shallower than
700 m. Glauconite is a major component of the sediments shallower than
700 m (>30 percent between 390 and 593 m) and rapidly disappears below

-0 ... Q) -Q)
E -.r::. -c. Q)
c
400
600
800
1000
1200
Figure 5.
Cumulative Percentage of Clastic Sediment
0 25
••••••••••••••••••••••• ••••••••••••••••••••
50 75
................. . ........................... . ::::::::::::··:· .... :.:.:.:.:.:.:.:.:.:.:.:.:. :·:.:.:.:.:.:.:.:.:.:.:.:.:.:.:.:.: ......... .· ..... ·.· ..... ·.·. ·.·.·. ·.·. ·.·.· ... ·.·.·.·.· ... ·.·.·.·.· .· .·.·.·.·.·. ....... . ................................... . .... . ..................................... . :: .· :-:·:·:·:·:·:·:·:·:·:·:·:·:·:·:·:·:·:·:·:·:·:·:·:·:·: ·: ·:·:·:· :-: ·:-: ·:·:·:·:·: .. . ...................................... . . . .............................................................................. . . . ...................................... . . . . . . . . . . . . . . . . . . . . . . . . . . . . . . . . . . . . . . . . . . . . . . . . . . . . . . . . . . . . . . . . . . . . . . . . . . . . . . . . . . . . . . . . . . . . . . . . . . . . . . . . . . . . . . . . . . . . . . . . . . . . . . . . . . . . . . . . . . . . . . . . . . . . . . . . . . . . . . . . . . . . . . . . . . . . . . . . . . . . . . . . . . . . . . . . . . . . . . . . . . . . . . . . . . . . . . . . . . . . . . . . . . . . . . . . . . . . . . . . . . . . . . . . . . . . . . . . . . . . . . . . . . . . . . . . . . . . . . . . . . . . . . . . . . . . . . . . . . . . . . . . . . . . . . . . . . . . . . . . . . . . . . . . . . . . . . . . . . . . . . . . . . . . . . . . . . . . . . . . . . . . . . . . . . . . . . . . . . . . . . . . . . . . . . . . . . . . . ....................................... . . . . . . . . . . . . . . . . . . . . . . . . . . . . . . . . . . . . . . . . ....................................... . . . . . . . . . . . . . . . . . . . . . . . . . . . . . . . . . . . . . . . .
• •••••• tl tl •• tl ••••••••••••••••••••••••••• . . . . . . . . . . . . . . . . . . . . . . . . . . . . . . . . . . . . . . . . ....................................... . . . . . . . . . . . . . . . . . . . . . . . . . . . . . . . . . . . . . . .....................................
::::::: r: ::r :: r:: :::: r:: r:: r r:: n: r: >:: =-· · ......................... . . . . . . . . . . . . . . . . .. . . .. . . . . ..................... . . . . . . . . . . . .. . . . . . . . .................. . . . . . . . . . . . . . . . . . ................... ................. . . . . . . . . . . . . . . . . . . . . . . . . . . . . . . . . . . . . . . . . . . . . . . . . . . . . . .. . . . . . . . . . . . . . . . . . . . . . . . . . . . . . . . . . . . . . . . . . . . . . . . . . . . . . . . . . . . . . . . . . . . . . . . . . . . . . .. . . . . . . . . . . . . . . . . . . . . . . . . . . . . . . . . . . . . . . . . . . . . . . . . . . . . . . . . . . . . . . . . . . . . . . . . . . . . . . . . . . . . . . . . . . . . . . . . . . . . . . . . . . . . . . . . . . . . . . . . . . . . . . . . . . . . . . . . . . . . . . . . . . . . . . . . . . . . . . . . . . . . . . . . . . ........... . . . . . . . . . . . . . . . . . . . . . . . . . . . . . . . . . . . . . . . . . . . . . . . . . . . . . . . . . . . . . . . . . . . . . . . . . . . . . . . . . . . . . . . . . . . . . . .
•••••• •••••• •••••• •••••• •••••• •••••• no~ D 6
Gravel Sand silt Clay
100
Surficial sediment texture relative to water depth.
19

,... til ... <D -<D
·e .s::. -0. <D Cl .... <D -Ill ;:
0
400
600
800
1000
1200
D
Cumulative Percentage of Sediment Components
20
Quartz +
Feldspar
Mica
Opaque
Minerals
40
~ [ill] .
II
60
Rock Fragments
Glauconite
Fecal Pellets
Planktonic Foraminifers
80 100
400
600
800
1000
1200
~ Benthic Foraminifers
Siliceous
Microfauna
Carbonate Shell Fragments
Organic Debris
Figure 6. Cumulative percentage of surficial sand components relative to water depth.
20

that depth. The percentage of benthic foraminifers reaches a-low
between 593 and 905 m and increases above and below those depths. The
percentage of planktonic foraminifers is less than 2.5 percent in all
surface sediment except at 593 m where it reaches 5 percent. Siliceous
microfaunal debris is very rare or absent above 700 m and increases to
as much as 6.5 percent below. Macrofossils are present at all depths
except 593 m and 1020 m. The maximum percentage of macrofossils occurs
at 1085 m.
Carbonate and Total Organic Carbon
Calcium carbonate weight percent in surficial sediments changes
significantly in the down slope direction as shown in Figure 7. The
lowest carbonate concentration was measured at ~93 m; the values triple
at sample locations 100 m shallower and deeper than this location.
Total organic carbon (TOC) in surficial sediments is relatively
constant at less than 1 weight percent on the slope between 400 and
700 m. However, below 700 m the TOC content increases in a nearly
linear fashion with increasing water depth, attaining a maximum of 2.49
weight percent at 1200 m (Figure 7).
Clay Mineralogy
Surficial clay mineral assemblages display a down slope change and
can be divided into two groups separated at approximately the 600-m
contour (Figure 8; Table 2). The group from less than 600 m is charac
terized by lower smectite and higher illite and chlorite + kaolinite
than the deeper water group (Figure 9). The shallower group clay
21

Weight Percent Total Organic Carbon
0 1.00 2.00 3.00 4.00
400
-Cl) ~
Q) .... Q)
600 E -.r:: .... c. Q)
Cl .... 800 Q) .... Cil
~
1000
0 1.50 3.00 4.50 6.00
Weight Percent Carbonate
T 0 C ee---ilte---ee
Carbon ate mlllll---111111111-----1111111
Figure 7. Weight percent total organic carbon and carbonate in surficial sediments relative to water depth.
22

> 4: ....I (.)
1-z w (.) 0: w a.. w > 1-4: ....I :::::> :::E :::::> (.)
75
50
25
0 • 300 400 500
a . • I I o U I •
600 700 800 900 1000 1100 1200 1300 1400
WATER DEPTH (meters)
[]] Chlorite +
Kaolinite
Illite
Smectite
Figure 8. Cumulative percent smect·ite, illite, and chlorite plus kaolinite in surficial sediments relative to water depth.
N w

24
Table 2.--Semiquantitative clay mineral assemblage of -
surficial sediments from the continental slope northwest
of Point Sur, California. Percentages determined from
corrected X-ray diffraction peak volume
[S, smectite; I, illite; C+K, chlorite + kaolinite]
WATER CORE DEPTH s I K + C
(meters) (percent) (percent) (percent)
BC-1 279 40.0±9.2 27.0±4.2 33.0±9.2
BC-2 390 50.0±2.8 27 .0±4 .2 23 .0±1.4
BC-3 .510 34.0±9.2 32.0±0.7 33.5±9.2
BC-4 59;3 45.5±9.2 29 .0±4. 2 26 .0±4 .2
mean 42.8±8.6 29.0±3.3 28.3±6.4
BC-5 690 55.5±0.7 25 .0±1.4 19.5±0.7
BC-6 785 55.0±1.4 22.0±1.4 23 .0±0. 7
BC-7 905 59 .5±2 .1 22.0±1.4 19.0±1.4
BC-8 1020 56.0±2.8 24.5±2.1 19.5±0.7
BC-9 1085 56.0±5.7 21.0±1.4 23.0±4.2
BC-10 1200 53.0±5.7 23.0±0.7 23.5±6.4
mean 55.8±3.3 23.0±1.8 21.5±3.1
combined mean 51.1±8.5 25.2±3.8 23.8±5.6

14 13
chlorite +
kaolinite
12 11 10 9 8 7 6 5 4
Degrees 2 9
Figure 9. XRD diffractogram of glycolated and magnesium saturated surface clay assemblages from upper slope (BC-1) and lower slope (BC-9).
3

assemblages are ·also more variable in composition than the deeper group
clays even though the deeper group is from a geographically larger area.
The mean clay assemblage for the upper continental slope northwest of
Point Sur is 51.1 percent smectite, 25.2 percent illite and 23.8 percent
chlorite+ kaolinite (see Table 2). Of the total chlorite+ kaolinite
percentage, chlorite comprises between 53 and 59 percent, being slightly
higher in the shallower group.
Lithostratigraphy
Gravity Core Descriptions
Lithologies, sedimentary structures, and visual descriptions of
gravity cores 1 through 9 are shown in Appendix A. The cores are
composed predominantly of silty clays and clayey silts with some clayey,
silty sand, silty sand and pebbly sand present. Sediment in most cores
is grayish olive (10Y4/2) to olive gray (5Y3/2) with some areas dusky
yellow green (5GY5/2) and moderate olive brown (5Y4/4). Most original
sedimentary structures are not recognizable on X-radiographs because
they have been bioturbated. The upper parts of the cores are typically
more intensely bioturbated or homogeneous than the lower part of the
same cores. Cores GC-1, GC-3, and GC-5 have a laminated interval
between 60 to 80 em. A sharp, irregular contact separating relatively
coarse sediment from underlying fine sediment is present at 60 em in
GC-2 and at 22 to 24 em in GC-3 and GC-4. Glauconite is concentrated
in a surface layer 10 to 20 em thick in GC-1 and is present as a minor
constituent in the upper 50 em of GC-2.
26

Gravity Core Grain Size
The sediments in the gravity cores display a wide range in sand,
silt, and clay percentages (Figure 10, Appendix B). The cores from
higher on the slope tend to contain more sand and silt than the cores
from lower on the slope. The variance in the percentages of sand, silt,
and clay decreases in the down slope direction.
Gravity Core Carbonate and Total Organic Carbon
The carbonate content in the gravity cores ranges between 1.57 and
9.65 weight percent. There is an increase down core followed by a
variable amount of fluctuation in carbonate in all cores except GC-1 in
which the carbonate content decreases down core (Figure 11, Appendix C).
The total organic carbon (TOC) in GC-1 ranges from 0.56 to 4.41
weight percent. In cores 2 through 9, the TOC ranges from 0.67 to 2.57
weight percent with only a slight decrease or no decrease down core
(Figure 11, Appendix C).
Box Core Descriptions
Lithologies, sedimentary structures, and visual descriptions of box
cores 1 through 10 are·given in Appendix D. Box cores above 700 mare
predominantly sand, pebbly sand, and silty sand; cores below 700 m are
predominantly sandy, clayey silt; clayey silt; and silty clay. Most
textural changes are gradational with overlying and underlying groups.
There are sharp, irregular contacts in box cores 2, 7, 8, and 10 sepa
rating coarser on top from finer sediment below. The sediment in most
cores is olive gray (5Y3/2) to grayish olive (10Y4/2), or olive black
27

50
'E !:!
" 0 100
u .:
" 150 .. 0
200
GC-1 (505 m) GC-2 (717 ml GC-3 (832 m) GC-4 (862 m) GC-5 (91!3 m)
Cumulative Percent Cumulative Percenl Cumulative Percent Cumulative Porconl Cumulative Percenl
0 50 100 0 50 100 0 50 100 0 50 100 0 50 100
GC-6 (1072 m) GC-7 (1183 m) GC-8 ( 1277 m) GC-9 ( 14 20 m)
illHill .
D D ~
Cumulative Percent Cumulative Percent Cumulative Percent Cumulative Percent
Gravel
Sand
'E !:!
Silt .. 0 u .: ::
Clay " " 0
Figure 10. Cumulative percent gravel, sand, silt, and clay relative to depth in core (from gravity cores 1 through 9).
0
50
100
150
200
N OJ

Gravity Cora 1 (606 rn)
TOC (wl ,.,
t.oo 2.oo J.oo •.oo a.oo
50
g :l 100 X
!
g , 150
200
2.00 4,00 1.00 1.00 10.00
Carbonate (wt '1.}
Third Order Smoothed C1rbonate
Total Organic
Carbon (TOCJ
Carbonate
tl
"' ., .... X
z n 0 :ll , n ~
50
100
150
200
Oravhy Cora 2 (717 m)
TOC (wt '1.)
1.00 2.00 :t.oo 4.oo a.oo
o 2.00 4,oo e.oo e.oo to.oo Carbonate (w1 '1.)
Gravity Coree (1072 m)
TOC (wt '1.)
o 1.00 2.oo :t.oo 4,oo a.oo
1 ~
" I
' t , ~
• 1 !
~' •
o 2.00 .t.oo a.oo a.oo 10.00
Cartlonate (wl '1.)
Gravity Core 3 (B32m)
TOC (wt 'r.)
t.OO J.OO :1,00 4.00 5.00
2.00 4.0Q 8.00 8.00 10,00
Carbonate (wl '!1.)
Gravity Core 7 ( 1183 m)
TOC (wt 'lo)
1.00 2 00 3.00 4.00 5.00
, ' I I ' I ; t j
I
. + • ;
l
o 2.00 .e.ao 8.oo a.oo 10.00
Car'""•'• (wt '!1.)
Figure 11. Weight percent total organic relative to depth in core (from gravity cores
Gravity Core "' (882 m)
TOC (wl '!1.)
1.00. 2.00 :1,00 4.00 1.00
0 2.00 ... oo 8.00 8.00 10 00
Carbonate (wl '1.)
Gravity Core 8 ( 1277 m)
TOC (wl '1.)
t.oo 2.00 3.oo .t.oo a.oo
,• ,·
0 2.00 4,00 1.00 8.00 10.00
Carbonat• (wl 11.)
carbon (TOC) and 1 through 9).
Gravity Core 6 (983 m)
TOC (wt -..)
1.00 2.00 :1.00 4.00 1.00
. I
l )o
I • ...
~ i L
' J
50
100
150
200
0 2.00 ... 00 8.00 8.00 10.00
Carbonata (wl '1.)
Gravity Core 9 ( U20 m)
TOC (wt 'lo)
1.00 2.00 :1.00 A,OO 15.00
50
100
150
200
0 2.00 ... oo 1.00 1,00 10.00
Cubonata lwl '!1.)
carbonate

(5Y4/l) where glauconite is abundant. BC-2 is the only box core that
contains faint laminations as well as convolute bedding. Burrow struc
tures are recognizable in most cores deeper than 390 m, and the density
of recognizable burrows generally increases with water depth. Glauco
nite is present as a major component above the irregular contact in
BC-2, BC-3, and BC-4. Pebble-size material in box cores 1, 2, and 3
consists of phosphorite nodules, granodiorite rocks, or metasedimentary
rocks.
Box Core Grain Size
Box core sediments display a wide range of gravel, sand, silt, and
clay percentages (Figure 12, and Appendix E). There is a general trend
of decreasing sand and gravel and increasing mud in the down-slope
direction. Sediment in box cores from the slope above 700 m contains
greater than 60 percent sand and gravel (with the notable exception of
the sediment below the irregular contact in BC-2). Sediment in box
cores below 700 m contains greater than 50 percent mud.
Box Core Carbonate and Total Organic Carbon
The carbonate content of sediments range from 0.73 to 7.88 weight
percent (Figure 13, Appendix F). Most of the cores contain a minimum
amount of carbonate in the upper 10 to 20 em of sediment, with more
below. Carbonate content throughout the sediment sampled by box cores
decreases in a down-slope direction from 390 to 593 m, where the minimum
amount is found, then increases toward 1200 m at the bottom of the
transect.
30

BC-1 (279.,) BC-2 (390 m) BC-3 (510 m) BC-4 (593 m) BC-5 (690 m)
O'llo 50'1!. 100% O'llo 50 ... 100% O'llo 50% 100% 0'11. 50'1!. 100'11. 0'11. 50% 100 'II.
0 0
e 10 10 0
.. 0 u 20 20 = .c 0. .. 0
30 30
40 40
BC-6 (765 m) BC-7 (905 m) BC-8 ( 1020 m) BC-9 ( 1085 m) BC-10 (1200 m)
0% so% 100'1!. 0% 50% 100% O% 50% 100% 0% 50% 100% 0% 50% 100%
0 0
e 10 10
u
.. ;; u 20 20
= .c 0. .. 0 30 30
40 40
rnmm Gravel 0 Sand D Slit ~ Clay .
Figure 12. Cumulative percent gravel, sand, silt, and clay relative to depth in core (from box cores 1 through 10).

Aiii&UiiW:ZUi Jiil lZi iJ£ :a: z ;,;;; a=uu:
BC- I (279 m) BC-2 {390 m)
toe (•t 'llo} TOC Cwt 1U
1.00 2'.00 :3.00 4.00 1.00 2.00 >.00 4.00
\ ' ' ~ '
"' ~ "'
o, a: 0
' 0 20
"' ; I
:X: ... • 14C >35hy ~ ..
w 0
30
40 2.00 4.00 6.00 8.00 2.00 4.00 a.oo 8.00
Carbonate (wl 'lo) Carbonate (wt '11,)
BC-6 {785 m) BC-7 {905 m)
TOC (wt "'o) TOC (wt 'a.)
I 00 2 00 300 400 1.00 2.00 3.00 4.00
r! 10 ~
~ w a:
{\
0 u 20 ; :X:
lp ... .. "' 0
30
40
2.00 4.00 6.00 8.00 2.00 4.00 6.00 8.00
Carbonate (wt 'II.) Carbonate ht·t 'A)
Total Organic Carbon o- - .... - ....
Figure 13. Weight percent depth in core (from box cores 1
BC-3 (510 m) BC-4 {593 m) BC-!5 (890 m)
TOC I• I 11.) TOC h•t 'II.) TOC (wt 'A)
1.00 2.00 3.00 4.00 1,00 2.00 3.00 •.oo 1.00 2 00 3.00 •. 00
t
2.00 4.00 e.oo 8.00 2.00 .ti.OO a.oo 8.00 2.00 •.oo a.oo 8.00
Carbonate (wl '!1.) Carbonate (•I "') Catborula (wt '-l
BC-8 (1020 m) BC-9 ( 1085 m) BC-10 (1200 m}
TOC (wt 'It) TOC (wt 'II.) TOC (wl 'II.)
1.00 f.OO 3.00 4.00 1.00 2.00 3.00 •.oo 1.00 2.00 3.00 4.00
' 4
' f.
' ' • . 2.00 4.00 ti.OO 2.00 4.00 8.00 6.00 2.00 4.00 • 00 .. Carbonala (wt 'lo) Carbonata (wl 'II.) Carbonate (wl "a.)
Carbonate
total organic carbon (TOC) through 10).
and carbonate relative
10
20
30
40
10
20
30
40
to
w N

The TOC content of box core sediments remains nearly constant from
top to bottom of each core except in BC-2 where there is a significant
increase in TOC below an unconformity where sediments have a 14c age
greater than 35,000 years. TOC content in sediments sampled by box
cores generally increases in the down-slope direction (Figure 13,
Appendix F).
Box Core Sand Grain Constituents
Down core variation in the sand-size constituents of the box cores
are shown in Figures 14, 15, and 16 and in Appendix G. Quartz and feld
spar content vary between 40 and 80 percent and show no down slope
trends. Mica content ranges from 1 to 7 percent (average 4.5 percent)
in the cores shallower than 600 m, and from 3 to 27 percent (average 14
percent) in cores 690 m and deeper. Opaque minerals range from 1 to 9
percent and display no systematic down slope trends. Pyrite is present
as an accessory opaque mineral and it constitutes less than 0.5 percent
of subsurface samples; pyrite is absent in all surface sediment
examined. Rock fragments comprise less than 2 percent of most cores
shallower than 700 m. Glauconite is present in all cores between 279
and 785 m and is completely absent in the cores deeper than 900 m. It
is a major component in the upper 10 to 15 em of cores between 390 and
593 m, but decreases in the lower 15 to 30 em. Fecal pellet occurrence
is nearly opposite that of glauconite. Except for an occurrence in
BC-1, fecal pellets are absent in the cores shallower than 785 m and
become a large component in the cores between 785 and 1200 m. The
highest percentage occurs in the upper 10 em of core BC-8 at 1020 m.
33

" c Q)
co Olll 0. E 0
(.)
E -go "' "' 0 Cll
"' "' c "' "' u 0 4) 0
[!) 0.. ....
"' >
"' :; E o
""' (.)
"' c
0 0
~0 0 0)
0. E 0
(.)
E] ~ m Cll ,._ N C
I "' u
(.) "'0 [!) 0.. ...
"' > .. :; Eo :> N (.)
0
0
0
0
0
0
"'
0
"'
0
"' 0.
"' ~ ., u. '0 c
"' N
"' :> 0
0
"'
0
"'
0
"' (w~) aJ05 ut 4tdoo
Ul
~ Q) c ~ Q) :J 0" a! a. 0
0 ....
0 ....
0 ....
~ c Q)
E Ol
"' .;:
"" u 0 0:
., c 0 u :>
"' (3
" c:
0 0
Q) 0
~ "' 0. E 0
(.)
c: .... Q) I U
(.) Q) 0 [!) 0.. ....
Q)
>
"' :; E o
" "' (.)
~ c
0 0
"' 0 c 0) 0 0. E 0 (.)
E ~ ~ 0 "' Cll
~ c M <!> I U
(.) "' 0 [!) 0.. ..,.
"' >
"' :; 0
E "' " (.)
"' u
"' u.
0
0
0
" Q)
E
"' 0 u.
ii'l11'
11il'! i!lli
:i! \1
"' c
" <ll
0
u
:i " :> 0 ., u
Cll
0
0
0
"' .0 ., 0 "'
"' .0 c ., :> 0
"' u o ·c u "' "' Ol
:::; 0
0
"'
0 N
0
"'
0
"'
0
"'
0 M
(w~) aJo:> u! 4tdao
0 ....
0 ....
0 ...
<I) .... 0 0
c: oM
.L..I c: <I) 0 .... Q) Cl..
Q)
> oM .L..I ~
..-lr-.
§: UbO
::l 0 . ....
...:r..c:: ...... .L..I
Q) ..... .... ::l g) b()Q)
oM .... t:=.. 0
0
>< 0
..c
34

"
0 0
c 0 ~ 0)
0 0. E 0 u
E ~ ~ It) "' "' f/) ....
c
"' "' I U
() 41 ~ m a.
0 0
;;; 0. .. '0 a; u. '0 c .. N
.. ::> 0 .. ... ... ...
"' u ~
0
"'
"' Jl~l~ ~l~ ~ l~~ j~ ~l~~ l~ ~ l~ ~ l~ ~l~~ ~
3 0 E N
" u
.. c 0 "' 0) c 0 0. E 0
E ~ ~ 0 c
"' "' "'f/)
It) c I G>
0 u 0 Ill "' ... a.
"' ~ .. :; 0 E N
" u
0 0 0 N
0
"'
~.~."'.;.;·:,·"·"·~·"'·:'i- ----------------- •• :: •••••••••••• • ••••• ••••••••••••••• • ••••••• ......•.................... •............•............. ••••••••••••••••••••••••••• ...•.•..........•.......... ••••••••••••••••••••••••••• •.•..............•......... ........................... •............•............. •.............•............ ••••••••••••••••••••••••••• ••••••••••••••••••••••••••• ••••••••••••••••••••••••••• ••••••••••••••••••••••••••• ••••••••••••••••••••••••••• ...•.•..................... ........................... .•......................... •..........•............... ••••••••••••••••••••••••••• ••••••••••••••••••••••••••• .....••.................... ••••••••••••••••••••••••••• •.••.•..................... ....••..................... ••••••••••••••••••••••••••• .....•..................... ••••••••••••••••••••••••••• •.•.••..................... •..............•........... ••••••••••••••••••••••••••• •••••••••••••••••••••••••••
fl)
"§ Gl c ~ Gl :J cr ., c. 0
0 ...
0 ....
.. c ., E
"' .. u. -" u 0 a:
o~~·~·~·~·~·~·~·~·r·~·~·~·~·~·~·~·~·T·~·~·~•;•~·~•;•;•,•--------~ 0 0 0
"' 0
"' (w~) aJO!) U! 41daa
0 ...
"' c 0 u ::>
"' (5
'" ~ "' a. a; u
"' u.
0
;';
0 0
c 0 G> ID c 0 0. E 0
e ~ o 0 c: "'
"' "' 0 f/)
c ID 0> I U O
u " ... m a. ., >
"' :; 0 E N
" u
"' c
0
0 0
0
"' "' E
"' 0 u.
"' c ::>
"' 0 u ~
"' ::> 0
"' u
f/)
0
0
.LJ
~ "' "' .0 c "' ::> 0 "' u o ·c
"' ~ ~ ::: 0
0
"'
0
"'
0
"'
0
"'
., 0 _t'"'-'-UJ.1.1:1±!J>' g 0)
a E 0 u
E ~ o ~~~~~~ "' "' ~ f/)
Ol c
"' ... u I
u "' 0 m o. "' .,
>
~ ::> E o :> N u
0
. ...... . ••.•............ . ••••••.•........ . ................ . . ...................... . . ....•.•.•..•••.••.•.•.. . ...............•••.••.•........ . .................•.•.•......... . ................•.............. . ...............•............... . ............••.•........... . .............•..•..•........ . ...............•..•......... . ..•.•.•..........•••..••.... . ........................... . . .......•.................... . .•..........•....••••••..... . ..•....................•.... . ......•.•.•................. . .•.........••••••••••.•..... . ...................•..•...... . ....•....••••................ . •.............•••.••••....... ....................•......... 0 0
N 0
"' (W~) aJO!) U! 41daQ
0 ...
0 ...
0 ...
1! til Cl)
~ t:: <l) t) ,.. <l) 0.
<l)
> ~ ~
til ~-6co ::S.t:! uoo
::s 0 . ,..
11"\.t:! ~ ~
<llll"' ,.. ::s Cl)
OO<ll ~,..
~ 0 t)
>< 0 .0
35

BC-9 ( 1085 m)
Cumulative Percent Sand Components
0 20 40 60 80 100
0 0 •••••••••••• •••••••••••••••••••••• •••••••••••••••••••••• •••••••••••••••••••••• •••••••••••••••••••••• I •••••••••••••••••••••• ••••••••••••••••••••••
10 •••••••••••••••••••••• 10 •••••••••••••••••••••• ,.. •••••••••••••••••••• E •••••••••••••••••••• 2 •••••••••••••••••••• •••••••••••••••••••• •••••••••••••••••••• ., •••••••••••••••••••• 0 •••••••••••••••••••• I •••••••••••••••••••• u 20 •••••••••••••••••••• 20
-= •••••••••••••••••••• •••••••••••••••••••••• ••••••••••••••••••••••
.&: ••••••••••••••••••••••••• •••••••••••••••••••••••••• c. •••••••••••••••••••••••••• ., •••••••••••••••••••••••••• mill 0 •••••••••••••••••••••••••
30 ••••••••••••••••••••••••• 30 Quartz and Feldspar ••••••••••••••••••••••••• • •••••••••••••••••••••• I .............•......•. ••••••••••••••••••••••• ••·••••••······•······· Mica
40 40
D Opaque Minerals
BC-10 (1200 m) • Cumulative Sand Components Fecal Pellets
Percent
0 20 40 60 80 100 1111 0 0 Foraminifers
• Siliceous Microfauna
10 10 Macrofauna! Debris
e Organic Debris .!:! ., ~
0 u 20 20
-= .&:
c. ., 0
30 30
40
Figure 16. Cumulative percent sand components relative to depth in core (from box cores 9 and 10).
36

Foraminifers are present in all cores; the lowest percentage is gener
ally between 593 and 785 m. Siliceous microfossils are present in all
cores except BC-3 and tend to increase in percentage in the down-slope
direction. A notable exception occurs at the base of BC-2 ( 14c age
)35,000 years) where they constitute 14 percent of the sand-size
sediments. Macrofossils and organic material are present in small
amounts in all cores, with a slightly larger amount in the cores from
1085 and 1200 m.
Biostratigraphi
Planktonic Foraminifers
A total of 12 different species of planktonic foraminifers were
identified in gravity cores 1 through 9 in the study area. Their occur
rence is shown in Table 3. GC-1 was devoid of planktonic foraminifers
below 10- 15 em (late Miocene age sediments), probably due to disso
lution. The quantitative distribution of species abundance is given in
Appendix H. Six species of planktonic foraminifers constitute more than
99 percent of the total population. Neogloboquadrina pachyderma
(Ehrenberg) is the dominant species in all cores and shows systematic
variation in coiling direction and abundance with depth in several
cores. Globigerina bulloides (d'Orbigny), Globigerina quadrilatera
Galloway and Wissler, Globigerina quinqueloba Natland, and Globigerinita
glutinata (Egger) are also present in significant quantity and vary
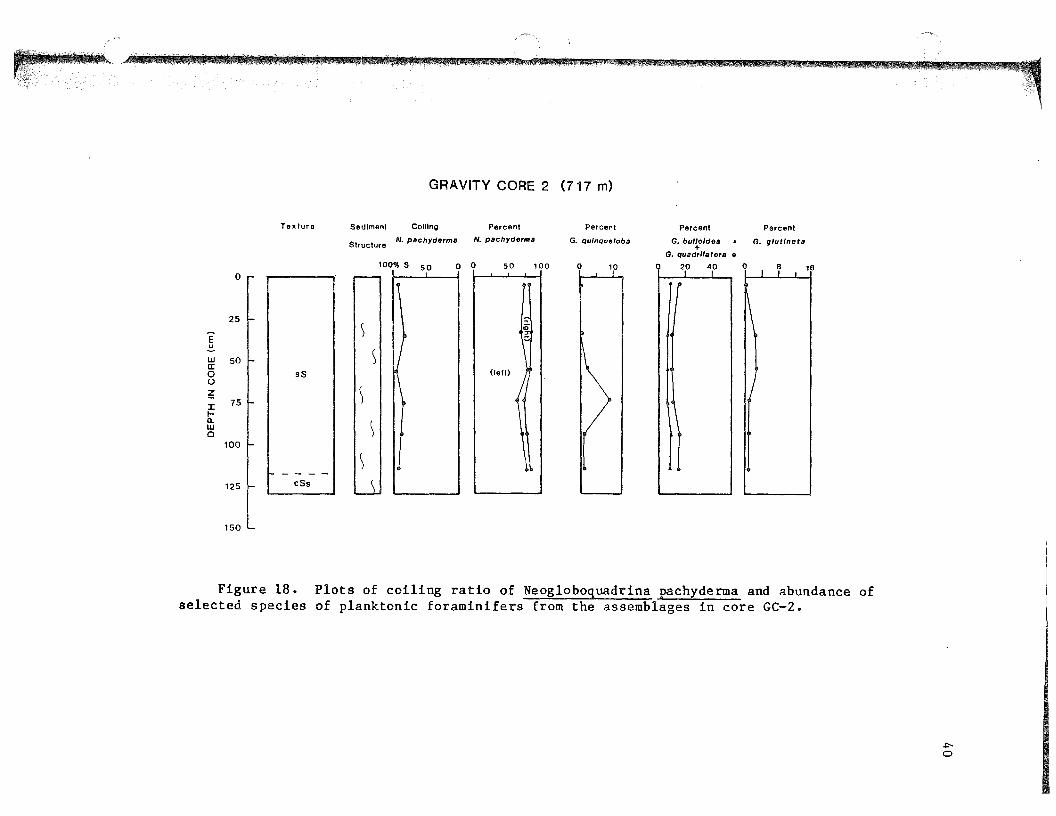
systematically with depth in most cores. The results of quantitative
analysis are shown in Figures 17 through 25. The systematic variations
37
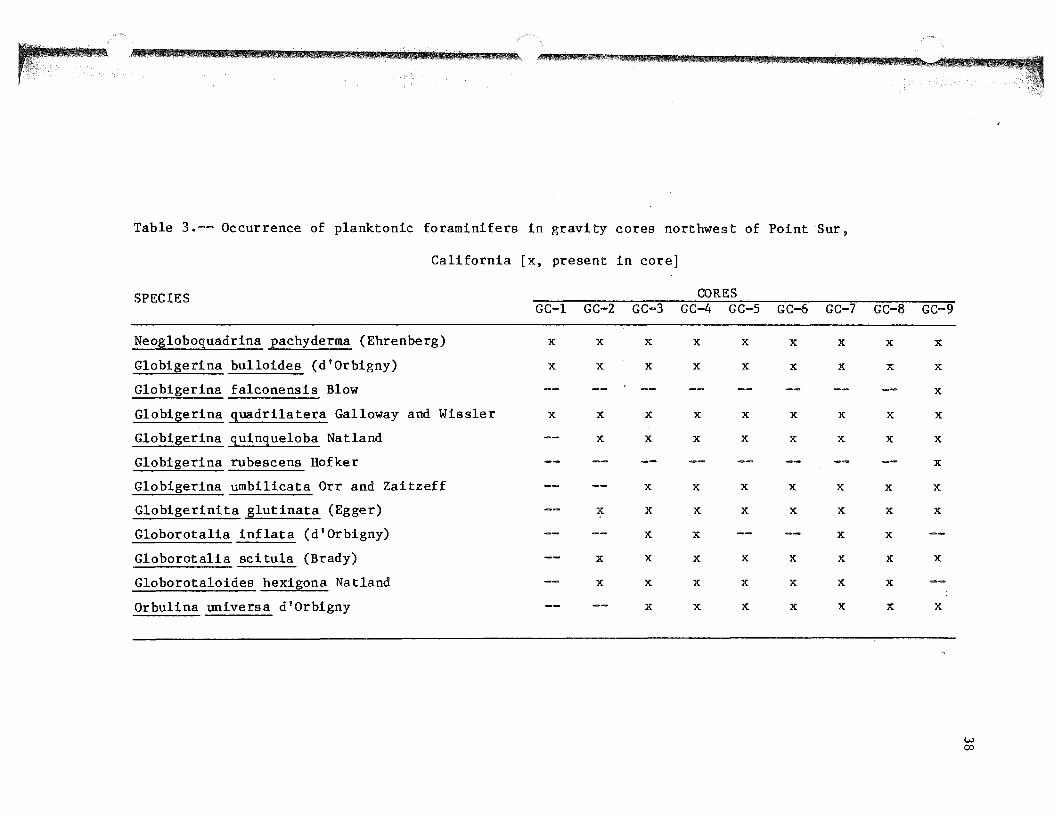
Table 3.-- Occurrence of planktonic foraminifers in gravity cores northwest of Point ·sur,
California [x, present in core]
SPECIES CORES GC-1 GC-2 GC-3 GC-4 GC-5 GC-6 GC-7 GC-8 GC-9
Neogloboquadrina pachyderma (Ehrenberg) X X X X X X X X X
Globi~erina bulloides (d'Orbigny) X X X X X X X X X
Globigerina falconensis Blow X
Globi~erina guadrilatera Galloway and Wissler X X X X X X X X X
Globigerina guingueloba Natland X X X X X X X X
Globigerina rubescens Hofker X
Globigerina umbilicata Orr and Zaitzeff X X X X X X X
Globigerinita glutinata (Egger) X X X X X X X X
Globorotalia inflata (d'Orbigny) X X X X
Globorotalia sci tula (Brady) X X X X X X X X
Globorotaloides hexigona Natland X X X X X X X
Orbulina universa d'Orbigny X X X X X X X

GRAVITY CORE 1 (505 m}
Texture Sediment Coiling Percent Percent Percent Percent Years BP
Structure N. pachyderms N. pschydermll G. qulnqueloba G. bulloldes G. glut/nata +
G. qusdrllaters • 100~ s 50 0 0 50 100 0 10 0 20 40 0 8 16
0 s • .. .. ~
E ::!.. v w 25 sS a: 0 ~ (.) " ~ ----- devolrl devoid devoid devoid ~
" , 50 :I: Scs
1-2:' ;;
0.. w " Cl cs
:;:: 9.0 Ma c. e
75 - - .!?
Scs ~ 0
100 ~ e
convoluted
clay Sse sand silt clay sS silty sand D homogeneous
sc silty clay s sand
[]I] intensely bioturbated
cs clayey silt cS clayey sand
silt Sc sandy clay w moderately bioturbated s
Ss sandy silt c clay [JJ faintly bioturbated
sand silt w faintly laminated -
II laminated
Figure 17. Plots of coiling ratio of Neogloboquadrina pacQyderma and abundance of selected species of planktonic foraminifers from the assemblages in core GC-1. Age estimate from diatom biostratigraphy.
Texture
0
25
E ~ w a: 50
0 ss (.)
~ :X: 75 t-0.. w 0
100
125 cSs
150
GRAVITY CORE 2 (717 m)
Sediment Coiling
Structure N. pachyderms
100'll. s 50 0
I\ ~
Percent
N. pachyderms
0 50
(left)
,.
~~
I ~
100
Percent
G. qulnquelobll
0 10
Percent
G. bulla/des • +
G. quadrllaters e
r
Percent
G. glut/nata
0 I T 16
1\
Figure 18. Plots of coiling ratio of Neogloboquadrina pachyderma and abundance of selected species of planktonic foraminifers from the assemblages in core GC-2.

Texture
0 cSs
f-. -ss
25 1- -
cSs
50 Scs --- - -
75 sc
e -- --~ sS
100 - - --w cSs a: 0 (.)
~ 125 Ss J: f-ll.. >-- -w Scs Cl 150
cs - - - -cSs
175 --- --cs
- -- -200
csS
225
GRAVITY CORE 3 (832 m)
Sediment Coltlng
Structure N. pachyderms
lOO'llo S 50
I J J
)
s
il
Percent
N. pachyderms
0 0 50 100
(left)
Percent
G.qulnqueloba
0 10
Percent Percent
G. bulloldea • G. glutlmJta +
G. quadrllater~l •
210 4p I 7 I
18
I~ I> II
~ r
;
j,
Years BP
10.5 ky
12.5 ky
15 ky
~ " ~ " "C
,.. ., u .c c. .. "' .. "' 0
.0
Figure 19. Plots of coiling ratio of Neogloboquadrina pachyderma and abundance of selected species of planktonic foraminifers from the assemblages in core GC-3. Age estimates from correlation with core Vl-80-P3 (Gardner and others, in press).

GRAVITY CORE 4 (862 m)
Texture Sediment Coiling Percent Percent
Structure N. pschyderma N. pachyderms G. qulnquelobs
100%8 50 0 0 50 1 0 0 10 0
cSs
25 cs I'
r--so
sc
E 75 ) ~ r--w ) cr cs 1"\l.N_ 0 u 100 I1VW
(right)
~ ----- )\ :I: 1- S\ a. 125 w
) Cl sc
\ /
150 s ) ----- s (
175 Scs
----- S) l cs ))
200 --
sc )
225
0
Percent
G. bulloldu •
G. qusdrllater• o
20 40
Percent
G. glurtnsts
0 l ~ I 16
,.
\ (
\
i)
.Yeara BP
~ " 9.5 ky >
" '0
"' 12.5 ky "' u
13.5 ky .c c.
"' 0
.. 15 ky
m 0
.0
Figure 20. Plots of coiling ratio of Neogloboquadrina pachyderma and abundance of selected species of planktonic foraminifers from the assemblages in core GC-4. Age estimates from correlation with core Vl-8D-P3 (Gardner and others, in press).
GRAVITY CORE 5 (983 m)
Texture Sediment Coiling Percent Percent Percent Percent Years BP
Structure N. pachyderms N. pachyderms G. qu/nqueloba G. bulloldes • G. glullnala
G. qusdrll•t•r• •
0 100'!1. s 50 0 0 50 100 10 0 20 40 0 -, r e
L I I 18
Scs
25 sc ))
- - ))
50 cs )
E -- --~~ } I
(right)
~ sc w a: 75 cs
., "' > ~
0 u ~
y -::t 100 sc I-
\ Ql .,
12.5 ky ,..
"' u D.. w 0
) -----125
150 cs
/ ( 1\
\ \
13.5 ky :;: c.
" "' ..
15 ky "' 0
.c
\ (left)
175 \ '
1- - - -sc
200 I
Figure 21. Plots of coiling ratio of Neogloboquadrina pachyderma and abundance of selected species of planktonic foraminifers from the assemblages in core GC-5. Age estimates from correlation with core Vl-80-PJ (Gardner and others, in press).

E ~ w a: 0 (.)
;!l; J: 1-a. w 0
0
25
so
75
100
125
150
175
200
Texture
1---sc
GRAVITY CORE 6 (1072 m)
Sediment Coiling
Structure N. pachyderms
100% s 50
)
)
) )
Percent Percent
N. pachyderms G. qulnqueloba
0 50 100 0 110
Percent Percent
G. bulloldes A G. glut/nata +
G. quadrllatera •
0 210 40 7 16 I I I
I\
Figure 22. Plots of coiling ratio of Neogloboquadrina pachyderma and abundance of selected species of planktonic foraminifers from the assemblages in core GC-6.
GRAVITY CORE 7 ( 1183 m)
Texture Sediment Coiling Percent Percent Percent Percent
N. pachyderms N. pa c lryderma G. qulnquelobll G. bulloldes . G. glutlnata Structure +
G. quadrllsrerll • 100% s 50 0 0 50 100 0 10 0 20 40 0 8 18
0 ~
)\
25 \\ \)
E \\ ~ 50 \ w a: 0 (.) 75 ;?;; cs \ J: t-a. 100 w
~ 0
125
~ 150 s 175 >
Figure 23. Plots of coiling ratio of Neogloboquadrina pachyderma and abundance of selected species of planktonic foraminifers from the assemblages in core GC-7.

GRAVITY CORE 8 (1277 m)
Texture Sediment Coiling Percent Percent Percent Percent Veers BP
N. pBchyderma N. pachyderms G. qulnquelobs G. bulloldas . G. glullnsra Structure +
G. quadrllstera e 100% s 50 0 0 50 100 0 10 0 20 40 0 8 18
0
cs
25
50
75
sc
sc ~ 9.5 ky
w, J ~ " > m "' 10.5 ky '0
)) ( ,.,
" 0
E u
12.5 ky .t: c.
100 w
cs )S .. ~
5! 0: "' 0 (J
~ 125
.., )) 0
.0
J: 1-a. w 0 150
15 ky )~
sc )) 175
cs S\ 200
Figure 24. Plots of coiling ratio of Neogloboquadrina pachyderma and abundance of selected species of planktonic foraminifers from the assemblages in core GC-8. Age estimates from correlation with core Vl-80-P3 (Gardner and others, in press).

GRAVITY CORE 9 ( 1400 m)
Texture Sediment Coiling Percent Percent Percent Percent Years BP
N. pachyderms N. pachyderm.a Structure
G. qulnquelobs G. bulloldu • G. glullnata +
G. quadrllatera o 100'!1. s 50 0 0 50 100
0 )))
0 10 16 I
0
25 %
I % % 50
cs \) E u 75 )\
12.5 ky ~ " >
" "C
,.,
' t
I( w a: )\ 0 ()
~ 100
J: ~\ .... 1-----a..
.. 0
.t= c. .. 0
.. "
w 125 ~) 0 sc 15 ky " 0
.c
150 ~) cs
)~ 175
t----- \~ sc ----200 ~ cs 1) ~
225
Figure 25. Plots of coiling ratio of Neogloboquadrina pachyderms and abundance of selected species of planktonic foraminifers from the assemblages in core GC-9. Age estimates from correlation with core Vl-8D-P3 (Gardner and others, in press).

shown in these figures are combined with 14c age determinations from the
study and are correlated with systematic variation in species abundance
from other work on the central California margin (Figure 26; Gardner and
others, in press) to assign age datums to the sediment. The variation
in species abundance is also used to make biostratigraphic correlation
between the different gravity cores. These correlations, as well as
comparisons with the work of Gardner and others (in press), are dis
cussed in the "Biostratigraphic Correlation" section.
Diatoms
The interval between 60 and 80 em in GC-1 is a laminated diato
maceous clayey silt with a 14c age )35,000 years. A smear slide of a
sample from that interval examined by John Barron (written commun.,
1983) yielded the following age diagnostic diatoms:
Actinoptychus vulgaris var. monicae
Denticulopsis hustedtii (v. rare)
Heniaulus polymorphus
Rouxia californica
Rhizosolenia barboi
Thalassionema schraderi
The age diagnostic silicoflagellate Distephanus pseudofibula was also
present. The presence of these species indicates that the sample is
late Miocene in age in the uppermost part of the Denticulopsis hustedtii
Zone-Subzone a, and approximately 9 million years in age. The diatoms
are well preserved and could not have been transported very far (John
Barron, written commun., 1983).
48

5
->-~
- 10 (])
Ol <(
15
20
V1-80-P3
Percent Percent Percent Percent Percent
N. pachyderms N. pachyderma G. bulloldes G. qulnqueloba G. glutlnata
(left) (right)
20 40 60 80 100 0 20 40 60 0 10 20 30 40 0 10 20 0 10 20
that age. Data
Figure 26. Plots of the abundances of selected species of planktonic foraminifers 4 display systematic variation with age from the assemblage in core Vl-80-PJ versus 1 C
Core is from 1600 meters of water, 60 km west of the Russian River, California. from Gardner and others (in press).

Chronostratigraphy
14c Age Determinations
Six samples were submitted to Geochron Laboratories for radiocarbon
age determination. Two samples have ages greater than 35,000 years BP.
They were from 73-78 em down core in a well laminated, diatomaceous,
clayey silt in core GC-1, the same interval that had a diatom determined
age of approximately 9 million years and from 24-26 em down core in a
silty sand just below an irregular contact with the overlying pebbly
gluaconitic sand in BC-2. Two samples from BC-7, one from a clayey,
sandy silt at 14-16 em, the other from a silty clay at 34-36 em down
core, yielded 14c dates of 2525 ± 170 years BP and 10,330 ± 340 years
BP, respectively. The two samples are separated by a sharp, irregular
contact at 30 em. Two samples were also submitted from BC-10, one from
a clayey silt at 14-16 em and the other from a sandy, clayey silt 32-34
em down core. These yielded 14c dates of 1930 ± 180 years BP and 3175 ±
185 years BP, respectively. The two samples are separated by 20 em of
bioturbated sediment with a gradational change between the lower sandy,
clayey silt and the upper clayey silt.
50

DISCUSSION
Effect ot Currents on Surface Sediment Grain Size and Composition
The California Current System contains a northerly directed
component known as the California Undercurrent with its core located
over the outer shelf-upper slope along central California (Hickey,
1979). Composite geostrophic current velocity measurements from VERTEX
1 (Broenkow and Greene, 1981) are shown in Figure 27. From this figure
it is apparent that the interval from 600 to 800 m is the most dynamic
portion of the upper continental slope with significant changes in
texture and composition. Comparison of current velocities on Figure 27
with Figure 28 shows that current velocities along the upper portion of
the slope cross the transportation field for sand and silt size material
(Heezen and Hollister, 1971).
The change in surface sediment texture is most dramatic between 600
to 800 m. The percentage of mud in the sediment increases signifi
cantly, from less than 12 percent to greater than 55 percent within this
transitional interval or zone (Figure 27). Bottom photographs show a
major change in surface texture from a dark, sandy surface to a light,
muddy surface between 700 and 750 m (Thompson and others, in prep.).
Grain size data and bottom photographs indicate the transitional zone on
the slope off Point Sur is located between approximately 600 and 800 m
and the mudline is located at the bottom of this zone at approximately
750 to 800 m (Figure 27). Stanley and Wear (1978, p. Ml9) define the
"mudline" as " ••• the lower limit of the transitional zone [and] the

-;; ~ ; E
= c. . 0
~ ;; 3:
Cumulative Percent Surficial Sand-Silt-Clay
0 25 50 75 100
400 400
600 600
BOO BOO
1000 1000
1200 1200
llilli) . Dill . D ~ Gravel Sand Silt Clay
Distance From Shore (km)
50
I I \ I I I II \
I \
25
\ 10
" .._ __ jl \.5
\ \ .: I 3 ' ~
0
I \...---- --,::_-~:.': I -.:·: Transl11on
\ · Zone
I I
1
I I I I I
Current Velocity (em/sec)
Northerly Directed Flow
Cumulative Percent Surficial Sand Components
0 20 40 60 60 100
400
600
BOO
1000
1200 1200
D [] Glauconite Slllceoua
Quartz+ Feldspar Microfauna . II IIIII Mica lW Fecal Pellets Carbonate 1111111 Shell Fragments
D Planktonic ~ Organic Debris Opaque Minerals
Foraminifers
D Rock Fragments ~ Benthic Foraminifers
Figure 27. Diagram showing effects of current velocities of the California Undercurrent during typical summer conditions on the distribution of surficial sediment texture and sand composition from box core sediments. Dashed lines are northerly directed current velocity data from Broenkow and Greene (1981) and Willia~ Broenkow, (written communication, 1983).
VI N

Current Velocity (em/sec)
0.01 0.1 1.0 10 100
Pebbles
Granules ::::::--~ ... 1.0 -,o~ C!> E
'b-.... cu E ~ .... E Sand 0 -o'~ C!> .._
c:,0 > Q) Cl) ..... Ill
0.1 Q)
.r: E 0 0 til .... ·-
Q
c: ·-til 0 0.01
.._ ..:.. 0 .... " 0 ~ 0
()
Clay ~ 0.001
Figure 28. Current velocities required for erosion, transportation and deposition (from Heezen and Hollister, 1971).
53

depth of substantially increased silt and clay content below which depo-
sition prevails...... A mudline on the midslope (300 to 1,000 m) has
been recognized on the Atlantic margin off Cape Hatteras (Newton and
others, 1971; Keller and others, 1979). Active offshelf spillover of
coarse sediment along a relatively narrow shelf and continuous reworking
of sediment along the upper slope by the Gulf Stream off Cape Hatteras
depress the mudline below the effect of major Gulf Stream erosion to
approximately 800 m (Stanley and others, 1983). The sedimentological
response to physical conditions on the margin off Point Sur is similar
to the response on the margin off Cape Hatteras; the shelf is narrow,
coarse material occurs over and below the shelf break, and the mudline
occurs below the erosional or transportational effects of the California · .. ,
Undercurrent.
The change from nondeposition or erosion to deposition indicated
by the mudline is supported by compositional changes in the sand-size
fraction as well. The increase in abundance of mica between 600 and
800 m (the transitional zone) from less than 5 percent to 18 percent of
the total sand indicates a change in depositional regimes. In general,
a lack of mica (here, (5 percent shallower than 600 m) indicates non-
deposition or erosion and the presence of fine-sand-size mica (here, >15
percent deeper than 785 m) indicates deposition of fine material (Doyle
and others, 1968). On the margin off Cape Hatteras, an increase in mica
content that indicates the change from nondeposition to deposition
occurs well below the shelf break (Doyle and others, 1968, p. 387), in
close agreement with the location of regime change indicated by the
54

55
-mudline (Stanley and others, 1983). The change in glauconite abundance
in the study area also supports the location of the nondepositional-
depositional boundary between 600 and 800 m. The formation of glauco-
nite in modern environments requires exposure of incipient grains to sea
water for extended periods of time, by necessity requiring a minimum of
sediment influx and/or winnowing (Odin and Matter, 1981). The hypo-
thesis that surficial glauconite indicates environments of extremely
slow deposition or erosion is not new. Galliher (1935), a pioneer in
the study of the origin of glauconite, concluded that glauconite forming
in the Monterey Bay, California was restricted to areas of very low
sedimentation. In more recent work on glauconite in Monterey Bay, high
abundance and diverse morphology of glauconite were associated with low
sedimentation rates (Hein and others, 1974). Inspection.of Figure 27
shows that siliceous microfaunal debris in the sand-size fraction is
completely absent above 600 m and increases gradually below that depth
to approximately 6.5 percent at 1200 m. It is likely that the
California Undercurrent is strong enough to keep the bottom relatively
free of fine material on the slope above 600 to 800 m northwest of
Point Sur.
Effects of Oxygen Content on Surface Sediment Composition
Oxygen content in the water column, particularly within the oxygen
minimum zone (OMZ), appears to influence the biogenic and perhaps the
authigenic components of the sediments on the continental slope. Figure
29 shows the relationship between oxygen content and the composition of

Weight Percent Total Organic Cnrbon Oxygen (ml/1) Cumulative Percentage of Sediment Components
0 1.00 2.00 3.00 4.00 0 0.5 1.0 1.5 2.0 0 20 40 60 80 100
400 400 400
" " ; .s 600 600 -"
600 600
ii .. 0
;; ; 3: 600 800 aoo aoo
1000 1000 1000
1200 1200 1200
0 1.50 3.00 4.50 6.00
Weight Percent Carbonate [] Quartz ~Rock ~ Benthic + Fragments Foraminifers Feldspar
TOC :1:1:11 m Glauconite -~y,. Siliceous Mica ;>f// Microfauna
Carbonate D Opaque ~ Fecal Peilels II Carbonate Minerals Shell Fr agmenb
Planktonic ~ Organic Debris Foraminifers
Figure 29. Distribution of surficial total organic carbon, carbonate, and sand components from box cores versus water depth and their possible relation to an impinging oxygen minimum zone (stippled in middle figure).
the sediments. The percentage of benthic foraminifers increases above
and below a minimum between 593 and 905 m, corresponding to the lowest
oxygen values in the OMZ (Figures 29 and 30). The percentage of fecal
pellets reaches a maximum at the lower edge of the OMZ (Figures 29 and
31) and is directly related to a peak in the total number of organisms
in the upper few centimeters of sediments at the edge of the OMZ on the
continental slope west of Point Sur (Thompson, 1982).
Macrofaunal shell fragments are uncommon on the slope at Point Sur.
The minima (less than 1 percent) occur in surface sediments at 593 m and
between 785 and 1020 m, all located within the OMZ. The two maxima of
shell fragments are at 690 m and 1085 m, respectively (Appendix G). The
maximum number of living individuals with carbonate shells on the slope
off Point Sur is at 1085 m (Thompson, 1983), and represents an immediate
source for the maximum percentage of carbonate fragments at 1085 m.
Thompson also noted a relative maximum in living individuals with
carbonate shells near 600 m, yet no shell fragments were found in
surface sediments at this depth. Thompson and others (in prep.)
observed "biotransport" of non-endemic shells by hermit crabs in the
core of the OMZ off Point Sur. Downslope biotransport and perhaps creep
may combine to provide a viable means of eliminating shell and shell
fragments from the upper edge of the OMZ and relocate them lower on the
slope. The minimum carbonate content of < 1 percent at 600 m (Figure
29) corresponds with and appears to be controlled by the combined
minimum of carbonate shell fragments and benthic foraminifers at 600 m.
The occurrence of glauconite on the continental slope is centered
57

~ (/)
'-Q) ..... Q)
E
.s::::. ..... 0. Q)
0
Percent Benthic Foraminifers in Surficial Sand-size Material
12
J=====================~~------~~
-
-
Figure 30. Percentage of benthic foraminifers (striped) in the sand-size fraction of surface_ samples versus water depth and their relat~on to the oxygen minimum zone (from box cores 1 - 10).
58

,-.. (/) 1-Q) ..... Q)
E
..c ..... 0.. Q)
0
Percent Fecal Pellets in Surficial Sand -size Material
0
-10
I
20 I
30 I
40
400-
- ............................................ . . . . . . . . . . . . . . . . . . . . . . . . . . . . . . . . . . . . . . . . . . . . ....................................... -..... . . . . . . . . . . . . . . . . . . . . . . . . . . . . . . . . . . . . . . . . . . . . ............................................ 60"0 _:::::::::::::::::::::::::::::::::::::::::::::::::::::::::::::::::::::::::::::::::::::::: r-. .......................................... . . . . . . . . . . . . . . . . . . . . . . . . . . . . . . . . . . . . . . . . . . . . . ............................................ . . . . . . . . . . . . . . . . . . . . . . . . . . . . . . . . . . . . . . . . . . . . ............................................ . . . . . . . . . . . . . . . . . . . . . . . . . . . . . . . . . . . . . . . . . . . . . . . . . . . . . . . . . . . . . . . . . . . . . . . . . . . . . . . . . . . . . . . . . . . . . . . . . . . . . . . . . . . . . . . . . . . . . . . . . . . . . . . . . . . .
- ·.·.·.·.·.·.·.·.·.·.·-·-·-·-·.·-·.·.·.·.·.·.·.·.·.·.·.·.·.·.·.·.·.·.·.·.·.·.·.·.·.·.·.·-~·......... . ....... . ~<::::::::::::::: 0 x y g en Minim urn Zone:::::::::::::::::
""'"1;"T;T:T;~.,._· •: •: •: •: •: •: • • • • • • • • • • • • • • • • • • • • • • • • • • • • • • • • • • • • • • • • • •. • • • • •. • •: •: •: •: •: •: •: •: •: I •• e e • • • e • e • • e •• • e I • • •• • I e I I I • e • • e • • e I • • • I • e
800 :::: :-:::::::::::::::::::::::::::::::::::::::::::::::::::::::::::::::::::::::::::-
~~·~·~·g·~·~· ~·~· ·~· ·~· "l. ·: ............................................................... .
1000
. . . . . . . . . . . . . . . . . . . . . . . . . . . . . . . . . . . . . . . . . . . . . . . . . . . . . . . . . . . . . . . . . . . . . . ·.·.·.·.·.·.·.·.·.·.·.·.·.·.·.·.·.·.·.·.·.·.·.·.·.·.·.·.·.·.·.·.·.· ................................. . . . . . . . . . . . . . . . . . . . . . . . . . . . . . . . . : : : : .... -:-::::::::::::::::::::::::::::::::::::::::::::::::::::::::: ~
f!.-1.-Trf.f.f,~l'+'-t,..,.."'r'lr"trtrf.f-.lf-.F..t: !f: ~: <::..:. ~ : : : : : : : : : : :::: : :: : : :: : : : : : : : : : : : : : :: :: : : :
~·~..:.:.:·::::::::::::::::::::::::::::::-
1 2 0 0 _.....~..~..~. ......... .~..~..~...J...I..,j"-rl------r---.-----• ....-----+-0 10 20 30 40
Figure 31. Percentage of fecal pellets (patterned) in the sand-size fraction of surface samples versus water depth and their relation to the oxygen minimum zone (from box cores 1 - 10).
59

about the upper edge of the OMZ at approximately 525 m (Figure.29 and
32). McRae (1972) pointed out that most geoscientists studying the
formation of glauconite view a slightly reducing environment with modest
circulation as the most conducive for glauconitization. There is also a
delicate balance between the degree of physical confinment of a particle
and the amount of ionic exchange between the microenvironment within the
particle and the ambient open marine sea water (Odin and Matter, 1981).
Excessive confinment caused by too much mud in the sediment will prevent
formation of glauconite and insufficient confinment caused by too large
a mean grain size allows only glauconitic rinds to form. It is within a
slightly reducing and confined environment where circulation is suffi
cient for the exchange of iron necessary for glauconite formation to be
most effective. In strongly oxidizing environments, soluble iron is
precipitated and iron minerals oxidize; iron is thus largely immobi~
· lized. Glauconite also degenerates in contact with highly oxygenated
sea water (Odin and Stephan, 1982). Conversely, in strongly reducing
environments in the presence of organic matter or hydrogen sulfide, iron
is reduced and becomes soluble. The iron in solution is then either
precipitated as pyrite or migrates into sea water (Odin and Matter,
1981). Because strongly reducing environments usually require little or
no circulation to persist, iron exchange between the substrate and the
ambient sea water is insufficient and glauconite does not form (Odin and
Matter, 1981).
Berner (1981) suggested a geochemical classification of sediments
based on the presence of key minerals that enables researchers studying
60
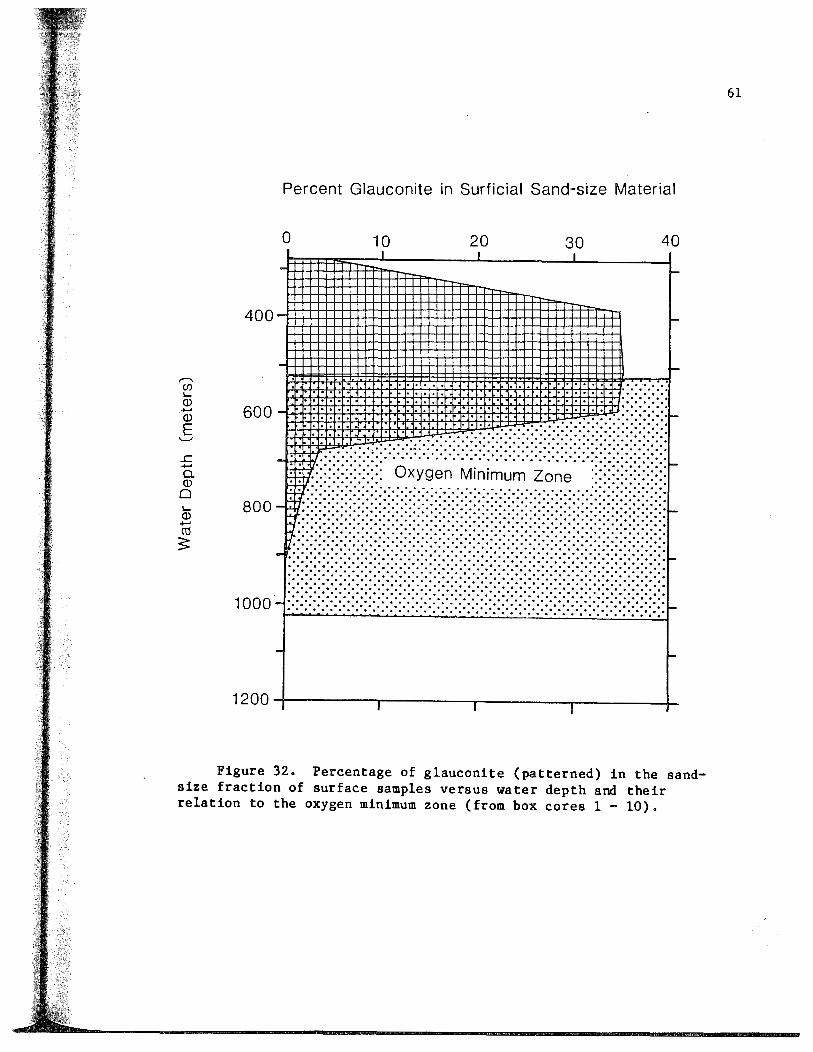
..c ...... Q. (])
0
Percent Glauconite in Surficial Sand-size Material
0 10 20 30 40 I I I - -
400-
...... . . . . . . ::::::::::: .·. ·.:.:.: .. :-:::::::::::~ ................
. . . . ....... :-:.:-:-:-:-:-:-:.:.:-:-:.:-:-:-:-:-:-: . . . . . . . . ~ . . . . . . . . . . . . . . . . . . . . . . . . r/::::::::::: ~:::::::: :::::::::::::::::::::::::::::::::::::::::::::::::::::::::::: f-
600-
: :~-:::::::::::::::: Oxygen Minimum Zone ::::::::::::::::::
- :~.: ::::::::::::::::::::::::::::::::::::::::::::::::::::::::::::::::: :·: ~: ~: ~ :~ :~: ~: ~: ~: 800 ~tt· .......................................... 1-
J. iii i ·iii iii iii iii i iii iii iii iii iii iii iii i iii iii iii iii iii i iii i iii iii i iii iii iii iii i iii i. ~ 100o-·.·.·.·.·.·.·.·.·.·.·.·.·.·.·.·.·.·.·.·.·.·.·.·.·.·.·.·.·.·.·.·.·.·.·.·.·.·.·.·.·.·.··"f........................................... ·.·
-
1200~---------,,-----------~,----------~,-----------+-
Figure 32. Percentage of glauconite (patterned) in the sandsize fraction of surface samples versus water depth and their relation to the oxygen minimum zone (from box cores 1- 10).
61

the rock record to interpret oxygen and sulfide concentrations of the
depositional environment. The presence or absence of dissolved oxygen
and dissolved sulfide in the sediments at the time of authigenic mineral
formation controls the characteristic phases present in the sediments.
Table 4 is a summary of Berner's (1981) environments and characteristic
phases.
Table 4.--Geochemica1 classification of marine sedimentary
environments ba.sed on mineral composition. (After Berner, 1981).
Environment
Oxic
Anoxic
Sulfidic
Nonsulfidic
Post-oxic
Methanic
Characteristic phases
Hematite, goethite, Mn0 2-type minerals; no organic matter
Pyrite, marcasite, rhodochrosite, alabandite; organic matter
Glauconite and other Fe2+-Fe3+ silicates (also siderite, vivianite, rhodochrosite); no sulfide minerals; minor organic matter
Siderite, vivianite, rhodochrosite; earlier formed sulfide minerals; organic matter
A part of the slope between 300 and 800 m where glauconite and some
organic matter are present may belong in the post-oxic nonsulfidic
anoxic environment.
Clay Mineral Assemblages in Surface Sediments
Surficial clay mineral assemblages on the continental slope north-
62
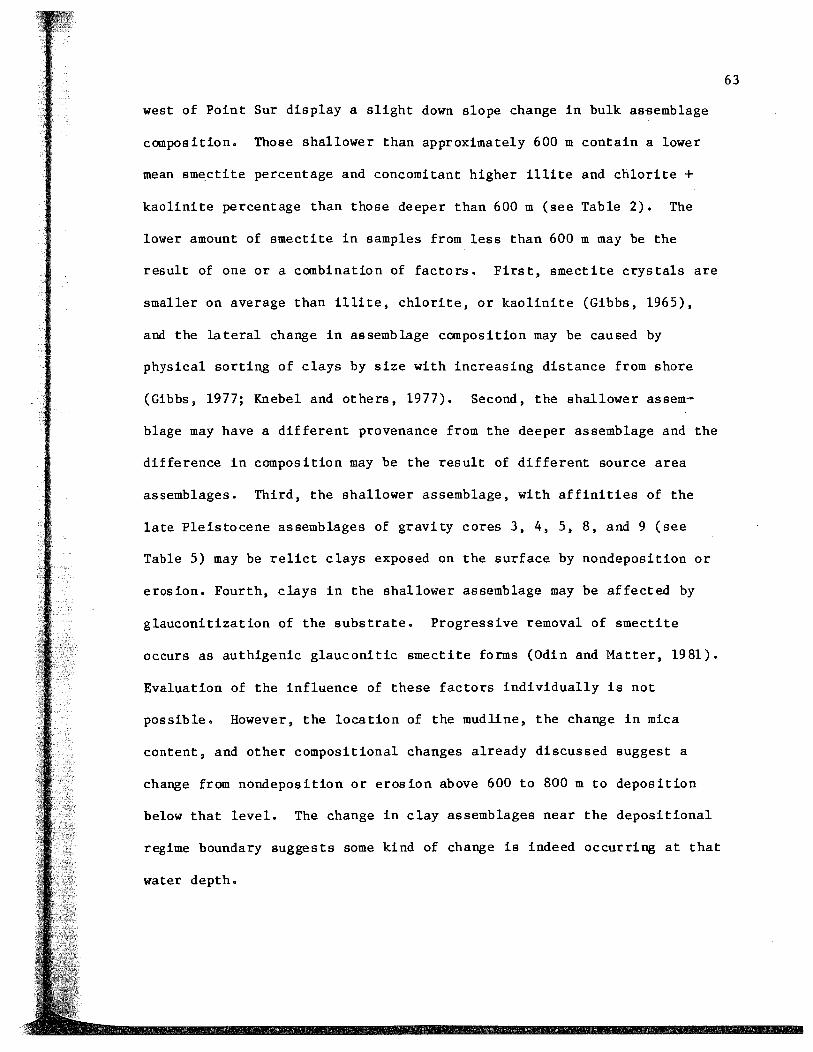
west of Point Sur display a slight down slope change in bulk assemblage
composition. Those shallower than approximately 600 m contain a lower
mean smectite percentage and concomitant higher illite and chlorite +
kaolinite percentage than those deeper than 600 m (see Table 2). The
lower amount of smectite in samples from less than 600 m may be the
result of one or a combination of factors. First, smectite crystals are
smaller on average than illite, chlorite, or kaolinite (Gibbs, 1965),
and the lateral change in assemblage composition may be caused by
physical sorti~g of clays by size with increasing distance from shore
(Gibbs, 1977; Knebel and others, 1977). Second, the shallower assem
blage may have a different provenance from the deeper assemblage and the
difference in composition may be the result of different source area
assemblages. Third, the shallower assemblage, with affinities of the
late Pleistocene assemblages of gravity cores 3, 4, 5, 8, and 9 (see
Table 5) may be relict clays exposed on the surface by nondeposition or
erosion. Fourth, clays in the shallower assemblage may be affected by
glauconitization of the substrate. Progressive removal of smectite
occurs as authigenic glauconitic smectite forms (Odin and Matter, 1981).
Evaluation of the influence of these factors individually is not
possible. However, the location of the mudline, the change in mica
content, and other compositional changes already discussed suggest a
change from nondeposition or erosion above 600 to 800 m to deposition
below that level. The change in clay assemblages near the depositional
regime boundary suggests some kind of change is indeed occurring at that
water depth.
63

Table 5.--Semiquantitative clay mineral assemblages of Recent and late Pleistocene sediments from the continental slope
northwest of Point Sur, California. [Percentages determined from corrected X-ray diffraction peak volume. Age of sediments
based on planktonic foraminifer assemblages • S, smectite; I, illite; C + K, chlorite + kaolinite; x, not present in core]
Core Depth Surficial 12.5-15 kl BP 18-22 kl BP (meters) S% I% C+K% S% I% C+K% S% I% C+K%
GC 3 832 50 23 27 50 25 25 48 28 24
GC 4 862 54 23 23 48 25 27 48 27 25
GC 5 983 50 22 28 46 25 29 48 26 26
GC 6 1072 53 23 24 X X X X X X
GC 7 1183 56 21 23 X X X X X X
GC8 1277 53 20 19 47 25 28 47 28 25
GC 9 1420 54 22 24 44 31 25 46 24 30
mean 52.9±3.1 22±2 .o 24.0±5.0 47±2 .2 26.2±2.7 26.8±1.8 47.4±0.9 26 .6:1;1. 7 26:1;2.4

Five surficial sediment clay mineral provinces, defined py the
relative abundance of smectite, illite, and chlorite+ kaolinite have
been identified along the California coast from the Oregon border to
Point Conception (Griggs and Rein, 1980). A boundary in northern
Monterey Bay separates a province to the north (Province 2 of Griggs
and Rein, 1980) characterized by high smectite (mean, 57 percent), low
illite (mean, 18 percent), and low chlorite+ kaolinite (mean, 25
percent) from a province to the south (Province 3 of Griggs and Rein,
1980) characterized by moderate smectite (mean, 26 percent), high illite
(mean, 39 percent), and moderate chlorite+ kaolinite (mean, 35
percent). Figure 33 shows the compositional range of clay assemblages
from the seafloor, intervals from 12.5 to 15 and 18 to 22 thousand years
BP, the limits of Provinces 2 and 3, and the major clay sources. Clay
mineral assemblages from surficial sediments in the study area, geo
graphically located in the southern province, are characterized by high
smectite (mean, 51 percent), low illite (mean, 25 percent), and low
chlorite + kaolinite (mean, 24 percent) and fall well within the compo
sitional limits of Province 2 (see Table 2 and Figure 33). The compo
sition of clay assemblages in the study area correspond more closely to
clay assemblages in the northern province (Province 2) than to clay
assemblages in the southern province (Province 3), suggesting several
possibilities. First, clay-size material on the upper continental slope
northwest of Point Sur has, at least in part, the same provenance as
clay-size material on the shelf and slope between Point Reyes,
California and northern Monterey Bay. Perhaps clays were entrained and
65

II!IIIIM ! I
\ \
Illite
El Sources
Iii Province mean
Surficial clay
12.5-15 ky BP
18-22 ky BP
Age uncertain
e Miocene
Province 3
\
Russian River
fl • I Y--------. -=-•• =1·-( ..
\ \
{ . .. ..., . \ Province 2
8 Province 2 Mean
I I
I \ \.~---7~---------------J
\ I \ I
Chlorite + ~-. ...... ..___...__... _ __._......,. _ _.. _ _.... _ _.... _ _.__..;,t..._....__....__..__...__....__...__~__..____,. _ _.. Smectite Kaolinite
Figure 33. Compositional range of clay mineral assemblages from cores in the study area. Age assignments are biostratigraphically derived. Composition of source areas, province means and compositional limits of Province 2 (Pt. Reyes to northern Monterey Bay) and Province 3 (southern Monterey Bay to Pt. Buchon) are from Griggs and Hein (1980).

transported by the southerly flowing California Current. Sec9nd, the
contribution of clay minerals from rivers debauching into Monterey Bay
has not left a dominant imprint on the clay mineral assemblage of
surface sediments on the continental slope northwest of Point Sur.
Third, because the clay assemblage on the continental slope off Point
Sur bears a closer resemblance to Province 2 than to Province 3, the
boundary of Griggs and Hien (1980) in northern Monterey Bay separating
the two provinces may need to be redrawn farther south to include the
upper continental slope northwest of Point Sur in Province 2.
Total Organic Carbon Distribution in Surface Sediments
High total organic carbon (TOC) content in near surface sediments
often coincides with a minimum in dissolved oxygen in the oxygen minimum
zone (OMZ) developed in areas of coastal upwelling (Calvert and Price,
1971; Manheim and others, 1975) where surface biological productivity is
highest. In general, maximum TOC will normally occur on the upper slope
regardless of how depleted the OMZ becomes (Jones, 1983). This occurs
because slope sediments normally have a substantially smaller grain size
but often a sedimentation rate similar to that of shelf sediments, and a
comparable grain size but much higher sedimentation rates than abyssal
sediments. Increased bacterial activity in coarse-grained sediments of
shelf deposits and longer residence time of organic carbon in the water
column prior to deposition in abyssal sediments allow for oxidation of
the organic carbon (Demaison, 1981). Thus, the long-noted broad corre
lation seen between particle size and TOC content (Trask, 1932)
67
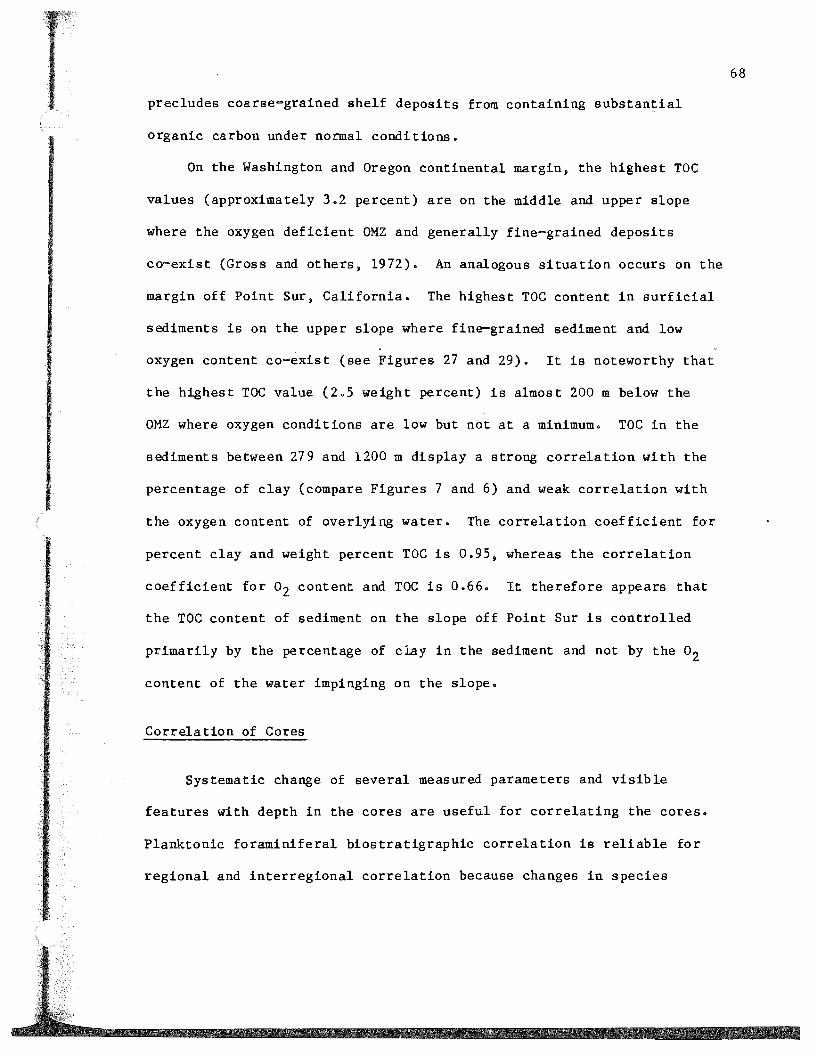
precludes coarse-grained shelf deposits from containing substantial
organic carbon under normal conditions.
On the Washington and Oregon continental margin, the highest TOC
values (approximately 3.2 percent) are on the middle and upper slope
where the oxygen deficient OMZ and generally fine-grained deposits
co-exist (Gross and others, 1972). An analogous situation occurs on the
margin off Point Sur, California. The highest TOC content in surficial
sediments is on the upper slope where fine-grained sediment and low
oxygen content co~exist (see Figures 27 and 29). It is noteworthy that
the highest TOC value (2.5 weight percent) is almost 200 m below the
OMZ where oxygen conditions are low but not at a minimum. TOC in the
sediments between 279 and 1200 m display a strong correlation with the
percentage of clay (compare Figures 7 and 6) and weak correlation with
the oxygen content of overlying water. The correlation coefficient for
percent clay and weight percent TOC is 0.95, whereas the correlation
coefficient for o2 content and TOC is 0.66. It therefore appears that
the TOC content of sediment on the slope off Point Sur is controlled
primarily by the percentage of clay in the sediment and not by the o2
content of the water impinging on the slope.
Correlation of Cores
Systematic change of several measured parameters and visible
features with depth in the cores are useful for correlating the cores.
Planktonic foraminiferal biostratigraphic correlation is reliable for
regional and interregional correlation because changes in species
68
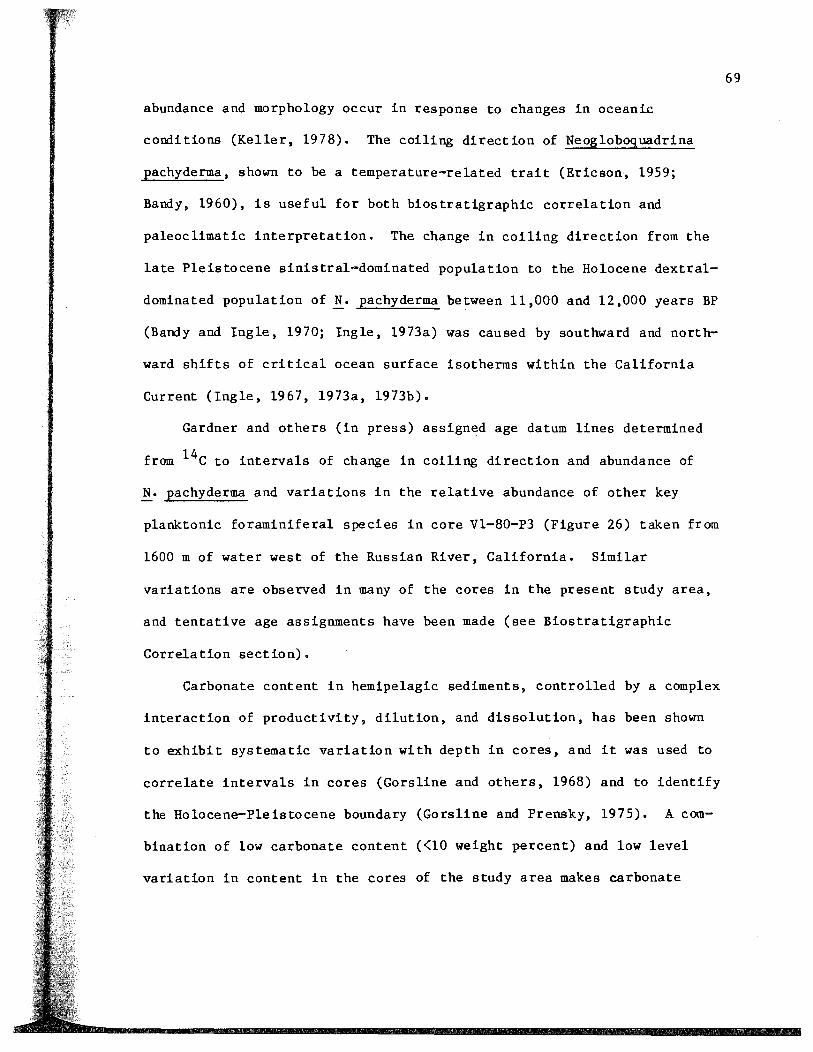
abundance and morphology occur in response to changes in oceanic
conditions (Keller, 1978). The coiling direction of Neog1oboquadrina
pachyderms, shown to be a temperature-related trait (Ericson, 1959;
Bandy, 1960), is useful for both biostratigraphic correlation and
paleoclimatic interpretation. The change in coiling direction from the
late Pleistocene sinistral-dominated population to the Holocene dextral
dominated population of~· pachyderma between 11,000 and 12,000 years BP
(Bandy and Ingle, 1970; Ingle, 1973a) was caused by southward and north
ward shifts of critical ocean surface isotherms within the California
Current (Ingle, 1967, 1973a, 1973b).
Gardner and others (in press) assigned age datum lines determined
from 14c to intervals of change in coiling direction and abundance of
N. pachyderms and variations in the relative abundance of other key
planktonic foraminiferal species in core V1-80-P3 (Figure 26) taken from
1600 m of water west of the Russian River, California. Similar
variations are observed in many of the cores in the present study area,
and tentative age assignments have been made (see Biostratigraphic
Correlation section).
Carbonate content in hemipelagic sediments, controlled by a complex
interaction of productivity, dilution, and dissolution, has been shown
to exhibit systematic variation with depth in cores, and it was used to
correlate intervals in cores (Gorsline and others, 1968) and to identify
the Holocene-Pleistocene boundary (Gorsline and Prensky, 1975). A com
bination of low carbonate content ((10 weight percent) and low level
variation in content in the cores of the study area makes carbonate
69
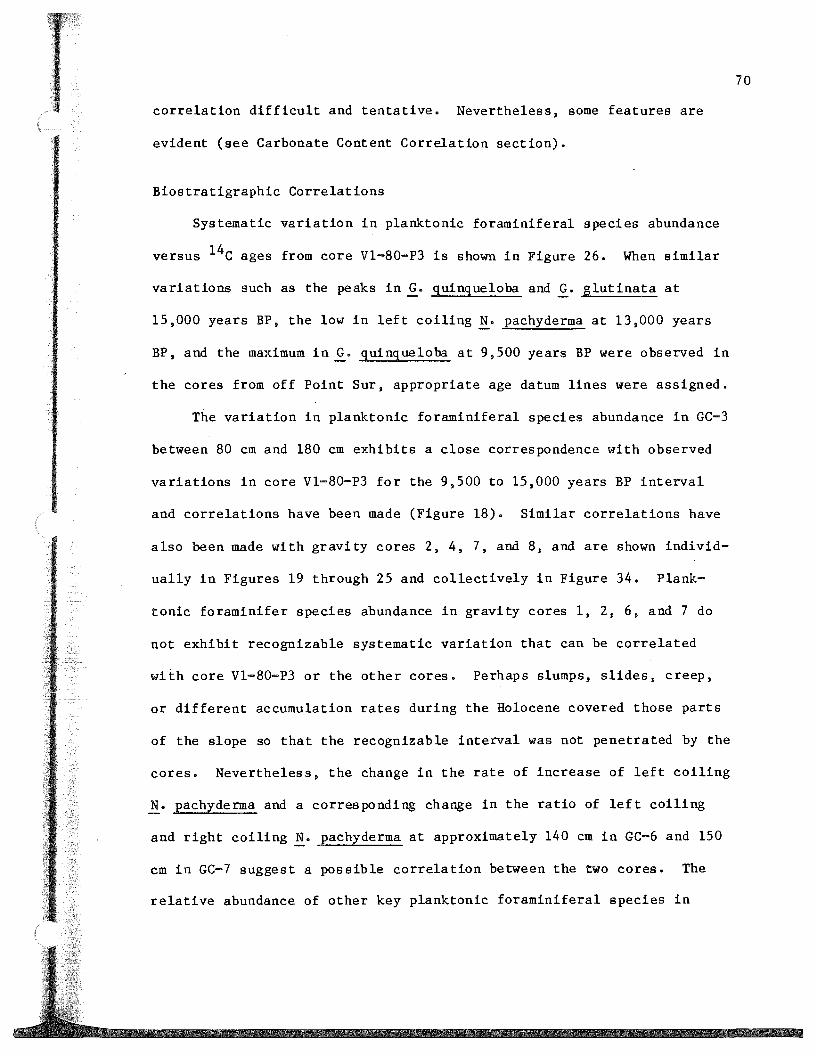
correlation difficult and tentative. Nevertheless, some features are
evident (see Carbonate Content Correlation section).
Biostratigraphic Correlations
Systematic variation in planktonic foraminiferal species abundance
versus 14c ages from core Vl-80-P3 is shown in Figure 26. When similar
variations such as the peaks in~. quinqueloba and G. glutinata at
15,000 years BP, the low in left coiling~· pachyderma at 13,000 years
BP, and the maximum in~. quinqueloba at 9,500 years BP were observed in
the cores from off Point Sur, appropriate age datum lines were assigned.
The variation in planktonic foraminiferal species abundance in GC-3
between 80 em and 180 em exhibits a close correspondence with observed
variations in core Vl-8G-P3 for the 9,500 to 15,000 years BP interval
and correlations have been made (Figure 18). Similar correlations have
also been made with gravity cores 2, 4, 7, and 8, and are shown individ
ually in Figures 19 through 25 and collectively in Figure 34. Plank
tonic foraminifer species abundance in gravity cores 1, 2, 6, and 7 do
not exhibit recognizable systematic variation that can be correlated
with core V1-80-P3 or the other cores. Perhaps slumps, slides, creep,
or different accumulation rates during the Holocene covered those parts
of the slope so that the recognizable interval was not penetrated by the
cores. Nevertheless, the change in the rate of increase of left coiling
N. pachyderma and a corresponding change in the ratio of left coiling
and right coiling N. pachyderma at approximately 140 em in GC-6 and 150
em in GC-7 suggest a possible correlation between the two cores. The
relative abundance of other key planktonic foraminiferal species in
70

0
25 Ul
Q; 50 4i
.5 "' 75
0 u .5
100
.c c. 125 Ql 0
150
175
200
225
GC-1 GC-2 GC-3 GC-4
(505 m) (717 m) (832 m) (882 m)
sS Ma
cSs
--12.5 ky-?-··
cs
sc
ss '<> css ·.s
-----"' -l-.s.,
cs
Ss ~ .S sc
- ~C_! -+.J..
cs
cSs
cs
csS
Biostratigraphic correlatiOn wlfh ass1gned age, Quened where age uncertain ,dolled where
not J[.IOhcable to core: ky =thousand years. Ma • mdhon yef'Jrs,
GC-5
(983 m)
GC-6 GC-7 GC-8 GC-9
(1072 m) (1183 m) (1277 m) (1420 m)
. -9.5 -1/ .,"' cs
IJ..• " --?--···· cs···· ··12.5 ky·· ·· cs· · --?
cs
.. 15 ky .. _....\ "''1-~ sc
sc cs
cs sc
cs
clay Sse snnd slit cldy sS silty sand
sc silly clay sand
cs clayey silt cS clayey sand
slit Sc sandy clily
Ss sundy silt clay
Figure 34. Biostratigraphic correlation of gravity cores. Ages determined from correlation of planktonic foraminifers in gravity cores with core Vl-8D-P3 of Gardner and others (in press).
two cores suggests that the sediments are less than 12,000 years old,
perhaps 7,000 years or less.
The 9 million year age assigned to the lower portion of.GC-1, based
on the diatom assemblage, combined with an absence of planktonic foram
inifers precludes correlation with the Quaternary biostratigraphy of
core V1-80-P3 or the cores in the study area.
Carbonate Content Correlation
A systematic variation in carbonate content enables correlation to
be made between three gravity cores and two box cores collected between
832 and 1020 m. In BC-7 and BC-8, and GC-3, GC-4, and GC-5, the reduc
tion of carbonate by one hal~ from that of deeper sediments occurs in
the interval from 35 to 15 em; in GC-5 the interval is 65 to 15 em (see
Figure 11). The decrease in carbonate may reflect any one or a combi
nation of: (1) a decrease in carbonate productivity, (2) dissolution,
and (3) dilution. The ratio of planktonic to benthic foraminifers given
in Table 6 shows a distinct drop in the percentage of planktonic foram
inifers occurring between 35 and 15 em. The decrease in planktonic
foraminifers above approximately 35 em is probably the result of prefer
ential dissolution of the thin tests of planktonic foraminifers (Berger,
1979). Also occurring within this interval is a textural facies change
from silty clay and clayey silt to sandy, clayey silt separated by a
sharp contact. A 14c date in BC-7 at 34-36 em (just below the sharp
contact) is 10,330 years BP. Correlations between the gravity cores and
box cores indicate that the textural change and decrease in carbonate
content have occurred less than 10,000 years BP. Gardner and others (in
72
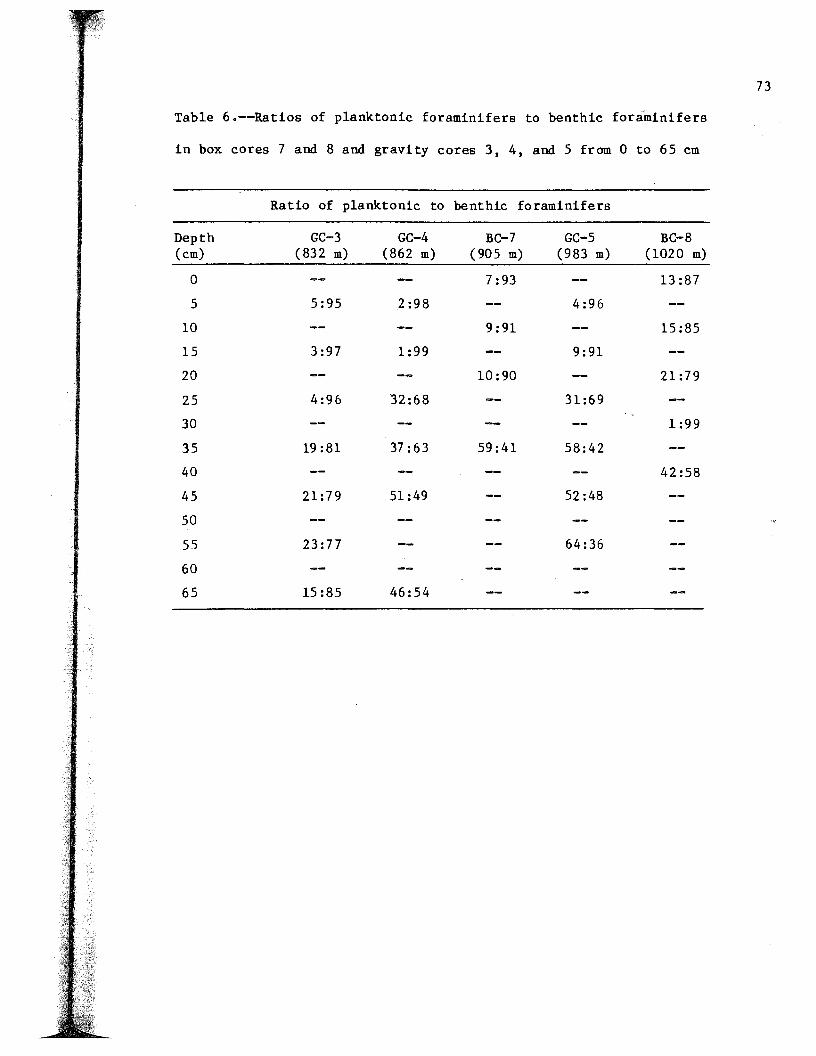
73
Table 6.--Ratios of planktonic foraminifers to benthic foraminifers
in box cores 7 and 8 and gravity cores 3, 4, and 5 from 0 to 65 em
Ratio of planktonic to benthic foraminifers
Depth GC-3 GC-4 BC-7 GC-5 BC-8 (em) (832 m) (862 m) ( 905 m) (983 m) (1020 m)
0 7:93 13:87
5 5:95 2:98 4:96
10 9:91 15:85
15 3:97 1:99 9:91
20 10:90 21:79
25 4:96 32:68 31:69
30 1:99
35 19:81 37:63 59:41 58:42
40 42:58
45 21:79 51:49 52:48
50
55 23:77 64:36
60
65 15:85 46:54

press) have tentatively interpreted the interval from 0 to o,SOO years
BP in core V1-80-P3 to be dissolution affected. The onset of disso
lution less than approximately 10,000 years BP may have resulted from
changes in oceanographic conditions that followed rapid deglaciation
and sea level rise. Secular carbonate dissolution cycles have been
correlated with deglaciation throughout the Pleistocene (Shackleton and
Opdyke, 1973, 1976). The last four periods of maximum warming and sea
level rise are associated with dissolution minima (a preservation
spike). The preservation spike at the end of the Pleistocene was
followed immediately by the present period of dissolution--the Holocene
dissolution pulse (Thompson and Saito, 1974). Thompson and Saito (1974)
used oxygen isotope data to correlate the beginning of the Holocene
dissolution pulse (10,000 ±2,500 years BP) with the oxygen isotope Stage
1-2 boundary (13,000 years BP) of Shackleton and Opdyke (1973). The low
carbonate content and low planktonic to benthic foraminiferal ratio in
the tops of cores between 832 and 1020 m off Point Sur may represent the
Holocene dissolution pulse brought about by deglaciation and correlate
with the oxygen isotope Stage 1-2 boundary of Shackleton and Opdyke
(1973, 1976). However, without oxygen isotope data from the present
study area, this correlation cannot be confirmed.
Lithostratigraphic Correlation
Systematic distribution of textural and compositional facies and
depositional structures enable tentative correlations to be made between
box and gravity cores. These correlations are shown on Figure 35.
The glauconitic sand facies is present in the upper 10 to 25 em of
74

200
400
600
BOO
1000
1200
1400
0 5
~ --3 Horizontal Distance (km)
GC-9
- _') ____ _
Lithologic corretation, dashed where inferred, QUetied where uncertain,
dotted where not applicable due to ol!set ot cores on cross section
Carbonate content correlation
lithologic facies change
Approximate contact ol Miocene sediment with
younger Terliary and Quaternary sediment
- '-
I I
I
' ' I
Clay
Silt
200
400
600
I BOO I
I I
I I I I 0 I 1000
I Clay
50
Sc Sandy clay 'E u 1200
100 m cS Clayey sand 0
(.)
.<: s Sand 150 = c.
m
sS Silty sand 0
200
Ss Sandy silt
Silt 250
cs Clayey silt
sc Silty clay
Sse Sand, slit, clay
Figure 35. Correlation chart of box and gravity cores from the continental slope northwest of Point Sur, California. Textural nomenclature from Shepard (1954).

cores between 350 to 750 m. An irregular erosional contact approx
imately 20 em beneath the surface separates the glauconitic sand from
Miocene nonglauconitic, silty sand in GC-1 and BC-2.
A silty sand that grades into sandy, clayey silt down slope is
present in the upper 20 to 60 em of cores between 690 and 1085 m. A
strong correlation of that layer can be made between cores from 832 to
1020 m, based on similar carbonate content and juxtaposition of the
layer to an irregular contact with silty clay or clayey silt already
discussed in the Carbonate Content Correlation section. Correlation of
the uppermost clayey, sandy silt and silty s~nd of GC-3 with the rela
tively coarse material in cores between 690 and 785 m is uncertain.
Laminated sediments in GC-3 and GC-5 at 78 em and 75 em down core,
respectively, appear to correlate. Both are at approximately the same
depth and are located 10 to 15 em above the 12,500 year BP datum.
Planktonic foraminifers in GC-3 su~gest a 10,500 years BP age for the
laminated zone.
A questionable correlation of a sandy, clayey silt interval 30 to
35 em down core, below a clayey silt, is made in BC-9, BC-10, and GC-8.
The interval in BC-10 has a 14c age of 3,175 yr BP. Another question
able correlation between a )70 em thick, clayey silt and underlying
silty clay is made in GC-5, GC-8, and GC-9. The boundary appears to be
time-transgressive, becoming younger with distance from shore.
Clay Composition. A change in the clay mineral assemblage on the
slope northwest of Point Sur has occurred with time. The assemblage
displays a decrease in the amount of smectite, an increase in the amount
76

of illite, and an increase in the amount of chlorite + koalinite
relative to surficial sediments of the same core (see Table 5). The
change may represent a change in provenance of fine grained material
from the late Pleistocene to the Holocene. With a lower sea level
during the late Pleistocene glacial interval, sediment carried by the
Sacramento and San Joaquin river systems could have bypassed San
Francisco Bay and the exposed shelf and debouched directly into coastal
waters. Clays emanating from the San Francisco Bay have a lower
percentage of smectite (see Figure 33). The suspended sediment from
this source may have been entrained in the California Current and
transported south, lowering the smectite percentage of the assemblages
deposited off Point Sur during the late Pleistocene. As sea level rose
and flooded San Francisco Bay, beginning 10,000-11,000 years ago, much
of the clay in the rivers entering the bay was impounded (Atwater and
others, 1977). The Russian River then became the dominant source of
clays in Province 2 during the Holocene {Griggs and Rein, 1980).
Sedimentation Rates
Rates Derived From 14c Data
The 14c dates in excess of 35,000 years BP in GC-1 and BC-2 are
from a glauconite-rich, mud-poor layer that contains a high percentage
of transported and broken foraminifers (Kristin McDougall, written
commun., 1983). These attributes suggest erosion, nondeposition, or
extremely low sedimentation rates on the slope between 390 and 505 m
of water.
77

An average accumulation rate of 2.6 cm/ky is derived for the
interval between 14-16 em (2,525 yr BP) and 34-36 em (10,330 yr BP) in
BC-7. The two samples submitted for 14c ages are separated by a sharp
irregular contact. The amount of bioturbation and preserved burrow
structures, identified on X-radiographs, are different in the sediments
above and below the contact and may be the result of different thixo
tropic response of the sediments to biogenic disturbances (Edwards, in
press) or to a change in the type and rate of sedimentation. The change
in sediment texture at this sharp, irregular contact along with the
change in burrow recognizability and lack of significant burrowing
across the boundary suggests either erosion or a period of nondeposition
followed by a change in the texture of sedimentation, or the base of a
fluidal sediment gravity deposit. The sinking of heavier into lighter
sediment resulted in load structures on the irregular contact. In
either case, the contact marks an interval of discontinuous sedimen
tation. However, because the irregular contact separating the two
samples is present in all cores between 832 and 1020 m, the accumulation
rate of 2.6 cm/ky is representative for the time interval between 10,000
and 2,500 years between those depths. This value is in close agreement
with a hemipelagic sedimentation rate of approximately 2.0 cm/ky calcu
lated from a water column total particulate flux value of 150 mg/m2/day
(assuming an average sediment density of 2.7 g/cm3 ) measured in 900 m of
water west of Point Sur (Martin and Knauer, 1983). This particulate
flux value does not appear to be anomalous for the Point Sur margin,
because similar values have been reported at sites off northern
78

California as well (Fischer and others, 1983).
An average accumulation rate of 16.1 cm/ky is derived for the
interval between 14-16 em (1,930 years BP) and 32-34 em (3,175 years BP)
in BC-10. The two samples are separated by 20 em of bioturbated sed
iment with a gradational change between the lower sandy, clayey silt and
the upper clayey silt. The gradational change in textural type between
the two dated intervals suggests continuous sedimentation. The rate of
16.1 cm/ky is therefore considered to be a representive sedimentation
rate during the last 3,000 years for the slope at 1200 m off Point Sur,
California.
The 16.1 cm/ky value derived from 14c differs by an order of
magnitude from the particulate flux derived rate (2.0 cm/ky), but it
is close to some of the rates calculated from biostratigraphically
identified intervals (see s~ction on biostratigraphically derived
sedimentation rates). It is also very close to a 14.7 cm/ky rate
estimated from 14c dates in sediments from the continental slope off
northern California (Gardner and others, in press).
Rates Derived From Biostratigraphic Data
The correlation of gravity cores from the continental slope north
west of Point Sur with core Vl-80-P3 allows tentative age assignments
to be made on individual cores. From these age datum lines, sediment
accumulation rates for 0 to 12,500 and 12,500 to 15,000 years BP have
been calculated. Three features are readily apparent after analyzing
the data in Table 7. First, the accumulation rate for the 12,500 to
15,000 year BP interval is greater than the rate for the 0 to 12,500
79

year BP interval. The higher sediment accumulation rates from 12,500 to
15,000 years BP, particularly evident in the deeper cores, have also
been observed off southern California where accumulation was 2 to 10
times greater during the colder period from 12,000 to 17,000 years BP
than during the Holocene (Gorsline and Prensky, 1975). Off the Russian
River, accumulation rates increased from 14.4 cm/ky during 0 to 11,200
years BP to 27.9 cm/ky between 11,200 and 14,800 years BP (Gardner and
others, in press) Second, the accumulation rate during the 12,500 to
15,000 year BP interval increases with distance from shore, possibly a
shadow effect of the California Undercurrent. Third, the accumulation
rate during the 0 to 12,500 year BP interval displays a slight decrease
with distance from shore.
Table 7.-- The biostratigraphically derived sediment accumulation
rates (cm/ky) in gravity cores from the upper continental slope
northwest of Point Sur, California.
Gravity Cores
Age Intervals GC-3 GC-4 GC-5 GC-8 GC-9 Depth in Core (832 m) (862 m) (983 m) (1277 m) (1420 m)
(ky)
0-12.5 7 10 8 7 4
12.5-15 10 14 15 20 31
The discrepancy between the biostratigraphic accumulation rate of
approximately 7 cm/ky for the last 12,500 years and the 14c accumulation
rate of 16.1 cm/ky for the last 3,000 years at approximately the same
80

water depth is perplexing. Possible explanations include an increase in
the accumulation rate from early Holocene to late Holocene so the
average for the entire period is lower, the occurrence of a depositional
hiatus of several thousand years with resumption of sedimentation at the
higher rate, or the occurrence of a slide that removed several thousand
years of accumulated sediment and no change in sedimentation rate.
Evidence in support of a hiatus or a slide include: (1) a sharp,
irr~ular contact in cores between 832 and 1020 m, (2) a change in
texture and carbonate content across the contact, and (3) preferential
dissolution of planktonic foraminifers above but not below the contact.
If the sedimentation rate of 16 cm/ky is used to extrapolate back in
time in BC-7 from the 2,500 year BP 14c age of sed-iments 14-16 em down
core to the irregular contact 30 em down core, the approximate age of
the sediment immediately above the contact is 3,500 years BP. The age
of the slide or the duration of the hiatus can then be calculated. The
slide would have occurred approximately 3,500 years ago and removed
7,000 years of accumulated sediment. The hiatus, marked by the sharp,
irregular contact in BC-7, has a duration of approximately 7,000 years;
the duration is based on the separation of two 14c dates: the estimated
age above the contact is 3,500 years BP and the age below is 10,330
years BP. A more detailed 14c investigation is needed to confirm the
estimate. Additional support for a slide in preference to a hiatus may
be the lack of correlatable variation in abundance of planktonic
foraminiferal species in cores GC-6 and GC-7 with other gravity cores.
Those two cores may not have been in the area affected by the slide.
81

However, without high-resolution seismic reflection profiles, a positive
identification and location of the slide cannot be established. A
possible cause for the hiatus in cores between 830 and 1020 m was
sediment bypassing owing to shelf edge and upper slope turbulence
combined with an early Holocene lowering of the erosional- or
nondepositional-depositional regime boundary, presently located between
approximately 600 and 800 m. Curray (1965) noted that the rise in sea
level was so rapid during the interval from 18,000 to 7,000 years BP
that deposition of shelf facies (and shelf spillover) " ••• did not
commence until about 7,000 years ago or even later." In any event, the
data on hand are inconclusive and either a slide or a depositional
hiatus are possible.
82
CONCLUSIONS
1. Sediments of the upper slope northwest of Point Sur, California
display a down-slope decrease in mean grain size. A glauconitic sand
facies is present between 350 and 650 m. Below 650 m the sediment is
composed primarily of terrigenous material with a biogenic and authi
genic component.
2. A change from erosion or nondeposition to deposition occurs between
600 and 800 m indicated by: a change in texture through the transition
zone and location of. the mudline at 800 m, an increase in fine-sand-size
mica and siliceous microfossils, and the presence of surficial
glauconite.
3. Oxygen content affects the composition of surficial sand-size
sediment. Benthic foraminifers are at a minimum in the middle of the
OMZ, increasing up and down slope with increasing oxygen content.
Glauconite is concentrated at the upper edge of the OMZ, whereas fecal
pellets are concentrated at the lower edge.
4. Total organic carbon in surficial sediments appears to be controlled
more by sediment grain size than oxygen content. The greatest amount of
total organic carbon is at 1200 min the most clay-rich sediment. The
correlation coefficient for percent clay and weight percent total
organic carbon is 0.95. The correlation coefficient between oxygen
content and percent total organic carbon is 0.66.
5. Surficial clay minerals in water shallower than approximately 600 m
have a slightly different assemblage than those deeper than 600 m.
The shallower group has less smectite and more illite and chlorite plus
kaolinite than the deeper group. Possible reasons for the differing
assemblages include: physical sorting by size, different provenance, or
diagenetic loss of smectite during glauconitization of the substrate.
Diagenetic loss of smectite during glauconitization of the substrate
may be the major cause for the different assemblages.
6. The average late Pleistocene clay assemblage in cores 832 m and
deeper contain less smectite and more illite and chlorite plus kaolinite
than average surficial clays from the same cores. The change may rep
resent a change in provenance from the San Francisco Bay river system to
the Russian River when sea level rose, flooded the bay and impounded
much of the clay mineral load.
7. Biostratigraphic analyses of box and gravity cores indicate that a
Miocene-Holocene (?) unconformity of unknown origin is present in the
shallow subsurface at water depths between 390 and 505 m. Deeper cores
contain only Holocene and late Pleistocene sediments.
8. Biostratigraphic and lithostratigraphic correlations combined with
l4c analyses indicate that sediment accumulation rates during the late
Pleistocene increased with increasing water depth from 10 cm/ky at 832 m
to 31 cm/ky at 1400 m. Accumulation rates were also more rapid in the
late Pleistocene than during the Holocene (7 cm/ky for the Holocene and
10 cm/ky for the late Pleistocene at 832 m; 4 cm/ky for the Holocene and
31 cm/ky for the late Pleistocene at 1400 m).
9. A sharp, irregular contact in Holocene sediments is presently 20
to 30 em beneath the sediment-water interface in cores between 832 and
84

1020 m. The origin of the irregular contact is uncertain, but it may
be a slide surface upon which approximately a 7,00Q-year accumulation of
sediment was removed, or a depositional hiatus of a 7,000-year duration
resulting from a combination of sediment bypassing owing to shelf edge
and upper slope turbulence and an early Holocene lowering of the
erosional- or nondepositional-depositional regime boundary.
85

REFERENCES CITED
Atwater,. B. F., Redel, C. W., and Helley, E. J., 1977, Late Quaternary depositional history, Holocene sea-level changes, and vertical crustal movement, southern San Francisco Bay, California: U. s. Geological Survey Professional Paper 1014, 15 p.
Bandy, 0. L., 1960, The geologic significance of coiling ratios in the foraminifer Globigerina pachyderma (Ehrenberg): Journal of Paleontology, v. 34, no. 4, p. 671-681.
Bandy, 0. L., and Ingle, J. c., Jr., 1970, Neogene planktonic events and radiometric scale, California, in Bandy, 0. L., ed., Radiometric Dating and Paleontologic Zonation: Geological Society of America Special Publication 124, p. 131-172.
Baturin, G. N., 1978, Phosphorites: P. P. Shorshow Institute of Oceanology, Academy of Sciences of the U.S.S.R., Nauka Press, Moscow, 232 p. [English Translation].
------~ 1983, Some unique sedimentological and geochemical features of deposits in coastal upv.7elling regions, in Suess, E., and Thiede, J., eds., Coastal Upwelling: Its Sediment Record, Part B NATO Advanced Research Institute on Coastal Upwelling and Its Sediment Record, New York, Plenum Press, p. 11-27.
Berger, w. H., 1979, Preservation of Foraminifera, in Lipps, J. H., Berger, w. H., Buzas, M.A., Douglas, R. G., and Ross, c. A., eds., Foraminiferal Ecology and Paleocology: Society of Economic Paleontologists and Mineralogists Short Course No. 6, Houston, Texas, p. 105-155.
Berner, R. A., 1981, A new geochemical classification of sedimentary environments: Journal of Sedimentary Petrology, v. 51, no. 2~
P• 359-365.
Biscaye, P. E., 1965, Mineralogy and sediment of recent deep-sea clay in the Atlantic Ocean and adjacent seas and oceans: Geological Society of America Bulletin, v. 7, p. 803-832.
Blake, M. C., Campbell, R. H., Dibblee, T. w., Jr., Howell, D. G., Nilsen, T. H., Normark, w. R., Vedder, J. c., and Silver, E. A., 1978, Neogene basin formation in relation to plate-tectonic evolution of the San Andreas fault system, California: American Association of Petroleum Geologists Bulletin, v. 62, p. 344-372.
Bouma, A. H., 1969, Methods for the Study of Sedimentary Structures: New York, John Wiley, 458 P•

Broenkow, w. w., and Greene, Nancy, 1981, Oceanographic results during VERTEX particle interceptor trap experiment, 17 August to 8 September 1980: Moss Landing Marine Laboratories Technical Publication 81-1, 109 p.
Broenkow, w. w., and Smithie, w. M., Jr., 1978, Surface circulation and replacement of water in the Monterey Bay: Estuarine and Coastal Marine Science, v. 6, p. 583-603.
Burnett, w. C., 1977, Geochemistry and origin of phosphorite deposits off Peru and Chile: Geological Society of America Bulletin, v. 88, P• 813-823.
Calvert, s. E., 1964, Factors affecting distribution of laminated diatomaceous sediments in the Gulf of California: American Association of Petroleum Geologists Memoir 3, p. 311-330.
Calvert, s. E., ang Price, N. B., 1971, Recent.Sediments of the South West African shelf, in Delany, F. M., ed., The Geology of east Atlantic continental-margins: London Institute of Geological Science, Report Number 70/16, p. 175-185.
Chesterman, c. w., 1952, Descriptive petrology of rocks dredged off the coast of cegtral California: California Academy of Science Proceedings, 4t Series, v. 27, p. 359-374.
Churgin, J., and Halminski, S. J., eds., 1974, Key to oceanographic records documentation No. 2: Temperature, salinity, oxygen, and phosphate in water off United States, Volume III Eastern North Pacific: Washington D. C., National Oceanographic Data Center, 260 P•
Codispoti, L.A., 1983, On nutrient variability and sediments in upwelling regions, in Suess, E., and Thiede, J., Coastal Upwelling: Its Sediment Record~Part A: NATO Advanced Research Institute on Coastal Upwelling and Its Sediment Record, New York, Plenum Press, p. 125-145.
Coulometrics Incorporated, 1979, Instruction Manual: Wheat Ridge, Colorado, Coulometrics Inc.
Curray, J. R., 1965, Late Quaternary history, continental shelves of the United States, in, Wright, H. E., and Frey, D. G., eds., The Quaternary of the United States: The International Association for Quaternary Research, Princeton University Press, p. 723-735.
1966, Geologic structure on the continental margin, from ------~ subbottom profiles, northern and central California, in Bailey,
E. H., ed., Geology of Northern California: California Division of Mines and Geology Bulletin 190, p. 337-342.
87

Demaison, G. J., 1981, Oil source bed deposition and occurrence<on active continental margins, in Douglas, R. G., Colburn, I. P., and Gorsline, G. s., eds., Deposition Systems of Active Continental Margin Basins: short course notes: Society of Economic Paleontologists and Mineralogists, Pacific Section, p. 157-165.
Demaison, G. J., and Moore, G. T., 1980, Anoxic environments and oil source bed genesis: Organic Geochemistry, v. 2, p. 9-31.
Diester-Haass, Liselotte, 1978, Sediments as indicators of upwelling, in Boje, R. and Tomczak, M., eds.: Upwelling Ecosystems, New York, Springer-Verlag, p. 261-281.
Doyle, L. J., Cleary, w. J., and Pilkey, 0. H., 1968, Mica: its use in determining shelf-depositional regimes: Marine Geology, v. 6, P• 381-389.
Drever, J. I., 1973, The preparation of oriented clay mineral specimens for X-ray diffraction analysis by a filter-membrane peel technique: American Mineralogist, v. 58, p. 553-554.
Edwards, B. D., [in press], Bioturbation in a dysaerobic, bathyal basin: California Borderland, in Curran, H. A., ed., Biogenic structures: their use in interpreting depositional environments: Society of Economic Paleontologists and Mineralogists Special Publication.
Ericson, D. B., 1959, Coiling direction of Globigerina pachyderma as a climate index: Science, v. 130, no. 3369, p. 219-220.
Fischer, A. G., and Arthur, M. A., 1977, Secular variation in the pelagic realm, in Cook, H. E., and Enos, Paul, eds., Deep-Water Carbonate Environments: Society of Economic Paleotologists and Mineralogists Special Publication No. 25, p. 19-50.
Fischer, K., Dymond, J., Moser, C., Murray, D., and Mathern, A., 1983, Seasonal variation in particulate flux in an offshore area adjacent to coastal upwelling, in Suess, E., and Thiede, J., Coastal Upwelling: Its Sedimen~Record, Part A NATO Advanced Research Institute on Coastal Upwelling and Its Sediment Record, New York, Plenum Press, p. 209-224.
Folk, R. L., 1974, Petrology of Sedimentary Rocks: Austin, Texas, Hemphill Publishing Company, 182 p.
Galliher, E. w., 1935, Glauconite genesis: Geological Society of America Bulletin, v. 46, p. 1351-1366.
88

Gardner, J. v., Heusser, L. E., Quinterno, P. J., Stone, s. M.: Barron, J. A., and Poore, R. z., [in press], Clear Lake record vs the adjacent marine record: a correlation of their past 20,000 years of paleoclimatic and paleoceanographic responses.
Gibbs, R. J., 1965, Error due to segregation in quantitative clay mineral X-ray diffraction mounting techniques: The American Mineralogist, v. 50, p. 741-751.
1977, Clay mineral segregation in the marine environment: --~-Journal of Sedimentary Petrology, v. 47, no. 1, p. 237-243.
Gorsline, D. S., Drake, D. E., and Barnes, P. w., 1968, Holocene sedimentation in Tanner Basin, California Continental Borderland: Geological Society of American Bulletin, v. 79, p. 659-674.
Gorsline, D. s., and Prensky, s. E., 1975, Paleoclimatic inferences for late Pleistocene and Holocene from California Continental Borderland basin~ sediments, in Suggate, R. P., and Cresswell, M. M., eds., Quaternary Studies: Royal Society of New Zealand Bulletin 13, p. 147-154.
Greene, H. G., 1977, Geology of the Monterey Bay region: u.s. Geological Survey Open-File Report 77-718, 347 p.
Griggs, G. B., and Rein, J. R., 1980, Sources, dispersal, and clay mineral composition of fine-grained sediment off central and northern California: Journal of Geology, v. 88, p. 541-566.
Gross, M.G., Carey, A. G., Jr., Fowler, G. A., and Kulm, L. D., 1972, Distribution of organic carbon in surface sediments, Northeast Pacific Ocean, chap. 12 in Pruter, A. T., and Alverson, D. 1., eds., The Columbia River~stuary and Adjacent Ocean Waters: Seattle, University of Washington Press, p. 254-264.
Halliwell, G. R., Williams, R. G., Vierra, K. c., Mooers, c. N. K., and Pytlowany, P. J., 1980, Ocean currents, chap. 8, in Williams, R. G., Reeves, R. W., Godshall, F. A., Fehler, S. w.-:-Pytlowany, P. J., Halliwell, G. R., Vierra, K. c., Mooers, c. K. N., Earle, M. D., and Bush, K., eds., A climatology and oceanographic analysis of the California Pacific outer continental shelf region: National Oceanic and Atmospheric Administration, Final Report to the Bureau of Land Management u.s. Department of Interior, p.4-1--4-117.
Heezen, B. c., and Hollister, c. D., 1971, The Face of the Deep: New York, Oxford University Press, 659 p.
89

Hein, J. R., Allwardt, A. 0., and Griggs, G. B., 1974, The occurrence of glauconite in Monterey Bay, California, diversity, origins and sedimentary environmental significance: Journal of Sedimentary Petrology, v. 44, no. 2, p. 562-571.
Hein, J. R., Scholl, D. w., and Gutmacher, C. E., 1976, Neogene clay minerals of the far NW Pacific and southern Bering Sea, in Bailey, s. w., ed., Proceedings of International Clay Conference-,-1975: Mexico City, p. 71-80.
Hickey, B. M., 1979, The California Current System- hypothesis and facts, in Angel, M. V., and O'Brien, James, eds.: Progress in Oceanography, v. 8, p. 191-279.
Howell, D. G., Crouch, K. J., Greene, H. G., McCulloch, D. F., and Vedder, J. G., 1980, Basin development along the late Mesozoic and Cenozoic California margin; a plate tectonic margin of subduction, oblique subduction and transform tectonics: International Association of Sedimentology Special Publication 4, p. 43-62.
Ingle, J. c., Jr., 1967, Foraminifera biofacies and Miocene-Pliocene boundary in southern California: Bulletin of American Paleontology, v. 52, no. 236, p. 217-394.
1973a, Neogene foraminifera from the northeastern Pacific Ocean, ------Leg 18, DSDP: Deep Sea Drilling Project Initial Reports, v. 18, P• 517-567.
_______ 1973b, Summary comments on Neogene biostratigraphy, physical stratigraphy, and paleo-oceanography in the marginal northeastern Pacific Ocean: Deep Sea Drilling Project Initial R~ports, v. 18, P• 949-960.
Jones, R. w., 1983, Organic matter near the shelf-slope boundary, in Stanley, D. J., and Moore, G. T., eds., The Shelfbreak: Critical Interface on Continental Margins: Society of Economic Paleontologists and Mineralogists Special Publication 33, p. 391-405.
Keller, Gerta, 1978, Late Neogene planktonic foraminiferal biostratigraphy and paleoceanography of the northeastern Pacific: evidence from DSDP sites 173 and 310 at the North Pacific front: Journal of Foraminiferal Research, v. 8, p. 332-349.
Keller, G. H., Lambert, D. N., and Bennett, R. H., 1979, Geotechnical properties of continental slope deposits--Cape Hatteras to Hydrographer Canyon, in Doyle, L. J., and Pikley, 0. H., eds., Geology of Continenta~Slopes: Society of Economic Paleontologists and Mineralogists Special Publication No. 27, p. 131-151.
90

Knebel, H. J., Conomos, T. J., and Commeau, J. A., 1977, Clay-mineral variability in the suspended sediments of the San Francisco Bay System, California: Journal of Sedimentary Petrology, v. 47, no. 1, p. 229-236.
Kolpack, R. L., and Bell, s. A., 1968, Gasometric determination of carbon in sediments by hydroxine absorption: Journal of Sedimentary Petrology, v. 38, p. 617-620.
Krissek, L. A., Scheidegger, K. F., and Kulm, L. D., 1980, Surficial sediments of the Peru-Chile continental margin and Nazca Plate: Geological Society of America Bulletin, v. 91, p. 321-331.
Manheim, Frank, Rowe, G. T., and Jipa, Dan, 1975, Marine phosphorite formation off Peru: Journal of Sedimentary Petrology, v. 45, no. 1, p. 243-251.
Martin, J. H., and Knauer, G. A., 1983, Vertex: Manganese transport with Caco3 : Deep Sea Research, v. 30, no. 4A, p. 411-425.
McCulloch, D. S., Greene, H. G., Heston, K. s., and Rubin, D. M., 1980, A summary of the geology and geologic hazards in proposed lease sale 53, central California outer continental shelf: u.s. Geological Survey Open-File Report 80-1095, 76 p.
McRae, s. G., 1972, Glauconite: Earth Science Reviews, v. 8, p. 397-440.
Mullins, H. T., and Rasch, R. F., 1981, Phosphorites offshore of Point Sur and Cape San Martin, California [abs.]: Geological Society of America Abstracts with Program, v. 13, p. 68.
Newton, J. G., Pilkey, o. H., and Blanton, J. o., 1971, An oceanographic atlas of the Carolina continental margin: Raleigh, North Carolina Department of Conservation and Development Publication, 57 p.
Odin, G. s., and Matter, Albert, 1981, De glauconiarum origine: Sedimentology, v. 28, p. 611-641.
Odin, G. s., and Stephan, J. F., 1982, The occurrence of deep water glaucony from the eastern Pacific: the result of in situ genesis or subsidence?: Deep Sea Drilling Project Initial Reports, v. 66, P• 419-428.
Pirie, D. M., Murphy, M. J., and Edmiston, J. R., 1975, California nearshore surface currents: Shore and Beach, October, 1975, p. 23-34.
91

Rhoads, D. c., and Morse, J. w., 1971, Evolutionary and ecologic significance of oxygen-deficient marine basins: Lethaia, v. 4, p. 413-428.
Richards., F. A., 1957, Oxygen in the oceans: Geological Society of America Memoir 67, v. 1, p. 185-238.
Schwartzlose, R. A., and Reid, J. L., 1972, Nearshore circulation in the California Current: California Cooperative Oceanic Fisheries Investigations Reports, v. 16, p. 57-65.
Shackleton, N.J., and Opdyke, N.D., 1973, Oxygen isotope and paleomagnetic stratigraphy of equatorial Pacific core V28-238: oxygen isotope temperatures and ice volumes on a 105 and 106 year scale: Journal of Quaternary Research, v. 3, no. 1, p. 39-55.
_______ 1976, Oxygen-isotope and paleomagnetic stratigraphy of Pacific core V28-239 late Pliocene to latest Pleistocene, in Cline, R. M., and Hayes, J.D., eds., Investigation of late Quaternary paleoceanography and paleoclimatology: Geological Society of America Memoir 145, p. 449-464.
Sheldon, R. P., 1980, Episodicity of phosphate deposition and deep ocean circulation- a hypothesis, in Bentor, Y. K., ed., Marine Phosphorites - Geochemistry,IOccurrence, Genesis: Society of Economic Paleontologists and Mineralogists Special Publication, No. 29, p. 239-247.
Shepard, F. P., 1954, Nomenclature based on sand-silt-clay ratios: Journal of Sedimentary Petrology, v. 24, p. 151-158.
Silver, E. A., Curray, J. R., and Cooper, A. K., 1971, Tectonic development of the continental margin off central California, in Lipps, J. H., and Moores, E. M., eds., Geologic Guide to the Northern Coast Ranges Point Reyes Region, California: Geological Society of Sacramento, Annual Field Trip Guidebook, 1971, p. 1-10.
Stanley, D. J., and Wear, c. M., 1978, The "mudline": an erosionaldepositional boundary on the upper continental slope: Marine Geology, v. 28, p. M19-M29.
Stanley, D. J., Addy, s. K., and Behrens, E. w., 1983, The mudline: variability of its position relative to shelfbreak, in Stanley, D. J., and Moore, G. T., eds., The Shelfbreak: Critical Interface on Continental Margins: Society of Economic Paleontologists and Mineralogists Special Publication No. 33, p. 279-298.
92

Summerhayes, c. P., 1983, Sedimentation of organic matter in upwelling regimes, in Suess, E., and Thiede, J., eds., Coastal Upwelling: Its Sediment Record, Part B.: NATO Advanced Research Institute on Coastal Upwelling and Its Sediment Record, New York, Plenum Press, P• 29-71.
Suess, E., and Thiede, J., 1983, eds., Coastal Upwelling: Its Sediment Record, NATO Advanced Research Institute on Coastal Upwelling and Its Sediment Record, New York, Plenum Press, Part A, 604 p.; Part B, 613 P•
Sverdrup, H. U., Johnson, M. W., and Fleming, R. H., 1952, The Oceans: their physics, chemistry, and general biology: New York, PrenticeHall, 1087 P•
Thompson, J. B., 1982, Low oxygen macroinvertebrate assemblages: central California continental slope [C}b.S •. ] : Long Beach, California, Western Society of Naturalists Annual Meeting, December 27-30, 1982.
1983, Analysis of macrofauna! assemblages across the oxygen ----,-minimum zone offshore central California: Sacramento, California, California State University Sacramento, Masters Thesis, 77 p.
Thompson, J. B., Mullins, H. T., Newton, c. R., and Vercoutere, T. L., (in prep.), Alternative biofacies model for low-oxygen communities.
Thompson, P. R., and Saito, T., 1974, Pacific Pleistocene sediments: planktonic foraminifera dissolution cycles and geochronology: Geology, v. 2, p. 333-335.
Traganza, E. D., and Conrad, J. c., 1981, Satellite observations of a cyclonic upwelling system and giant plume in the California Current, in, Richards, F. A., ed., Coastal Upwelling: Coastal and Estuarine Sciences 1, American Geophysical Union, p. 228-241.
Trask, P. D., 1932, Origin and Environment of Source Sediments of Petroleum: Houston, Gulf Publishing Company, 323 p.
Veeh, H. H., uranium shelf:
Calvert, s. E., and Price, N. B., 1974, Accumulation of in sediments and phosphorites on the southwest African Marine Chemistry, v. 2, p. 189-202.
Wickham, J. B., 1975, Observations of the California Countercurrent: Journal Marine Research, v. 33, no. 3, p. 325-340.
93

94
APPENDIX A
Description of Gravity Cores

Texture Sediment
Structure
0 s
E v ~ w 25 sS a: 0 0
~ -----::I: 50 1-
Scs a. - -w c cs
75 --Scs
100
clay
GRAVITY CORE 1 (505 m) .
GLAUCONITE SAND, mica- and foraminifer-bearing, olive black (SY 2/1); homogeneous; contains irregular bored PHOSPHORITE PEBBLES and bivalve shell fragments. sharp, irregular contact
SILTY SAND, olive gray (SY 3/2); convoluted laminae; few burrows, sharp walled, infilled with laminated micaceous CLAYEY SILT.
SANDY, CLAYEY SILT, olive gray; faintly laminated.
diatomaceous CLAYEY SILT, olive gray; laminated.
SANDY, CLAYEY SILT, olive gray; faintly laminated.
~ convoluted
Sse sand silt clay sS silty sand D homogeneous
sc silty clay s sand
[ill] intensely bioturbated
cs clayey silt cS clayey sand
Sc sandy cia y w moderately bio•urbated s silt
Ss sandy silt c clay OJ faintly bioturbated
silt ~ faintly laminated -
iii laminated
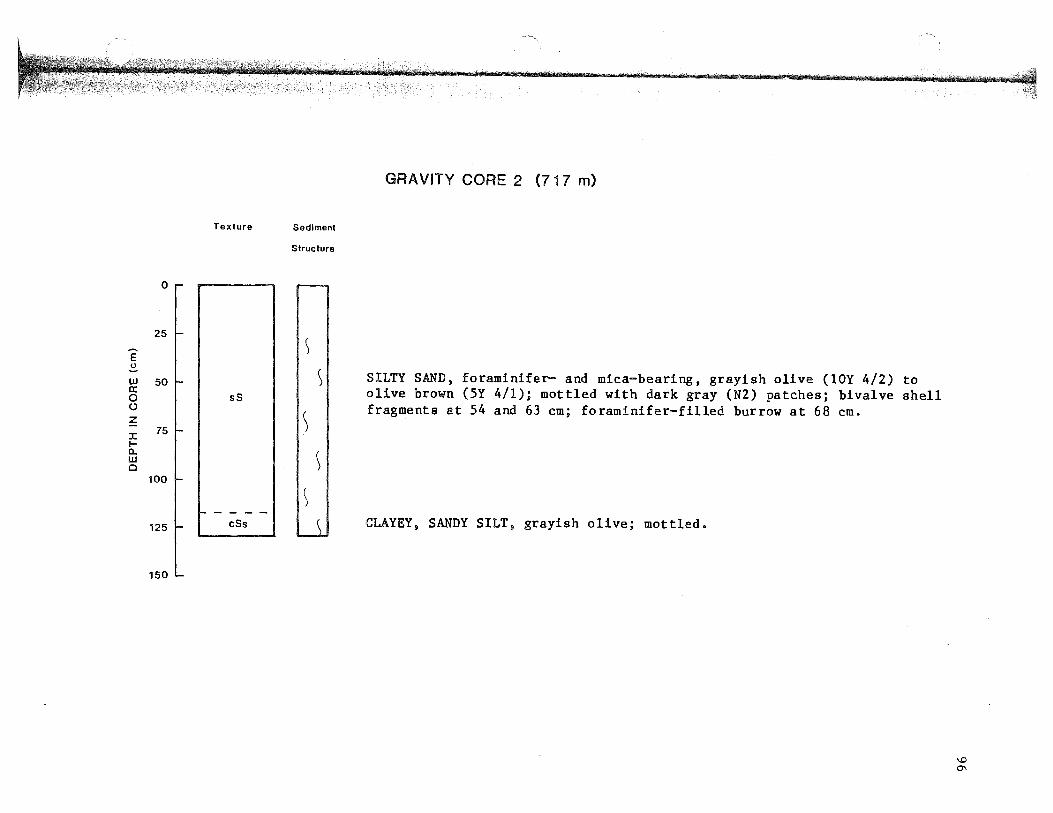
0
25
E ~ w 0:
50
0 ()
~ :I: 75 1-a. w 0
100
125
150
Texture
sS
r-----cSs
Sediment
Structure
)
)
)
~
~
GRAVITY CORE 2 (71 7 m)
SILTY SAND, foraminifer- and mica-bearing, grayish olive (lOY 4/2) to olive brown (5Y 4/1); mottled with dark gray (N2) patches; bivalve shell fragments at 54 and 63 em; foraminifer-filled burrow at 68 em.
CLAYEY, SANDY SILT, grayish olive; mottled.

Texture
0 cSs
t-- - - -ss
25 1- - - - -
cSs
50 Scs --- - -
75 sc
E -- - -.:!. sS UJ 100 a: 0
- - - -cSs
- - - -()
~ 125 Ss :I: 1-Q. UJ 0
150
J-- -Scs - - - -cs
- - - -cSs
175 -- - - -cs
t-- - - -200
csS
225
Sediment
Structure
)
) )
s s
GRAVITY CORE 3 (832 m)
CLAYEY, SANDY SILT, gray~sh olive (lOY 4/2); homogeneous. SILTY SAND, mica-bearing, grayish olive.
CLAYEY, SANDY SILT, grayish olive; bioturbated and mottled; bivalve shell fragment at 40 em. sharp irregular contact SANDY, CLAYEY SILT, mica-bearing, light olive gray (5Y 5/2); faintly laminated; bivalve shell fragment at 60 em. SILTY CLAY, foraminifer rich silty clay at 80 to 83 em; laminated.
SILTY SAND; homogeneous CLAYEY, SANDY SILT, foraminifer-bearing, dusky yellow green (5GY 5/2); homogeneous to mottled.
SANDY SILT, wood fragment at 123 em.
SANDY, CLAYEY SILT; mottled. CLAYEY SILT, light olive gray; mottled.
CLAYEY, SANDY SILT; mottled; wood fragment at 170 em.
CLAYEY SILTY; mottled to homogeneous.
CLAYEY, SILTY SAND; homogeneous

Texture
0
cSs
25 cs
r--
50 sc
E 75 0 r-----w c: cs 0 () 100
~ 1-----
J: 1-a. 125 w 0 sc
150
1-----175 Scs
1-----
cs 200
--sc
225
Sediment
Structure
)) )\
)
) )
ruJ1.Q_ rM1J \)
)) s
ss ss
GRAVITY CORE 4 (862 m)
CLAYEY, SANDY SILT, mica-bearing, olive gray (SY 3/2); homogeneous, open burrow (2 em in diameter) at 10 em. sharp, irregular contact CLAYEY SILT, mica-bearing, grayish olive (lOY 4/2); bioturbated with distinct infilled burrows (0.3 em across).
SILTY CLAY, foraminifer bearing, grayish olive; mottled with distinct infilled burrows (<S em across); bivalve shell at 75 em.
CLAYEY SILT, grayish olive, convoluted laminae.
SILTY CLAY, foraminifer-bearing, grayish olive; bioturbated; wood and shell fragments at 125 em and bivalve shell at 144 em.
SANDY, CLAYEY SILT, grayish olive, bioturbated.
CLAYEY SILT, grayish olive; mottled with greenish black (5GY 2/1) irregular laminae.
SILTY CLAY, grayish olive; mottled; wood fragment at 210 em.
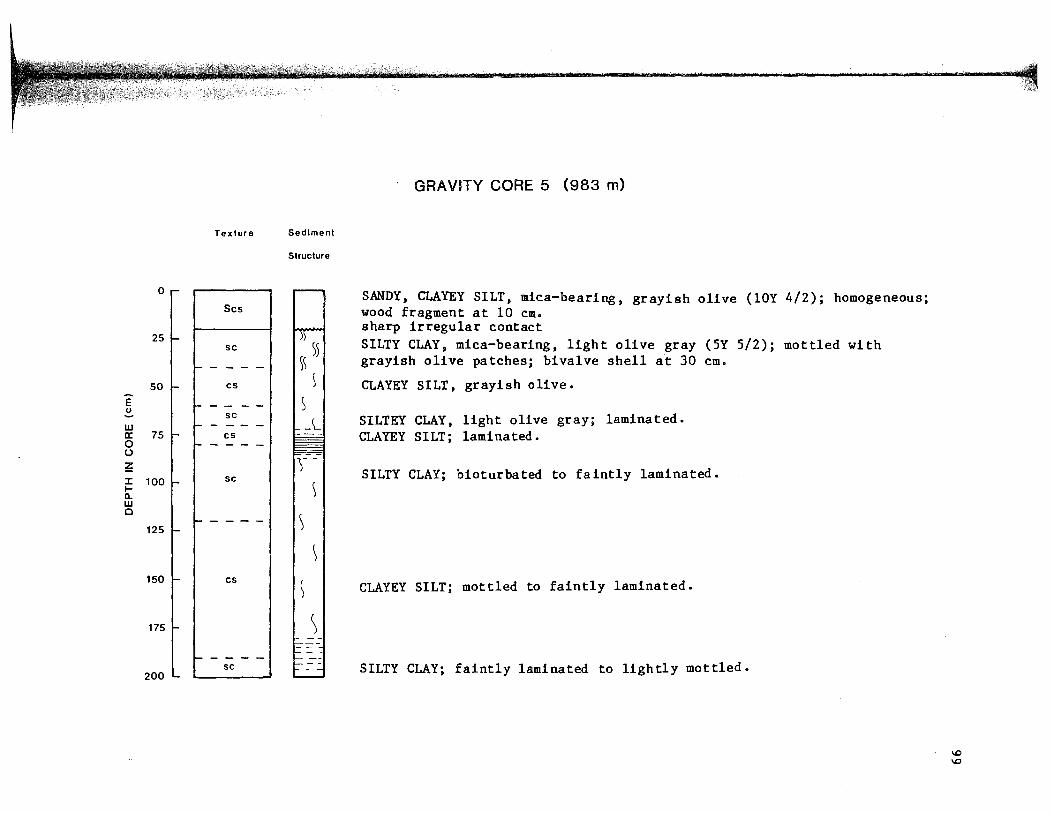
Texture
0
Scs
25 sc
1- -
50 cs
E 1--- - -0 sc w 1- - -- -a: 75 cs 0 1- - - - -(.J
~ J: 1-
100 sc
a. w 0
1-- -- -125
150 cs
175
1-----sc
200
Sediment
Structure
GRAVITY CORE 5 (983 m)
SANDY, CLAYEY SILT, mica-bearing, grayish olive (lOY 4/2); homogeneous; wood fragment at 10 em. sharp irregular contact
~ SILTY CLAY, mica-bearing, light olive gray (SY 5/2); mottled with )\ grayish olive patches; bivalve shell at 30 em.
) l CLAYEY SILT, grayish olive.
SILTEY CLAY, light olive gray; laminated. CLAYEY SILT; laminated.
SILTY CLAY; bioturbated to faintly laminated.
CLAYEY SILT; mottled to faintly laminated.
SILTY CLAY; faintly laminated to lightly mottled.
1.0 1.0

Texture
0
25
E 50 ~ w 0: 0 0 75 cs ~ J: t-a. 100 w 0
125
150
f-----sc
175
200
Sediment
Structure
)
)
~
\ ( I
( )
)
)
) )
)
GRAVITY CORE 6 (1072 m)
CLAYEY SILT, grayish olive (lOY 4/2); bioturbated; open burrow (1 em across) at 10 em down core; bivalve (?) shell at 61 em; rock fragment (0.4 em across) at 76 em down core; wood chip at 144 em.
SILTY CLAY, grayish olive; bioturbated.
1-' 0 0

0
25
E 50 ()
w a: 0 (.) 75 ~ :X: 1-0. 100 w 0
125
150
Texture Sediment
Structure
§ ~\
~) ~)
f( ))
\
cs
GRAVITY CORE 7 ( 1183 m)
CLAYEY SILT, grayish olive green (SGY 3/2) to grayish olive (lOY 4/2); bioturbated; unknown biogenic fragments((.S em across) at 12 and 16 em down core, bivalve shell fragment at 42 em; foraminifer-bearing layer (4 em thick) at 90 em.

Texture
0 cs
-----sc
25 -----Scs r-----sc r-----
50
75
E u
100 cs w a: 0 ()
~ 125
:X: r-D.. w 0 150
-----sc ------
175
cs
200
Sediment
Structure
))<;
m ))
)~
))
)~
)~
S\
GRAVITY CORE 8 (1277 m)
CLAYEY SILT, grayish olive (lOY 4/2); mottled with medium dark gray (N4) burrows (1 em across) at 6 and 10 em down core. SILTY CLAY, grayish olive; homogeneous. SANDY CLAYEY SILT, grayish olive; homogeneous. SILTY CLAY, grayish olive; homogeneous.
CLAYEY SILT, light olive gray (5Y 5/2) to grayish olive; bioturbated and mottled with dark gray (N4) patches; burrows (2 to 5 em across) at 70 and 77 em infilled with pelletal mud; shell fragments at 115 and 120 em.
SILTY CLAY, grayish olive; bioturbated.
CLAYEY SILT, grayish olive, bioturbated.
1-' 0 N
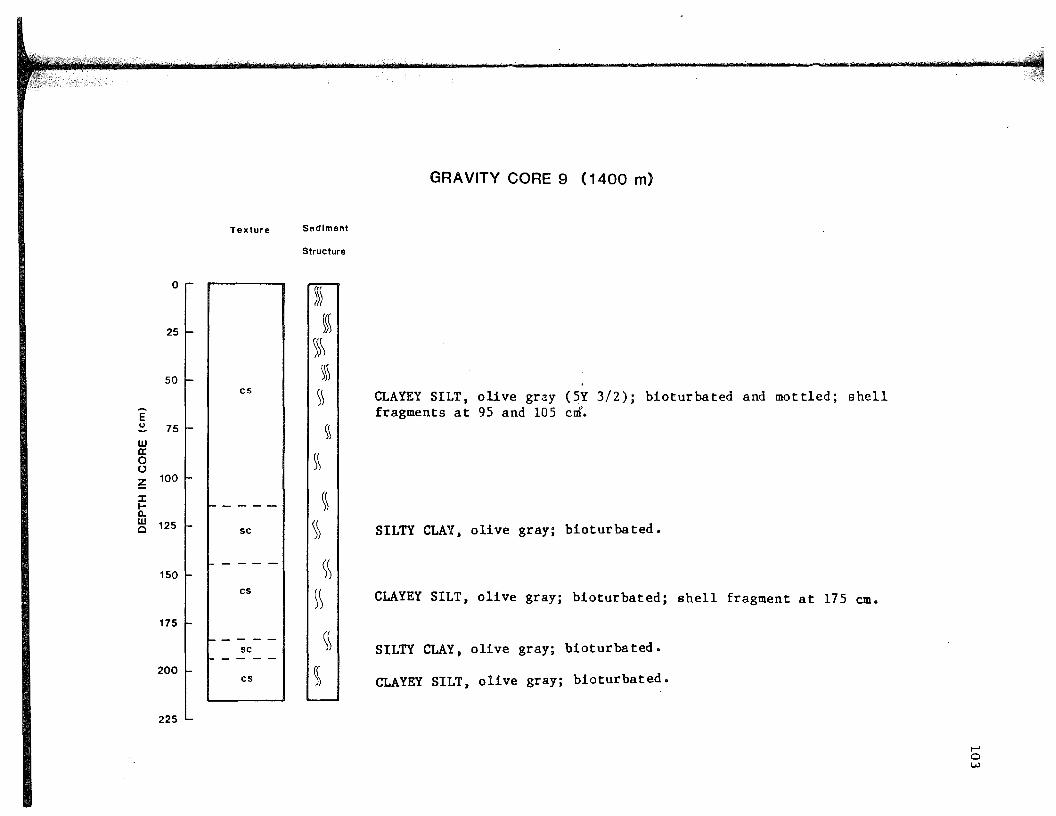
GRAVITY CORE 9 ( 1400 m)
Texture Sediment
Structure
0 )})
25 ~~~ ))\
50 )))
cs )) CLAYEY SILT, olive gray (5Y 3/2); bioturbated and mottled; shell fragments at 95 and 105 G
E em. 1.) 75 )\ -w a:
)\ 0 0
~ 100
J: ~\ 1- 1-----0.. w 125 \) SILTY CLAY, olive gray; bioturbated. 0 sc
150 ~) cs )) CLAYEY SILT, olive gray; bioturbated; shell fragment at 175 em.
175
1----- \~ SILTY CLAY, olive gray; bioturbated. sc 1-----
200 ~\ CLAYEY SILT, olive gray; bioturbated. cs
225
104
APPENDIX B
Grain Size in Gravity Core Sediments

Depth
ln c~re
GC-1 GC-2
Percent acavel. aand. silt. aod clay 1n gravity core aedllaents
(grv, gravel; end, ttand; alt, allt; ely, clay]
GC-3 GC-4 GC-5 GC-6 GC-7 GC-6 GC-9
(ca) 11rv •nJ •It ely and •It ely and sit ely and alt ely and slt ely and alt ely snd sit ely and a1t ely and alt ely
1S
2'i
15
55
b'i
75
85
95
lllj
115
125
135
14S
155
165
IH
IdS
195
205
215
6 8H
57 J I 12
28 51 20
42 41 17
26 51 2l
21 54 26
14 52 3.\
14 48 38
20 49 32
b] 2 3 10
68 23
6 7 24 10
64 24 12
65 25 10
66 24 11
49 36 16
52 34 ll
52 33 I 5
57 27 16
so 35 14
53 30 18
34 4 5 21
38 42 20
44 39 18
43 38 19
39 39 22
34 39 27
u 43 34
44 46
39 56
l1 42 41
44 40 17
34 45 21
JS 55 10
48 37 15
25 56 19
20 SO JO
l) 51 36
32 46 22
4 5 34 21
18 47 JS
44 35 21
48 3 I 21
37 36 27
33 44 22
21 54 25
56 16
12 52 36
48 so
45 s 1
8 45 47
12 42 46
54 42
20 46 34
12 46 42
40 56
9 44 47
43 53
39 57
44 52
JO 40 29
32 44 24
11 52 37
so 47
47 so
2 J 48 29
26 46 28
4 5 48
6 43 51
12 54 34
l) 46 41
11 44 46
11 48 41
4 5 51
42 ))
40 54
43 54
15 49 37
18 so 33
55 36
12 53 35
15 51 34
12 53 36
53 43
47 49
11 58 31
8 58 34
58 34
10 57 ))
10 56 14
12 56 32
11 59 30
I 3 60 27
14 52 33
14 52 33
12 56 32
14 56 30
8 51 41
60 32
56 39
53 41
41 56
1 'i 'iS 30
46 46
52 41
8 )5 36
10 'iS 12
10 so 39
11 49 41
11 'il 36
14 53 33
13 51 36
12 52 36
8 56 36
59 33
54 42
so 47
8 53 40
53 42
51 46
12 46 42
14 38 48
26 43 ll
14 41 45
1 3 46 41
12 4H 40
48 48
51 41
so 43
52 4 3
52 44
48 44
48 43
48 43
10 48 42
10 43 47
49 44
49 44
11 57 32
11 60 29
10 59 ll
58 39
62 14
60 18
60 38
56 39
11 62 27
61 )6
62 36
46 49
46 52
45 51
8 so 41
49 45
51 45
48 48
44 48
11 46 44
48 47
...... 0 U'l

APPENDIX C
Weight Percent Organic Carbon and Carbonate
in Gravity Cores
106

Depth
ln core
(ca)
1~
2~
3S
4~
5~
65
H
8~
9~
10~
ll5
125
135
145
155
16S
175
185
195
20~
215
CC-1
roc
0.56
1.92
3.02
2.19
2.85
3.18
4.41
4.17
3.79
3.48
2.46
2.43
2.18
2.58
2.12
2.25
2.08
1. 76
GC-2
1.05 2.67
.91 2.50
1.02 1.57
1.17 2.24
.85 3. 74
.94 2.57
.73 6.54
.85 7 .68
.86 7.18
.80 8.05
.83 4.59
1.04 5.41
1.05 4.07
Weight percent total organlc carbon and carbonate in gravity corea
GC-3
TOC
1.52
l.H
1.14
1.28
1.48
1.36
1. 76
1.59
1.47
1.01
2.61
2.29
2. 55
3.98
4.15
4.56
6.18
5.62
6.29
6.00
.95 6.26
.89 6. 26
.84 7.49
1.17
1.33
1.16
.94
.94
1.48
.67
5. 53
5.44
7.14
5.33
6.23
5.23
8.77
.70 9.06
.78 9.17
[toe. total organlc carbon
GC-4
TOC
1.49
1.37
l. 70
1.62
I. 74
1.69
1.71
1.62
1.82
1.36
2.18
2.16
5. 94
7.22
8.19
7 .41
6.08
6.88
6.61
6.00
1.77 6.74
1.75 5.71
1.71 6.81
1.85 7.16
1.77 6.89
1.85 6.97
1.19 8.26
.93 7.63
1.40 6.66
1.58 5.95
1.64 5.78
l.ll 2.72
GC-5
TOC
1.91
1.58
l. 72
1.38
1.88
1.95
1.71
1.80
3.77
2.86
5. 7 4
6. 3 5
6.67
7.03
7.16
6.76
1.74 7.24
1.96 4.61
1.54 5.24
1.23
1.48
1.89
l. 7 5
l. 25
1.37
1.33
5.68
5.33
6.05
6.86
7.01
5.n 5.88
co3 , carbonate 1
GC-6
TOC
2.33
2.46
2.35
2.14
2.14
2.02
1.93
1. 74
1.77
1.81
4.16
4.94
5.39
4.80
4.99
5.05
4.78
4.30
5.19
6.36
1.76 6.26
1.66 5.43
1.81 6.16
1.56 7.18
1.61 8.56
1.58 9.50
1.78 9.50
CC-7
TOC
2.47
2.54
2. 57
2.44
2.27
2.19
2.27
2.19
2 .as 2.01
7.03
6.87
7. 41
7.96
8.35
9.65
8.65
9.60
8.39
7.92
1.92 6.21
2.00 6.88
1.84 7.06
1.84 6.39
1.98 6.64
1.72 6.75
1.66 8.71
1.70 9.19
GC-8
TOC
2.2J
2.48
l. ~ 5
1.78
1.60
1.48
1.63
1.35
1.41
5.15
~.01
6.60
7.22
7.51
6.73
5.16
5.90
7.23
1.52 6.44
1.31 8.11
1.35 6.81
1.39 7.23
1.47 7.15
1.39 7.36
1.)0 7.19
1.52 6.32
1.47 6.32
GC-9
2.53 2.13
2.24 2.75
1.86 3.77
1.55 4.94
1.41 5.36
1 .4 7 3.61
1.36 3.18
l. 39 2.83
1.56 ).47
1.44 4.07
1.39 3.23
1.14 3.73
1.25 4.51
1.35
1.39
1.31
1.22
1.34
1.24
1.32
5.12
6.91
4.59
4.59
4.50
4.46
4.28
1.27 4.04

108
APPENDIX D
Description of Box Cores
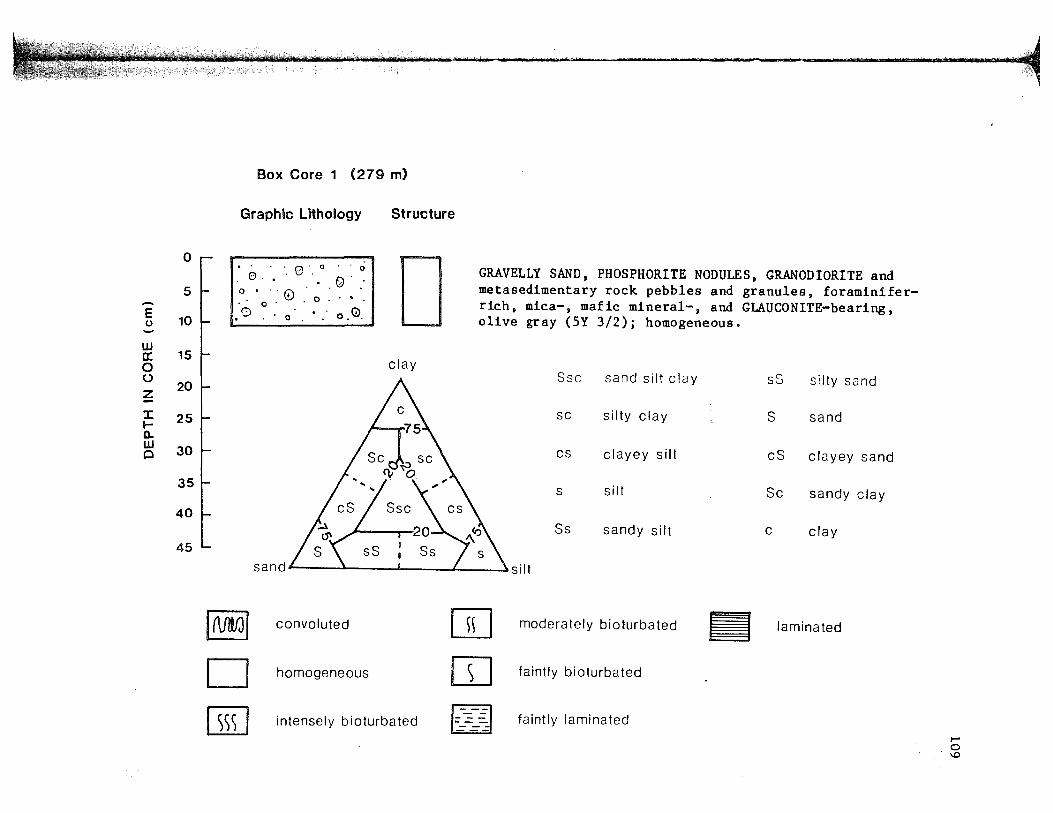
0
5
E 10 0
w a: 15 0 (.)
20 ~ J: 25 t-a. w 30 0
35
40
45
Box Core 1 (279 m)
Graphic Lithology Structure
. . . . 0. 0 .. 0 . o.. . ·. G .. 0. "f.\ . . . . . 0 . \V . 0 ..•.
0 .. o ..•. · o.G.
sand
~ convoluted
D homogeneous
D clay
[ill] intensely bioturbated
GRAVELLY SAND, PHOSPHORITE NODULES, GRANODIORITE and metasedimentary rock pebbles and granules, foraminiferrich, mica-, mafic mineral-, and GLAUCONITE-bearing, olive gray (SY 3/2); homogeneous.
Sse sand silt clay sS silty sand
sc silty clay s sand
cs clayey silt cS clayey sand
s si It Sc sandy clay
Ss sandy silt c clay
silt
w moderately bioturbated iii laminated
[I] faintly bioturbated
-ru faintly laminated t-' 0 1.0

0
5
E 10 0
w 0:: 15 0 (.)
20 ~ :::c 25 1-0.. w 30 0
35
40
45
Box Core 2 {390 m)
Graphic lithology Structure
G G
G ~Gr;J G S G G
0
sS
GLAUCONITE SAND, foraminifer-rich, mica- and mafic mineral- bearing, olive black (SY 4/1); homogeneous; metasedimentary pebble at 2 em, PHOSPHORITE and GRANODIORITE pebbles at 5 to 12 em.
sharp irregular contact
SILTY SAND, mica-, mafic mineral-, GLAUCONITE-, and foraminifer-bearing, olive gray (SY 3/2); convoluted to faintly laminated; mottled with greenish gray {SGY 6/1), silty sand and sand patches.
t-' t-' 0

0
5
E (J 10
w 0: 15 0 0
20 ~ :::c 25 1-Q. w 30 0
35
40
45
Box Core 3 (510 m)
Graphic lithology Structure
G
G
G
GRAVELLY GLAUCONITE SAND, PHOSPHORITE and GRANODIORITE pebbles and granules, mica-, mafic mineral-, and foraminifer-bearing, olive gray (SY 3/2); homogeneous.

0
5
E 10 u
w a: 15 0 (.)
~ 20
::c 1-
25 0.. w 30 0
35
40
45
Box Core 4 (59 3m)
Graphic Lithology Structure
G G G G G
e> G G G
G G G
s G G
G G
GLAUCONITE SAND, mica-, mafic-, and foraminifer-bearing, olive gray (SY 3/2) to brownish black (5YR 2/1); bioturbated to homogeneous; open burrow containing several gastopod and bivalve shells at 5 to 7 em down core; wood chips at 6 and 15 em; several burrows ( (0.2cm across) between 20 and 25 em.
t-' t-' N

0
5
E 10 u
LU a: 15 0 (.)
20 z :c 25 t-a. LU 30 0
35
40
45
Box Core 5 (690 m)
Graphic Lithology Structure
sS
5 I-- - -- --
s
SILTY SAND, mafic mineral-, GLAUCONITE-, and foraminifer-bearing, dark greenish gray (SGY 4/1); bioturbated; burrows (<O.l em across) in upper 6 em.
SAND, mica-, mafic mineral-, GLAUCONITE-, and foraminifer-bearing, dark greenish gray; homogeneous.

0
5
E 10 (J
UJ a: 15 0 0
20 z ::c 25 1-a. UJ 30 0
35
40
45
Box Core 6 (7'85 m)
Graphic lithology
sS 1--
cSs
1--- - - -
sS
Structure
5
s s
SILTY SAND, mica- and fecal pellet-bearing, light olive gray (SY 5/2); homogeneous.
CLAYEY SANDY SILT, mica- and foraminifer-bearing, light olive gray; bioturbated.
SILTY SAND, mica- and mafic mineral-bearing, light olive gray; bioturbated; burrows {<0.2 em across) at 14, 20 and 26 em.

0
5
E 10 ()
w a: 15 0 0
20 ~ J: 25 t-0. w 30 0
35
40
45
Box Core 7 (905 m)
Graphic Lithology Structure
cSs ))
sc
CLAYEY SANDY SILT, mica- and fecal pellet-bearing, grayish olive green (SGY 3/2); bioturbated and mottled with light olive gray (SY 5/2) patches of same material as below contact.
sharp irregular contact
SILTY CLAY, foraminifer-bearing, light olive gray; bioturbated and mottled with material from above contact.

0
5
E 10 0
w a: 15 0 0
20 ~ :::t: 25 1-a. w 30 0
35
40
45
Box Core 8 (1020 m)
Graphic Lithology
Scs
sc
Structure
))
)) SANDY CLAYEY SILT, mica-, fecal pellet-, and foraminifer-bearing, light olive gray (5Y 5/2); bioturbated.
sharp irregular contact SILTY CLAY, light olive gray; homogeneous.
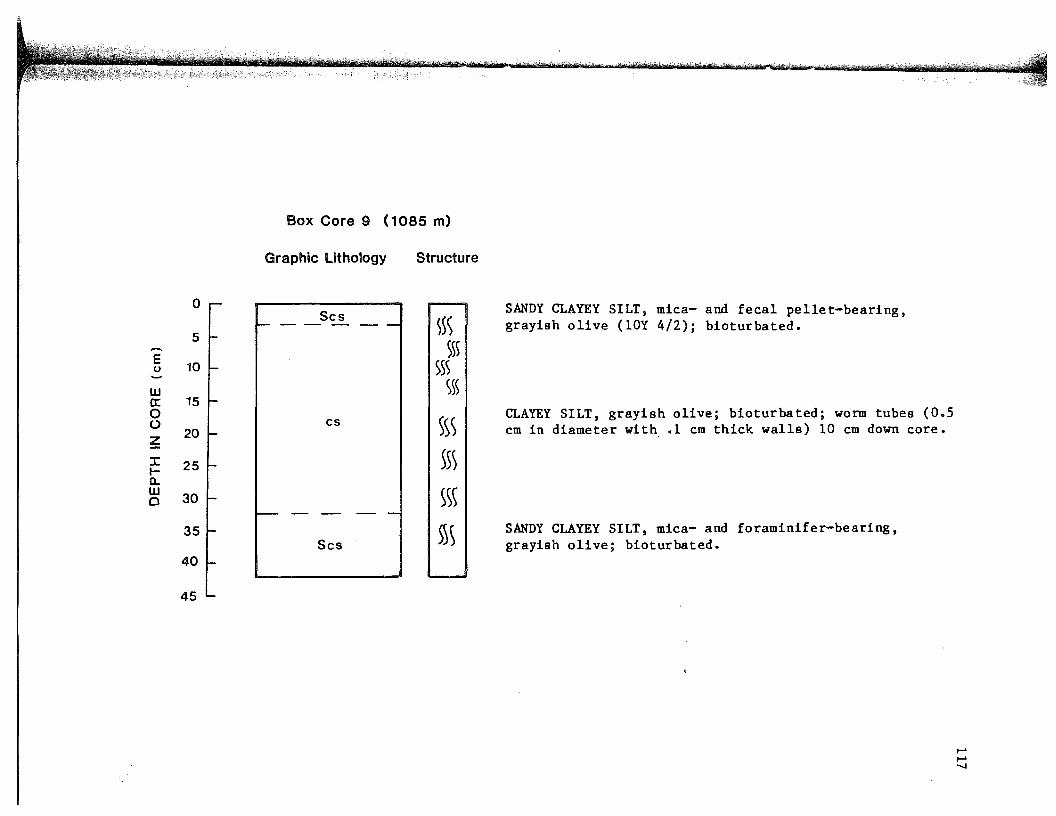
0
5
E (.) 10
w a: 15 0 ()
~ 20
J: 25 t-a. w 30 0
35
40
45
Box Core 9 ( 1085 m)
Graphic lithology Structure
Scs f------ ~~s s~~
sss )~)
cs sss ~5)
SS\ -- --Scs ~~
SANDY CLAYEY SILT, mica- and fecal pellet-bearing, grayish olive (lOY 4/2); bioturbated.
CLAYEY SILT, grayish olive; bioturbated; worm tubes (0.5 em in diameter with .1 em thick walls) 10 em down core.
SANDY CLAYEY SILT, mica- and foraminifer-bearing, grayish olive; bioturbated.

0
5
E 10 (,)
w a: 15 0 u
20 ~ J: 25 1-ll. w 30 0
35
40
45
Box Core 10 (1200 m)
Graphic lithology Structure
))~
)~~ cs )~
))
1------ )\
Scs
~ ~) cs
CLAYEY SILT, grayish olive (lOY 4/2); bioturbated; burrows ((0.2 em across) at 10 and 17 em; bivalve shell fragment at 15 em.
SANDY ~LAYEY SILT, mica- and foraminifer-bearing, grayish olive; bioturbated.
sharp irregular contact CLAYEY SILT, grayish olive; homogeneous.
1-' 1-' 00
119
APPENDIX E
Grain Size in Box Core Sediments

Percent gravel, sand, silt, and clay in box core sediments
[grv, gravel; and, sand; alt, silt; ely, clay]
Depth BC-1 BC-2 BC-3 BC-4 BC-5 BC-6 BC-7 BC-8 BC-9 BC-10
in Core
(ca) grv and slt ely grv snd slt ely snd slt ely and slt ely snd slt ely and slt ely and slt ely and slt ely ond slt ely snd slt ely
0 41 56 2 92 3 89 8 3 89 3 8 69 18 13 41 40 19 37 39 24 22 48 31 20 49 31 10 49 41
5 40 56 2 4 91 2 2 96 2 92 2 6 76 16 8 36 44 20 34 43 23 26 42 32 16 53 31 7 50 43
10 38 52 6 4 2 78 15 5 85 10 6 85 8 8 80 10 10 33 44 24 32 44 22 20 51 28 12 53 35 51 41
' 15 32 56 12 82 11 6 86 76 14 10 45 37 18 30 48 22 20 55 25 14 so 36 4 51 45
20 44 47 9 74 14 12 76 17 42 41 18 29 50 21 22 53 25 14 49 37 4 51 44
25 35 55 9 80 11 10 77 12 11 43 41 17 34 46 21 24 53 23 16 48 36 4 53 43
30 38 52 10 76 13 10 43 37 19 8 45 47 25 so 26 13 60 27 22 40 37
35 48 35 17 5 43 53 27 49 24 24 49 28 10 52 38
40 14 43 43 25 46 29 8 53 39
t-' N 0

APPENDIX F
Weight Percent Organic Carbon and Carbonate
in Box Cores
121

Depth BC-1 BC-2 BC-3
in core
(CIII) TOC TOC TOC
0 1.17 2.91 0.41 5.19 0.62
5 1.68 4.18 .45 5.10 .61
10 1.93 4.89 .62 7.04 .57
15 .72 7.59
20 2.68 7.22
25 2.85 6.89
30 2.65 6.54
35
40
Weight percent total organic carbon and carbonate in box corea
(TOC, total organic carbon co3, carbonate)
BC-4 BC-5 BC-6 BC-7
roc TOC TOC TOC
2.41 0.50 0.73 0.68 2.45 1.37 3.75 1.72 4.73
2.82 .49 .7 7 .66 2.27 1.41 3.44 1.88 4.28
2.52 .69 .94 .69 2.06 1.33 2.90 1.74 3.20
.47 2.53 .68 2.16 1.10 2.81 1.59 3.30
.52 1.71 .62 2.36 1.15 2.88 1.46 2.69
.41 1.09 .64 2.61 1.09 2.80 1.75 4.48
.64 2.59 1.10 3.08 1.73 7.54
1.21. 3.73 1.82 i.88
1.41 6.73
BC-8 80-9
roc roc
2.16 4.13 2.10 4.41
2.23 4.18 2.41 4.18
1.98 3.50 2.27 4.49
2.03 3.58 2.12 4.84
1.78 3.19 2.04 4.98
1.83 3.39 2.13 5.36
1.68 4.06 1.94 4.47
1. 75 6.79 1.57 4.54
BC-10
roc
2.49 4.72
2.13 4.37
2.77 5.16
2.64 5.33
2.41 5.94
2.67 6.09
2.49 6.51
2.46 6.45
,_. N N

APPENDIX G
Compositional Percentage of Sand-size
Material in Box Cores
123

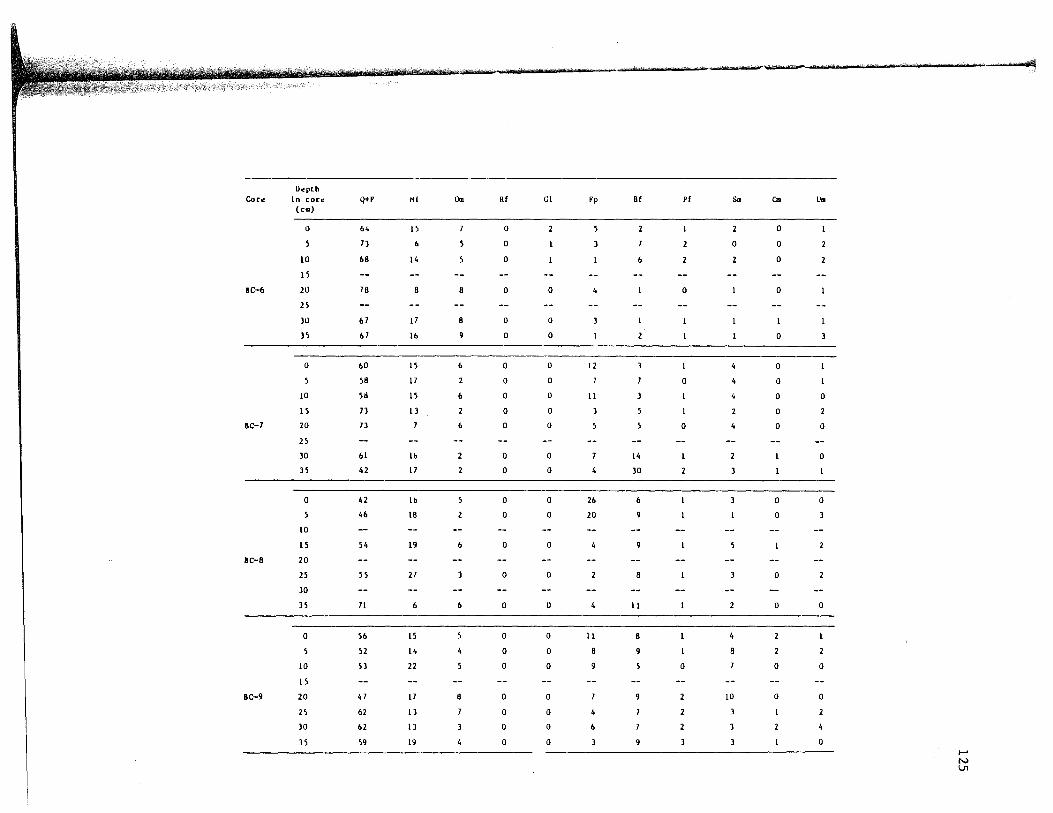
O~pth
Cou ln core! Q+F Mi Om Rf G1 Fp Bf Pf Sm em u .. (em)
0 64 15 0 0
71 0 0 0
10 68 14 0 6 0
15
BC-6 20 78 8 0 0 0 0
2S
10 67 17 8 0 0
15 67 lb 9 0 0 0
0 bO 15 6 0 0 12 0
58 17 0 0 0 0
10 58 15 6 0 0 II 4 0 0
IS 11 11 0 0 2 0
BC-7 20 ]) 6 0 0 0 4 0 0
25
10 61 lb 0 0 14 0
15 42 11 0 0 JO
0 42 lb 0 0 26 6 0 0
46 18 0 0 20 0
10
15 54 19 6 0 0 9 2
BC-8 20
25 55 27 0 0 8 0
30
)5 11 6 6 0 0 11 0 0
0 56 15 0 0 11 8
52 14 4 0 0 9 8
10 53 22 0 0 0 0 0
15
BC-9 20 47 17 8 0 0 10 0 0
25 62 11 0 0
30 b2 1) 0 0
15 59 19 4 0 0 0 1-' N V1

Depth Core in core Q+F M1 Om Rf Gl Fp Bf Pf Sm c. Um
(em)
0 52 19 3 0 0 9 6 2 0
5 56 21 0 0 9 4 0
10 44 17 0 0 13 11 8
BQ-10 15
20 54 17 0 0 6 10 3 8 2
25 61 10 0 0 9 6 3 0
30
35 45 17 4 0 0 10 10 8 3 2

APPENDIX H
Percentage of Individual Planktonic Foraminiferal
Species in Gravity Cores
127

The percentage of individual planktonic foraminiferal species in gravity corea
(Npl, Neogloboquadrina pachyderm&, left coiling; Npr, Neogloboquadrina pachyderaa, right coiling;
Gb, Globigerina bulloides; Gf, Globigerina falconenais; Gqd, Globigerina quadrilatera;
Gqn, Globigerina quinqueloba; Gr, Globigerina rubeocens; Gu, Globigerina uabilicata;
Gg, Globigerinita glutinata; Gi, Globorotalia inflata; Gs, Globorotalia scitula;
Gh, Globorota1oides hexigona; Ou, Orbulina universe]
Core
Depth
in core
(em)
5
25
GC-1 45
GC-2
GC-3
GC-4
65
85
5
35
55
75
95
115
45
55
65
85
105
140
180
220
25
45
65
85
105
118
128
138
148
168
188
Np1 Npr Gb
85
77
71
80
64
70
77
17
20
28
55
59
64
53
71
12
14
14
20
19
10
28
31
28
68
60
6
8
16
5
10
9
5
69
47
34
26
19
11
14
6
75
63
61
61
69
53
43
29
22
16
20
5
9
7
7
8
9
4
12
3
8
13
11
6
2
8
3
2
14
4
17
12
5
Gf
0
0
0
0
0
0
0
0
0
0
0
0
0
0
0
0
0
0
0
0
0
0
0
0
0
0
Gqd Gqn Gr
4
6
3
3
5
(1
10
5
5
6
3
13
8
4
10
12
6
3
16
11
14
17
3
0
0
0
2
9
3
9
12
6
8
3
2
2
5
6
3
5
3
13
2
3
0
0
0
0
0
0
0
0
0
0
0
0
0
0
0
0
0
0
0
0
0
0
0
0
0
0
Gu
0
0
0
0
0
0
0
0
0
0
(l
0
0
0
0
0
0
0
0
0
0
0
Gg
0
0
3
3
2
2
4
2
3
0
0
3
0
4
Gi
0
0
0
0
0
0
0
0
(l
0
0
0
0
0
0
0
0
0
0
0
0
0
0
0
0
0
0
0
<l
3
0
3
4
2
4
0
(1
2
0
3
4
4
(1
0
Gh
0
0
0
0
0
0
<l
(l
0
(1
2
0
(l
3
(1
2
3
(1
0
Ou
0
0
0
0
0
0
0
0
2
2
0
0
0
0
0
0
(1
0
0
2
(1
(1
0
128

Core
GC-5
GC-6
GC-7
GC-8
GC-9
Depth
in core
(Clll)
15
35
55
75
95
120
140
160
180
200
20
60
100
140
160
10
30
50
70
90
110
130
150
170
20
40
60
80
105
125
145
165
25
45
65
85
105
125
145
165
185
205
Np1 Npr Gb
47
21
23
20
30
28
57
60
69
68
54
44
36
30
10
65
41
54
33
53
36
35
33
14
51
17
26
58
49
41
60
51
42
49
57
49
50
35
50
47
62
73
50
57
58
50
36
42
18
14
8
10
41
53
53
54
56
29
52
34
50
29
45
40
44
58
31
67
47
8
3
4
8
5
21
5
3
3
(1
2
4
3
2
10
10
8
13
5
5
5
5
7
3
0
7
14
3
7
10
8
11
14
12
16
12
6
9
22
35
3
26
9
11
22
29
29
37
28
31
34
7
Gf
0
0
0
0
0
0
0
0
0
0
0
0
0
0
0
0
0
0
0
0
0
0
0
0
0
0
0
0
0
0
0
0
<1
(1
0
0
0
0
0
0
0
0
Gqd Gqn Gr
0
2
6
10
9
10
0
5
7
4
0
10
0
0
2
3
1
3
5
0
2
2
9
9
2
5
3
11
11
11
14
14
16
13
11
2
3
(1
7
3
5
9
8
6
3
7
0
3
0
4
6
3
0
4
3
1
3
1
6
7
4
3
6
8
2
5
6
2
4
2
1
0
0
0
0
0
0
0
0
0
0
0
0
0
0
0
0
0
0
0
0
0
0
0
0
0
0
0
0
0
0
0
0
0
0
0
0
0
0
0
0
0
Gu
2
0
0
2
0
0
0
0
0
3
0
2
0
2
0
0
0
0
4
0
1
0
(1
<1
2
0
0
0
2
(1
2
2
5
6
6
2
0
0
0
0
2
0
2
4
3
0
6
11
9
10
13
4
11
16
3
4
8
4
6
6
Gi
0
0
0
0
0
0
0
0
0
0
0
0
0
0
0
0
0
0
0
0
0
(1
0
0
0
(1
(1
0
0
0
0
0
0
0
0
0
0
0
0
0
0
0
0
4
6
3
3
(1
0
0
0
0
0
0
2
0
0
(l
1
2
0
0
0
(1
0
0
(1
Gh
(l
2
0
0
0
0
0
(l
0
2
0
0
2
3
0
0
0
0
0
0
0
0
0
0
0
0
0
0
0
0
0
0
Ou
0
0
0
0
(l
0
0
0
0
0
0
0
0
0
0
0
0
0
0
2
(1
(1
(1
0
0
0
0
0
0
0
0
0
0
129