Acknowledgements T - Ontario Convenience Stores...
23
Transcript of Acknowledgements T - Ontario Convenience Stores...
2012 NATIONAL INDUSTRY REPORT 3
Acknowledgements
Our Partners
The Canadian Convenience Stores Association would like to thank the following National Associate Members who have provided support to this year’s State of the Industry Report
and State of the Industry Presentation.
/MD
TThe State of the Industry (SoI) Report, now in its third year, has become the preeminent source of information on the convenience channel. Building on the success of last year’s findings, the Canadian Convenience Stores Association (CCSA) and its regional affiliates are pleased to present the 2012 edition.
This year we examine the increasing pressure governments are under to impose regulations on the sales of many products and services sold in convenience stores. While we continue to maintain our benchmarking efforts, we explore this over-regulation and its impact on our industry partners – retailers, vendors and distributors alike.
We would like to extend our sincere gratitude to all of our national associate members and sponsors who, through their support, allow us to complete this research that will benefit Association efforts to represent the industry.
Left unabated, regulation impacting the industry will continue to hinder growth and prosperity. Working in partnership, retailers, vendors and distributors will have a far greater ability to limit or prevent this regulatory impact.
Alex Scholten President, CCSA
Michel Gadbois Executive Vice-President,
CCSA
Kim Trowbridge Chairman, CCSA board
of directors
2012 NATIONAL INDUSTRY REPORT 52012 NATIONAL INDUSTRY REPORT 4
S
Contents
Introduction to the 2012 SOI Report
INTRODUCTION TO THE 2012 SOI REPORT ..........................................................................5
MIXED RESULTS FOR CONVENIENCE STORES .....................................................................7Sales decrease in traditional convenience stores but increase in convenience stores with gas stations .................................................................................72011 Benchmarking results .................................................................................................... 10Margins under pressure ........................................................................................................... 11In-store costs ............................................................................................................................16
AND THE CHALLENGES CONTINUE .....................................................................................17The economic environment remains uncertain ...................................................................17The competitive landscape is becoming tougher .................................................................18Impact of technology ..............................................................................................................19The credit card issue ................................................................................................................20
REGULATION—AN OBSTACLE TO CONVENIENCE STORE PROSPERITY .........................22Three methods to quantify the burden of regulation ..........................................................24Two clusters of provinces .......................................................................................................24High cost of regulation for Canadian convenience stores .................................................26
CONCLUSION AND CHALLENGES .........................................................................................28
REGIONAL (ACSA) ..................................................................................................................29Message from the ACSA regional president .........................................................................29A mixed year for convenience stores in Atlantic provinces ..............................................30
REGIONAL (QCSA) ..................................................................................................................32Message from the QCSA president.........................................................................................32A good year for convenience stores in Québec ...................................................................33
REGIONAL (OCSA) ..................................................................................................................35Message from the OCSA president.........................................................................................35A mixed year for convenience stores in Ontario .................................................................36
REGIONAL (WCSA) .................................................................................................................38Message from the WCSA President .......................................................................................38A good year for convenience stores in the West .................................................................39
NATIONAL AND REGIONAL TABLES AND FIGURES ......................................................... 41
NATIONAL AND REGIONAL REFERENCES ..........................................................................42
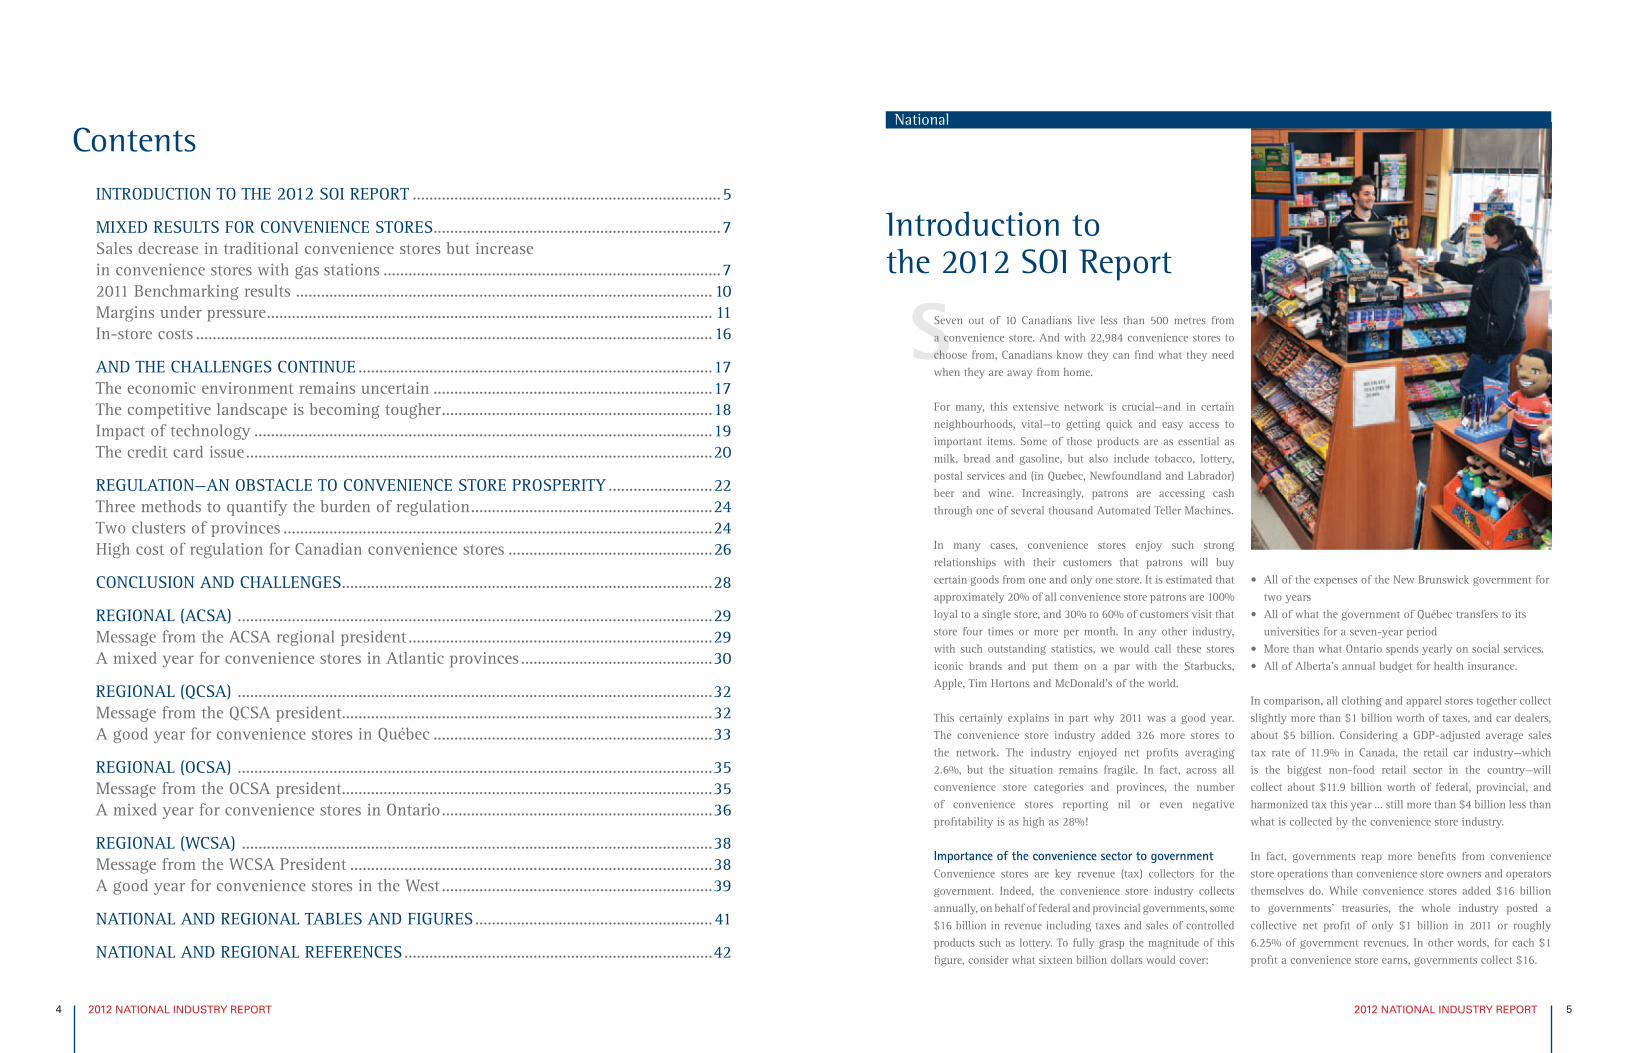
Seven out of 10 Canadians live less than 500 metres from a convenience store. And with 22,984 convenience stores to choose from, Canadians know they can find what they need when they are away from home.
For many, this extensive network is crucial—and in certain neighbourhoods, vital—to getting quick and easy access to important items. Some of those products are as essential as milk, bread and gasoline, but also include tobacco, lottery, postal services and (in Quebec, Newfoundland and Labrador) beer and wine. Increasingly, patrons are accessing cash through one of several thousand Automated Teller Machines.
In many cases, convenience stores enjoy such strong relationships with their customers that patrons will buy certain goods from one and only one store. It is estimated that approximately 20% of all convenience store patrons are 100% loyal to a single store, and 30% to 60% of customers visit that store four times or more per month. In any other industry, with such outstanding statistics, we would call these stores iconic brands and put them on a par with the Starbucks, Apple, Tim Hortons and McDonald’s of the world.
This certainly explains in part why 2011 was a good year. The convenience store industry added 326 more stores to the network. The industry enjoyed net profits averaging 2.6%, but the situation remains fragile. In fact, across all convenience store categories and provinces, the number of convenience stores reporting nil or even negative profitability is as high as 28%!
Importance of the convenience sector to governmentConvenience stores are key revenue (tax) collectors for the government. Indeed, the convenience store industry collects annually, on behalf of federal and provincial governments, some $16 billion in revenue including taxes and sales of controlled products such as lottery. To fully grasp the magnitude of this figure, consider what sixteen billion dollars would cover:
• All of the expenses of the New Brunswick government fortwo years
• AllofwhatthegovernmentofQuébectransferstoitsuniversities for a seven-year period
• MorethanwhatOntariospendsyearlyonsocialservices.• AllofAlberta’sannualbudgetforhealthinsurance.
In comparison, all clothing and apparel stores together collect slightly more than $1 billion worth of taxes, and car dealers, about $5 billion. Considering a GDP-adjusted average sales tax rate of 11.9% in Canada, the retail car industry—which is the biggest non-food retail sector in the country—will collect about $11.9 billion worth of federal, provincial, and harmonized tax this year … still more than $4 billion less than what is collected by the convenience store industry.
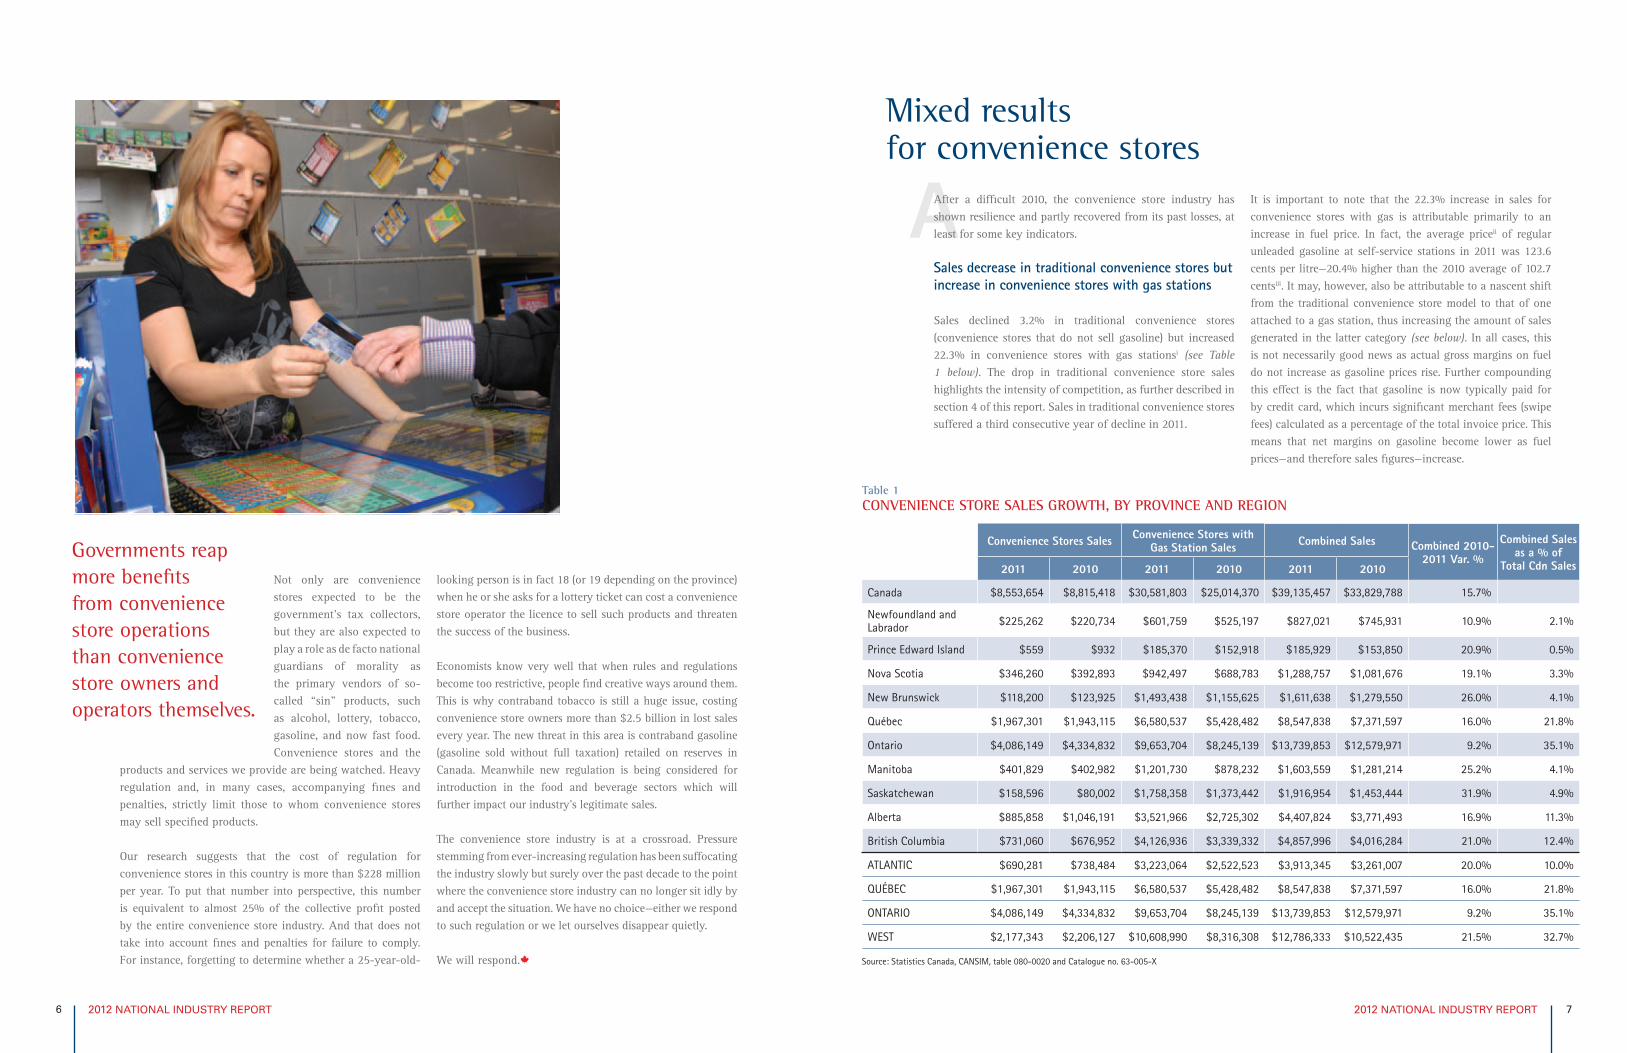
In fact, governments reap more benefits from convenience store operations than convenience store owners and operators themselves do. While convenience stores added $16 billion to governments’ treasuries, the whole industry posted a collective net profit of only $1 billion in 2011 or roughly 6.25% of government revenues. In other words, for each $1 profit a convenience store earns, governments collect $16.
National
2012 NATIONAL INDUSTRY REPORT 72012 NATIONAL INDUSTRY REPORT 6
A
Not only are convenience stores expected to be the government’s tax collectors, but they are also expected to play a role as de facto national guardians of morality as the primary vendors of so-called “sin” products, such as alcohol, lottery, tobacco, gasoline, and now fast food. Convenience stores and the
products and services we provide are being watched. Heavy regulation and, in many cases, accompanying fines and penalties, strictly limit those to whom convenience stores may sell specified products.
Our research suggests that the cost of regulation for convenience stores in this country is more than $228 million per year. To put that number into perspective, this number is equivalent to almost 25% of the collective profit posted by the entire convenience store industry. And that does not take into account fines and penalties for failure to comply. For instance, forgetting to determine whether a 25-year-old-
looking person is in fact 18 (or 19 depending on the province) when he or she asks for a lottery ticket can cost a convenience store operator the licence to sell such products and threaten the success of the business.
Economists know very well that when rules and regulations become too restrictive, people find creative ways around them. This is why contraband tobacco is still a huge issue, costing convenience store owners more than $2.5 billion in lost sales every year. The new threat in this area is contraband gasoline (gasoline sold without full taxation) retailed on reserves in Canada. Meanwhile new regulation is being considered for introduction in the food and beverage sectors which will further impact our industry’s legitimate sales.
The convenience store industry is at a crossroad. Pressure stemming from ever-increasing regulation has been suffocating the industry slowly but surely over the past decade to the point where the convenience store industry can no longer sit idly by and accept the situation. We have no choice—either we respond to such regulation or we let ourselves disappear quietly.
We will respond.
Governments reap more benefits from convenience store operations than convenience store owners and operators themselves.
Mixed results for convenience stores
After a difficult 2010, the convenience store industry has shown resilience and partly recovered from its past losses, at least for some key indicators.
Sales decrease in traditional convenience stores but increase in convenience stores with gas stations
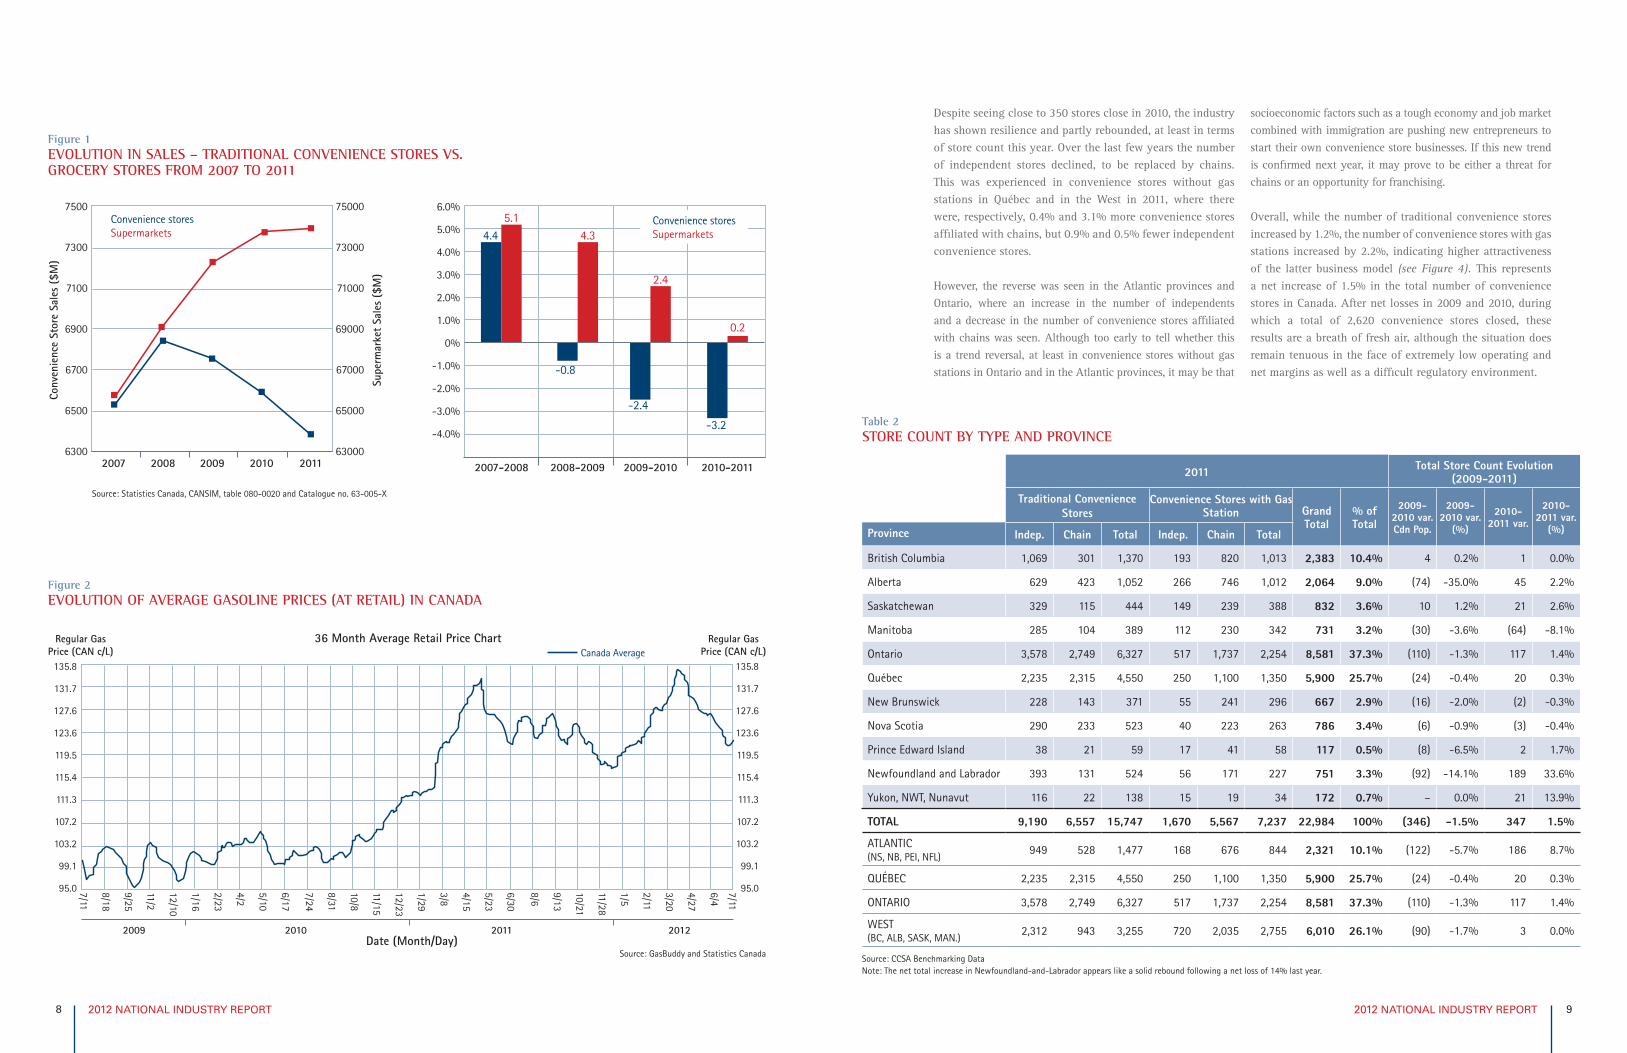
Sales declined 3.2% in traditional convenience stores (convenience stores that do not sell gasoline) but increased 22.3% in convenience stores with gas stationsi (see Table 1 below). The drop in traditional convenience store sales highlights the intensity of competition, as further described in section 4 of this report. Sales in traditional convenience stores suffered a third consecutive year of decline in 2011.
It is important to note that the 22.3% increase in sales for convenience stores with gas is attributable primarily to an increase in fuel price. In fact, the average priceii of regular unleaded gasoline at self-service stations in 2011 was 123.6 cents per litre—20.4% higher than the 2010 average of 102.7 centsiii. It may, however, also be attributable to a nascent shift from the traditional convenience store model to that of one attached to a gas station, thus increasing the amount of sales generated in the latter category (see below). In all cases, this is not necessarily good news as actual gross margins on fuel do not increase as gasoline prices rise. Further compounding this effect is the fact that gasoline is now typically paid for by credit card, which incurs significant merchant fees (swipe fees) calculated as a percentage of the total invoice price. This means that net margins on gasoline become lower as fuel prices—and therefore sales figures—increase.
Table 1CONVENIENCE STORE SALES GROWTH, BY PROVINCE AND REGION
Convenience Stores Sales Convenience Stores with Gas Station Sales Combined Sales Combined 2010-
2011 Var. %
Combined Sales as a % of
Total Cdn Sales2011 2010 2011 2010 2011 2010
Canada $8,553,654 $8,815,418 $30,581,803 $25,014,370 $39,135,457 $33,829,788 15.7%
Newfoundland and Labrador $225,262 $220,734 $601,759 $525,197 $827,021 $745,931 10.9% 2.1%
Prince Edward Island $559 $932 $185,370 $152,918 $185,929 $153,850 20.9% 0.5%
Nova Scotia $346,260 $392,893 $942,497 $688,783 $1,288,757 $1,081,676 19.1% 3.3%
New Brunswick $118,200 $123,925 $1,493,438 $1,155,625 $1,611,638 $1,279,550 26.0% 4.1%
Québec $1,967,301 $1,943,115 $6,580,537 $5,428,482 $8,547,838 $7,371,597 16.0% 21.8%
Ontario $4,086,149 $4,334,832 $9,653,704 $8,245,139 $13,739,853 $12,579,971 9.2% 35.1%
Manitoba $401,829 $402,982 $1,201,730 $878,232 $1,603,559 $1,281,214 25.2% 4.1%
Saskatchewan $158,596 $80,002 $1,758,358 $1,373,442 $1,916,954 $1,453,444 31.9% 4.9%
Alberta $885,858 $1,046,191 $3,521,966 $2,725,302 $4,407,824 $3,771,493 16.9% 11.3%
British Columbia $731,060 $676,952 $4,126,936 $3,339,332 $4,857,996 $4,016,284 21.0% 12.4%
ATLANTIC $690,281 $738,484 $3,223,064 $2,522,523 $3,913,345 $3,261,007 20.0% 10.0%
QUÉBEC $1,967,301 $1,943,115 $6,580,537 $5,428,482 $8,547,838 $7,371,597 16.0% 21.8%
ONTARIO $4,086,149 $4,334,832 $9,653,704 $8,245,139 $13,739,853 $12,579,971 9.2% 35.1%
WEST $2,177,343 $2,206,127 $10,608,990 $8,316,308 $12,786,333 $10,522,435 21.5% 32.7%
Source: Statistics Canada, CANSIM, table 080-0020 and Catalogue no. 63-005-X
2012 NATIONAL INDUSTRY REPORT 92012 NATIONAL INDUSTRY REPORT 8
Despite seeing close to 350 stores close in 2010, the industry has shown resilience and partly rebounded, at least in terms of store count this year. Over the last few years the number of independent stores declined, to be replaced by chains. This was experienced in convenience stores without gas stations in Québec and in the West in 2011, where there were, respectively, 0.4% and 3.1% more convenience stores affiliated with chains, but 0.9% and 0.5% fewer independent convenience stores.
However, the reverse was seen in the Atlantic provinces and Ontario, where an increase in the number of independents and a decrease in the number of convenience stores affiliated with chains was seen. Although too early to tell whether this is a trend reversal, at least in convenience stores without gas stations in Ontario and in the Atlantic provinces, it may be that
socioeconomic factors such as a tough economy and job market combined with immigration are pushing new entrepreneurs to start their own convenience store businesses. If this new trend is confirmed next year, it may prove to be either a threat for chains or an opportunity for franchising.
Overall, while the number of traditional convenience stores increased by 1.2%, the number of convenience stores with gas stations increased by 2.2%, indicating higher attractiveness of the latter business model (see Figure 4). This represents a net increase of 1.5% in the total number of convenience stores in Canada. After net losses in 2009 and 2010, during which a total of 2,620 convenience stores closed, these results are a breath of fresh air, although the situation does remain tenuous in the face of extremely low operating and net margins as well as a difficult regulatory environment.
6300
6500
6700
6900
7100
7300
7500
63000
65000
67000
69000
71000
73000
75000
2007 2008 2009 2010 2011
-4.0%
-3.0%
-2.0%
-1.0%
0%
1.0%
2.0%
3.0%
4.0%
5.0%
6.0%
4.45.1
2007-2008 2008-2009 2009-2010 2010-2011
-0.8
4.3
2.4
-2.4
0.2
-3.2
Convenience storesSupermarkets
Conv
enie
nce
Stor
e Sa
les
($M
)
Supe
rmar
ket
Sale
s ($
M)
Convenience storesSupermarkets
Figure 1EVOLUTION IN SALES – TRADITIONAL CONVENIENCE STORES VS. GROCERY STORES FROM 2007 TO 2011
Figure 2EVOLUTION OF AVERAGE GASOLINE PRICES (AT RETAIL) IN CANADA
95.0
99.1
103.2
107.2
111.3
115.4
119.5
123.6
127.6
131.7
135.8
95.0
99.1
103.2
107.2
111.3
115.4
119.5
123.6
127.6
131.7
135.8
Regular GasPrice (CAN c/L)
Regular GasPrice (CAN c/L)Canada Average
7/11
8/18
9/25
11/2
12/10
1/16
2/23
4/2
5/10
6/17
7/24
8/31
10/8
11/15
12/23
1/29
3/8
4/15
5/23
6/30
8/6
9/13
10/21
11/28
1/5
2/11
3/20
4/27
6/4
7/11
2009 2010 2011 2012
36 Month Average Retail Price Chart
Date (Month/Day)
Table 2STORE COUNT BY TYPE AND PROVINCE
2011 Total Store Count Evolution (2009-2011)
Traditional Convenience Stores
Convenience Stores with Gas Station Grand
Total% ofTotal
2009-2010 var. Cdn Pop.
2009-2010 var.
(%)
2010-2011 var.
2010-2011 var.
(%)Province Indep. Chain Total Indep. Chain Total
British Columbia 1,069 301 1,370 193 820 1,013 2,383 10.4% 4 0.2% 1 0.0%
Alberta 629 423 1,052 266 746 1,012 2,064 9.0% (74) -35.0% 45 2.2%
Saskatchewan 329 115 444 149 239 388 832 3.6% 10 1.2% 21 2.6%
Manitoba 285 104 389 112 230 342 731 3.2% (30) -3.6% (64) -8.1%
Ontario 3,578 2,749 6,327 517 1,737 2,254 8,581 37.3% (110) -1.3% 117 1.4%
Québec 2,235 2,315 4,550 250 1,100 1,350 5,900 25.7% (24) -0.4% 20 0.3%
New Brunswick 228 143 371 55 241 296 667 2.9% (16) -2.0% (2) -0.3%
Nova Scotia 290 233 523 40 223 263 786 3.4% (6) -0.9% (3) -0.4%
Prince Edward Island 38 21 59 17 41 58 117 0.5% (8) -6.5% 2 1.7%
Newfoundland and Labrador 393 131 524 56 171 227 751 3.3% (92) -14.1% 189 33.6%
Yukon, NWT, Nunavut 116 22 138 15 19 34 172 0.7% – 0.0% 21 13.9%
TOTAL 9,190 6,557 15,747 1,670 5,567 7,237 22,984 100% (346) -1.5% 347 1.5%
ATLANTIC (NS, NB, PEI, NFL)
949 528 1,477 168 676 844 2,321 10.1% (122) -5.7% 186 8.7%
QUÉBEC 2,235 2,315 4,550 250 1,100 1,350 5,900 25.7% (24) -0.4% 20 0.3%
ONTARIO 3,578 2,749 6,327 517 1,737 2,254 8,581 37.3% (110) -1.3% 117 1.4%
WEST (BC, ALB, SASK, MAN.)
2,312 943 3,255 720 2,035 2,755 6,010 26.1% (90) -1.7% 3 0.0%
Source: CCSA Benchmarking DataNote: The net total increase in Newfoundland-and-Labrador appears like a solid rebound following a net loss of 14% last year.
Source: Statistics Canada, CANSIM, table 080-0020 and Catalogue no. 63-005-X
Source: GasBuddy and Statistics Canada
2012 NATIONAL INDUSTRY REPORT 112012 NATIONAL INDUSTRY REPORT 10
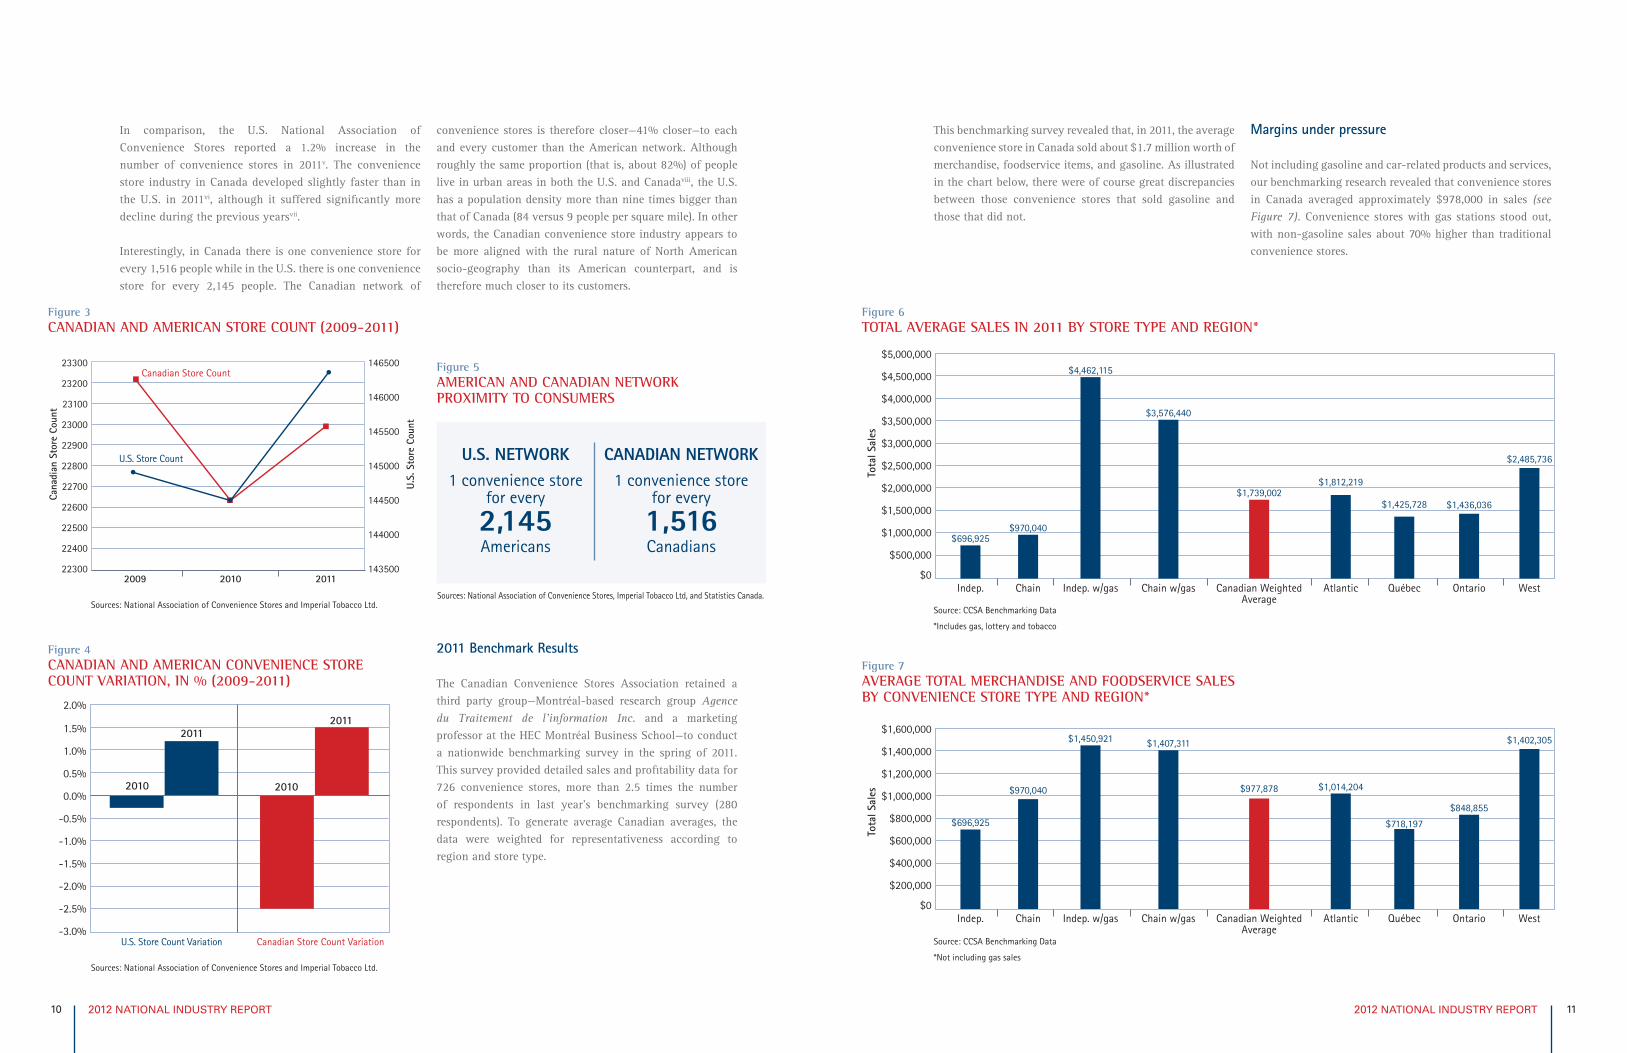
In comparison, the U.S. National Association of Convenience Stores reported a 1.2% increase in the number of convenience stores in 2011v. The convenience store industry in Canada developed slightly faster than in the U.S. in 2011vi, although it suffered significantly more decline during the previous yearsvii.
Interestingly, in Canada there is one convenience store for every 1,516 people while in the U.S. there is one convenience store for every 2,145 people. The Canadian network of
convenience stores is therefore closer—41% closer—to each and every customer than the American network. Although roughly the same proportion (that is, about 82%) of people live in urban areas in both the U.S. and Canadaviii, the U.S. has a population density more than nine times bigger than that of Canada (84 versus 9 people per square mile). In other words, the Canadian convenience store industry appears to be more aligned with the rural nature of North American socio-geography than its American counterpart, and is therefore much closer to its customers.
2011 Benchmark Results
The Canadian Convenience Stores Association retained a third party group—Montréal-based research group Agence du Traitement de l’information Inc. and a marketing professor at the HEC Montréal Business School—to conduct a nationwide benchmarking survey in the spring of 2011. This survey provided detailed sales and profitability data for 726 convenience stores, more than 2.5 times the number of respondents in last year’s benchmarking survey (280 respondents). To generate average Canadian averages, the data were weighted for representativeness according to region and store type.
This benchmarking survey revealed that, in 2011, the average convenience store in Canada sold about $1.7 million worth of merchandise, foodservice items, and gasoline. As illustrated in the chart below, there were of course great discrepancies between those convenience stores that sold gasoline and those that did not.
Margins under pressure
Not including gasoline and car-related products and services, our benchmarking research revealed that convenience stores in Canada averaged approximately $978,000 in sales (see Figure 7). Convenience stores with gas stations stood out, with non-gasoline sales about 70% higher than traditional convenience stores.
Figure 6TOTAL AVERAGE SALES IN 2011 BY STORE TYPE AND REGION*
Figure 7AVERAGE TOTAL MERCHANDISE AND FOODSERVICE SALES BY CONVENIENCE STORE TYPE AND REGION*
$500,000
$0
$1,000,000
$1,500,000
$2,000,000
$2,500,000
$3,000,000
$3,500,000
$4,000,000
$4,500,000
$5,000,000
$696,925$970,040
$4,462,115
$3,576,440
$1,739,002$1,812,219
$1,425,728 $1,436,036
$2,485,736
Indep. Chain Indep. w/gas Chain w/gas Canadian WeightedAverage
Atlantic Québec Ontario West
Tota
l Sal
es
$200,000
$0
$400,000
$600,000
$800,000
$1,000,000
$1,200,000
$1,400,000
$1,600,000
$696,925
$970,040
$1,450,921 $1,407,311
$977,878 $1,014,204
$718,197
$848,855
$1,402,305
Indep. Chain Indep. w/gas Chain w/gas Canadian WeightedAverage
Atlantic Québec Ontario WestTo
tal S
ales
$500,000
$0
$1,000,000
$1,500,000
$2,000,000
$2,500,000
$3,000,000
$3,500,000
$4,000,000
$4,500,000
$5,000,000
$696,925$970,040
$4,462,115
$3,576,440
$1,739,002$1,812,219
$1,425,728 $1,436,036
$2,485,736
Indep. Chain Indep. w/gas Chain w/gas Canadian WeightedAverage
Atlantic Québec Ontario West
Tota
l Sal
es$200,000
$0
$400,000
$600,000
$800,000
$1,000,000
$1,200,000
$1,400,000
$1,600,000
$696,925
$970,040
$1,450,921 $1,407,311
$977,878 $1,014,204
$718,197
$848,855
$1,402,305
Indep. Chain Indep. w/gas Chain w/gas Canadian WeightedAverage
Atlantic Québec Ontario West
Tota
l Sal
es
22300
22400
22500
22600
22700
22800
22900
23000
23100
23200
23300
143500
144000
144500
145000
145500
146000
146500
2009 2010 2011
Cana
dian
Sto
re C
ount
U.S.
Sto
re C
ount
Canadian Store Count
U.S. Store Count
-3.0%
-2.5%
-2.0%
-1.5%
-1.0%
-0.5%
0.0%
0.5%
1.0%
1.5%
2.0%
Canadian Store Count VariationU.S. Store Count Variation
2010
2011
2010
2011
Figure 3CANADIAN AND AMERICAN STORE COUNT (2009-2011)
Figure 4CANADIAN AND AMERICAN CONVENIENCE STORE COUNT VARIATION, IN % (2009-2011)
U.S. NETWORK1 convenience store
for every
2,145Americans
CANADIAN NETWORK1 convenience store
for every
1,516Canadians
Figure 5AMERICAN AND CANADIAN NETWORK PROXIMITY TO CONSUMERS
Source: CCSA Benchmarking Data
*Includes gas, lottery and tobacco
Source: CCSA Benchmarking Data
*Not including gas sales
Sources: National Association of Convenience Stores and Imperial Tobacco Ltd.Sources: National Association of Convenience Stores, Imperial Tobacco Ltd, and Statistics Canada.
Sources: National Association of Convenience Stores and Imperial Tobacco Ltd.
2012 NATIONAL INDUSTRY REPORT 132012 NATIONAL INDUSTRY REPORT 12
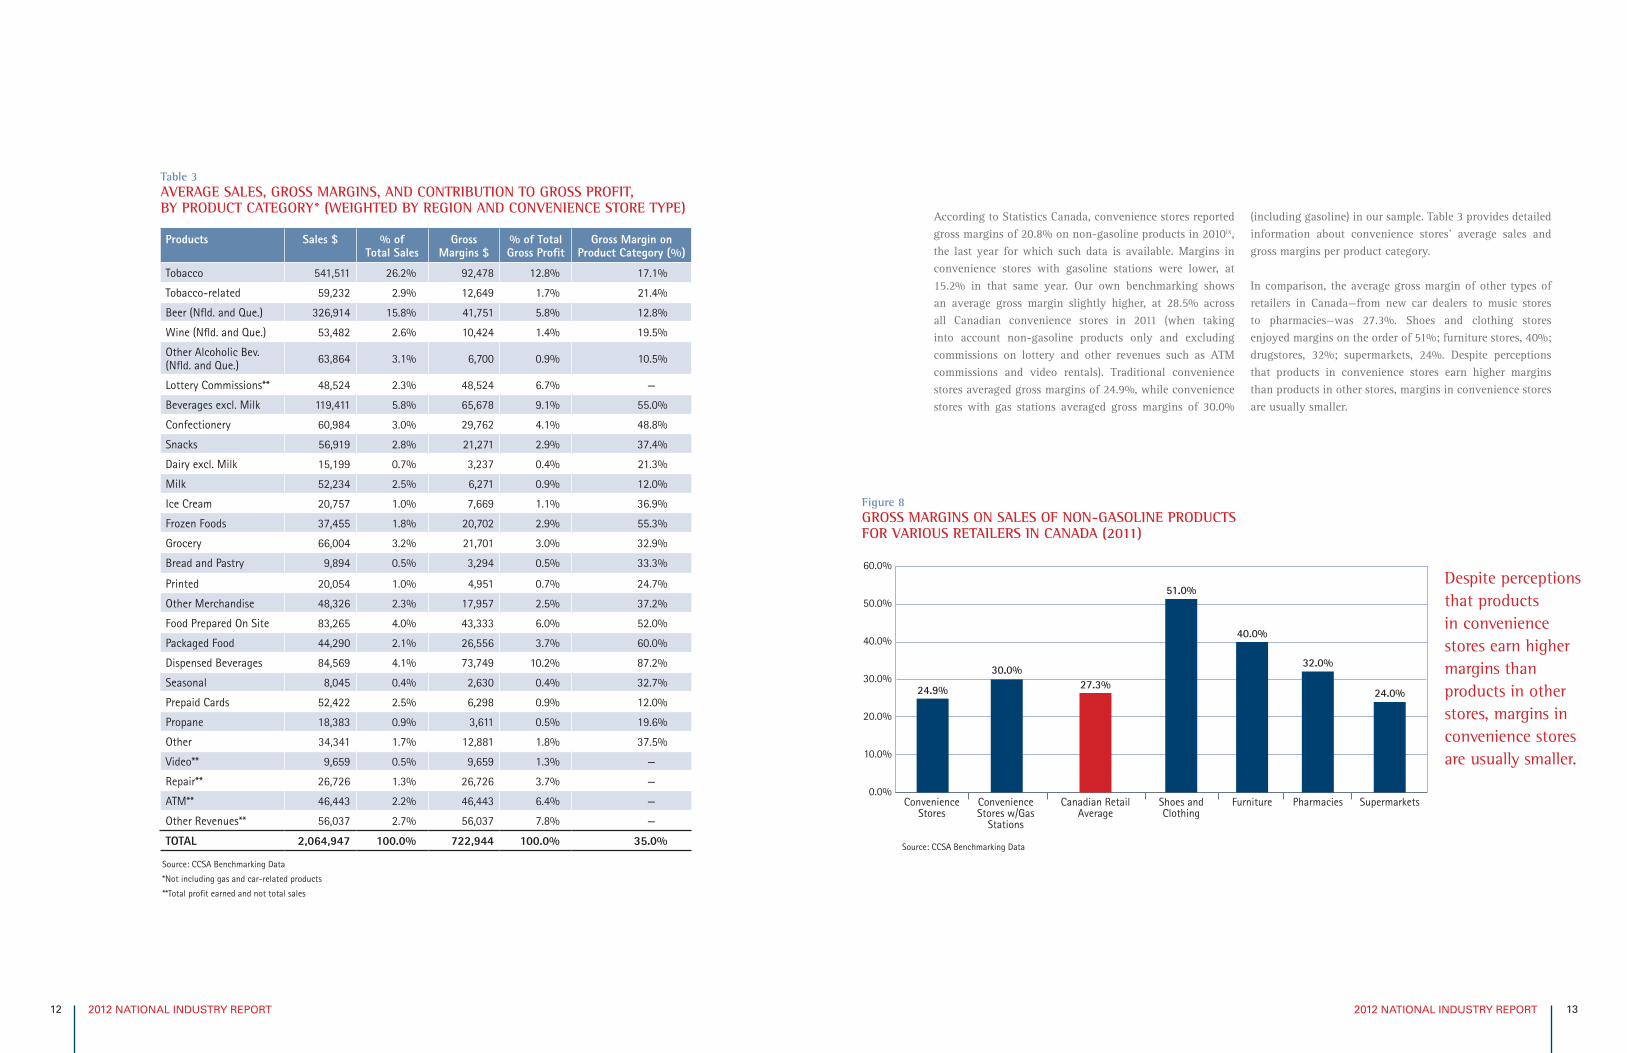
Table 3AVERAGE SALES, GROSS MARGINS, AND CONTRIBUTION TO GROSS PROFIT, BY PRODUCT CATEGORY* (WEIGHTED BY REGION AND CONVENIENCE STORE TYPE)
Products Sales $ % of Total Sales
GrossMargins $
% of Total Gross Profit
Gross Margin on Product Category (%)
Tobacco 541,511 26.2% 92,478 12.8% 17.1%
Tobacco-related 59,232 2.9% 12,649 1.7% 21.4%
Beer (Nfld. and Que.) 326,914 15.8% 41,751 5.8% 12.8%
Wine (Nfld. and Que.) 53,482 2.6% 10,424 1.4% 19.5%
Other Alcoholic Bev. (Nfld. and Que.) 63,864 3.1% 6,700 0.9% 10.5%
Lottery Commissions** 48,524 2.3% 48,524 6.7% —
Beverages excl. Milk 119,411 5.8% 65,678 9.1% 55.0%
Confectionery 60,984 3.0% 29,762 4.1% 48.8%
Snacks 56,919 2.8% 21,271 2.9% 37.4%
Dairy excl. Milk 15,199 0.7% 3,237 0.4% 21.3%
Milk 52,234 2.5% 6,271 0.9% 12.0%
Ice Cream 20,757 1.0% 7,669 1.1% 36.9%
Frozen Foods 37,455 1.8% 20,702 2.9% 55.3%
Grocery 66,004 3.2% 21,701 3.0% 32.9%
Bread and Pastry 9,894 0.5% 3,294 0.5% 33.3%
Printed 20,054 1.0% 4,951 0.7% 24.7%
Other Merchandise 48,326 2.3% 17,957 2.5% 37.2%
Food Prepared On Site 83,265 4.0% 43,333 6.0% 52.0%
Packaged Food 44,290 2.1% 26,556 3.7% 60.0%
Dispensed Beverages 84,569 4.1% 73,749 10.2% 87.2%
Seasonal 8,045 0.4% 2,630 0.4% 32.7%
Prepaid Cards 52,422 2.5% 6,298 0.9% 12.0%
Propane 18,383 0.9% 3,611 0.5% 19.6%
Other 34,341 1.7% 12,881 1.8% 37.5%
Video** 9,659 0.5% 9,659 1.3% —
Repair** 26,726 1.3% 26,726 3.7% —
ATM** 46,443 2.2% 46,443 6.4% —
Other Revenues** 56,037 2.7% 56,037 7.8% —
TOTAL 2,064,947 100.0% 722,944 100.0% 35.0%
Source: CCSA Benchmarking Data
*Not including gas and car-related products
**Total profit earned and not total sales
According to Statistics Canada, convenience stores reported gross margins of 20.8% on non-gasoline products in 2010ix, the last year for which such data is available. Margins in convenience stores with gasoline stations were lower, at 15.2% in that same year. Our own benchmarking shows an average gross margin slightly higher, at 28.5% across all Canadian convenience stores in 2011 (when taking into account non-gasoline products only and excluding commissions on lottery and other revenues such as ATM commissions and video rentals). Traditional convenience stores averaged gross margins of 24.9%, while convenience stores with gas stations averaged gross margins of 30.0%
(including gasoline) in our sample. Table 3 provides detailed information about convenience stores’ average sales and gross margins per product category.
In comparison, the average gross margin of other types of retailers in Canada—from new car dealers to music stores to pharmacies—was 27.3%. Shoes and clothing stores enjoyed margins on the order of 51%; furniture stores, 40%; drugstores, 32%; supermarkets, 24%. Despite perceptions that products in convenience stores earn higher margins than products in other stores, margins in convenience stores are usually smaller.
Despite perceptions that products in convenience stores earn higher margins than products in other stores, margins in convenience stores are usually smaller.
Figure 8GROSS MARGINS ON SALES OF NON-GASOLINE PRODUCTS FOR VARIOUS RETAILERS IN CANADA (2011)
0.0%
10.0%
20.0%
30.0%
40.0%
50.0%
60.0%
ConvenienceStores
ConvenienceStores w/Gas
Stations
Canadian RetailAverage
Shoes andClothing
Furniture Pharmacies Supermarkets
24.9%
30.0%27.3%
51.0%
40.0%
32.0%
24.0%
Source: CCSA Benchmarking Data
2012 NATIONAL INDUSTRY REPORT 152012 NATIONAL INDUSTRY REPORT 14
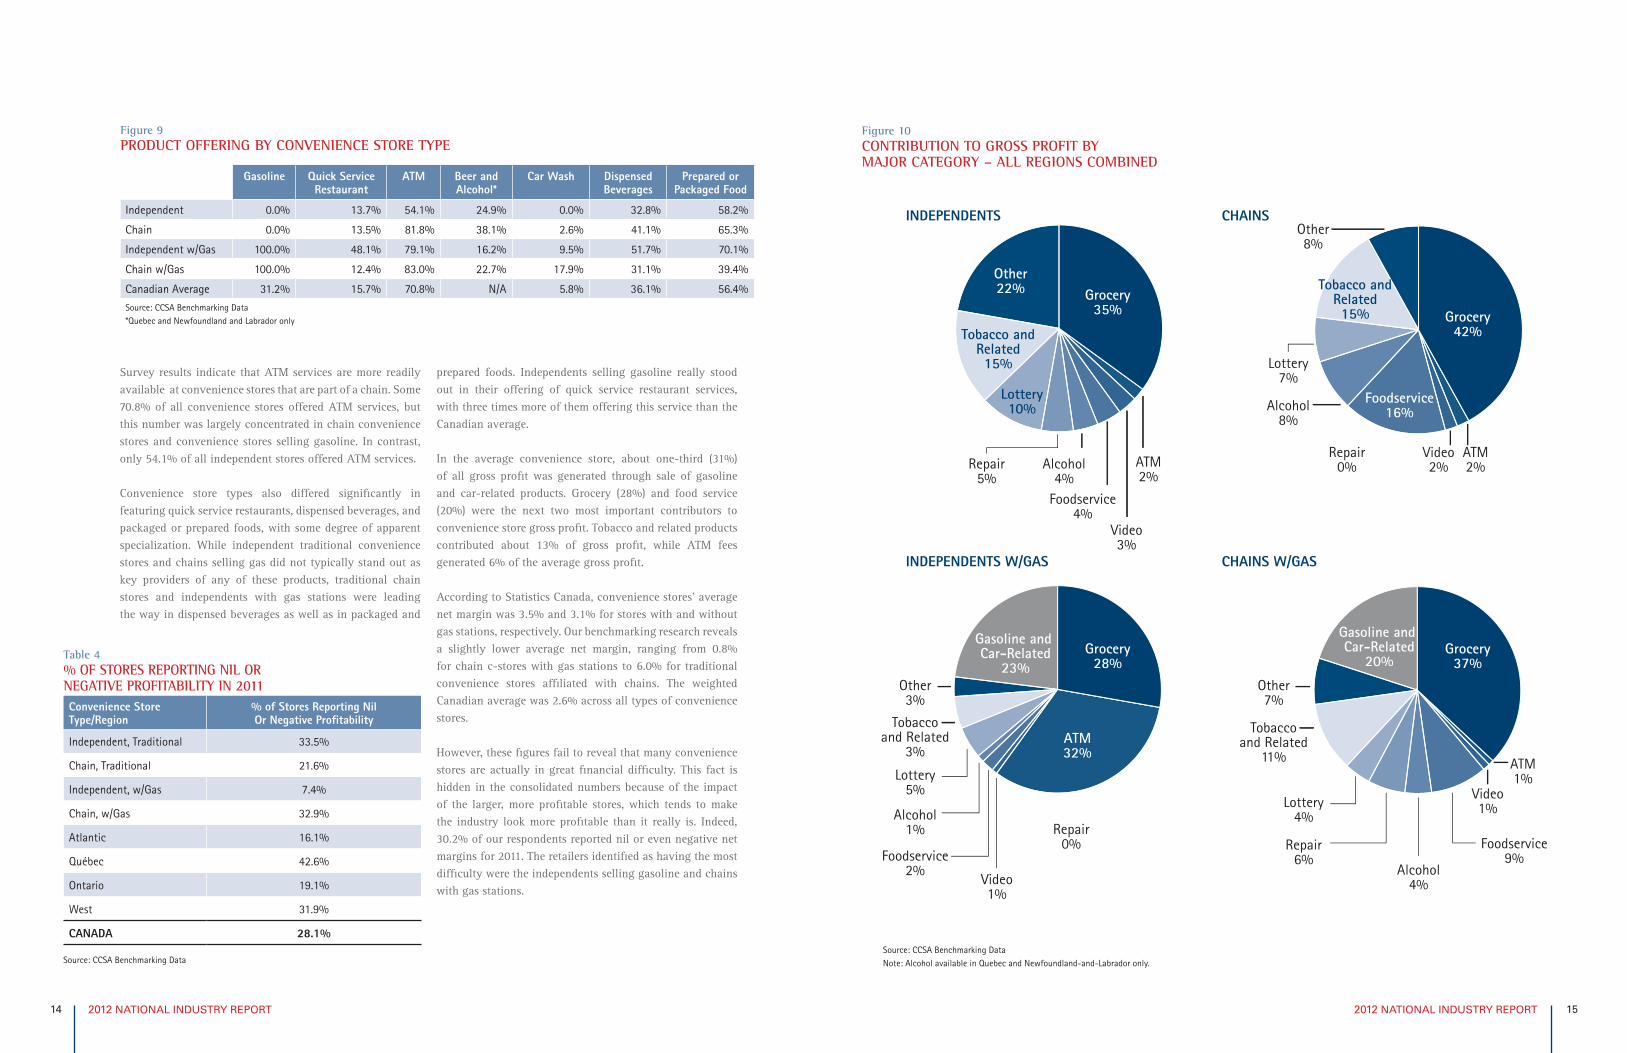
Survey results indicate that ATM services are more readily available at convenience stores that are part of a chain. Some 70.8% of all convenience stores offered ATM services, but this number was largely concentrated in chain convenience stores and convenience stores selling gasoline. In contrast, only 54.1% of all independent stores offered ATM services.
Convenience store types also differed significantly in featuring quick service restaurants, dispensed beverages, and packaged or prepared foods, with some degree of apparent specialization. While independent traditional convenience stores and chains selling gas did not typically stand out as key providers of any of these products, traditional chain stores and independents with gas stations were leading the way in dispensed beverages as well as in packaged and
prepared foods. Independents selling gasoline really stood out in their offering of quick service restaurant services, with three times more of them offering this service than the Canadian average.
In the average convenience store, about one-third (31%) of all gross profit was generated through sale of gasoline and car-related products. Grocery (28%) and food service (20%) were the next two most important contributors to convenience store gross profit. Tobacco and related products contributed about 13% of gross profit, while ATM fees generated 6% of the average gross profit.
According to Statistics Canada, convenience stores’ average net margin was 3.5% and 3.1% for stores with and without gas stations, respectively. Our benchmarking research reveals a slightly lower average net margin, ranging from 0.8% for chain c-stores with gas stations to 6.0% for traditional convenience stores affiliated with chains. The weighted Canadian average was 2.6% across all types of convenience stores.
However, these figures fail to reveal that many convenience stores are actually in great financial difficulty. This fact is hidden in the consolidated numbers because of the impact of the larger, more profitable stores, which tends to make the industry look more profitable than it really is. Indeed, 30.2% of our respondents reported nil or even negative net margins for 2011. The retailers identified as having the most difficulty were the independents selling gasoline and chains with gas stations.
Figure 10CONTRIBUTION TO GROSS PROFIT BY MAJOR CATEGORY – ALL REGIONS COMBINED
Other22%
Repair5%
Alcohol4%
Foodservice4%
Video3%
ATM2%
Grocery35%
Tobacco andRelated15%
Lottery10%
Grocery42%
Other8%
Tobacco andRelated15%
Foodservice16%
Lottery7%
Alcohol8%
ATM2%
Video2%
Repair0%
Grocery28%
Gasoline and Car-Related
23%
ATM32%
Video1%
Foodservice2%
Alcohol1%
Lottery5%
Other3%
Tobaccoand Related
3%
Repair0%
Alcohol4%
Repair6%
Lottery4%
Other7%
Tobaccoand Related
11%
Grocery37%
Gasoline and Car-Related
20%
ATM1%
Video1%
Foodservice9%
INDEPENDENTS CHAINS
CHAINS W/GASINDEPENDENTS W/GAS
Table 4% OF STORES REPORTING NIL OR NEGATIVE PROFITABILITY IN 2011Convenience Store Type/Region
% of Stores Reporting Nil Or Negative Profitability
Independent, Traditional 33.5%
Chain, Traditional 21.6%
Independent, w/Gas 7.4%
Chain, w/Gas 32.9%
Atlantic 16.1%
Québec 42.6%
Ontario 19.1%
West 31.9%
CANADA 28.1%
Source: CCSA Benchmarking Data
Figure 9PRODUCT OFFERING BY CONVENIENCE STORE TYPE
Gasoline Quick Service Restaurant
ATM Beer and Alcohol*
Car Wash Dispensed Beverages
Prepared or Packaged Food
Independent 0.0% 13.7% 54.1% 24.9% 0.0% 32.8% 58.2%
Chain 0.0% 13.5% 81.8% 38.1% 2.6% 41.1% 65.3%
Independent w/Gas 100.0% 48.1% 79.1% 16.2% 9.5% 51.7% 70.1%
Chain w/Gas 100.0% 12.4% 83.0% 22.7% 17.9% 31.1% 39.4%
Canadian Average 31.2% 15.7% 70.8% N/A 5.8% 36.1% 56.4%
Source: CCSA Benchmarking Data*Quebec and Newfoundland and Labrador only
Source: CCSA Benchmarking DataNote: Alcohol available in Quebec and Newfoundland-and-Labrador only.
2012 NATIONAL INDUSTRY REPORT 172012 NATIONAL INDUSTRY REPORT 16
Figure 11COMPARATIVE MARGINS OF CONVENIENCE STORE COMPETITORS IN CANADA
FOOD AND BEVERAGE STORESSUPERMARKETS AND OTHER GROCERY
(EXCEPT CONVENIENCE) STORES GASOLINE STATIONS
Cost of Good Sold72%
Gross Margin14%
Gross Margin14%
Operating Expenses Net Margin
21% 7%
Operating Expenses Net Margin
22% 2%
Operating Expenses Net Margin
10% 5%
Gross Margin14%
Cost of Good Sold76%
Cost of Good Sold85%
Gross Margin14%
Cost of Good Sold72%
Gross Margin14%
Gross Margin14%
Operating Expenses Net Margin
21% 7%
Operating Expenses Net Margin
22% 2%
Operating Expenses Net Margin
10% 5%
Gross Margin14%
Cost of Good Sold76%
Cost of Good Sold85%
Gross Margin14%
Cost of Good Sold72%
Gross Margin14%
Gross Margin14%
Operating Expenses Net Margin
21% 7%
Operating Expenses Net Margin
22% 2%
Operating Expenses Net Margin
10% 5%
Gross Margin14%
Cost of Good Sold76%
Cost of Good Sold85%
Gross Margin14%
In-Store Costs
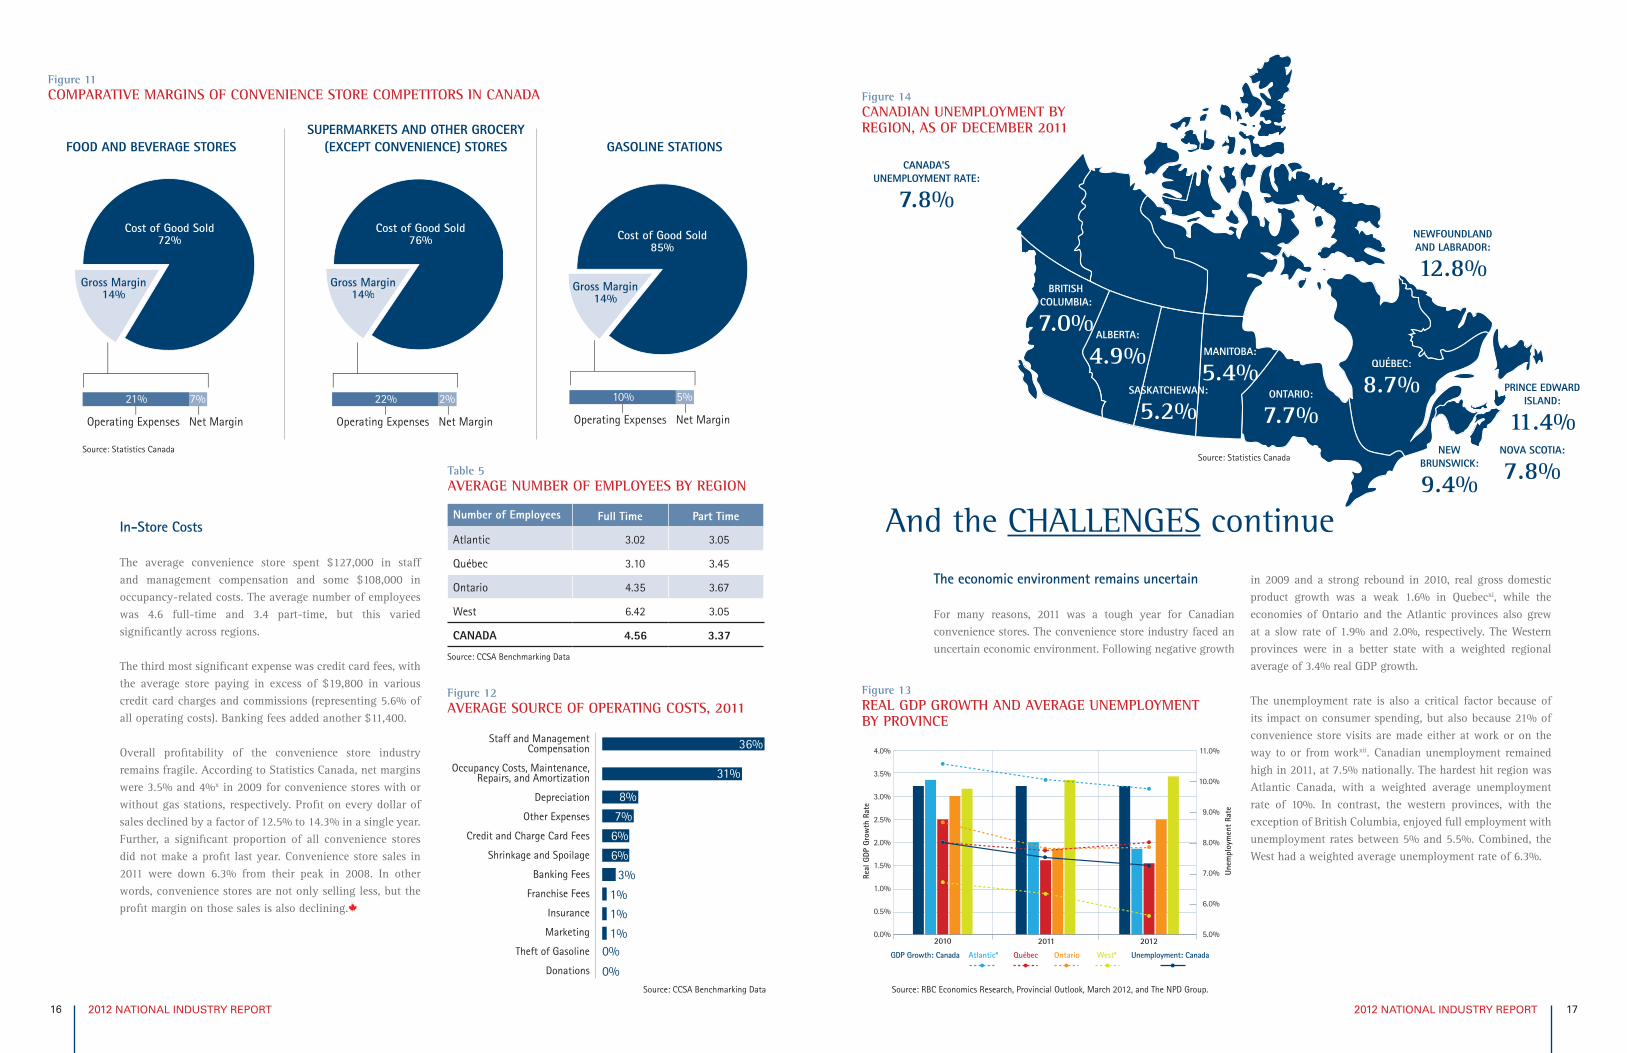
The average convenience store spent $127,000 in staff and management compensation and some $108,000 in occupancy-related costs. The average number of employees was 4.6 full-time and 3.4 part-time, but this varied significantly across regions.
The third most significant expense was credit card fees, with the average store paying in excess of $19,800 in various credit card charges and commissions (representing 5.6% of all operating costs). Banking fees added another $11,400.
Overall profitability of the convenience store industry remains fragile. According to Statistics Canada, net margins were 3.5% and 4%x in 2009 for convenience stores with or without gas stations, respectively. Profit on every dollar of sales declined by a factor of 12.5% to 14.3% in a single year. Further, a significant proportion of all convenience stores did not make a profit last year. Convenience store sales in 2011 were down 6.3% from their peak in 2008. In other words, convenience stores are not only selling less, but the profit margin on those sales is also declining.
Table 5AVERAGE NUMBER OF EMPLOYEES BY REGION
Number of Employees Full Time Part Time
Atlantic 3.02 3.05
Québec 3.10 3.45
Ontario 4.35 3.67
West 6.42 3.05
CANADA 4.56 3.37
Figure 12AVERAGE SOURCE OF OPERATING COSTS, 2011
Staff and Management Compensation
Occupancy Costs, Maintenance, Repairs, and Amortization
Depreciation
Other Expenses
Credit and Charge Card Fees
Shrinkage and Spoilage
Banking Fees
Franchise Fees
Insurance
Marketing
Theft of Gasoline
Donations
0%
0%
64
1%
1%
1%
3%
36%
31%
8%
7%
6%
6%
And the CHALLENGES continue
The economic environment remains uncertain
For many reasons, 2011 was a tough year for Canadian convenience stores. The convenience store industry faced an uncertain economic environment. Following negative growth
in 2009 and a strong rebound in 2010, real gross domestic product growth was a weak 1.6% in Quebecxi, while the economies of Ontario and the Atlantic provinces also grew at a slow rate of 1.9% and 2.0%, respectively. The Western provinces were in a better state with a weighted regional average of 3.4% real GDP growth.
The unemployment rate is also a critical factor because of its impact on consumer spending, but also because 21% of convenience store visits are made either at work or on the way to or from workxii. Canadian unemployment remained high in 2011, at 7.5% nationally. The hardest hit region was Atlantic Canada, with a weighted average unemployment rate of 10%. In contrast, the western provinces, with the exception of British Columbia, enjoyed full employment with unemployment rates between 5% and 5.5%. Combined, the West had a weighted average unemployment rate of 6.3%.
0.0%
0.5%
1.0%
1.5%
2.0%
2.5%
3.0%
3.5%
4.0%
5.0%
6.0%
7.0%
8.0%
9.0%
10.0%
11.0%
2010 2011 2012
GDP Growth: Canada Unemployment: CanadaAtlantic* Québec Ontario West*
Real
GDP
Gro
wth
Rat
e
Unem
ploy
men
t Ra
te
Figure 13REAL GDP GROWTH AND AVERAGE UNEMPLOYMENT BY PROVINCE
Figure 14CANADIAN UNEMPLOYMENT BY REGION, AS OF DECEMBER 2011
CANADA’SUNEMPLOYMENT RATE:
7.8%
BRITISH COLUMBIA:
7.0%ALBERTA:
4.9%SASKATCHEWAN:
5.2%
MANITOBA:
5.4%ONTARIO:
7.7%
QUÉBEC:
8.7%
NEWFOUNDLAND AND LABRADOR:
12.8%
PRINCE EDWARD ISLAND:
11.4%NOVA SCOTIA:
7.8%NEW
BRUNSWICK:
9.4%Source: Statistics Canada
Source: CCSA Benchmarking Data
Source: CCSA Benchmarking Data
Source: Statistics Canada
Source: RBC Economics Research, Provincial Outlook, March 2012, and The NPD Group.
2012 NATIONAL INDUSTRY REPORT 192012 NATIONAL INDUSTRY REPORT 18
The competitive landscape is becoming tougher
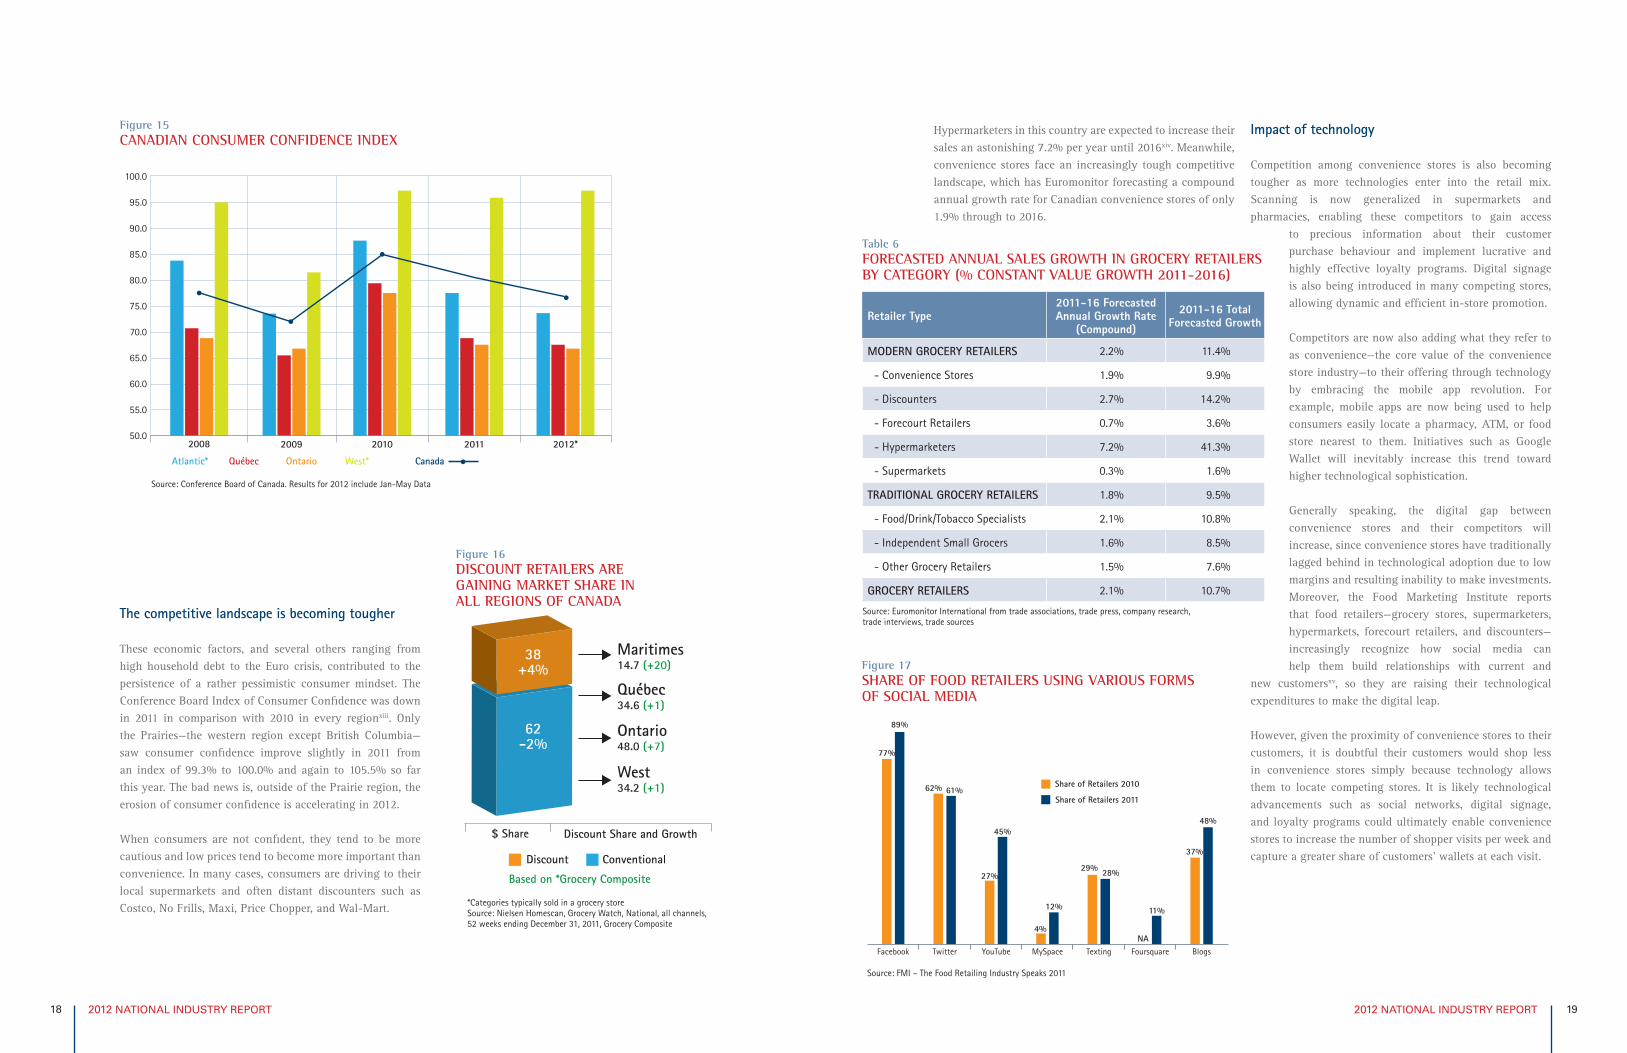
These economic factors, and several others ranging from high household debt to the Euro crisis, contributed to the persistence of a rather pessimistic consumer mindset. The Conference Board Index of Consumer Confidence was down in 2011 in comparison with 2010 in every regionxiii. Only the Prairies—the western region except British Columbia—saw consumer confidence improve slightly in 2011 from an index of 99.3% to 100.0% and again to 105.5% so far this year. The bad news is, outside of the Prairie region, the erosion of consumer confidence is accelerating in 2012.
When consumers are not confident, they tend to be more cautious and low prices tend to become more important than convenience. In many cases, consumers are driving to their local supermarkets and often distant discounters such as Costco, No Frills, Maxi, Price Chopper, and Wal-Mart.
50.0
55.0
60.0
65.0
70.0
75.0
80.0
85.0
90.0
95.0
100.0
2008 2009 2011 2012*2010
Atlantic* Québec Ontario West* Canada
Figure 15CANADIAN CONSUMER CONFIDENCE INDEX
Figure 16DISCOUNT RETAILERS ARE GAINING MARKET SHARE IN ALL REGIONS OF CANADA
$ Share Discount Share and Growth
Discount Conventional
38+4%
62-2%
West34.2 (+1)
Ontario48.0 (+7)
Québec34.6 (+1)
Maritimes14.7 (+20)
Based on *Grocery Composite
*Categories typically sold in a grocery storeSource: Nielsen Homescan, Grocery Watch, National, all channels, 52 weeks ending December 31, 2011, Grocery Composite
Hypermarketers in this country are expected to increase their sales an astonishing 7.2% per year until 2016xiv. Meanwhile, convenience stores face an increasingly tough competitive landscape, which has Euromonitor forecasting a compound annual growth rate for Canadian convenience stores of only 1.9% through to 2016.
Impact of technology
Competition among convenience stores is also becoming tougher as more technologies enter into the retail mix. Scanning is now generalized in supermarkets and pharmacies, enabling these competitors to gain access
to precious information about their customer purchase behaviour and implement lucrative and highly effective loyalty programs. Digital signage is also being introduced in many competing stores, allowing dynamic and efficient in-store promotion.
Competitors are now also adding what they refer to as convenience—the core value of the convenience store industry—to their offering through technology by embracing the mobile app revolution. For example, mobile apps are now being used to help consumers easily locate a pharmacy, ATM, or food store nearest to them. Initiatives such as Google Wallet will inevitably increase this trend toward higher technological sophistication.
Generally speaking, the digital gap between convenience stores and their competitors will increase, since convenience stores have traditionally lagged behind in technological adoption due to low margins and resulting inability to make investments. Moreover, the Food Marketing Institute reports that food retailers—grocery stores, supermarketers, hypermarkets, forecourt retailers, and discounters—increasingly recognize how social media can help them build relationships with current and
new customersxv, so they are raising their technological expenditures to make the digital leap.
However, given the proximity of convenience stores to their customers, it is doubtful their customers would shop less in convenience stores simply because technology allows them to locate competing stores. It is likely technological advancements such as social networks, digital signage, and loyalty programs could ultimately enable convenience stores to increase the number of shopper visits per week and capture a greater share of customers’ wallets at each visit.
Table 6FORECASTED ANNUAL SALES GROWTH IN GROCERY RETAILERS BY CATEGORY (% CONSTANT VALUE GROWTH 2011-2016)
Retailer Type2011-16 Forecasted Annual Growth Rate
(Compound)
2011-16 Total Forecasted Growth
MODERN GROCERY RETAILERS 2.2% 11.4%
- Convenience Stores 1.9% 9.9%
- Discounters 2.7% 14.2%
- Forecourt Retailers 0.7% 3.6%
- Hypermarketers 7.2% 41.3%
- Supermarkets 0.3% 1.6%
TRADITIONAL GROCERY RETAILERS 1.8% 9.5%
- Food/Drink/Tobacco Specialists 2.1% 10.8%
- Independent Small Grocers 1.6% 8.5%
- Other Grocery Retailers 1.5% 7.6%
GROCERY RETAILERS 2.1% 10.7%
Source: Euromonitor International from trade associations, trade press, company research, trade interviews, trade sources
Figure 17SHARE OF FOOD RETAILERS USING VARIOUS FORMS OF SOCIAL MEDIA
0.0%
10.0%
20.0%
30.0%
40.0%
50.0%
60.0%
70.0%
80.0%
90.0%
Facebook Twitter YouTube MySpace Texting Foursquare Blogs
77%
89%
27%
45%
4%
12%
37%
48%
NA
11%
29% 28%
62% 61%Share of Retailers 2010
Share of Retailers 2011
Source: FMI – The Food Retailing Industry Speaks 2011
Source: Conference Board of Canada. Results for 2012 include Jan-May Data
2012 NATIONAL INDUSTRY REPORT 212012 NATIONAL INDUSTRY REPORT 20
The credit card issue
A crucial issue facing convenience stores is credit and debit card fees. Canadian consumers are becoming more comfortable with debit and credit payments and pre-paid cards, even when making small ticket purchases, and are moving away from making ATM withdrawals. According to statistics from the Canadian Bankers Association, the number of transactions at ATMs declined by 3% in 2011 while the number of credit and charge cards1 has grown 10% to reach close to 86 million cards in circulation. The number of charge, credit, and debit card transactions is expected to grow 30% between now and 2016.
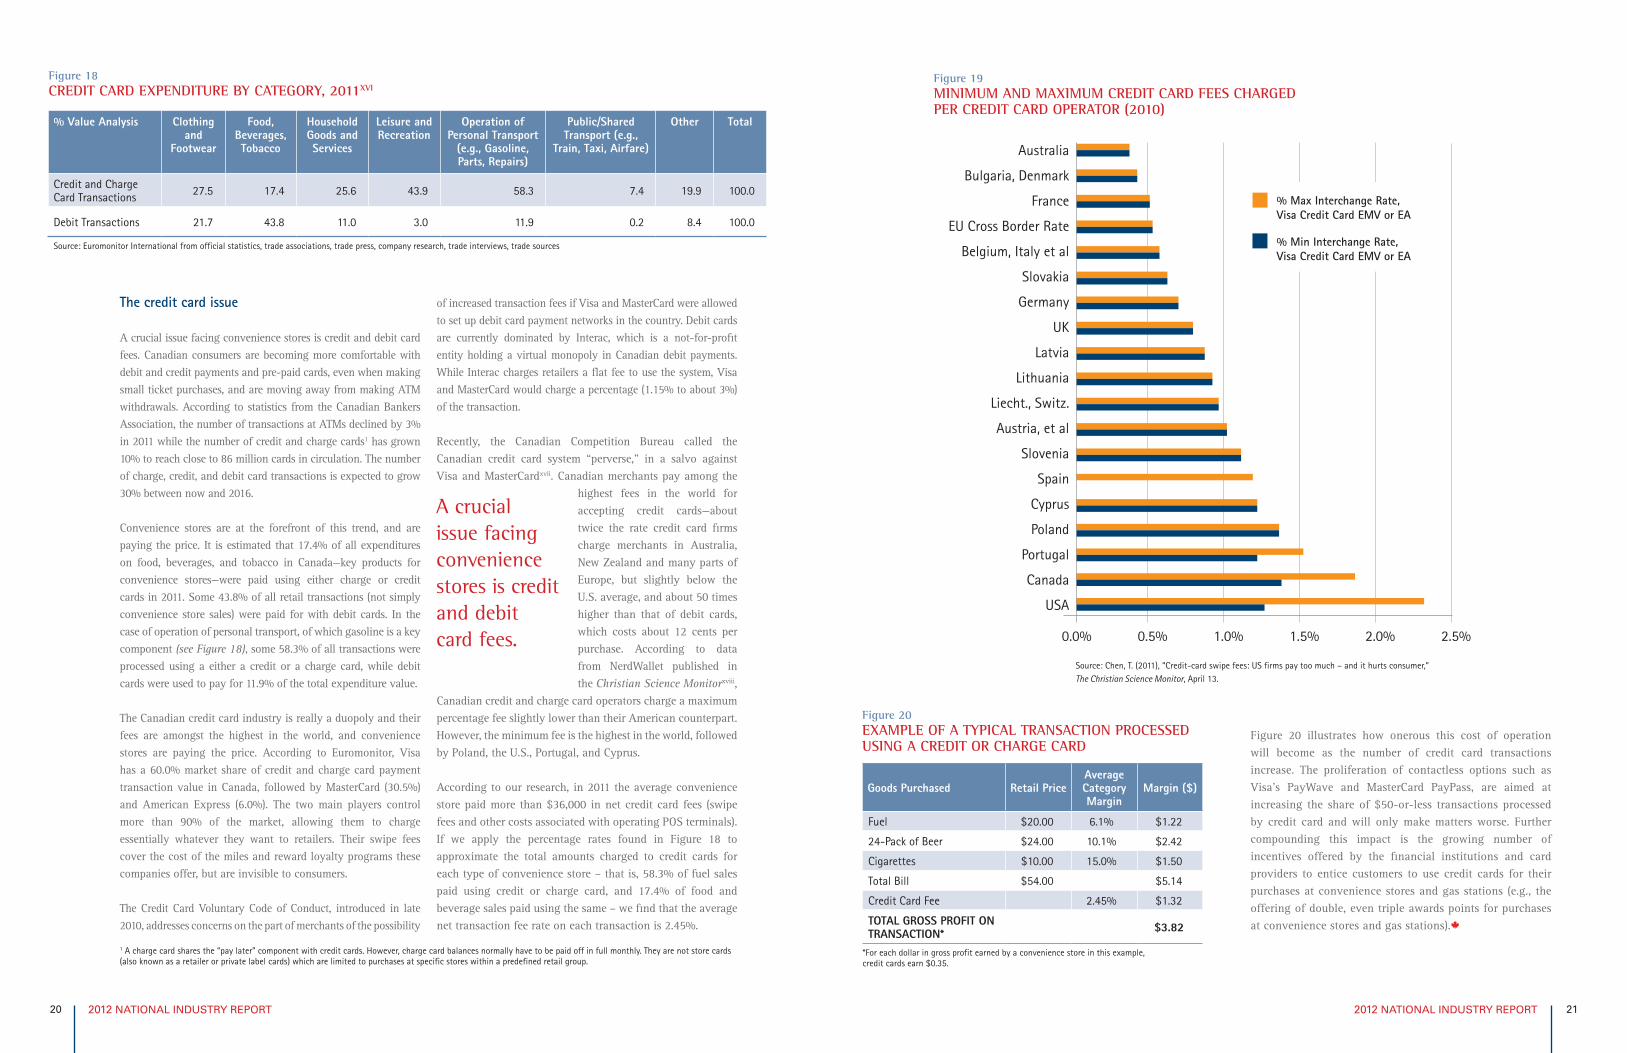
Convenience stores are at the forefront of this trend, and are paying the price. It is estimated that 17.4% of all expenditures on food, beverages, and tobacco in Canada—key products for convenience stores—were paid using either charge or credit cards in 2011. Some 43.8% of all retail transactions (not simply convenience store sales) were paid for with debit cards. In the case of operation of personal transport, of which gasoline is a key component (see Figure 18), some 58.3% of all transactions were processed using a either a credit or a charge card, while debit cards were used to pay for 11.9% of the total expenditure value.
The Canadian credit card industry is really a duopoly and their fees are amongst the highest in the world, and convenience stores are paying the price. According to Euromonitor, Visa has a 60.0% market share of credit and charge card payment transaction value in Canada, followed by MasterCard (30.5%) and American Express (6.0%). The two main players control more than 90% of the market, allowing them to charge essentially whatever they want to retailers. Their swipe fees cover the cost of the miles and reward loyalty programs these companies offer, but are invisible to consumers.
The Credit Card Voluntary Code of Conduct, introduced in late 2010, addresses concerns on the part of merchants of the possibility
of increased transaction fees if Visa and MasterCard were allowed to set up debit card payment networks in the country. Debit cards are currently dominated by Interac, which is a not-for-profit entity holding a virtual monopoly in Canadian debit payments. While Interac charges retailers a flat fee to use the system, Visa and MasterCard would charge a percentage (1.15% to about 3%) of the transaction.
Recently, the Canadian Competition Bureau called the Canadian credit card system “perverse,” in a salvo against Visa and MasterCardxvii. Canadian merchants pay among the
highest fees in the world for accepting credit cards—about twice the rate credit card firms charge merchants in Australia, New Zealand and many parts of Europe, but slightly below the U.S. average, and about 50 times higher than that of debit cards, which costs about 12 cents per purchase. According to data from NerdWallet published in the Christian Science Monitorxviii,
Canadian credit and charge card operators charge a maximum percentage fee slightly lower than their American counterpart. However, the minimum fee is the highest in the world, followed by Poland, the U.S., Portugal, and Cyprus.
According to our research, in 2011 the average convenience store paid more than $36,000 in net credit card fees (swipe fees and other costs associated with operating POS terminals). If we apply the percentage rates found in Figure 18 to approximate the total amounts charged to credit cards for each type of convenience store – that is, 58.3% of fuel sales paid using credit or charge card, and 17.4% of food and beverage sales paid using the same – we find that the average net transaction fee rate on each transaction is 2.45%.
A crucial issue facing convenience stores is credit and debit card fees.
Figure 18CREDIT CARD EXPENDITURE BY CATEGORY, 2011XVI
% Value Analysis Clothing and
Footwear
Food, Beverages, Tobacco
Household Goods and Services
Leisure and Recreation
Operation of Personal Transport
(e.g., Gasoline, Parts, Repairs)
Public/Shared Transport (e.g.,
Train, Taxi, Airfare)
Other Total
Credit and Charge Card Transactions 27.5 17.4 25.6 43.9 58.3 7.4 19.9 100.0
Debit Transactions 21.7 43.8 11.0 3.0 11.9 0.2 8.4 100.0
Source: Euromonitor International from official statistics, trade associations, trade press, company research, trade interviews, trade sources
1 A charge card shares the “pay later” component with credit cards. However, charge card balances normally have to be paid off in full monthly. They are not store cards (also known as a retailer or private label cards) which are limited to purchases at specific stores within a predefined retail group.
Figure 19MINIMUM AND MAXIMUM CREDIT CARD FEES CHARGED PER CREDIT CARD OPERATOR (2010)
Australia
Bulgaria, Denmark
France
EU Cross Border Rate
Belgium, Italy et al
Slovakia
Germany
UK
Latvia
Lithuania
Liecht., Switz.
Austria, et al
Slovenia
Spain
Cyprus
Poland
Portugal
Canada
USA
64
0.0% 0.5% 1.0% 1.5% 2.0% 2.5%
% Max Interchange Rate, Visa Credit Card EMV or EA
% Min Interchange Rate,Visa Credit Card EMV or EA
Figure 20 illustrates how onerous this cost of operation will become as the number of credit card transactions increase. The proliferation of contactless options such as Visa’s PayWave and MasterCard PayPass, are aimed at increasing the share of $50-or-less transactions processed by credit card and will only make matters worse. Further compounding this impact is the growing number of incentives offered by the financial institutions and card providers to entice customers to use credit cards for their purchases at convenience stores and gas stations (e.g., the offering of double, even triple awards points for purchases at convenience stores and gas stations).
Figure 20EXAMPLE OF A TYPICAL TRANSACTION PROCESSED USING A CREDIT OR CHARGE CARD
Goods Purchased Retail PriceAverage Category Margin
Margin ($)
Fuel $20.00 6.1% $1.22
24-Pack of Beer $24.00 10.1% $2.42
Cigarettes $10.00 15.0% $1.50
Total Bill $54.00 $5.14
Credit Card Fee 2.45% $1.32
TOTAL GROSS PROFIT ON TRANSACTION* $3.82
*For each dollar in gross profit earned by a convenience store in this example, credit cards earn $0.35.
Source: Chen, T. (2011), “Credit-card swipe fees: US firms pay too much – and it hurts consumer,” The Christian Science Monitor, April 13.
2012 NATIONAL INDUSTRY REPORT 232012 NATIONAL INDUSTRY REPORT 22
ARegulation—an obstacle to convenience store prosperity
According to a 2012 Canadian Retail Insights Report conducted by Harris/Decima on behalf of American Express Canadaxix, the top challenge food retailers face is the rising cost of doing business, a significant part of which relates to regulation.
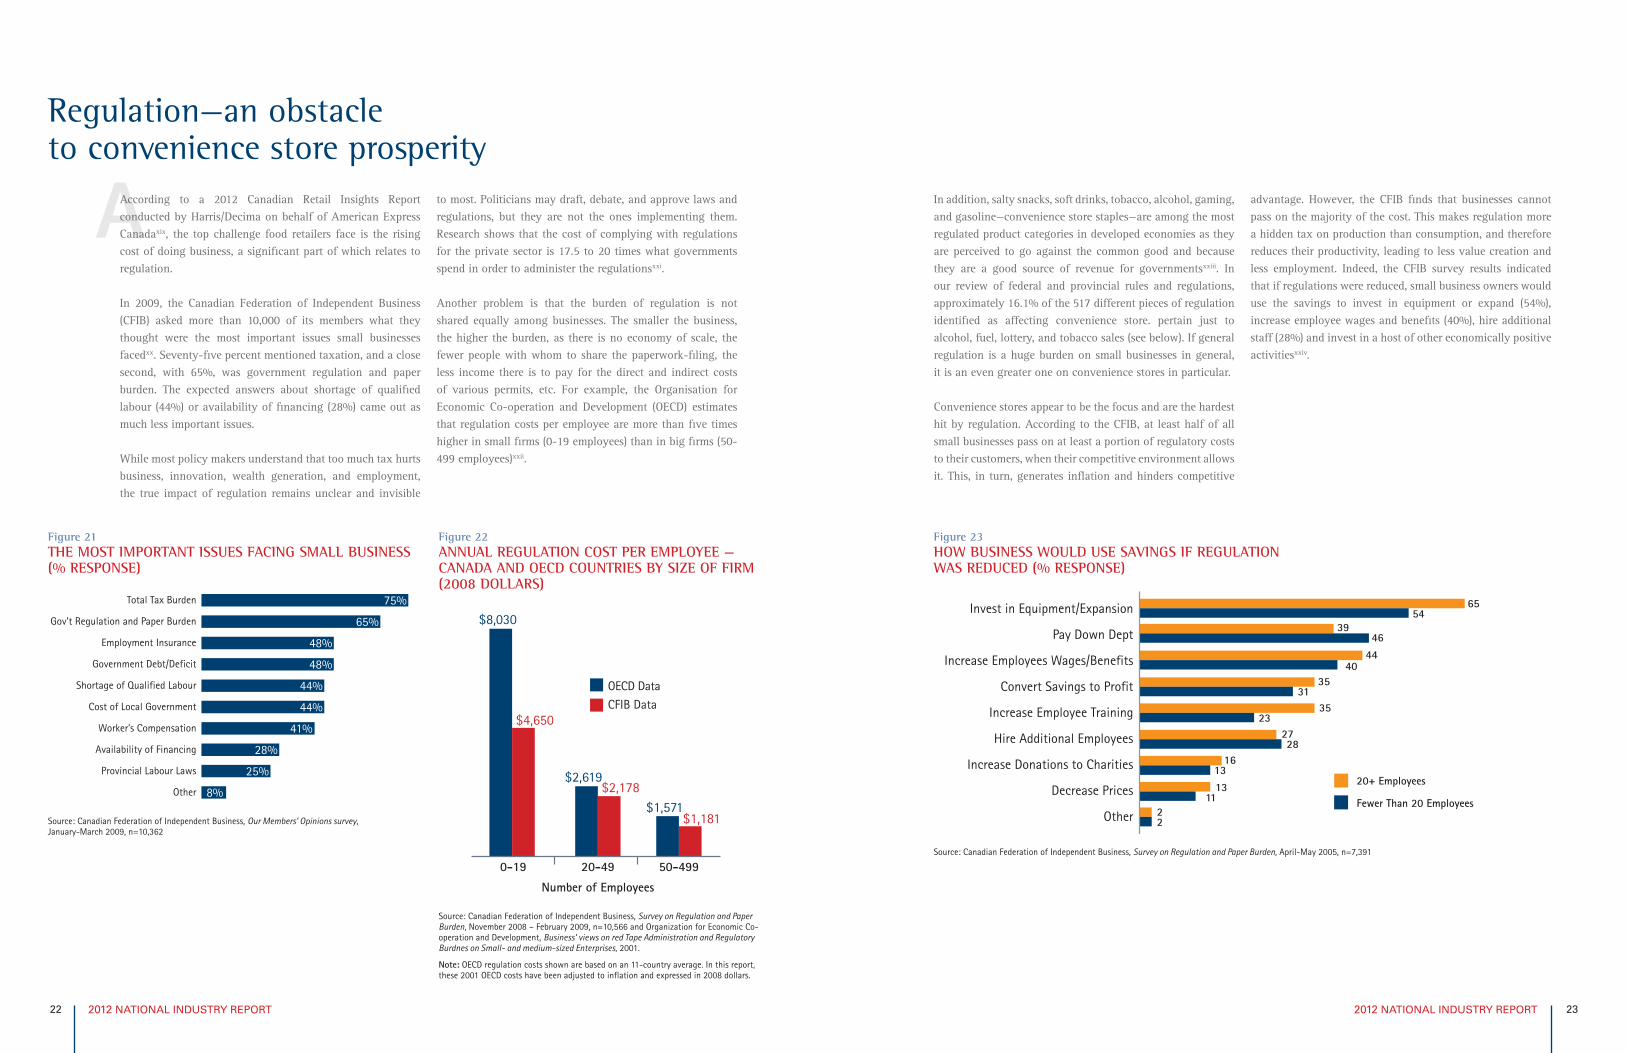
In 2009, the Canadian Federation of Independent Business (CFIB) asked more than 10,000 of its members what they thought were the most important issues small businesses facedxx. Seventy-five percent mentioned taxation, and a close second, with 65%, was government regulation and paper burden. The expected answers about shortage of qualified labour (44%) or availability of financing (28%) came out as much less important issues.
While most policy makers understand that too much tax hurts business, innovation, wealth generation, and employment, the true impact of regulation remains unclear and invisible
to most. Politicians may draft, debate, and approve laws and regulations, but they are not the ones implementing them. Research shows that the cost of complying with regulations for the private sector is 17.5 to 20 times what governments spend in order to administer the regulationsxxi.
Another problem is that the burden of regulation is not shared equally among businesses. The smaller the business, the higher the burden, as there is no economy of scale, the fewer people with whom to share the paperwork-filing, the less income there is to pay for the direct and indirect costs of various permits, etc. For example, the Organisation for Economic Co-operation and Development (OECD) estimates that regulation costs per employee are more than five times higher in small firms (0-19 employees) than in big firms (50-499 employees)xxii.
In addition, salty snacks, soft drinks, tobacco, alcohol, gaming, and gasoline—convenience store staples—are among the most regulated product categories in developed economies as they are perceived to go against the common good and because they are a good source of revenue for governmentsxxiii. In our review of federal and provincial rules and regulations, approximately 16.1% of the 517 different pieces of regulation identified as affecting convenience store. pertain just to alcohol, fuel, lottery, and tobacco sales (see below). If general regulation is a huge burden on small businesses in general, it is an even greater one on convenience stores in particular.
Convenience stores appear to be the focus and are the hardest hit by regulation. According to the CFIB, at least half of all small businesses pass on at least a portion of regulatory costs to their customers, when their competitive environment allows it. This, in turn, generates inflation and hinders competitive
advantage. However, the CFIB finds that businesses cannot pass on the majority of the cost. This makes regulation more a hidden tax on production than consumption, and therefore reduces their productivity, leading to less value creation and less employment. Indeed, the CFIB survey results indicated that if regulations were reduced, small business owners would use the savings to invest in equipment or expand (54%), increase employee wages and benefits (40%), hire additional staff (28%) and invest in a host of other economically positive activitiesxxiv.
Figure 21THE MOST IMPORTANT ISSUES FACING SMALL BUSINESS (% RESPONSE)
Total Tax Burden
Gov’t Regulation and Paper Burden
Employment Insurance
Government Debt/Deficit
Shortage of Qualified Labour
Cost of Local Government
Worker’s Compensation
Availability of Financing
Provincial Labour Laws
Other
64
75%
65%
48%
48%
44%
44%
41%
28%
25%
8%
Source: Canadian Federation of Independent Business, Our Members’ Opinions survey, January-March 2009, n=10,362
Figure 22ANNUAL REGULATION COST PER EMPLOYEE — CANADA AND OECD COUNTRIES BY SIZE OF FIRM (2008 DOLLARS)
$8,030
$4,650
$2,619$2,178
$1,571$1,181
0-19 20-49 50-499
OECD DataCFIB Data
Number of Employees
Source: Canadian Federation of Independent Business, Survey on Regulation and Paper Burden, November 2008 – February 2009, n=10,566 and Organization for Economic Co-operation and Development, Business’ views on red Tape Administration and Regulatory Burdnes on Small- and medium-sized Enterprises, 2001.
Note: OECD regulation costs shown are based on an 11-country average. In this report, these 2001 OECD costs have been adjusted to inflation and expressed in 2008 dollars.
Figure 23HOW BUSINESS WOULD USE SAVINGS IF REGULATION WAS REDUCED (% RESPONSE)
Invest in Equipment/Expansion
Pay Down Dept
Increase Employees Wages/Benefits
Convert Savings to Profit
Increase Employee Training
Hire Additional Employees
Increase Donations to Charities
Decrease Prices
Other
64
20+ Employees
Fewer Than 20 Employees22
1311
1613
2728
3523
3531
4440
3946
6554
Source: Canadian Federation of Independent Business, Survey on Regulation and Paper Burden, April-May 2005, n=7,391
2012 NATIONAL INDUSTRY REPORT 252012 NATIONAL INDUSTRY REPORT 24
To clarify the impact of regulation within the context of the convenience store industry, the Canadian Convenience Stores Association undertook a vast project to assess the costs and overall burden of regulation for convenience storesxxv. The goal was to come up with some form of measurement of the direct and indirect costs convenience stores have to assume to comply with regulation.
Three methods to quantify the burden of regulationComing up with a dollar figure representing the cost of regulation for convenience stores is not an easy task. Academics, governments, and various organizations have tried to quantify the burden of regulation in various industries using three main methods:
1. The first method takes into consideration the number of regulations that businesses in a given situation must comply with. This very crude method is simple and has shown for instance that, in 2009, federal rules and regulations totalled slightly over 328,000 different requirements;
2. A second method, based on time, surveys the number of hours businesses spend reporting information, finding and filling out forms, submitting information, etc. Using this method, the province of Nova Scotia estimates that, in 2008, businesses spent 564,000 hours dealing with regulations.
3. The third and possibly most accurate method, used by several European countries including the U.K., Germany, France, the Netherlands, and Denmark, is called the Standard Cost Model. It first breaks down regulations into measurable components and then estimates the cost of dealing with each of these components either through surveys or through direct assessment by civil servants. Although this method provides precise information about the direct costs associated with each piece of regulation, it is extremely demanding on human resources.
Two clusters of provinces
As a first crude step, we developed a comprehensive inventory of federal and provincial laws and regulations that convenience stores must comply with across the country. We grouped these laws and regulations according to product category (e.g., lottery, tobacco, food and beverage, alcohol, and fuel) and the general focus of the regulations (e.g., human resources, etc.).
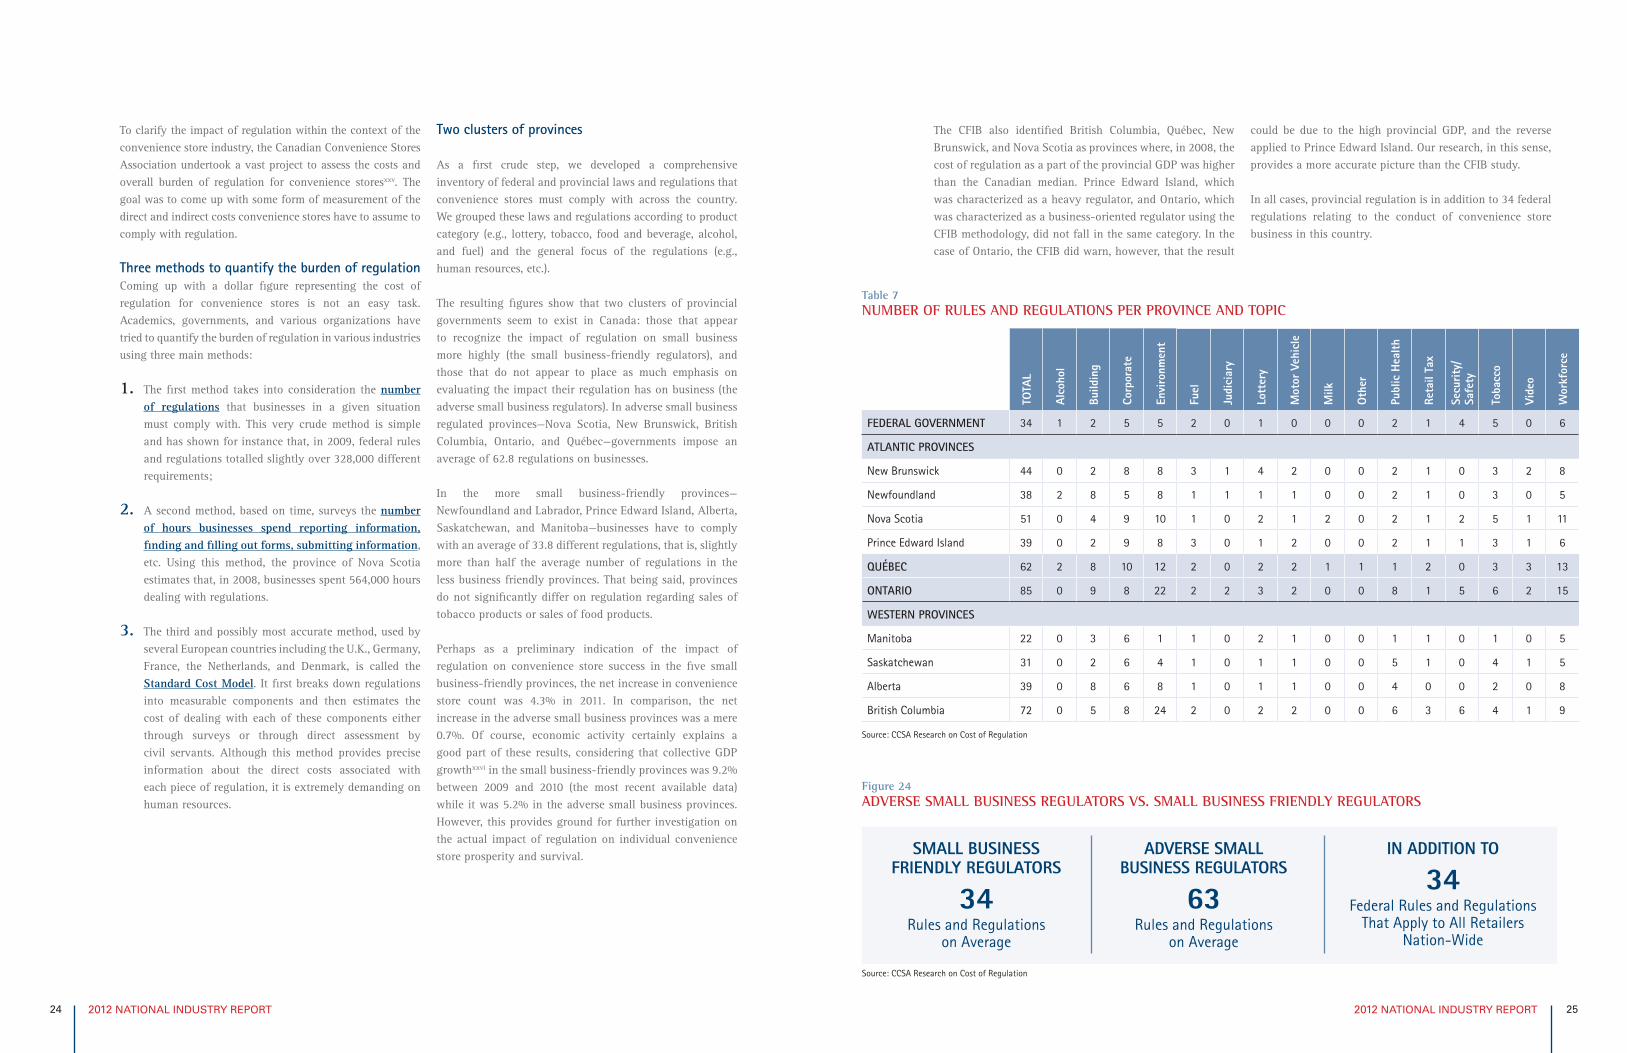
The resulting figures show that two clusters of provincial governments seem to exist in Canada: those that appear to recognize the impact of regulation on small business more highly (the small business-friendly regulators), and those that do not appear to place as much emphasis on evaluating the impact their regulation has on business (the adverse small business regulators). In adverse small business regulated provinces—Nova Scotia, New Brunswick, British Columbia, Ontario, and Québec—governments impose an average of 62.8 regulations on businesses.
In the more small business-friendly provinces—Newfoundland and Labrador, Prince Edward Island, Alberta, Saskatchewan, and Manitoba—businesses have to comply with an average of 33.8 different regulations, that is, slightly more than half the average number of regulations in the less business friendly provinces. That being said, provinces do not significantly differ on regulation regarding sales of tobacco products or sales of food products.
Perhaps as a preliminary indication of the impact of regulation on convenience store success in the five small business-friendly provinces, the net increase in convenience store count was 4.3% in 2011. In comparison, the net increase in the adverse small business provinces was a mere 0.7%. Of course, economic activity certainly explains a good part of these results, considering that collective GDP growthxxvi in the small business-friendly provinces was 9.2% between 2009 and 2010 (the most recent available data) while it was 5.2% in the adverse small business provinces. However, this provides ground for further investigation on the actual impact of regulation on individual convenience store prosperity and survival.
Table 7NUMBER OF RULES AND REGULATIONS PER PROVINCE AND TOPIC
TOTA
L
Alco
hol
Build
ing
Corp
orat
e
Envi
ronm
ent
Fuel
Judi
ciar
y
Lott
ery
Mot
or V
ehic
le
Milk
Oth
er
Publ
ic H
ealt
h
Reta
il Ta
x
Secu
rity/
Sa
fety
Toba
cco
Vide
o
Wor
kfor
ce
FEDERAL GOVERNMENT 34 1 2 5 5 2 0 1 0 0 0 2 1 4 5 0 6
ATLANTIC PROVINCES
New Brunswick 44 0 2 8 8 3 1 4 2 0 0 2 1 0 3 2 8
Newfoundland 38 2 8 5 8 1 1 1 1 0 0 2 1 0 3 0 5
Nova Scotia 51 0 4 9 10 1 0 2 1 2 0 2 1 2 5 1 11
Prince Edward Island 39 0 2 9 8 3 0 1 2 0 0 2 1 1 3 1 6
QUÉBEC 62 2 8 10 12 2 0 2 2 1 1 1 2 0 3 3 13
ONTARIO 85 0 9 8 22 2 2 3 2 0 0 8 1 5 6 2 15
WESTERN PROVINCES
Manitoba 22 0 3 6 1 1 0 2 1 0 0 1 1 0 1 0 5
Saskatchewan 31 0 2 6 4 1 0 1 1 0 0 5 1 0 4 1 5
Alberta 39 0 8 6 8 1 0 1 1 0 0 4 0 0 2 0 8
British Columbia 72 0 5 8 24 2 0 2 2 0 0 6 3 6 4 1 9
The CFIB also identified British Columbia, Québec, New Brunswick, and Nova Scotia as provinces where, in 2008, the cost of regulation as a part of the provincial GDP was higher than the Canadian median. Prince Edward Island, which was characterized as a heavy regulator, and Ontario, which was characterized as a business-oriented regulator using the CFIB methodology, did not fall in the same category. In the case of Ontario, the CFIB did warn, however, that the result
could be due to the high provincial GDP, and the reverse applied to Prince Edward Island. Our research, in this sense, provides a more accurate picture than the CFIB study. In all cases, provincial regulation is in addition to 34 federal regulations relating to the conduct of convenience store business in this country.
Figure 24ADVERSE SMALL BUSINESS REGULATORS VS. SMALL BUSINESS FRIENDLY REGULATORS
SMALL BUSINESS FRIENDLY REGULATORS
34Rules and Regulations
on Average
ADVERSE SMALL BUSINESS REGULATORS
63Rules and Regulations
on Average
IN ADDITION TO
34Federal Rules and Regulations
That Apply to All Retailers Nation-Wide
Source: CCSA Research on Cost of Regulation
Source: CCSA Research on Cost of Regulation
2012 NATIONAL INDUSTRY REPORT 272012 NATIONAL INDUSTRY REPORT 26
High cost of regulation for Canadian convenience stores
A country-wide survey with a representative sample of independent and chain convenience stores was conducted to determine the cost of regulation on Canadian convenience stores. We asked retailers about their perceptions of regulation and how much of a burden, in terms of time and hard cash, the various regulations had on their business operations.
Our methodology followed a modelxxvii that considers both direct costs and indirect effects through the amount of time c-store owners and operators have to invest in dealing and
complying with regulation. To translate the indirect effects (consisting of time consumed) into hard cash figures, we multiplied the reported amount of hours by a factor consisting of the average hourly earnings for employees in management occupationsxxviii: $35.22 an hour.
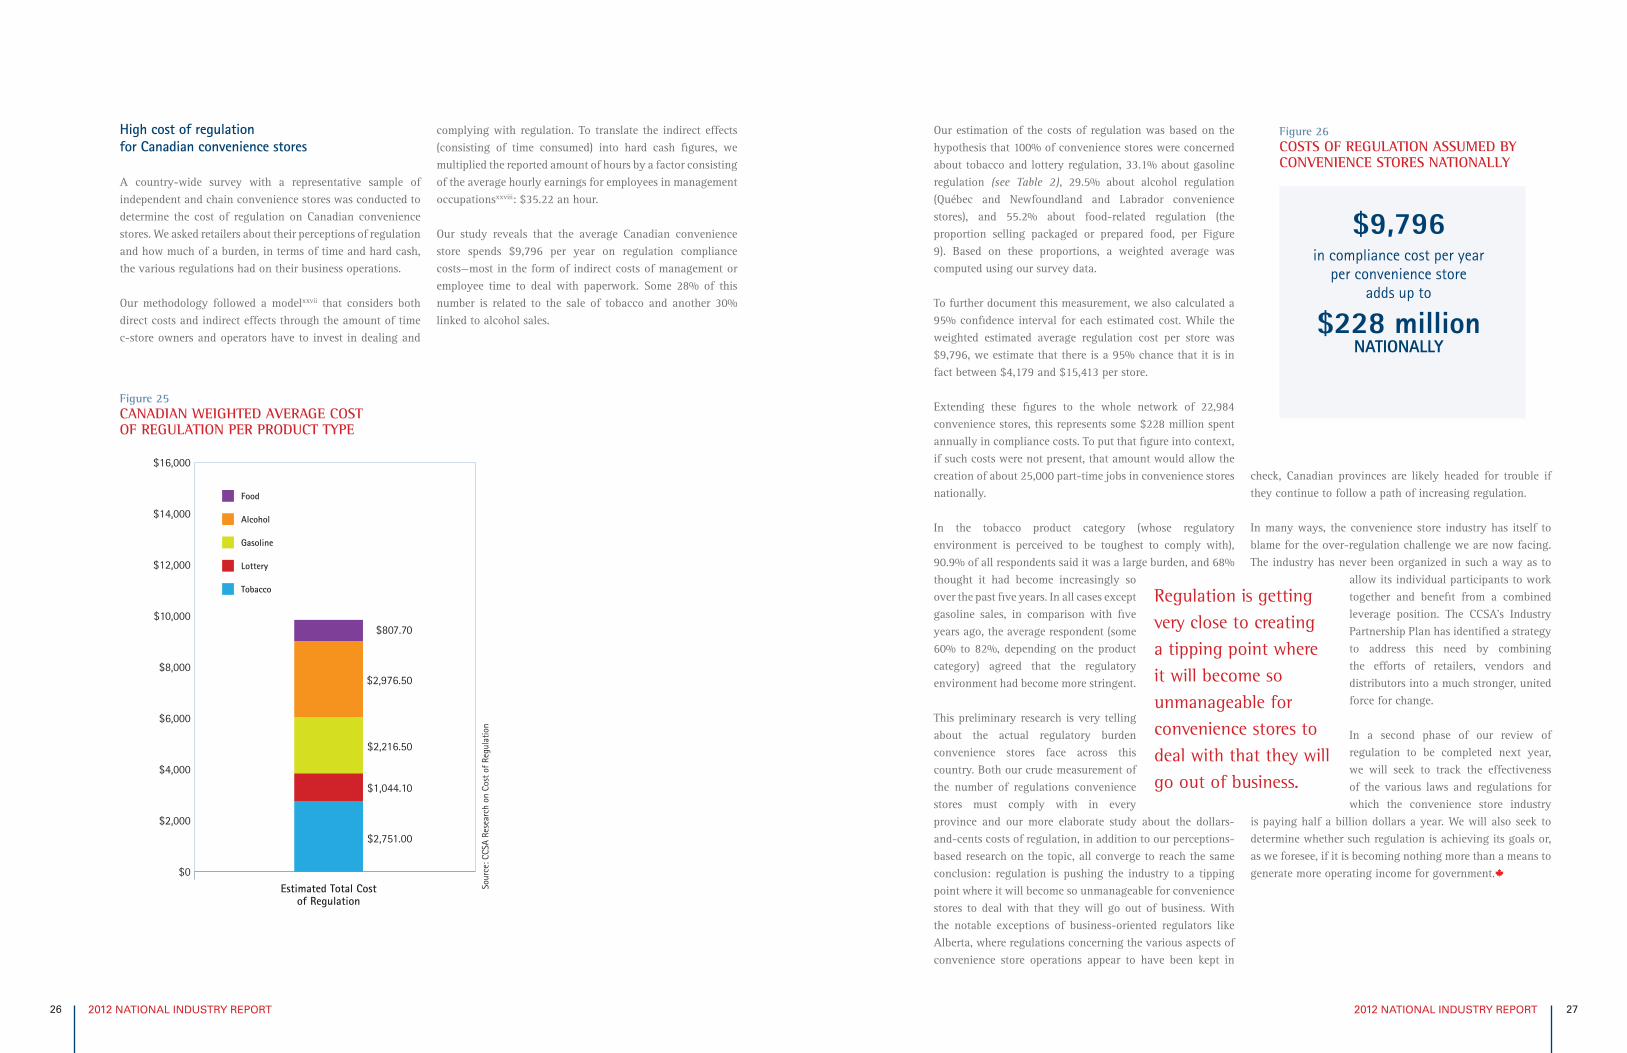
Our study reveals that the average Canadian convenience store spends $9,796 per year on regulation compliance costs—most in the form of indirect costs of management or employee time to deal with paperwork. Some 28% of this number is related to the sale of tobacco and another 30% linked to alcohol sales.
Our estimation of the costs of regulation was based on the hypothesis that 100% of convenience stores were concerned about tobacco and lottery regulation, 33.1% about gasoline regulation (see Table 2), 29.5% about alcohol regulation (Québec and Newfoundland and Labrador convenience stores), and 55.2% about food-related regulation (the proportion selling packaged or prepared food, per Figure 9). Based on these proportions, a weighted average was computed using our survey data.
To further document this measurement, we also calculated a 95% confidence interval for each estimated cost. While the weighted estimated average regulation cost per store was $9,796, we estimate that there is a 95% chance that it is in fact between $4,179 and $15,413 per store.
Extending these figures to the whole network of 22,984 convenience stores, this represents some $228 million spent annually in compliance costs. To put that figure into context, if such costs were not present, that amount would allow the creation of about 25,000 part-time jobs in convenience stores nationally.
In the tobacco product category (whose regulatory environment is perceived to be toughest to comply with), 90.9% of all respondents said it was a large burden, and 68% thought it had become increasingly so over the past five years. In all cases except gasoline sales, in comparison with five years ago, the average respondent (some 60% to 82%, depending on the product category) agreed that the regulatory environment had become more stringent.
This preliminary research is very telling about the actual regulatory burden convenience stores face across this country. Both our crude measurement of the number of regulations convenience stores must comply with in every province and our more elaborate study about the dollars-and-cents costs of regulation, in addition to our perceptions-based research on the topic, all converge to reach the same conclusion: regulation is pushing the industry to a tipping point where it will become so unmanageable for convenience stores to deal with that they will go out of business. With the notable exceptions of business-oriented regulators like Alberta, where regulations concerning the various aspects of convenience store operations appear to have been kept in
check, Canadian provinces are likely headed for trouble if they continue to follow a path of increasing regulation.
In many ways, the convenience store industry has itself to blame for the over-regulation challenge we are now facing. The industry has never been organized in such a way as to
allow its individual participants to work together and benefit from a combined leverage position. The CCSA’s Industry Partnership Plan has identified a strategy to address this need by combining the efforts of retailers, vendors and distributors into a much stronger, united force for change.
In a second phase of our review of regulation to be completed next year, we will seek to track the effectiveness of the various laws and regulations for which the convenience store industry
is paying half a billion dollars a year. We will also seek to determine whether such regulation is achieving its goals or, as we foresee, if it is becoming nothing more than a means to generate more operating income for government.
Figure 25CANADIAN WEIGHTED AVERAGE COST OF REGULATION PER PRODUCT TYPE
$0
$2,000
$4,000
$6,000
$8,000
$10,000
$12,000
$14,000
$16,000
Min (95% confidenceinterval)
Max (95% confidenceinterval)
Estimated Total Costof Regulation
Food
Alcohol
Gasoline
Lottery
Tobacco
$195.50
$1,437.60
$1,105.10
$267.10
$1,173.70
$807.70
$2,976.50
$2,216.50
$1,044.10
$2,751.00
$1,419.90
$4,515.50
$3,327.90
$1,821.00
$4,328.30
Figure 26COSTS OF REGULATION ASSUMED BY CONVENIENCE STORES NATIONALLY
$9,796in compliance cost per year
per convenience storeadds up to
$228 millionNATIONALLY
Regulation is getting very close to creating a tipping point where it will become so unmanageable for convenience stores to deal with that they will go out of business.
Sour
ce: C
CSA
Rese
arch
on
Cost
of R
egul
atio
n
2012 NATIONAL INDUSTRY REPORT 292012 NATIONAL INDUSTRY REPORT 28
TConclusion and Challenges
In retrospect, 2011 was not a bad year. The network grew and the industry was, as a whole, profitable despite economic and other challenges.
Three notable challenges remain on the radar
Contraband tobacco sales, costing convenience stores some $2.5 billion in sales, considering 15% average margins on cigarettes translates into $375 million in lost profit. Credit card fees, with an average of $36,000 in fees paid by each store, represent yet another $850 million the convenience store industry is not capturing. And regulatory costs, with a collective price tag of $228 million, are keeping us up at night. These three challenges have created an estimated $1.5 billion a year in impediments to growth.
Despite the tough 2011 climate the convenience store industry managed to post a collective profit of $1 billion
last year. One can only imagine the level of prosperity the convenience store industry could have achieved had these three key challenges been more effectively addressed. Capturing just a fraction of these lost revenues would have made a significant impact not only on the industry through investment in human resources, equipment and technology, but also on the people of Canada through greater employment and revenue generation.
The Canadian Convenience Stores Association will continue to monitor the situation and will keep on digging and drilling down on the regulation issues. We plan to investigate and address the issue of lack of cross-provincial legislative harmonization and how that impacts the chains that operate sites in multiple jurisdictions.
We will also keep an eye out when new regulation threatens to turn up. Some of the more notable examples include the following:
• InOctober 2011,Denmarkmoved forward and imposeda new tax on foods high in saturated fat despite the fact that most medical professionals no longer believe that fat is a top public enemyxxix.
• In late 2011, France also approved a “fat tax” on sugarysoft drinks in a bid to combat soaring child obesity … and boost state coffers. The new measures — a hike of from 3 to 6 euro cents per litre on sugary drinks – are expected to raise more than €128 million a year for government coffersxxx.
• In the U.S., Illinois announced a $1-per-pack tax increaseon cigarettes last May.
• NewYorkismovingforwardtobanlargesoftdrinksfromrestaurants, movie theatres, and street carts.
While convenience stores would have been exempt from this last regulation had it been introduced, this is clearly indicative of a trend: small businesses, such as convenience stores, will once again pick up the bulk of the tab in the fight against so-called social problems ranging from tobacco consumption to obesity and diabetes.
We will also question the very foundation of many of the rules and regulations in place. While no one can be against virtue and morality, it appears more and more likely that many of the taxes, permits, licences, and regulations currently imposed across Canada have not met their intended original purpose. As a result, many are now seen either as a means to generate additional operating revenue for the government or as a way to attack certain products without proper evidence or justification for such attacks. If it’s a tax, it should be called a tax. Regulation should serve public interest—not government budgets or political agendas.
We have no choice: either we fight back or we let ourselves be regulated out of business.
We will also question the very foundation of many of the rules and regulations in place.
IMessage from the ACSA regional president
The mission statement of the Atlantic Convenience Stores Association (ACSA) is to help ensure an economically viable and sustainable business environment for members by serving the best interests of Atlantic Canada’s convenience
store operators and consumers alike through advocacy, advice, education, and training. We are very pleased to be part of the Canadian Convenience Stores Association (CCSA) and to be included in this annual report. We thank CCSA President Alex Scholten for all his work and leadership in pulling together our important state of the industry report. We hope you find the highlights of the work in our region useful, and we would be pleased to discuss these or any other matters with you.
The past 12 months have been our association’s busiest and most productive yet with a number of projects that can be summarized under five key categories:
Retail gasolineIn 2011, the ACSA was the lead applicant for increases in retail gasoline margins in New Brunswick. The association also actively supported an application for increases in retail gasoline margins in Nova Scotia. In both cases, thanks to the support of grassroots
retailers, and well developed business cases that were presented to regulators and the media, increases were approved. And while the industry is always playing catch-up, the increases represent millions of dollars in additional margins for gasoline retailers in these provinces.
In 2012, initiatives will be undertaken to gain retail gasoline margin increases in both Prince Edward Island and Newfoundland and Labrador. In New Brunswick, the ACSA is persistent in lobbying the provincial government to conduct a proper review of an inadequate regulated
gasoline industry and to address the huge negative economic impact that predatory pricing practices in a regulated system are having on our membership.
Beverage alcoholIn 2011, the ACSA led a lobbying initiative in Newfoundland and Labrador that resulted in the first increase ever in the flat-rate commissions paid on retail beer sold by brewers’ agents, most of
whom are convenience stores. The profitability of beer retailing is not where it should be, however, and the ACSA continues to lobby the provincial government for improvements.
The ACSA also took on an advocacy role in Prince Edward Island in response to indications that the provincial liquor commission and the provincial government were considering expanding beverage alcohol retail distribution in the province through the addition of private sector agency outlets. The PEI LCC plans to expand its sales through private operators in 2012 and has been listening to the ACSA’s input on the best means to do this.
Contraband tobacco The sale and purchase of contraband tobacco are illegal and hurt convenience store sales. The ACSA quarterbacked the completion of a contraband tobacco study in 2011 that was a follow-up to a 2010 study, and used the results to lobby provincial government officials about the need for more provincial resources to fight the availability of contraband tobacco. Plans are in place for another follow-up study in 2012.
Minimum wageC-store operators in all of the Atlantic provinces have been hard hit by 25% to 30% increases in provincial minimum wages in just a few short years. While the pace of the increases has settled down, the ACSA is lobbying hard for provincial governments to take a common sense approach to future minimum wage increase reviews.
Membership engagementAn important goal for the ACSA in 2011 was to do more to engage members and raise the overall profile of the association. ACSA President Mike Hammoud criss-crossed Atlantic Canada meeting c-store operators, and the association expanded its grassroots program to get more members involved at the local level in lobbying provincial governments. There’s still a lot of potential with the membership that the ACSA hasn’t tapped into, so membership engagement remains a high priority.
All in all, the ACSA is holding true to its roles of advocacy, advice, education and training. Many positive results have been achieved, but there is also much more that can be accomplished to support the convenience store industry in Atlantic Canada. We look forward to hearing from our members, suppliers and customers in Atlantic Canada as we work to make the industry more vibrant and valuable for all.
Many positive results
have been achieved,
but there is also
much more that can
be accomplished
to support the
convenience store
industry in Atlantic
Canada.
Mike Hammoud President, ACSA
Regional (ACSA)
2012 NATIONAL INDUSTRY REPORT 312012 NATIONAL INDUSTRY REPORT 30
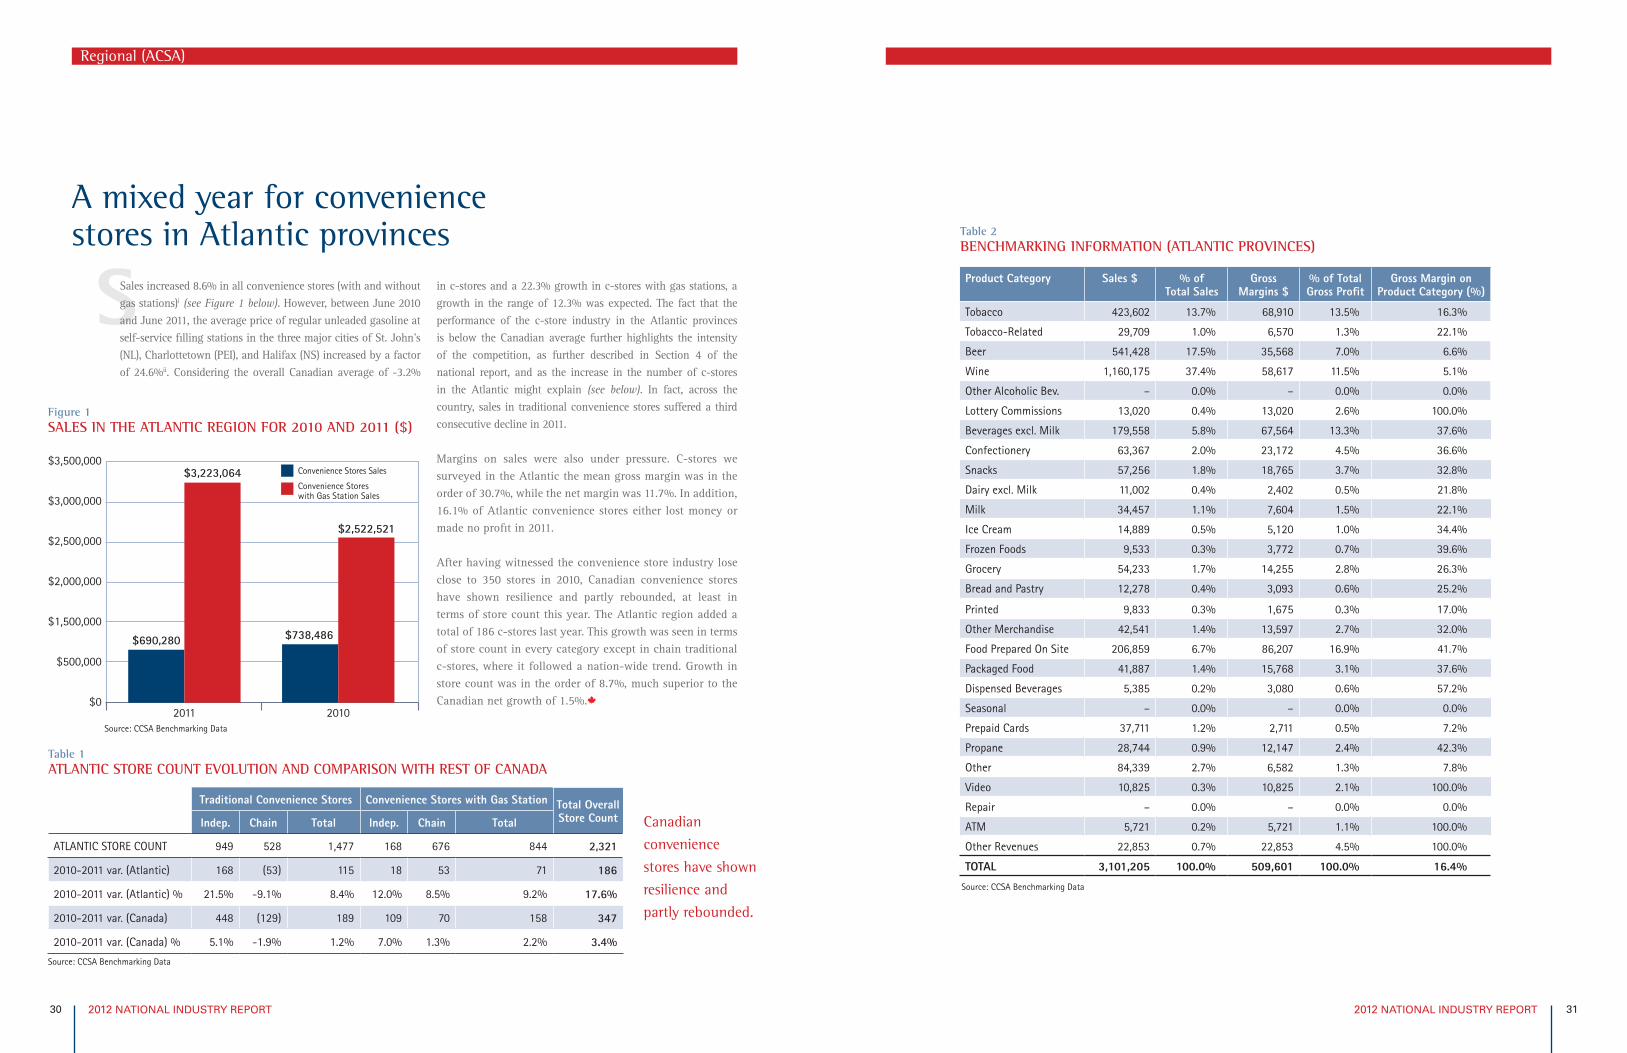
SA mixed year for convenience stores in Atlantic provinces
Sales increased 8.6% in all convenience stores (with and without gas stations)i (see Figure 1 below). However, between June 2010 and June 2011, the average price of regular unleaded gasoline at self-service filling stations in the three major cities of St. John’s (NL), Charlottetown (PEI), and Halifax (NS) increased by a factor of 24.6%ii. Considering the overall Canadian average of -3.2%
in c-stores and a 22.3% growth in c-stores with gas stations, a growth in the range of 12.3% was expected. The fact that the performance of the c-store industry in the Atlantic provinces is below the Canadian average further highlights the intensity of the competition, as further described in Section 4 of the national report, and as the increase in the number of c-stores in the Atlantic might explain (see below). In fact, across the country, sales in traditional convenience stores suffered a third consecutive decline in 2011.
Margins on sales were also under pressure. C-stores we surveyed in the Atlantic the mean gross margin was in the order of 30.7%, while the net margin was 11.7%. In addition, 16.1% of Atlantic convenience stores either lost money or made no profit in 2011.
After having witnessed the convenience store industry lose close to 350 stores in 2010, Canadian convenience stores have shown resilience and partly rebounded, at least in terms of store count this year. The Atlantic region added a total of 186 c-stores last year. This growth was seen in terms of store count in every category except in chain traditional c-stores, where it followed a nation-wide trend. Growth in store count was in the order of 8.7%, much superior to the Canadian net growth of 1.5%.
Figure 1SALES IN THE ATLANTIC REGION FOR 2010 AND 2011 ($)
$0
$500,000
$1,500,000
$2,000,000
$2,500,000
$3,000,000
$3,500,000
2011 2010
$690,280
$3,223,064
$738,486
$2,522,521
Convenience Stores Sales
Convenience Stores with Gas Station Sales
Table 1ATLANTIC STORE COUNT EVOLUTION AND COMPARISON WITH REST OF CANADA
Traditional Convenience Stores Convenience Stores with Gas Station Total Overall Store CountIndep. Chain Total Indep. Chain Total
ATLANTIC STORE COUNT 949 528 1,477 168 676 844 2,321
2010-2011 var. (Atlantic) 168 (53) 115 18 53 71 186
2010-2011 var. (Atlantic) % 21.5% -9.1% 8.4% 12.0% 8.5% 9.2% 17.6%
2010-2011 var. (Canada) 448 (129) 189 109 70 158 347
2010-2011 var. (Canada) % 5.1% -1.9% 1.2% 7.0% 1.3% 2.2% 3.4%
Canadian
convenience
stores have shown
resilience and
partly rebounded.
Regional (ACSA)
Table 2BENCHMARKING INFORMATION (ATLANTIC PROVINCES)
Product Category Sales $ % of Total Sales
GrossMargins $
% of Total Gross Profit
Gross Margin on Product Category (%)
Tobacco 423,602 13.7% 68,910 13.5% 16.3%
Tobacco-Related 29,709 1.0% 6,570 1.3% 22.1%
Beer 541,428 17.5% 35,568 7.0% 6.6%
Wine 1,160,175 37.4% 58,617 11.5% 5.1%
Other Alcoholic Bev. – 0.0% – 0.0% 0.0%
Lottery Commissions 13,020 0.4% 13,020 2.6% 100.0%
Beverages excl. Milk 179,558 5.8% 67,564 13.3% 37.6%
Confectionery 63,367 2.0% 23,172 4.5% 36.6%
Snacks 57,256 1.8% 18,765 3.7% 32.8%
Dairy excl. Milk 11,002 0.4% 2,402 0.5% 21.8%
Milk 34,457 1.1% 7,604 1.5% 22.1%
Ice Cream 14,889 0.5% 5,120 1.0% 34.4%
Frozen Foods 9,533 0.3% 3,772 0.7% 39.6%
Grocery 54,233 1.7% 14,255 2.8% 26.3%
Bread and Pastry 12,278 0.4% 3,093 0.6% 25.2%
Printed 9,833 0.3% 1,675 0.3% 17.0%
Other Merchandise 42,541 1.4% 13,597 2.7% 32.0%
Food Prepared On Site 206,859 6.7% 86,207 16.9% 41.7%
Packaged Food 41,887 1.4% 15,768 3.1% 37.6%
Dispensed Beverages 5,385 0.2% 3,080 0.6% 57.2%
Seasonal – 0.0% – 0.0% 0.0%
Prepaid Cards 37,711 1.2% 2,711 0.5% 7.2%
Propane 28,744 0.9% 12,147 2.4% 42.3%
Other 84,339 2.7% 6,582 1.3% 7.8%
Video 10,825 0.3% 10,825 2.1% 100.0%
Repair – 0.0% – 0.0% 0.0%
ATM 5,721 0.2% 5,721 1.1% 100.0%
Other Revenues 22,853 0.7% 22,853 4.5% 100.0%
TOTAL 3,101,205 100.0% 509,601 100.0% 16.4%
Source: CCSA Benchmarking Data
Source: CCSA Benchmarking Data
Source: CCSA Benchmarking Data
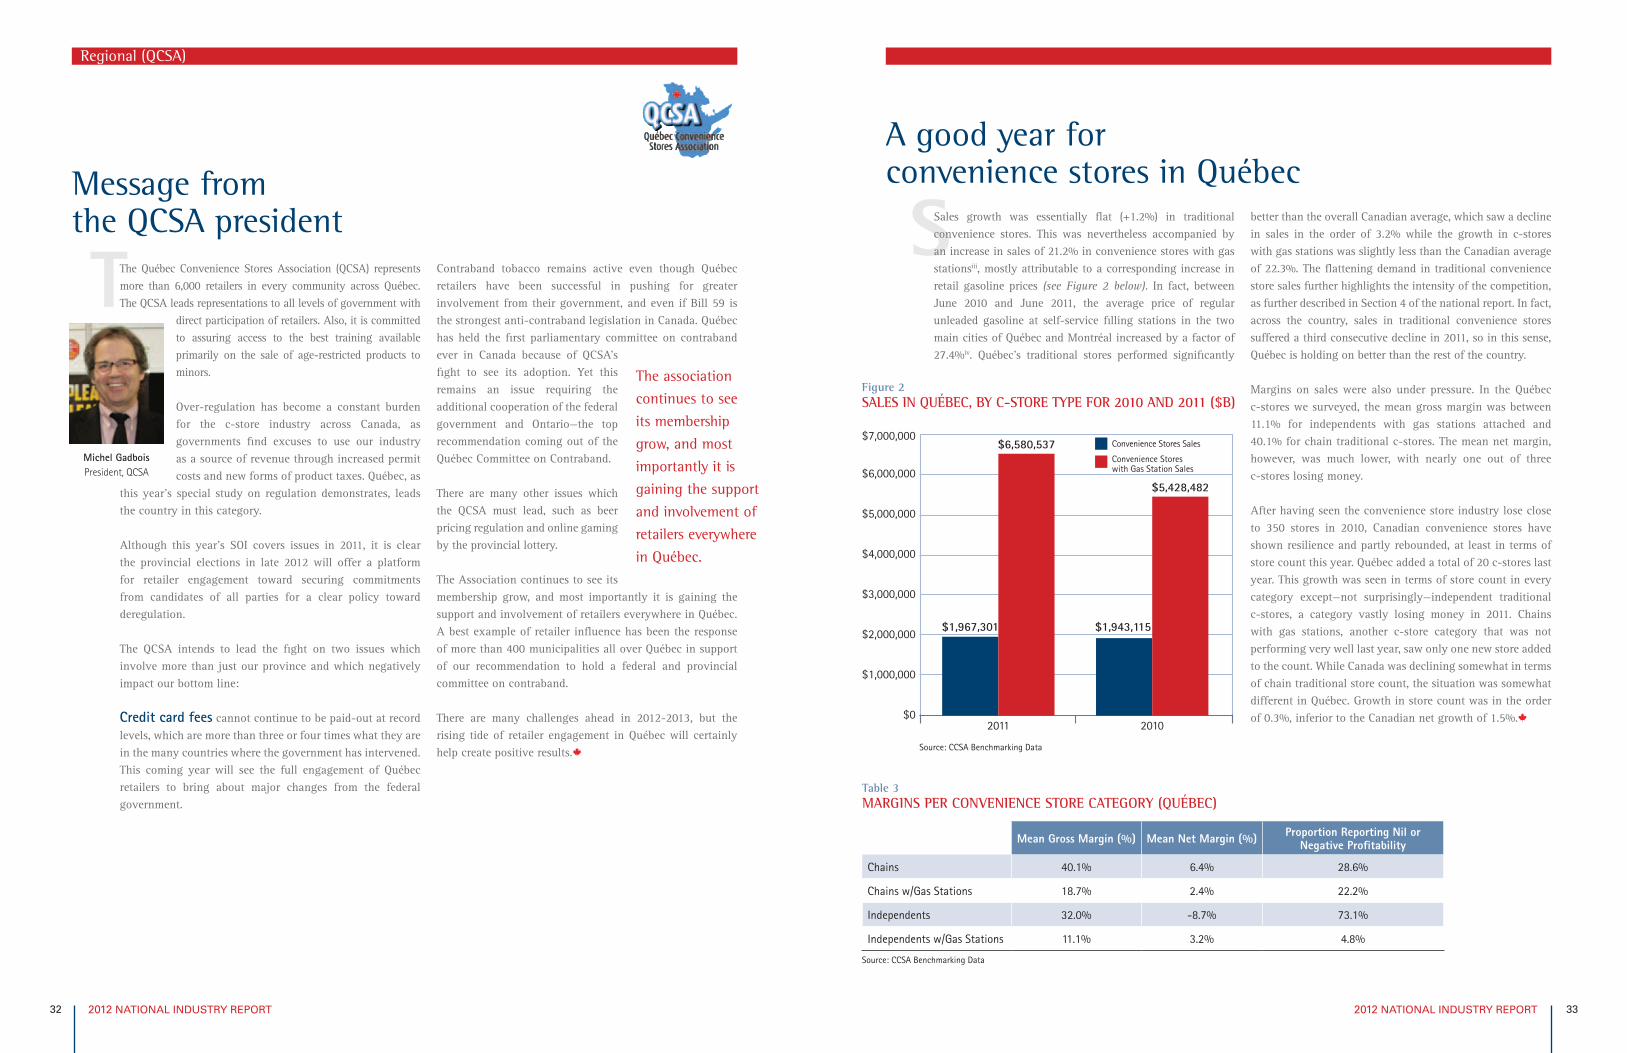
2012 NATIONAL INDUSTRY REPORT 332012 NATIONAL INDUSTRY REPORT 32
ST
Message from the QCSA president
The Québec Convenience Stores Association (QCSA) represents more than 6,000 retailers in every community across Québec. The QCSA leads representations to all levels of government with
direct participation of retailers. Also, it is committed to assuring access to the best training available primarily on the sale of age-restricted products to minors.
Over-regulation has become a constant burden for the c-store industry across Canada, as governments find excuses to use our industry as a source of revenue through increased permit costs and new forms of product taxes. Québec, as
this year’s special study on regulation demonstrates, leads the country in this category.
Although this year’s SOI covers issues in 2011, it is clear the provincial elections in late 2012 will offer a platform for retailer engagement toward securing commitments from candidates of all parties for a clear policy toward deregulation.
The QCSA intends to lead the fight on two issues which involve more than just our province and which negatively impact our bottom line:
Credit card fees cannot continue to be paid-out at record levels, which are more than three or four times what they are in the many countries where the government has intervened. This coming year will see the full engagement of Québec retailers to bring about major changes from the federal government.
Contraband tobacco remains active even though Québec retailers have been successful in pushing for greater involvement from their government, and even if Bill 59 is the strongest anti-contraband legislation in Canada. Québec has held the first parliamentary committee on contraband ever in Canada because of QCSA’s fight to see its adoption. Yet this remains an issue requiring the additional cooperation of the federal government and Ontario—the top recommendation coming out of the Québec Committee on Contraband.
There are many other issues which the QCSA must lead, such as beer pricing regulation and online gaming by the provincial lottery.
The Association continues to see its membership grow, and most importantly it is gaining the support and involvement of retailers everywhere in Québec. A best example of retailer influence has been the response of more than 400 municipalities all over Québec in support of our recommendation to hold a federal and provincial committee on contraband.
There are many challenges ahead in 2012-2013, but the rising tide of retailer engagement in Québec will certainly help create positive results.
The association
continues to see
its membership
grow, and most
importantly it is
gaining the support
and involvement of
retailers everywhere
in Québec.
Michel Gadbois President, QCSA
Regional (QCSA)
A good year for convenience stores in Québec
Sales growth was essentially flat (+1.2%) in traditional convenience stores. This was nevertheless accompanied by an increase in sales of 21.2% in convenience stores with gas stationsiii, mostly attributable to a corresponding increase in retail gasoline prices (see Figure 2 below). In fact, between June 2010 and June 2011, the average price of regular unleaded gasoline at self-service filling stations in the two main cities of Québec and Montréal increased by a factor of 27.4%iv. Québec’s traditional stores performed significantly
better than the overall Canadian average, which saw a decline in sales in the order of 3.2% while the growth in c-stores with gas stations was slightly less than the Canadian average of 22.3%. The flattening demand in traditional convenience store sales further highlights the intensity of the competition, as further described in Section 4 of the national report. In fact, across the country, sales in traditional convenience stores suffered a third consecutive decline in 2011, so in this sense, Québec is holding on better than the rest of the country.
Margins on sales were also under pressure. In the Québec c-stores we surveyed, the mean gross margin was between 11.1% for independents with gas stations attached and 40.1% for chain traditional c-stores. The mean net margin, however, was much lower, with nearly one out of three c-stores losing money.
After having seen the convenience store industry lose close to 350 stores in 2010, Canadian convenience stores have shown resilience and partly rebounded, at least in terms of store count this year. Québec added a total of 20 c-stores last year. This growth was seen in terms of store count in every category except—not surprisingly—independent traditional c-stores, a category vastly losing money in 2011. Chains with gas stations, another c-store category that was not performing very well last year, saw only one new store added to the count. While Canada was declining somewhat in terms of chain traditional store count, the situation was somewhat different in Québec. Growth in store count was in the order of 0.3%, inferior to the Canadian net growth of 1.5%.
Figure 2SALES IN QUÉBEC, BY C-STORE TYPE FOR 2010 AND 2011 ($B)
$0
$1,000,000
$2,000,000
$3,000,000
$4,000,000
$5,000,000
$6,000,000
$7,000,000
2011 2010
$1,967,301
$6,580,537
$1,943,115
$5,428,482
Convenience Stores Sales
Convenience Stores with Gas Station Sales
Table 3MARGINS PER CONVENIENCE STORE CATEGORY (QUÉBEC)
Mean Gross Margin (%) Mean Net Margin (%) Proportion Reporting Nil or Negative Profitability
Chains 40.1% 6.4% 28.6%
Chains w/Gas Stations 18.7% 2.4% 22.2%
Independents 32.0% -8.7% 73.1%
Independents w/Gas Stations 11.1% 3.2% 4.8%
Source: CCSA Benchmarking Data
Source: CCSA Benchmarking Data
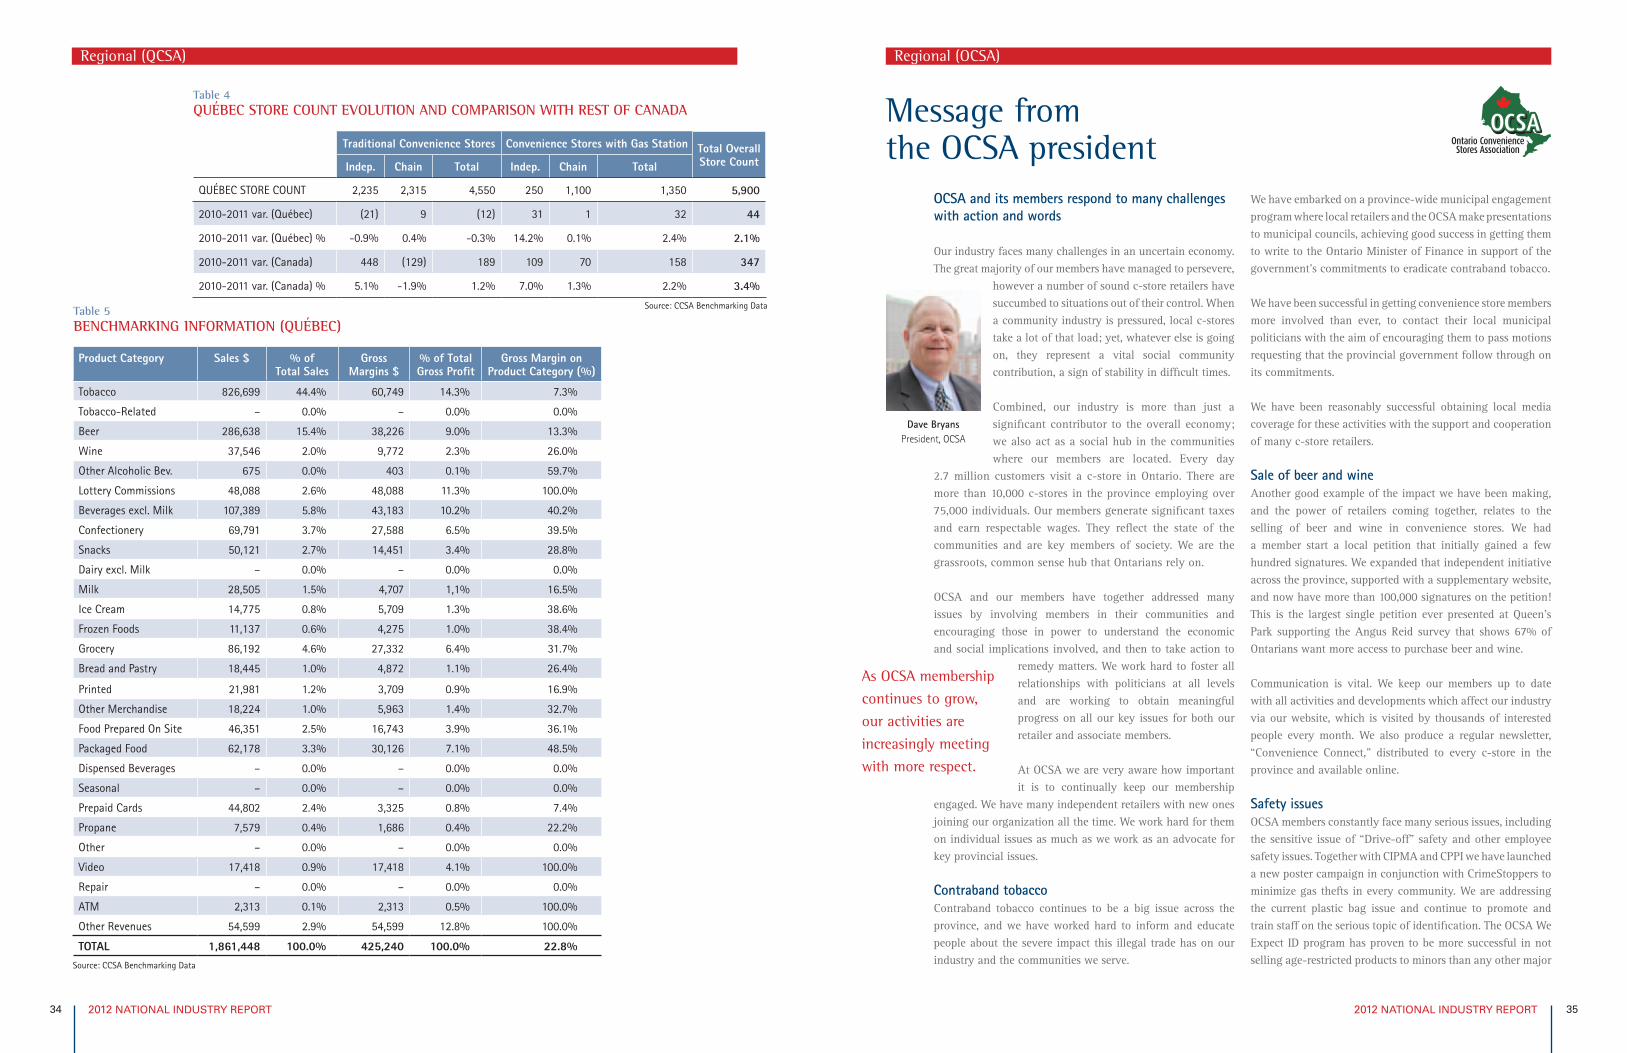
2012 NATIONAL INDUSTRY REPORT 352012 NATIONAL INDUSTRY REPORT 34
Table 4QUÉBEC STORE COUNT EVOLUTION AND COMPARISON WITH REST OF CANADA
Traditional Convenience Stores Convenience Stores with Gas Station Total Overall Store CountIndep. Chain Total Indep. Chain Total
QUÉBEC STORE COUNT 2,235 2,315 4,550 250 1,100 1,350 5,900
2010-2011 var. (Québec) (21) 9 (12) 31 1 32 44
2010-2011 var. (Québec) % -0.9% 0.4% -0.3% 14.2% 0.1% 2.4% 2.1%
2010-2011 var. (Canada) 448 (129) 189 109 70 158 347
2010-2011 var. (Canada) % 5.1% -1.9% 1.2% 7.0% 1.3% 2.2% 3.4%
Table 5BENCHMARKING INFORMATION (QUÉBEC)
Product Category Sales $ % of Total Sales
GrossMargins $
% of Total Gross Profit
Gross Margin on Product Category (%)
Tobacco 826,699 44.4% 60,749 14.3% 7.3%
Tobacco-Related – 0.0% – 0.0% 0.0%
Beer 286,638 15.4% 38,226 9.0% 13.3%
Wine 37,546 2.0% 9,772 2.3% 26.0%
Other Alcoholic Bev. 675 0.0% 403 0.1% 59.7%
Lottery Commissions 48,088 2.6% 48,088 11.3% 100.0%
Beverages excl. Milk 107,389 5.8% 43,183 10.2% 40.2%
Confectionery 69,791 3.7% 27,588 6.5% 39.5%
Snacks 50,121 2.7% 14,451 3.4% 28.8%
Dairy excl. Milk – 0.0% – 0.0% 0.0%
Milk 28,505 1.5% 4,707 1,1% 16.5%
Ice Cream 14,775 0.8% 5,709 1.3% 38.6%
Frozen Foods 11,137 0.6% 4,275 1.0% 38.4%
Grocery 86,192 4.6% 27,332 6.4% 31.7%
Bread and Pastry 18,445 1.0% 4,872 1.1% 26.4%
Printed 21,981 1.2% 3,709 0.9% 16.9%
Other Merchandise 18,224 1.0% 5,963 1.4% 32.7%
Food Prepared On Site 46,351 2.5% 16,743 3.9% 36.1%
Packaged Food 62,178 3.3% 30,126 7.1% 48.5%
Dispensed Beverages – 0.0% – 0.0% 0.0%
Seasonal – 0.0% – 0.0% 0.0%
Prepaid Cards 44,802 2.4% 3,325 0.8% 7.4%
Propane 7,579 0.4% 1,686 0.4% 22.2%
Other – 0.0% – 0.0% 0.0%
Video 17,418 0.9% 17,418 4.1% 100.0%
Repair – 0.0% – 0.0% 0.0%
ATM 2,313 0.1% 2,313 0.5% 100.0%
Other Revenues 54,599 2.9% 54,599 12.8% 100.0%
TOTAL 1,861,448 100.0% 425,240 100.0% 22.8%
Regional (QCSA)
Message from the OCSA president
OCSA and its members respond to many challenges with action and words
Our industry faces many challenges in an uncertain economy. The great majority of our members have managed to persevere,
however a number of sound c-store retailers have succumbed to situations out of their control. When a community industry is pressured, local c-stores take a lot of that load; yet, whatever else is going on, they represent a vital social community contribution, a sign of stability in difficult times.
Combined, our industry is more than just a significant contributor to the overall economy; we also act as a social hub in the communities where our members are located. Every day
2.7 million customers visit a c-store in Ontario. There are more than 10,000 c-stores in the province employing over 75,000 individuals. Our members generate significant taxes and earn respectable wages. They reflect the state of the communities and are key members of society. We are the grassroots, common sense hub that Ontarians rely on.
OCSA and our members have together addressed many issues by involving members in their communities and encouraging those in power to understand the economic and social implications involved, and then to take action to
remedy matters. We work hard to foster all relationships with politicians at all levels and are working to obtain meaningful progress on all our key issues for both our retailer and associate members.
At OCSA we are very aware how important it is to continually keep our membership
engaged. We have many independent retailers with new ones joining our organization all the time. We work hard for them on individual issues as much as we work as an advocate for key provincial issues.
Contraband tobaccoContraband tobacco continues to be a big issue across the province, and we have worked hard to inform and educate people about the severe impact this illegal trade has on our industry and the communities we serve.
We have embarked on a province-wide municipal engagement program where local retailers and the OCSA make presentations to municipal councils, achieving good success in getting them to write to the Ontario Minister of Finance in support of the government’s commitments to eradicate contraband tobacco.
We have been successful in getting convenience store members more involved than ever, to contact their local municipal politicians with the aim of encouraging them to pass motions requesting that the provincial government follow through on its commitments.
We have been reasonably successful obtaining local media coverage for these activities with the support and cooperation of many c-store retailers.
Sale of beer and wineAnother good example of the impact we have been making, and the power of retailers coming together, relates to the selling of beer and wine in convenience stores. We had a member start a local petition that initially gained a few hundred signatures. We expanded that independent initiative across the province, supported with a supplementary website, and now have more than 100,000 signatures on the petition! This is the largest single petition ever presented at Queen’s Park supporting the Angus Reid survey that shows 67% of Ontarians want more access to purchase beer and wine.
Communication is vital. We keep our members up to date with all activities and developments which affect our industry via our website, which is visited by thousands of interested people every month. We also produce a regular newsletter, “Convenience Connect,” distributed to every c-store in the province and available online.
Safety issuesOCSA members constantly face many serious issues, including the sensitive issue of “Drive-off” safety and other employee safety issues. Together with CIPMA and CPPI we have launched a new poster campaign in conjunction with CrimeStoppers to minimize gas thefts in every community. We are addressing the current plastic bag issue and continue to promote and train staff on the serious topic of identification. The OCSA We Expect ID program has proven to be more successful in not selling age-restricted products to minors than any other major
As OCSA membership
continues to grow,
our activities are
increasingly meeting
with more respect.
Dave Bryans President, OCSA
Regional (OCSA)
Source: CCSA Benchmarking Data
Source: CCSA Benchmarking Data
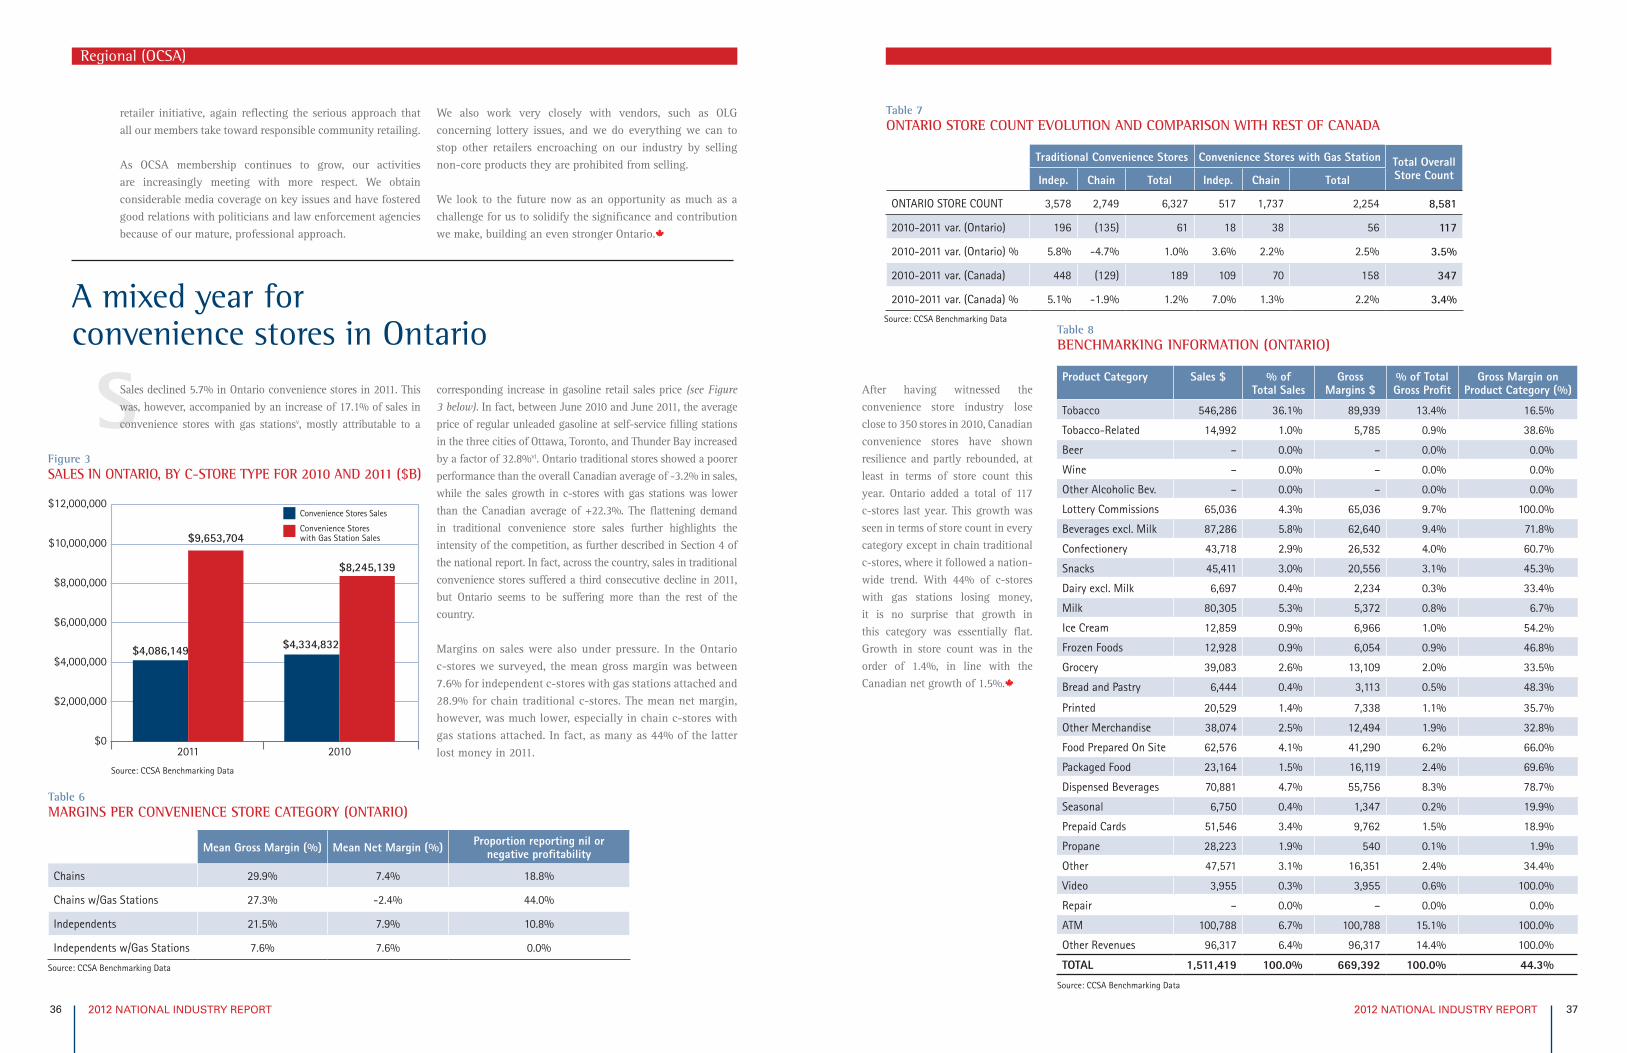
2012 NATIONAL INDUSTRY REPORT 372012 NATIONAL INDUSTRY REPORT 36
S
retailer initiative, again reflecting the serious approach that all our members take toward responsible community retailing.
As OCSA membership continues to grow, our activities are increasingly meeting with more respect. We obtain considerable media coverage on key issues and have fostered good relations with politicians and law enforcement agencies because of our mature, professional approach.
We also work very closely with vendors, such as OLG concerning lottery issues, and we do everything we can to stop other retailers encroaching on our industry by selling non-core products they are prohibited from selling.
We look to the future now as an opportunity as much as a challenge for us to solidify the significance and contribution we make, building an even stronger Ontario.
A mixed year for convenience stores in Ontario
Sales declined 5.7% in Ontario convenience stores in 2011. This was, however, accompanied by an increase of 17.1% of sales in convenience stores with gas stationsv, mostly attributable to a
corresponding increase in gasoline retail sales price (see Figure 3 below). In fact, between June 2010 and June 2011, the average price of regular unleaded gasoline at self-service filling stations in the three cities of Ottawa, Toronto, and Thunder Bay increased by a factor of 32.8%vi. Ontario traditional stores showed a poorer performance than the overall Canadian average of -3.2% in sales, while the sales growth in c-stores with gas stations was lower than the Canadian average of +22.3%. The flattening demand in traditional convenience store sales further highlights the intensity of the competition, as further described in Section 4 of the national report. In fact, across the country, sales in traditional convenience stores suffered a third consecutive decline in 2011, but Ontario seems to be suffering more than the rest of the country.
Margins on sales were also under pressure. In the Ontario c-stores we surveyed, the mean gross margin was between 7.6% for independent c-stores with gas stations attached and 28.9% for chain traditional c-stores. The mean net margin, however, was much lower, especially in chain c-stores with gas stations attached. In fact, as many as 44% of the latter lost money in 2011.
Figure 3SALES IN ONTARIO, BY C-STORE TYPE FOR 2010 AND 2011 ($B)
$0
$2,000,000
$4,000,000
$6,000,000
$8,000,000
$10,000,000
$12,000,000
2011 2010
$4,086,149
$9,653,704
$4,334,832
$8,245,139
Convenience Stores Sales
Convenience Stores with Gas Station Sales
Table 6MARGINS PER CONVENIENCE STORE CATEGORY (ONTARIO)
Mean Gross Margin (%) Mean Net Margin (%) Proportion reporting nil or negative profitability
Chains 29.9% 7.4% 18.8%
Chains w/Gas Stations 27.3% -2.4% 44.0%
Independents 21.5% 7.9% 10.8%
Independents w/Gas Stations 7.6% 7.6% 0.0%
Regional (OCSA)
Table 7ONTARIO STORE COUNT EVOLUTION AND COMPARISON WITH REST OF CANADA
Traditional Convenience Stores Convenience Stores with Gas Station Total Overall Store CountIndep. Chain Total Indep. Chain Total
ONTARIO STORE COUNT 3,578 2,749 6,327 517 1,737 2,254 8,581
2010-2011 var. (Ontario) 196 (135) 61 18 38 56 117
2010-2011 var. (Ontario) % 5.8% -4.7% 1.0% 3.6% 2.2% 2.5% 3.5%
2010-2011 var. (Canada) 448 (129) 189 109 70 158 347
2010-2011 var. (Canada) % 5.1% -1.9% 1.2% 7.0% 1.3% 2.2% 3.4%
Table 8BENCHMARKING INFORMATION (ONTARIO)
Product Category Sales $ % of Total Sales
GrossMargins $
% of Total Gross Profit
Gross Margin on Product Category (%)
Tobacco 546,286 36.1% 89,939 13.4% 16.5%
Tobacco-Related 14,992 1.0% 5,785 0.9% 38.6%
Beer – 0.0% – 0.0% 0.0%
Wine – 0.0% – 0.0% 0.0%
Other Alcoholic Bev. – 0.0% – 0.0% 0.0%
Lottery Commissions 65,036 4.3% 65,036 9.7% 100.0%
Beverages excl. Milk 87,286 5.8% 62,640 9.4% 71.8%
Confectionery 43,718 2.9% 26,532 4.0% 60.7%
Snacks 45,411 3.0% 20,556 3.1% 45.3%
Dairy excl. Milk 6,697 0.4% 2,234 0.3% 33.4%
Milk 80,305 5.3% 5,372 0.8% 6.7%
Ice Cream 12,859 0.9% 6,966 1.0% 54.2%
Frozen Foods 12,928 0.9% 6,054 0.9% 46.8%
Grocery 39,083 2.6% 13,109 2.0% 33.5%
Bread and Pastry 6,444 0.4% 3,113 0.5% 48.3%
Printed 20,529 1.4% 7,338 1.1% 35.7%
Other Merchandise 38,074 2.5% 12,494 1.9% 32.8%
Food Prepared On Site 62,576 4.1% 41,290 6.2% 66.0%
Packaged Food 23,164 1.5% 16,119 2.4% 69.6%
Dispensed Beverages 70,881 4.7% 55,756 8.3% 78.7%
Seasonal 6,750 0.4% 1,347 0.2% 19.9%
Prepaid Cards 51,546 3.4% 9,762 1.5% 18.9%
Propane 28,223 1.9% 540 0.1% 1.9%
Other 47,571 3.1% 16,351 2.4% 34.4%
Video 3,955 0.3% 3,955 0.6% 100.0%
Repair – 0.0% – 0.0% 0.0%
ATM 100,788 6.7% 100,788 15.1% 100.0%
Other Revenues 96,317 6.4% 96,317 14.4% 100.0%
TOTAL 1,511,419 100.0% 669,392 100.0% 44.3%
After having witnessed the convenience store industry lose close to 350 stores in 2010, Canadian convenience stores have shown resilience and partly rebounded, at least in terms of store count this year. Ontario added a total of 117 c-stores last year. This growth was seen in terms of store count in every category except in chain traditional c-stores, where it followed a nation-wide trend. With 44% of c-stores with gas stations losing money, it is no surprise that growth in this category was essentially flat. Growth in store count was in the order of 1.4%, in line with the Canadian net growth of 1.5%.
Source: CCSA Benchmarking Data
Source: CCSA Benchmarking Data
Source: CCSA Benchmarking Data
Source: CCSA Benchmarking Data
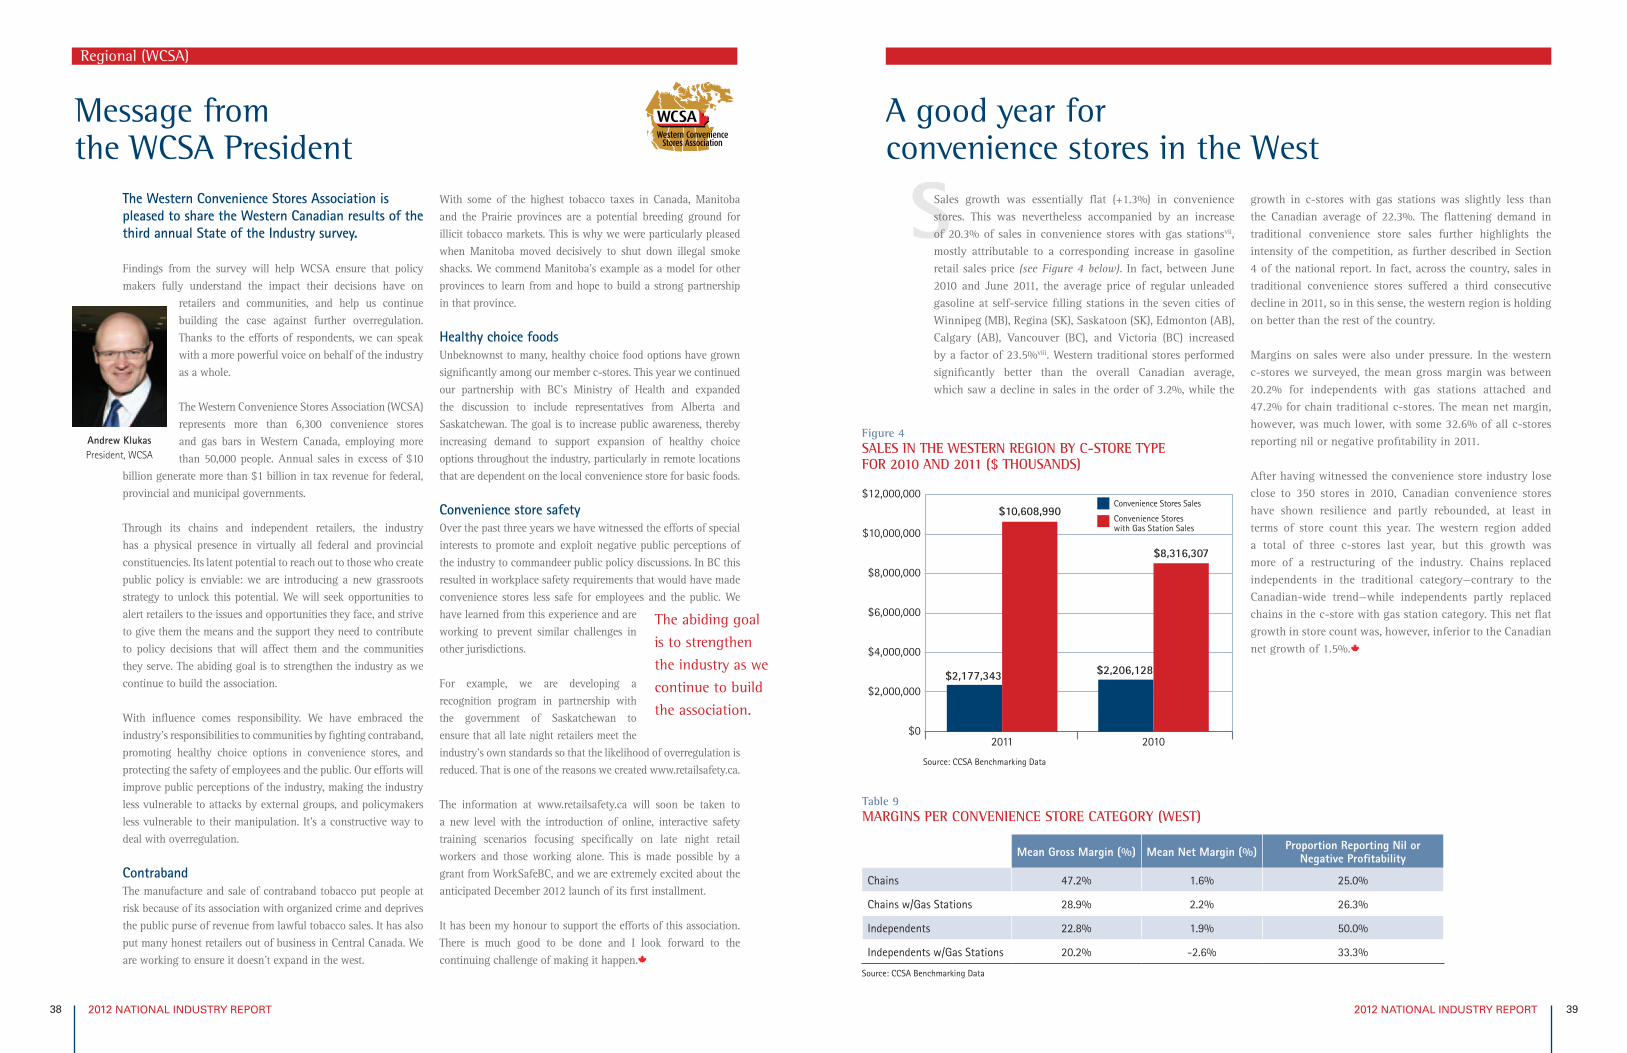
2012 NATIONAL INDUSTRY REPORT 392012 NATIONAL INDUSTRY REPORT 38
SMessage from the WCSA President
The Western Convenience Stores Association is pleased to share the Western Canadian results of the third annual State of the Industry survey.
Findings from the survey will help WCSA ensure that policy makers fully understand the impact their decisions have on
retailers and communities, and help us continue building the case against further overregulation. Thanks to the efforts of respondents, we can speak with a more powerful voice on behalf of the industry as a whole.
The Western Convenience Stores Association (WCSA) represents more than 6,300 convenience stores and gas bars in Western Canada, employing more than 50,000 people. Annual sales in excess of $10
billion generate more than $1 billion in tax revenue for federal, provincial and municipal governments.
Through its chains and independent retailers, the industry has a physical presence in virtually all federal and provincial constituencies. Its latent potential to reach out to those who create public policy is enviable: we are introducing a new grassroots strategy to unlock this potential. We will seek opportunities to alert retailers to the issues and opportunities they face, and strive to give them the means and the support they need to contribute to policy decisions that will affect them and the communities they serve. The abiding goal is to strengthen the industry as we continue to build the association.
With influence comes responsibility. We have embraced the industry’s responsibilities to communities by fighting contraband, promoting healthy choice options in convenience stores, and protecting the safety of employees and the public. Our efforts will improve public perceptions of the industry, making the industry less vulnerable to attacks by external groups, and policymakers less vulnerable to their manipulation. It’s a constructive way to deal with overregulation.
ContrabandThe manufacture and sale of contraband tobacco put people at risk because of its association with organized crime and deprives the public purse of revenue from lawful tobacco sales. It has also put many honest retailers out of business in Central Canada. We are working to ensure it doesn’t expand in the west.
With some of the highest tobacco taxes in Canada, Manitoba and the Prairie provinces are a potential breeding ground for illicit tobacco markets. This is why we were particularly pleased when Manitoba moved decisively to shut down illegal smoke shacks. We commend Manitoba’s example as a model for other provinces to learn from and hope to build a strong partnership in that province.
Healthy choice foodsUnbeknownst to many, healthy choice food options have grown significantly among our member c-stores. This year we continued our partnership with BC’s Ministry of Health and expanded the discussion to include representatives from Alberta and Saskatchewan. The goal is to increase public awareness, thereby increasing demand to support expansion of healthy choice options throughout the industry, particularly in remote locations that are dependent on the local convenience store for basic foods.
Convenience store safety Over the past three years we have witnessed the efforts of special interests to promote and exploit negative public perceptions of the industry to commandeer public policy discussions. In BC this resulted in workplace safety requirements that would have made convenience stores less safe for employees and the public. We have learned from this experience and are working to prevent similar challenges in other jurisdictions.
For example, we are developing a recognition program in partnership with the government of Saskatchewan to ensure that all late night retailers meet the industry’s own standards so that the likelihood of overregulation is reduced. That is one of the reasons we created www.retailsafety.ca.
The information at www.retailsafety.ca will soon be taken to a new level with the introduction of online, interactive safety training scenarios focusing specifically on late night retail workers and those working alone. This is made possible by a grant from WorkSafeBC, and we are extremely excited about the anticipated December 2012 launch of its first installment.
It has been my honour to support the efforts of this association. There is much good to be done and I look forward to the continuing challenge of making it happen.
The abiding goal
is to strengthen
the industry as we
continue to build
the association.
Andrew Klukas President, WCSA
Regional (WCSA)
A good year for convenience stores in the West
Sales growth was essentially flat (+1.3%) in convenience stores. This was nevertheless accompanied by an increase of 20.3% of sales in convenience stores with gas stationsvii, mostly attributable to a corresponding increase in gasoline retail sales price (see Figure 4 below). In fact, between June 2010 and June 2011, the average price of regular unleaded gasoline at self-service filling stations in the seven cities of Winnipeg (MB), Regina (SK), Saskatoon (SK), Edmonton (AB), Calgary (AB), Vancouver (BC), and Victoria (BC) increased by a factor of 23.5%viii. Western traditional stores performed significantly better than the overall Canadian average, which saw a decline in sales in the order of 3.2%, while the
growth in c-stores with gas stations was slightly less than the Canadian average of 22.3%. The flattening demand in traditional convenience store sales further highlights the intensity of the competition, as further described in Section 4 of the national report. In fact, across the country, sales in traditional convenience stores suffered a third consecutive decline in 2011, so in this sense, the western region is holding on better than the rest of the country.
Margins on sales were also under pressure. In the western c-stores we surveyed, the mean gross margin was between 20.2% for independents with gas stations attached and 47.2% for chain traditional c-stores. The mean net margin, however, was much lower, with some 32.6% of all c-stores reporting nil or negative profitability in 2011.
After having witnessed the convenience store industry lose close to 350 stores in 2010, Canadian convenience stores have shown resilience and partly rebounded, at least in terms of store count this year. The western region added a total of three c-stores last year, but this growth was more of a restructuring of the industry. Chains replaced independents in the traditional category—contrary to the Canadian-wide trend—while independents partly replaced chains in the c-store with gas station category. This net flat growth in store count was, however, inferior to the Canadian net growth of 1.5%.
Figure 4SALES IN THE WESTERN REGION BY C-STORE TYPE FOR 2010 AND 2011 ($ THOUSANDS)
$0
$2,000,000
$4,000,000
$6,000,000
$8,000,000
$10,000,000
$12,000,000
2011 2010
$2,177,343
$10,608,990
$2,206,128
$8,316,307
Convenience Stores Sales
Convenience Stores with Gas Station Sales
Table 9MARGINS PER CONVENIENCE STORE CATEGORY (WEST)
Mean Gross Margin (%) Mean Net Margin (%) Proportion Reporting Nil or Negative Profitability
Chains 47.2% 1.6% 25.0%
Chains w/Gas Stations 28.9% 2.2% 26.3%
Independents 22.8% 1.9% 50.0%
Independents w/Gas Stations 20.2% -2.6% 33.3%
Source: CCSA Benchmarking Data
Source: CCSA Benchmarking Data
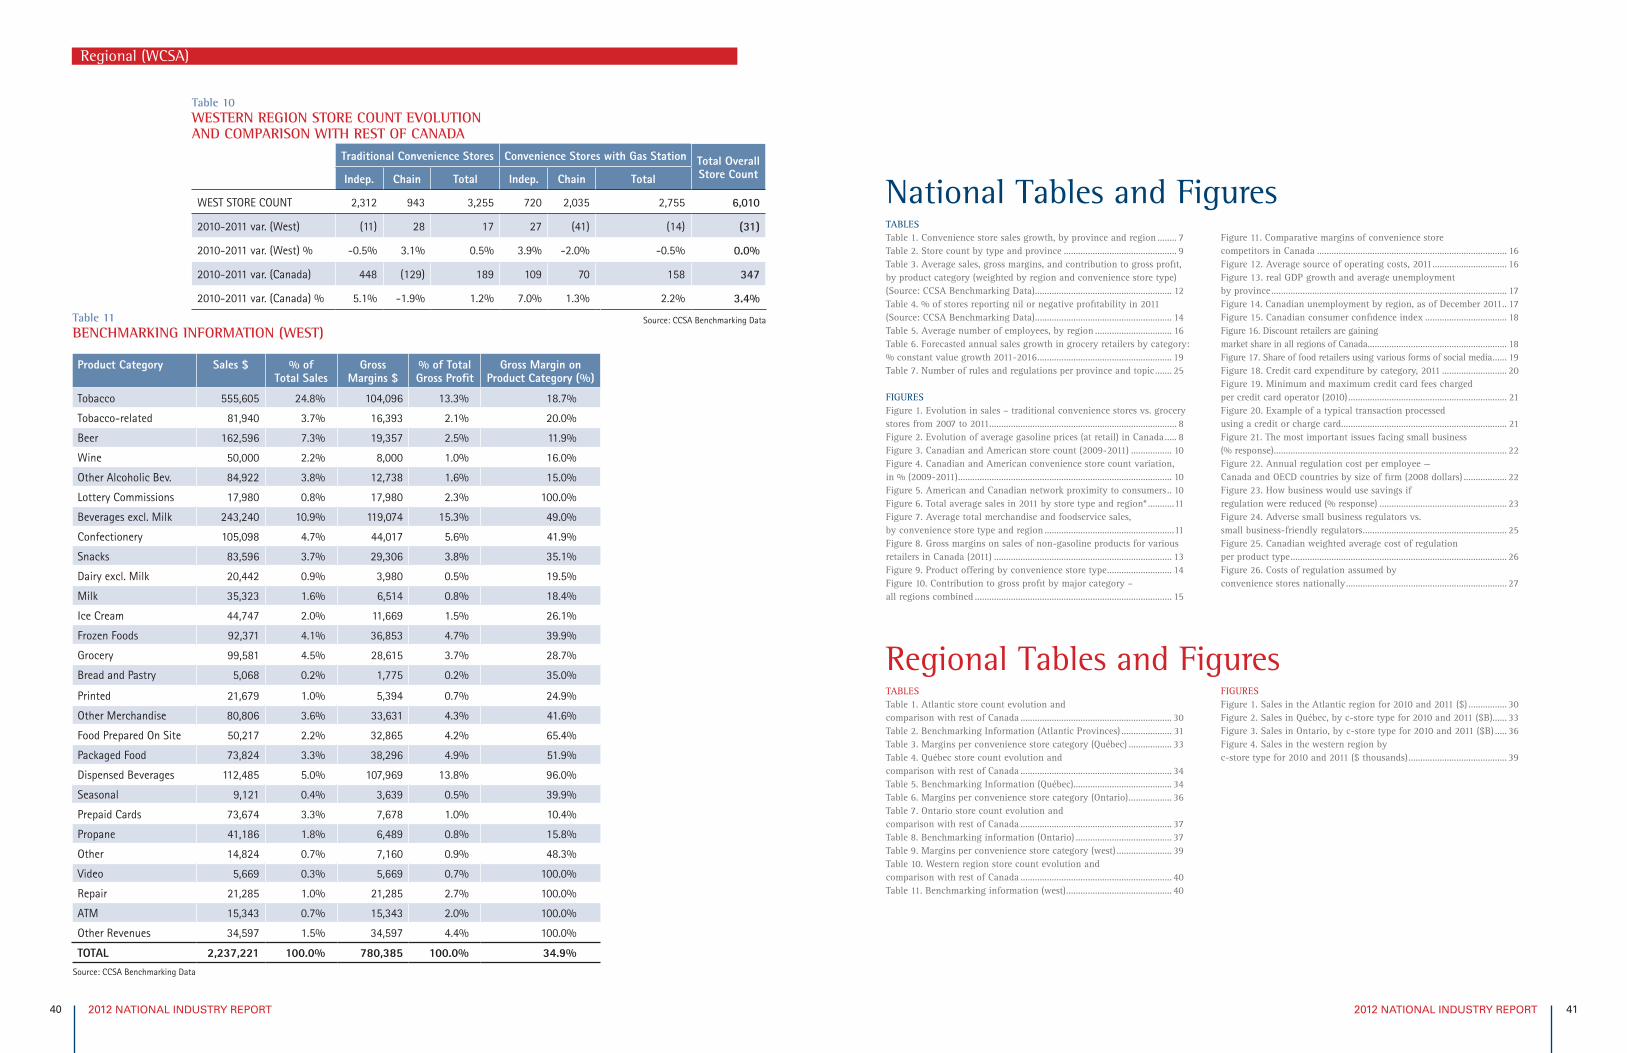
2012 NATIONAL INDUSTRY REPORT 412012 NATIONAL INDUSTRY REPORT 40
Table 10WESTERN REGION STORE COUNT EVOLUTION AND COMPARISON WITH REST OF CANADA
Traditional Convenience Stores Convenience Stores with Gas Station Total Overall Store CountIndep. Chain Total Indep. Chain Total
WEST STORE COUNT 2,312 943 3,255 720 2,035 2,755 6,010
2010-2011 var. (West) (11) 28 17 27 (41) (14) (31)
2010-2011 var. (West) % -0.5% 3.1% 0.5% 3.9% -2.0% -0.5% 0.0%
2010-2011 var. (Canada) 448 (129) 189 109 70 158 347
2010-2011 var. (Canada) % 5.1% -1.9% 1.2% 7.0% 1.3% 2.2% 3.4%
Table 11BENCHMARKING INFORMATION (WEST)
Product Category Sales $ % of Total Sales
GrossMargins $
% of Total Gross Profit
Gross Margin on Product Category (%)
Tobacco 555,605 24.8% 104,096 13.3% 18.7%
Tobacco-related 81,940 3.7% 16,393 2.1% 20.0%
Beer 162,596 7.3% 19,357 2.5% 11.9%
Wine 50,000 2.2% 8,000 1.0% 16.0%
Other Alcoholic Bev. 84,922 3.8% 12,738 1.6% 15.0%
Lottery Commissions 17,980 0.8% 17,980 2.3% 100.0%
Beverages excl. Milk 243,240 10.9% 119,074 15.3% 49.0%
Confectionery 105,098 4.7% 44,017 5.6% 41.9%
Snacks 83,596 3.7% 29,306 3.8% 35.1%
Dairy excl. Milk 20,442 0.9% 3,980 0.5% 19.5%
Milk 35,323 1.6% 6,514 0.8% 18.4%
Ice Cream 44,747 2.0% 11,669 1.5% 26.1%
Frozen Foods 92,371 4.1% 36,853 4.7% 39.9%
Grocery 99,581 4.5% 28,615 3.7% 28.7%
Bread and Pastry 5,068 0.2% 1,775 0.2% 35.0%
Printed 21,679 1.0% 5,394 0.7% 24.9%
Other Merchandise 80,806 3.6% 33,631 4.3% 41.6%
Food Prepared On Site 50,217 2.2% 32,865 4.2% 65.4%
Packaged Food 73,824 3.3% 38,296 4.9% 51.9%
Dispensed Beverages 112,485 5.0% 107,969 13.8% 96.0%
Seasonal 9,121 0.4% 3,639 0.5% 39.9%
Prepaid Cards 73,674 3.3% 7,678 1.0% 10.4%
Propane 41,186 1.8% 6,489 0.8% 15.8%
Other 14,824 0.7% 7,160 0.9% 48.3%
Video 5,669 0.3% 5,669 0.7% 100.0%
Repair 21,285 1.0% 21,285 2.7% 100.0%
ATM 15,343 0.7% 15,343 2.0% 100.0%
Other Revenues 34,597 1.5% 34,597 4.4% 100.0%
TOTAL 2,237,221 100.0% 780,385 100.0% 34.9%
TABLESTable 1. Convenience store sales growth, by province and region ........ 7Table 2. Store count by type and province ............................................... 9Table 3. Average sales, gross margins, and contribution to gross profit, by product category (weighted by region and convenience store type) (Source: CCSA Benchmarking Data) ......................................................... 12Table 4. % of stores reporting nil or negative profitability in 2011 (Source: CCSA Benchmarking Data) ......................................................... 14Table 5. Average number of employees, by region ................................ 16Table 6. Forecasted annual sales growth in grocery retailers by category: % constant value growth 2011-2016 ........................................................ 19Table 7. Number of rules and regulations per province and topic ....... 25
FIGURESFigure 1. Evolution in sales – traditional convenience stores vs. grocery stores from 2007 to 2011 .............................................................................. 8Figure 2. Evolution of average gasoline prices (at retail) in Canada ..... 8Figure 3. Canadian and American store count (2009-2011) ................. 10Figure 4. Canadian and American convenience store count variation, in % (2009-2011) ......................................................................................... 10Figure 5. American and Canadian network proximity to consumers .. 10Figure 6. Total average sales in 2011 by store type and region* ...........11Figure 7. Average total merchandise and foodservice sales, by convenience store type and region ......................................................11Figure 8. Gross margins on sales of non-gasoline products for various retailers in Canada (2011) .......................................................................... 13Figure 9. Product offering by convenience store type ........................... 14Figure 10. Contribution to gross profit by major category – all regions combined .................................................................................. 15
Figure 11. Comparative margins of convenience store competitors in Canada ............................................................................... 16Figure 12. Average source of operating costs, 2011 ............................... 16Figure 13. real GDP growth and average unemployment by province .................................................................................................. 17Figure 14. Canadian unemployment by region, as of December 2011 .. 17Figure 15. Canadian consumer confidence index .................................. 18Figure 16. Discount retailers are gaining market share in all regions of Canada .......................................................... 18Figure 17. Share of food retailers using various forms of social media ...... 19Figure 18. Credit card expenditure by category, 2011 ........................... 20Figure 19. Minimum and maximum credit card fees charged per credit card operator (2010) .................................................................. 21Figure 20. Example of a typical transaction processed using a credit or charge card..................................................................... 21Figure 21. The most important issues facing small business (% response) ................................................................................................. 22Figure 22. Annual regulation cost per employee — Canada and OECD countries by size of firm (2008 dollars) .................. 22Figure 23. How business would use savings if regulation were reduced (% response) ..................................................... 23Figure 24. Adverse small business regulators vs. small business-friendly regulators ............................................................ 25Figure 25. Canadian weighted average cost of regulation per product type .......................................................................................... 26Figure 26. Costs of regulation assumed by convenience stores nationally ................................................................... 27
TABLESTable 1. Atlantic store count evolution and comparison with rest of Canada ............................................................... 30Table 2. Benchmarking Information (Atlantic Provinces) ..................... 31Table 3. Margins per convenience store category (Québec) .................. 33Table 4. Québec store count evolution and comparison with rest of Canada ............................................................... 34Table 5. Benchmarking Information (Québec)......................................... 34Table 6. Margins per convenience store category (Ontario) .................. 36Table 7. Ontario store count evolution and comparison with rest of Canada ............................................................... 37Table 8. Benchmarking information (Ontario) ........................................ 37Table 9. Margins per convenience store category (west) ....................... 39Table 10. Western region store count evolution and comparison with rest of Canada ............................................................... 40Table 11. Benchmarking information (west) ............................................ 40
FIGURESFigure 1. Sales in the Atlantic region for 2010 and 2011 ($) ................ 30Figure 2. Sales in Québec, by c-store type for 2010 and 2011 ($B)...... 33Figure 3. Sales in Ontario, by c-store type for 2010 and 2011 ($B) ..... 36Figure 4. Sales in the western region by c-store type for 2010 and 2011 ($ thousands) ......................................... 39
Regional (WCSA)
National Tables and Figures
Regional Tables and Figures
Source: CCSA Benchmarking Data
Source: CCSA Benchmarking Data
2012 NATIONAL INDUSTRY REPORT 42
Regional Referencesi Source: Statistics Canada, CANSIM, table 080-0020 and Catalogue no. 63-005-X.
ii Source: Statistics Canada, CANSIM, table 326-0009 and Catalogue no. 62-001-X.
iii Source: Statistics Canada, CANSIM, table 080-0020 and Catalogue no. 63-005-X.
iv Source: Statistics Canada, CANSIM, table 326-0009 and Catalogue no. 62-001-X.
v Source: Statistics Canada, CANSIM, table 080-0020 and Catalogue no. 63-005-X.
vi Source: Statistics Canada, CANSIM, table 326-0009 and Catalogue no. 62-001-X.
vii Source: Statistics Canada, CANSIM, table 080-0020 and Catalogue no. 63-005-X.
viii Source: Statistics Canada, CANSIM, table 326-0009 and Catalogue no. 62-001-X.
National Referencesi Source: Statistics Canada, CANSIM, table 080-0020 and Catalogue no. 63-005-X.
ii Source: Statistics Canada. Table 326-0012 – Average retail prices for food and other selected items, monthly (dollars), CANSIM (database).
iii Source: GasBuddy [http://www.GasBuddy.com/gb_retail_price_chart.aspx?city1=Canada Average&city2=&city3=&crude=n&tme=36&units=ca]
iv Source: Imperial Tobacco Limited. Internal Statistics.
v Source: NACS online. [http://www.nacsonline.com/nacs/news/factsheets/pages/default.aspx]
vi Source: http://www.nacsonline.com/NACS/NEWS/FACTSHEETS/SCOPEOFINDUSTRY/Pages/IndustryStoreCount.aspx
vii Source: http://www.nacsonline.com/NACS/NEWS/FACTSHEETS/SCOPEOFINDUSTRY/Pages/IndustryStoreCount.aspx
viii Source: World Bank.
ix Source: Statistics Canada, CANSIM, table 080-0023.
x Source: Statistique Canada. Tableau 080-0023 – Enquête annuelle sur le commerce de détail, estimations financières fondée sur le Système de classification des industries de l’Amérique du Nord (SCIAN) par genre de magasin, annuel (dollars sauf indication contraire), CANSIM (base de données).
xi Source: RBC Economics Research, Provincial Outlook, March 2012.
xii Source: The NPD Group.
xiii Source: Conference Board of Canada. Results for 2012 include Jan-May Data.
xiv Source: Euromonitor International.
xv FMI – The Food Retailing Industry Speaks 2011.
xvi FINANCIAL CARDS AND PAYMENTS IN Canada, Euromonitor International, October 2011
xvii Source: CityTV News and The Canadian Press, « Canadian credit card system of fees ‘perverse’: Competition Bureau » [http://www.citytv.com/toronto/citynews/life/money/article/204697--Canadian-credit-card-system-of-fees-perverse-competition-bureau]
xviii Source: Chen, T. (2011), Credit-card swipe fees: US firms pay too much – and it hurts consumer, The Christian Science Monitor, April 13. [see http://www.csmonitor.com/Business/new-economy/2011/0413/Credit-card-swipe-fees-US-firms-pay-too-much-and-it-hurts-consumers]
xix Source: Canadian Grocer. « Most grocers see rosy future, survey finds. » [available online at http://www.Canadiangrocer.com/top-stories/most-grocers-see-rosy-future-survey-finds-13631]
xx Source: Canadian Federation of Independent Business (2010) « Prosperity Restricted by Red Tape », p.1.
xxi Sources: (a) Moore, Stephen. Government: America’s #1 Growth Industry. Lewisville, TX: Institute for Policy Innovation, 1995. (b) Jones, Laura and Stephen Graf. Canada’s Regulatory Burden: How Many Regulations? At What Cost? Vancouver: Fraser Institute, 2001. (c) Weidenbaum, Murray, and Robert DeFina. The Cost of Federal Regulation of Economic Activity. Washington, DC: Competitive Enterprise Institute, 1976.
xxii Organisation for Economic Co-Operation and Development (2001), Businesses’ Views on Red Tape Administrative and Regulatory Burdens on Small- and medium-sized Enterprises. Paris: OECD.
xxiii Source: McGowan, Richard (1997), Government Regulation of the Alcohol Industry : The Search for Revenue and the Common Good. Westport, CT: Quorum Books.
xxiv Source: Canadian Federation of Independent Business (2010) « Prosperity Restricted by Red Tape », pp. 8-10.
xxv Details of this effort can be found in appendix.
xxvi Source: Statistics Canada, CANSIM, table 384-0002 and Catalogue no. 13-213-PPB.
xxvii Source: Bartel, A.P., and L.G. Thomas (1987) “Predation through Regulation: The Wage and Profit Effects of the Occupational Safety and Health Administration and the Environmental Protection Agency,” Journal of Law Economics, 30, 239-264.
xxviii Source: Average hourly wages of employees by selected characteristics and profession, unadjusted data, by province (monthly) http://www.statcan.gc.ca/tables-tableaux/sum-som/l01/cst01/labr69a-eng.htm
xxix Source: National Post, « It’s what’s BAD for you », May 25, 2012.
xxx Source: Daily Mail [http://www.dailymail.co.uk/news/article-2079796/France-approves-fat-tax-sugary-drinks-Coca-Cola-Fanta.html#ixzz21JVSQU6t]
About CCSA.
Responsible Community Retailing.
The Canadian Convenience Stores Association is a non-profit
organization, funded by its members, with the aim to represent
their interests and improve their business environment.
Founded in 2007, the CCSA comprises four regional affiliates:
220 Wyecroft Road, Unit 103Oakville, ON L6K 3V1
www.CCSASOI.ca