ACKNoWLeDGeMeNTS...Finally, we thank Rashi Agrawal, Indira Mallela and Swapna Vuppala for their...
69
Transcript of ACKNoWLeDGeMeNTS...Finally, we thank Rashi Agrawal, Indira Mallela and Swapna Vuppala for their...


1
The authors of this report wish to thank and acknowledge the contribution of all the people who have generously offered their ideas, insights and time in support to this effort.
First and foremost, we thank all the practitioners, entrepreneurs, experts and stakeholders in Indian microfinance who through their passion and dedication have shaped the sector, and to whom we are deeply indebted for sharing with us their knowledge and experience.
A special thanks to Vineet Rai, Co-founder and Chairman of Intellecap, and Manju Mary George, Business Consulting Group Lead, for providing guidance throughout the project and the encouragement to think in new ways. Their vision has helped to shape our work, and their dedication to the sector has been an inspiration to us, driving us to maintain integrity in our approach and ensure utility in the analysis presented in this report.
Anurag Agrawal and Atreya Rayaprolu of Intellecap’s Investment Banking Group receive appreciation for making important contributions to the team’s knowledge of markets and investors, and for kindly acting as a sounding board for various analyses.
Publishing this report would not have been possible without the authorship support of the entire Intellecap team, and especially Satish Pai, Nisha Dutt, and Shalini Kadaveru. Anand Borundiya and Prachi Mathur also provided the team with practical feedback, for which we are grateful. We would also like to thank Linsday Clinton and Arjun Kashyap for their editorial support in the final phase of work.
Finally, we thank Rashi Agrawal, Indira Mallela and Swapna Vuppala for their invaluable support in collecting data.
ACKNoWLeDGeMeNTS

2
CoNTeNTS
List of Abbreviations................................................................................................. 4
Introduction............................................................................................................. 5
1. Exploring Pressing Issues in Indian Microfinance 6
1.1 Is Indian Microfinance Growing Too Fast? 7 1.2 Is Indian Microfinance a Bubble in the Making? 8 1.3 How Well are Indian MFIs Governed? 10
1.4 Is the Commercialization of Microfinance Compromising its Social Impact? 11 1.5 Are Indian MFI Valuations too High? 12 1.6 What Happened Since Last Year: Update to the Trends Forecasted in 2008 13
2. Demand and Supply in the Microfinance Market 16
2.1 The Microfinance Industry: A Look at Who is Supplying the Funds 17
2.1.1 Cooperative Banks and Regional Rural Banks 18
2.1.2 Banks: Facing the Limits of the Traditional Branch System 18
2.1.3 SHG-Bank Linkage Program: Strong Base, Slow Growth 19
2.1.4 Microfinance Institutions: NBFCs emerge as Industry Leaders 20
2.1.5 Geographical Reach of SBPL & MFIs: More than 50% Clients are in South India 21
2.2 Demand & Penetration 22
2.2.1 Mapping the Demand for Microcredit in India 22
2.2.2 Market Penetration: Poorest States Remain Under-Served 23
2.2.3 Market Penetration by Number of Clients 24
2.2.4 Market Penetration by Credit Supply 25
Case Study: Uttar Pradesh 26
2.3 Beyond Credit: the Market for Insurance, Savings, and other Services 28
2.3.1 Special Purpose Loans: Moving Towards Consumer Finance 28
2.3.2 Insurance: Strong Growth Potential, Synergies with Credit 29
2.3.3 Savings: Unmet Need; Rise of Proxy Products (Investments) 29
2.3.4 Investments: Growing Interest from Mutual Funds 30
2.3.5 Remittances: A Value Added Service 30
3. Indian MFIs: Growth for Old and New Institutions Alike 32
3.1 Dramatic Industry evolution 33
3.2 Leaders and Young Turks Attract Investors 34
3.3 Decrease in Spread; MFIs Bear Rise in Financial Costs 35
3.4 Leaders Raise the Bar for operating efficiency 36
3.5 Improved Productivity Drives operating efficiency 36
3.6 Increasing Profitability 37
3.7 Deleveraging Balance Sheets 38
3.8 Portfolio Quality: Deterioration in Pockets, Healthy overall 38
3.9 NBFCs exhibit Higher Costs and Profitability, Lower Leverage 38
3.10 Indian MFIs: Lowest Costs, Highest Returns 39
4.The Sector through an Investment Lens 40
4.1 Boom in equity to Indian Microfinance 41
4.1.1 Sector Attracted USD 285 Million in equity 41
4.1.2 equity Flow Based on Performance, Growth Rates and Geography 42

3
4.1.3 entrance of New Investors 42
4.1.4 Larger MFIs Commanded Higher Valuations 44
4.1.5 Sector Witnessing its First Investor exits 44
4.2 Debt Supply: Increasing Sophistication 45
4.2.1 Industry Attracted USD 2.33 Billion in Debt in FY 2009 45
4.2.2 Increasing Participation from Public Sector Banks 45
4.2.3 Sophistication in Debt Instruments 46
5. The Global Economic Slowdown and Indian Microfinance Clients 48
5.1 The Financial Crisis and Microfinance 49
5.2 The Impact on Clients of MFIs 49
5.2.1 Mixed Impact on Income; Job Losses in Urban export-oriented enterprises 49
5.2.2 Increase in Food and Medicine Bills; Reduced Disposable Incomes 50
5.2.3 Difficult and Costlier Access to Microfinance Loans 50
6. The Road Ahead 52
6.1 Continued Growth, emerging Markets 53
6.2 Changing Business Model: Social is Commercial 53
6.3 Regulation: Potentially Game Changing 54
6.4 Technology: emerging Need for open Solutions and Industry Standards 55
6.5 outlook on Capital to the Sector 56
About the Authors 58
APPeNDIX 1: PooReST STATeS: PeNeTRATIoN AND oPeRATING eNVIRoNMeNT 59
APPeNDIX 2: MAIN LeGAL STRUCTUReS IN INDIA 60
APPeNDIX 3: SoURCeS oF DATA 62
APPeNDIX 4: LIST AND DeFINITIoN oF FoRMULAe USeD 63
APPeNDIX 5: CAPITAL PRoJeCTIoNS MeTHoDoLoGY 64
CoNTeNTS

4
BC Business Correspondent
BLP Below Poverty Line
BISWA Bharat Integrated Social Welfare Agency
BSFL Bharatiya Samruddhi Financial Limited
BSS Bharatha Swamukti Samsthe
BWDA Bullock-Cart Workers Development Association
CAR Capital Adequacy Ratio
CAGR Compounded Annual Growth Rate
CGAP Consultative Group to Assist the Poor
CP Commercial Paper
CRR Cash Reserve Ratio
DFI Development Finance Institution
eCA eastern europe and Central Asia
eCB external Commercial Borrowing
eSAF evangelical Social Action Forum
FCRA Foreign Contribution Regulation Act
FDI Foreign Direct Investment
FMo The Netherlands Development Finance Company
FWWB Friends of Women's World Banking
FY Financial Year
GDP Gross Domestic Product
GLP Gross Loan Portfolio
HNI High Net-worth Individuals
INR Indian National Rupee
IRDA Insurance Regulation Development Authority
IPo Initial Public offering
KYC Know Your Customer
LAC Latin America and the Caribbean
MACS Mutually Aided Cooperative Society
MeNA Middle east and North Africa
MFI Microfinance Institution
MFIN Microfinance Institutions Network
MIS Management of Information System
MIV Microfinance Investment Vehicles
NABARD National Bank for Agriculture and Rural Development
LIST oF ABBReVIATIoNS
NBFC Non-Banking Financial Company
NCD Non-Convertible Debentures
NFP Not-for Profit
NGo Non-Government organization
NRIFS National Rural Financial Inclusion System
oeR operating expense Ratio
PACS Primary Agricultural Cooperative Societies
PAN Permanent Account Number
PAR Portfolio at Risk
PAT Profit After Tax
P/BV Price to Book Value
PCo Public Call office
Pe Private equity
PLR Prime Lending Rate
PSL Priority Sector Lending
PTC Pass Through Certificate
RBI Reserve Bank of India
RMK Rashtriya Mahila Kosh
RoA Return on Assets
Roe Return on equity
RRB Regional Rural Banks
SBLP Self Help Group-Bank Linkage Programme
SeBI Securities and exchange Board of India
SHG Self Help Group
SLR Statutory Liquidity Ratio
SSI Small Scale Industry
SIDBI Small Industries Development Bank of India
SIP Systematic Investment Plan
SKS Swayam Krishi Sangam
SPV Special Purpose Vehicle
UID Unique Identification
UP Uttar Pradesh
USD United States Dollar
VC Venture Capitalists
VFS Village Financial Services

5
INTRoDUCTIoN
The Inverting the Pyramid series was launched by Intellecap in 2007 as an attempt to capture the growth of the microfinance industry in India on an annual basis and track the efforts made, success achieved and challenges that remain. every year, it maps the microfinance landscape in India, identifies key highlights of the year, explores strides made in addressing the huge demand-supply gap that exists and analyzes the performance of MFIs. Further, it identifies key drivers for future growth and sustainability of this industry, its capital needs and its risks and priorities in the short to medium term.
The 2007 edition titled The Changing Face of Indian Microfinance captured Indian microfinance as a dynamic industry on the move. In 2008, Indian Microfinance: Scaling Against the Odds captured a resilient industry maintaining scale and asset quality amidst a turbulent financing landscape.
The 2009 report, Indian Microfinance: Coming of Age finds India at the centre of global attention, the most closely watched microfinance market in the world. While its large unbanked population is a significant contributor to this attention, its fast growth, high investor interest, planned IPos and continued strong operational and financial performance have also piqued the interest of investors, thought leaders, media and the public alike.
Chapter one explores five key questions on the minds of industry observers as heard in global microfinance conversations. Topics covered range from the frenzied pace of growth of Indian MFIs to whether they are losing their social orientation with increasing commercialisation to governance and valuations.
While the India tops the global list of recipients of commercial capital for microfinance, the number of people still financially excluded runs into millions. Chapter two puts this dichotomy in perspective by estimating the unmet demand for microfinance and related products and the extent of current supply in the Indian market. Further, this chapter examines emerging products and services being offered by MFIs and gauges the potential for their expansion.
Chapter three captures an Indian microfinance market whose structure and dynamics are vastly different from what they were two years ago. The industry emerged from the financial crisis more consolidated – the market that was made of numerous, small and medium sized, non-profit players gave way to one dominated by fewer large commercial players that are successfully attracting equity and debt capital, human resources and clients at a fast rate.
The traditional tier classification of MFIs based on their portfolio size fails to capture the emerging dynamics and activity in the market which led us to create an alternate classification that accounts for growth rates. Using this method, we identify three major classes of MFIs: the Leaders, the Moderates and the Young Turks. In chapter three, we examine the growth and performance of each of these segments in greater detail. Towards this, Intellecap uses financial and operational data of a sample of 29 MFIs in the country that constitute 80% of the market by portfolio outstanding.
Chapter four then explores where the growth capital for the industry is coming from, who it is going to, the outlook on exits for equity investors and the increasing sophistication in financial instruments used in the industry. We find that hedge funds, high net-worth individuals and blue chip private equity players have entered the market amongst others, and public sector banks have increased their exposure contributing a fourth of the debt capital needs of the sector.
In chapter five we examine the impact of the financial crisis of 2007-2008 on the clients of Indian MFIs. We find that home-based urban workers were hardest hit, and disposable incomes fell overall, as did savings, coupled with increased difficulty in accessing credit.
Finally, in chapter six, we look at how the industry could evolve in the near future. The section covers how recent regulation on business correspondents could change the microfinance landscape and projects debt and equity capital needs of the market for the next five years.

6
1exploring Pressing Issues in Indian Microfinance

7
During the last year the Indian microfinance industry has been both praised for its performance and also questioned about its growth path and its commitment to the social cause the sector represents.
The global investor community has commended the sector for its achievements and its promise of high growth, expressed by the quantum of capital – most notably, private equity – flowing to Indian MFIs and by the number deals made during the year. At the same time, on a global scale, the media, eminent industry experts and other stakeholders, have questioned this rampant commercialization, looking to understand what can be expected in the near future.
What are the questions that are being raised? And what more can be said about these issues?
This chapter sets out to explore whether the sector is in fact growing beyond its capacity, the implications and the effects of its connection with the commercial financial markets, and to present some the questions that will find meaningful answers within this entire report.
Is Indian microfinance growing too fast?
Is Indian microfinance a bubble in the making?
How well are Indian MFIs governed?
Is the commercialization of microfinance compromising its social impact?
Are Indian MFI valuations too high?
1.1 Is Indian Microfinance Growing Too Fast?
7,945
3,339
6,138
11,734
20,008
10,689
2007 2008
Clients (in thousands) GLP (in INR crore)
2009
Indian MFIs have grown at a spectacular rate between 2004 and 2009: year on year the average increase in the number of clients has been 91% and that of the size of the portfolio outstanding 107%. even in the midst of a global economic slowdown, the industry witnessed incredible growth from 2008 to 2009, growing by 75.5% in client base and by 102.5% in portfolio outstanding, an achievement largely driven by the performance of the top MFIs. The number of giants in the industry is also on the rise; the Reserve Bank of India (RBI) refers to MFIs with a gross loan portfolio (GLP) greater than INR 100 crore (USD 22
million) as “systemically important”: the number of such MFIs has increased from seven in 2007 to 17 in 2009.
In comparison with the growth in the microfinance industry, the retail portfolios of commercial banks in India grew by merely 4% in the last year.1 For certain stakeholders, this is a basis to argue that the growth of Indian microfinance is too fast, and it is leading to an oversupply of capital in the market.
1. Source:RBI Trend and Progress of Banking in India, 2008-09
Figure 1: GLP and Clients 2007-2009
eXPLoRING PReSSING ISSUeS IN INDIAN MICRoFINANCe

8
To understand if this is so, it is important to look at the primary driver of growth; the extent to which demand for credit remains unmet is the force behind the industry’s explosive growth. MFIs and the SHG-Bank Linkage Program2 (SBLP) together can be estimated to cater at most to 10% of the demand for microcredit in the country.3 Moreover, this supply is not uniformly spread: over 60% of all credit is disbursed in three states in South India: Andhra Pradesh, Karnataka, and Tamil Nadu. By comparison, in Uttar Pradesh, the state with the largest population of potential microfinance borrowers,4 MFIs have met less than 1.5% of the demand. Thus, as growth is driven by the huge market potential and fuelled by investors’ and bankers’ confidence in the sector, one could argue that such high growth rates are not cause for concern, but in fact the natural progression of a sunrise sector.
To put this growth in perspective, one can see that similar industries such as mainstream banking have demonstrated high growth rates in their early growth stages. For instance, in the early 2000s, during the banking boom in India, the retail portfolio of ICICI bank, a leading Indian private bank, grew by about 240% each year between 2002 and 2004. Despite its incredible growth, the Indian microfinance industry with its balance sheet size of INR 11,734 crore (USD 2.5 billion), is still smaller than many individual companies in the mainstream retail or consumer finance space, many of whom demonstrate comparably high growth rates5.
1.2 Is Indian Microfinance a Bubble in the Making?
During the Asian financial crisis of the late 1990s, microfinance globally proved to be resilient and counter-cyclical. This time around, microfinance markets in countries such as Nicaragua, Morocco, Bosnia and Herzegovina are facing a major drop in asset quality and profitability, a fallout of the subprime crisis and the global economic slowdown in markets already weakened by unhealthy competition, overstretched MFI capacities and loss of credit discipline.
Recent media coverage has portrayed the Indian microfinance industry as a bubble threatening to burst, which is what would happen if MFI clients were getting loans beyond their repayment capacity. In reality, the industry continued to demonstrate high growth and a healthy portfolio quality.
However, there have been isolated incidents of over-lending in some pockets of the country. examples include Kolar,6 Mysore and Tumkur districts of Karnataka and in Lucknow and Agra districts of Uttar Pradesh (UP), where uncontrolled lending and clients borrowing from multiple sources, coupled with high risk local socio-political dynamics, have led to mass defaults. These incidents affected under 5% of the industry’s total portfolio outstanding. As the Chairman of Basix, Vijay Mahajan, noted, "These incidents are best viewed as a vaccination, a little shot to prevent further illness", rather than an indication of where the entire industry is headed.
In addition, microfinance is increasingly compared with subprime lending and skeptics speculate that a similar crisis is in the making. This comparison is likely to be flawed given the inherent differences between the two industries. Subprime loans were disbursed to people with poor credit history and were backed by over-valued assets while microfinance lends to the poor with unknown credit histories and repayments are guaranteed by social collateral. Subprime loans were given
2. The SHG Bank Linkage Program is a government-supported initiative started in the 1980s by the National Bank for Agriculture and Rural Development (NABARD) to facilitate financial intermediation in rural areas.
3. Demand, supply and penetration will be treated exhaustively in chapter 2 of the report.4. In this study potential client for microfinance services are defined as households with a yearly income of less than INR 150,000 (USD
3,260).5. Shriram Transport Finance Company (STFC), a Non Banking Finance Company (NBFC) that lends primarily to truck drivers and owners has
a balance sheet of INR 23,279 crore (USD 5.06 bn) and its consumer finance portfolio grew at an impressive CAGR of 68% between 2005 and 2009 , a portfolio that is perhaps more comparable to microfinance than mainstream banking.
6. See Box 1: Incidents of Mass Loan Default: a Localized Bubble.
MFIs and the SHG-Bank Linkage
Program (SBLP) together serve at most10% of
the demand for microcredit in the
country.
eXPLoRING PReSSING ISSUeS IN INDIAN MICRoFINANCe

9
out at variable interest rates and longer tenures (often decades), while microfinance is a standard, one year loan product with weekly or fortnightly payments, which leaves little opportunity to hide defaults. Moreover, as the pay of MFI field staff is often linked to portfolio quality, they have limited incentive to push loans to unworthy borrowers. Subprime lending agents, on the other hand, were often incentivized to give out as many loans as possible, and were immune to the impact of downstream defaults. Finally, the systemic risk posed by subprime lending is not comparable to that posed by the microfinance industry today. As observed by the Deputy Governor of the RBI Usha Thorat,7 the microfinance industry is too small for any problem with asset quality to become systemic. At INR 11,734 crore (USD 2.5 billion), spread across several banks, an impact on the financial system would be negligible.
In addition, the underlying businesses backing microfinance loans remain resilient to the global economic slowdown. Across sectors in most parts of India, the local economy is doing better than the macro economy, possibly making microfinance clients a part of the solution to the economic slowdown rather than a contributor to the problem, unlike subprime borrowers.
Box 1: Incidents of Mass Loan Default: a Localised Bubble
on 3rd February 2009 staff members of MFIs in Kolar visited the area to conduct centre meetings and, instead were met with hostility by the local youth and were threatened against collecting payments from their borrowers. The Anjuman Committee, a local religious entity, had issued a directive to the region’s Muslims through the mosques to suspend all repayments on outstanding loans. Those who disobeyed would be denied a burial service in the mosque and be ostracized from the religion. over the following weeks and months, protests also spread to Muslim communities in Mysore city and Ramanagaram town, as well as a large number of small towns in Tumkur District and other parts of Southern Karnataka. By the end of July 2009, loan defaults in the region were valued at INR 60 crore (USD 13 mn)8.
A closer look into the Kolar incident unearths important learnings for the industry at large. Kolar District has an agrarian economy and has suffered droughts for three of the last five years. The other main industries in the region, handicrafts and silk, have also suffered as a consequence of the global economic slump. The district hosts 43 MFIs that have been pushing hard into a market that was saturating fast. Household incomes were highly leveraged; the credit-deposit ratio of the local banks was 304%. Thus, some clients became over-indebted, such as a borrower close to the Anjuman Committee, who attempted suicide after running up a debt of INR 7 lakh (USD 15,200). Some observers noted that MFIs were responsible for over-burdening clients by their unscrupulous expansion practices that disregarded the effect of the economic downturn on the livelihoods and capacity to repay of their borrowers.
Though Kolar remains an isolated incident in which the “force of religion”9 was used to trigger a default in loan repayments, it is not the first time that borrowers have grouped together to renege on loans. Similar incidents in Agra and Lucknow, where the portfolio quality of several MFIs deteriorated beyond recovery, hint at how fatigue from excessive debt and the collapse of economic activity at the client’s end often play a huge role in igniting repayment crises.
7. economic Times, March 8, Gold rush over for microfinance.8. Microfinance Insights Vol. 16 - Lessons for Microfinance from an erstwhile Mining Town.9. Bellamkonda Ramesh, Battle of Kolar – A watershed event in Indian microfinance, November 2009.
"These incidents are best viewed as a vaccination, a little shot to prevent further illness"
- Vijay Mahajan, Basix Chairman
eXPLoRING PReSSING ISSUeS IN INDIAN MICRoFINANCe

10
1.3 How Well are Indian MFIs Governed?
Given the scepticism around the industry’s high growth and institutional capacities to manage this growth in light of emerging risks, governance and regulation gains relevance.
In recent times, governance and regulation have taken a more forward-looking view, and MFIs are pro-actively addressing these both within their own organisations, and at the industry level. The tighter financing climate resulting from the global financial crisis and a few domestic incidents of mass defaults have made Indian MFIs and their stakeholders more cognizant of the risks of the business, and have reinforced the need to adopt sound risk management practices. The rapid growth of the industry has brought to the fore issues such as over-indebted clients, MFI staff misconduct and political interference, and the sector as a whole is considering the implications of these issues for its long-term sustainability. Corporate governance for individual organizations revolves around the fundamental issue of effectively balancing social and commercial objectives.
With the Non-Banking Finance Company (NBFC) increasingly becoming the legal form of choice for old and new players, a choice primarily driven by the necessity to raise capital commercially in the financial markets, the corporate governance practices of MFIs will have to evolve to become comparable to the good practices of commercial players. Some leading NBFCs are setting the standard in the industry for being well governed and having high-profile boards that comprise of independent directors and industry experts. The MFI boards appoint a set of sub-committees in functional areas to ensure reasonable control on the MFI’s operations; these include Audit, Risk Management, Human Resources Development, operations, and Asset Liability Management. The Committees constitute a balanced mix of independent and executive directors who keep the Board informed of important issues and areas of concern. Transparency in disclosing one’s operating and financial information is another key area where some MFIs are proactively taking steps.
The evolution towards better governance practices in the industry is being driven not just through the practices of individual MFIs, but also by a collective movement: in 2009 35 leading NBFC MFIs came together to form a Self Regulatory organization called the Microfinance Institutions Network (MFIN) to lobby for policy–related matters and tackle emerging business risks, most notably the problem of regulating the conduct of MFIs and the need for credit information sharing between MFIs. This group formed Alpha Microfinance Consultants Pvt. Ltd., a company that invested into the first credit bureau for the microfinance industry. MFIN also formulated a Code of Conduct which will require member MFIs to share qualitative credit information, be transparent in their charges and adopt practices to prevent over-lending to borrowers.10 The code binds member MFIs to not lend to a client who is already borrowing money from three institutions, or whose total outstanding debt exceeds INR 50,000 (USD 1,100). Finally, MFIN will also be opening dialogue with the RBI, other regulators such as the Insurance Regulation Development Authority (IRDA), the Ministry of Finance and the political class to advocate for NBFC MFIs, in order to allow them to accept client savings, access external commercial borrowings, act as agents to micro insurance providers and become business correspondents11 (BCs) to banks.
10. http://blogs.cgdev.org/open_book/2010/01/bubble-controversy-simmers.php.11. RBI provision that allows banks to use business facilitators to provide financial and banking services in under-served areas. RBI circulars
issued in April and May 2009 increased the maximum distance from the bank of a business correspondent (BC) from 15kms to 30kms and expanded approved business correspondents to include Kirana , medical and fair price shop owners, PCo operators, petrol pumps, retired teachers and functionaries of SHGs as BCs.
Leading NBFCs are setting the
standard for good governance...
...in 2009 a group of leading NBFC
MFIs formed a Self Regulatory
Organization called the Microfinance
Institutions Network (MFIN)
eXPLoRING PReSSING ISSUeS IN INDIAN MICRoFINANCe

11
1.4 Is the Commercialization of Microfinance Compromising its Social Impact?
Indian microfinance is accused of becoming too commercial, and of pursuing investor interest over that of other stakeholders, often compromising on its social impact. Yet, many believe that the goal of financial returns and social impact are in fact complementary, rather than divergent. The growth and commercialization of Indian microfinance has meant greater outreach to the poor and can translate into better choice and service for the client. Interest Spread
35%
30%
25%
20%
15%
10%
5%
0%‘02 ‘03 ‘04 ‘05 ‘06 ‘07 ‘08 ‘09
Effective InterestCharged
SBI Advance RateInte
rest
Rat
e
The rising competition in more mature markets has led to a decrease in interest rates charged, as MFIs have realised that serving their clients’ interests is the key to commercial success. Between 2002 and 2009 the effective interest rate12 charged to clients by leading MFIs13 went from 31.10% to 25.94%14. The cost of capital to these MFIs over the same period slightly increased, thus reducing the spread from 20.35% to 14.19%. As shown in Figure 2, the advent of commercial capital in the industry, and the first phase of transformation of MFIs from NGos to for-profit businesses is in fact associated with a reduction in the rate of interest charged to clients.
<-10%
10-20%
20-30%
30-40%
>40%
200720082009
The advent of commercialisation has also driven MFIs to reach out to poorer clients in new markets. At the end of FY 2009, MFIs were present in 436 of the 621 districts in India, including 70% of the poorest districts, up from 63% the previous year.15
In 2005, 48% of all clients were concentrated in Andhra Pradesh, a figure that is now 25%. existing players and new entrants alike have begun operations in the North and North east, the poorest regions of India. Start-ups such as Utkarsh in Varanasi, Uttar Pradesh and Saija are evidence of this trend, see Figure 3. established MFIs also rapidly expanded their presence in the poorer states including in orissa, Chhattisgarh, Rajasthan, Madhya Pradesh and Uttar Pradesh.
With urban poverty growing at a faster pace than rural poverty, the need for financial access
12. Weighted average of our sample.13. Data from SKS, SHARe, Spandana and Basix were included.14. Bandhan recently reduced interest rates to 19%.15. Bharat Microfinance Report, Quick Data 2009, Sa-Dhan.
Figure 3: Map of Startup MFIs 2007-2009
Figure 2: Interest Spread 2002-2009
Between 2002 and 2009 the effective interest rate charged to clients by leading MFIs fell from 31.10% to 25.94%.
At the end of 2009, MFIs were present in 436 of the 621 districts in India, including 70% of the poorest districts
eXPLoRING PReSSING ISSUeS IN INDIAN MICRoFINANCe

12
amongst the urban poor is increasing. The Indian microfinance industry, traditionally focused on women in rural areas, is now expanding in urban areas to serve this unmet demand. In FY 2009 28% of all MFI clients were from urban areas. Young MFIs such as Ujjivan and equitas focus their operations on urban areas and have demonstrated that urban markets are as credit worthy as rural markets. Some MFIs have also begun to lend to men in these areas. In FY 2009 7% of all MFI clients were men, led by male joint liability groups formed by Basix, and Bazaar loans to male traders by Arohan.
Finally, the commercialisation of the sector has also encouraged innovation that supports better client service. The need to ensure customer stickiness while growing the institution’s revenue and profitability has led to innovations in products and processes, many of which are beneficial to clients. For example, in their quest to improve operating efficiency, MFIs have found ways to shorten the time spent at group meetings, making them more convenient for clients. Some have started offering clients benefits such as subsidised rations, while others are tailoring their products to their clients’ cash flows, and offering add-on products such as housing and education loans.
1.5 Are Indian MFI Valuations too High?
Indian MFIs are receiving the highest valuations in the world. A recent report by the Consultative Group to Assist the Poor (CGAP) and JP Morgan16 shows that the median price to book value (P/BV) multiple in India is 5.9, thrice that of global multiples. Some have been quick to call this “irrational exuberance” on the part of investors.
Analysis shows that while the leading large MFIs have been able to command very high premiums, valuations vary across the sector based on investor type, MFI class and stage of investment.
The vast market potential, demonstrated growth of the sector and positive macro-economic outlook contribute to relatively higher valuations in India. In addition, the number of investors chasing deals with the few large, high growth MFIs has driven up their valuations considerably. These MFIs are able to command valuations upwards of 10 times their projected Profit After Tax (PAT). early stage MFIs on the other hand, are typically valued lower, at between one and three time book value17.
Across the sector, the drivers of value are primarily growth and returns, both demonstrated and potential. Thus, to put Indian MFI valuations in perspective, it is instructive to compare the return on equity (Roe) and PAT growth of the leading MFIs with other financial service business, banks and NBFCs. As shown in Table 1, leading MFIs outperformed Banks and NBFCs on both counts. on average, MFI Roe is 32.1%, a full 12 percentage points higher than that of Banks and NBFCs. MFI profits grew over three times that of the sample banks’, and five times that of the sample NBFCs’ between 2006 and 2009. The closest comparable in this sample to MFIs in terms of business model is Mannapuram General Finance18, as their clientele is similar to that of MFIs and loan sizes are relatively low (INR 20,000), although their loans are backed with collateral. Despite the company’s Roe and PAT growth being lower than those of MFIs, its P/BV is at 8.4, higher than average for leading MFIs.
Thus, given the enormous market potential, the ambition of leading Indian MFIs, and their demonstrated high growth, prudent cost management and thus high returns, the current valuation
16. CGAP, JP Morgan, occasional Paper: Microfinance Global Valuation Survey 2010, March 201017. Intellecap analysis.18. A listed NBFC that provides gold and vehicle loans, amongst other services.
The number of investors chasing
deals with the few large, high growth
MFIs has driven up their valuations
considerably.
eXPLoRING PReSSING ISSUeS IN INDIAN MICRoFINANCe

13
levels are not surprising. As the market matures and growth rates drop, valuations too can be expected to fall.
Table 1: ROE, PAT growth and P/BV of Leading MFIs, Banks and NBFCs
MFI ROE (2009) PAT CAGR ‘06-‘09 PAT Growth ‘08-‘09 P/BV (2009)SKS 18.30% 466% 382%
5 - 7Spandana 44.60% 102% 234%Share 37.60% 99% 795%Basix 17.80% 79% 118%Asmitha 37.10% 111% 408%Average 31.08% 171% 387%Select Listed Banks ROE (2009) PAT Growth ‘06-‘09 PAT Growth ‘08-‘09 P/BV (2009)Axis Bank 19.10% 55.30% 69.50% 3.9Yes Bank 20.60% 76.60% 51.50% 5.3HDFC Bank 17.20% 37.10% 41.10% 5.3Average 19.00% 56% 54% 4.8Select Listed NBFCs ROE (2009) PAT Growth ‘06-‘09 PAT Growth ‘08-‘09 P/BV (2009)Mahindra Finance 15.40% 25.70% 21.20% 2.4Shriram City Union Finance
20.20% 14.00% 33.60% 3.1
Sundaram Finance 13.70% -4.00% -29.10% 1.7Mannapuram General Finance and Leasing
23.20% 97.20% 44.40% 8.4
Average 18.20% 33.20% 17.50% 3.9Source: Analysis done using audited financial statements
1.6 What Happened Since Last Year: Update to the Trends Forecasted in 2008
Inverting the Pyramid: Indian Microfinance Scaling Against the odds, the prequel to this report portrayed Indian microfinance in 2008 as a highly dynamic sector that was increasingly attracting commercial capital and where for-profit business models were emerging at the key to achieving scale. In the last year, these trends have gained greater momentum, and some others have emerged.
The 2008 report identified five major trends. While most of these trends – the increase in the number and quantum of equity transactions to the sector, the launch of new business-oriented start-up MFIs, the emergence of NBFC as the dominant legal form for MFIs – continued in the last year, pilots to explore the business correspondent model and professional service providers to MFIs showed limited movement.
eXPLoRING PReSSING ISSUeS IN INDIAN MICRoFINANCe

14
Table 2: Updates to Trends Identified in 2008
Trend identified in 2008 Update from 2008-09
Increase in the number and quantum of equity investments
This trend continues, with 17 deals closed in FY 2009, valued at •INR 867 crore (USD 188 million).
Emergence of new business-oriented start-up MFIs
This trend continues with more start-ups whose promoters have •mainstream financial services backgrounds. These MFIs have built systems and processes, and have raised equity early.
Mainstream corporations have started venturing into •microfinance.
An MFI from Bangladesh has acquired an Indian NBFC and is •starting operations in West Bengal.
Emergence of NBFC as the dominant legal form choice
80% of the market by portfolio is now held by NBFCs, 73% by •clients.
The top 5 MFIs by portfolio are now NBFCs.•
Increase in pilots with technology and business correspondent (BC) model
The number of no-frills accounts opened under the financial •inclusion movement through the Business Correspondent (BC) model has reached 25 million accounts as of July 2009.19
Technological advances by technology providers such as A •Little World (ALW) are making headway in lowering the cost of opening rural bank branches. ALW claims that they will soon bring the cost of opening a service point down to INR 20,000 (USD 435).20
RBI circulars issued in 2009 allows a new host of players to •become agents of banks in the BC model. This group does still not include the majority of MFIs in the NBFC (for-profit) legal form.
A host of other business are now exploring the field given the •new regulation, including petroleum companies and retail chains.
Increase in professional services to MFIs
This trend continues with more services offered in various areas-
Specialised service providers have evolved to structure more •sophisticated financial products and facilitate these deals - securitization, Non-Convertible Debentures (NCDs), etc.
Mainstream accounting, audit and consulting firms including •have started‘ financial inclusion’ verticals
Technology firms supporting MIS needs of start-ups and •established MFIs with complex system integration requirements
outsourcing field staff hiring and training needs is a new trend •met by existing and new professional service providers
19. Skoch Development Foundation, Report on Financial Inclusion, July 200920. Ibid.
Professionally managed start-ups
Saija, Utkarsh and Suryoday are amongst the new entrants whose promoters have financial services backgrounds
Corporations
L&T Finance entered the market and has grown rapidly, achieving a GLP of over INR 450 crore (USD 97 mn) in a year.
International Players
ASA from Bangladesh has acquired an MFI and is starting operations in West Bengal
Financial Services Providers
Intellecap, IFMR Capital, Grameen Capital
Auditors, Consultants
ernst & Young, Intellecap and Dun and Bradstreet
Technology Consultants
Infrasoft Tech, Craft Silicon, Accenture and MoSTFIT
Human Resource
Microfinance Training Academy, V-Shesh
eXPLoRING PReSSING ISSUeS IN INDIAN MICRoFINANCe

15
eXPLoRING PReSSING ISSUeS IN INDIAN MICRoFINANCe
2Demand and Supply in the Microfinance market

17
21. This was established by the Reserve Bank of India while granting exemption for microfinance companies registered under Section 25 of the Companies Act from the core regulatory provisions governing NBFCs in January, 2000.
22. The SBLP was developed by NABARD in 1991-92 and became a normal activity of banks in 1996. Thanks to rapid growth NABARD’s target of linking one million SHGs was achieved in 2005, three years ahead of the target date.
Microfinance loans are by far the preeminent form of finance for the poor in India. Yet, despite the unstoppable growth of the market in terms of low income clients served and in the credit disbursed, microcredit has made but a small dent in the demand. There is also an incresingly widespread awareness that credit alone does not fullfill the financial needs of clients: financial services such as remittances, micro investments, and insurance are emerging as promising products.
This chapter looks at how microfinance has served the low income population of India during the year that has gone by. The main focus will be on understanding who are the main actors in the supply of microcredit and what has been done to meet the sizeable demand in the market.
2.1 The Microfinance Industry: A Look at Who is Supplying the Funds
Microfinance in the Indian context is formally defined as the provision of financial credit through loans of up to INR 50,000 (USD 1,087) to households that are traditionally considered not to be credit worthy, and typically lack access to banking and related financial services.21 There are two prominent channels of delivery of microcredit in the country: MFIs exclusively focused on serving lower income groups through small size loans, and the SBLP a model developed by National Bank for Agriculture and Rural Development (NABARD),22 through which Self Help Groups (SHGs) of women can jointly take a loan from a bank.
The money that flows through these two channels originates from lending relationships further up the chain. The ecosystem is constituted by the actors represented by Figure 4 below.
1
Apex Funders:NABARD, SIDBI
Public & Private SectorBanks
Cooperatives
State Agriculture &Rural Development
Bank
PACSDisbursement -
INR 36,762 crore
MFIsOutstanding-
INR 11,734 crore
SHGsDirectFunding
IndirectFunding
Key:Flow of funds
SBLPOutstanding-
INR 22,680 crore
Microloans to the poor,including landless wagelaborers, micro-entrepreneurs, small and marginal
farmers and those self employed in the informal economy
Predominantly loans to larger farmers & smallbusinessmen. Also some microloans to small /
marginal farmers
Regional RuralBanks
Disbursement-INR 26,724 crore
Figure 4: Financial Service Providers
All MFIs that lend on a commercial basis borrow money from commercial banks to finance their growing loan portfolios. In the SBLP model, the money that is lent to SHGs comes directly from the bank. Both banks and MFIs are partly funded by apex bodies like the National Bank for Agriculture
DeMAND AND SUPPLY IN THe MICRoFINANCe MARKeT

18
and Rural Development (NABARD) and the Small Industries Development Bank of India (SIDBI), which also supply funds to agricultural cooperative societies (PACS) and Regional Rural Banks (RRBs).
2.1.1 Cooperative banks and Regional Rural Banks
31,231
39,40342,480
48,258
36,762
26,72425,312
20,43515,22312,404
2005 2006 2007
Coorerative Banks RRBs
2008 2009
The portfolios of PACS and RRBs have a strong focus on agriculture and allied activities, but predominantly lend to large farmers and small businesses. Low income clients constitute a very small portion of their portfolios. Small entrepreneurs, especially in urban areas, are only catered to by MFIs and informal credit providers.
Both PACS and RRBs play an extremely important role as funders and promoters of rural development.
The two channels joinly disbursed INR 63,488 crore (USD 13.8 billion) in FY 2009, more than twice the amount disbursed by MFIs and the SBLP in the same year. In the first half of 2010, PACS and RRBs have already disbursed INR 45,236 crore (USD 9.8 billion).
2.1.2 Banks: Facing the Limits of the Traditional Branch System
Although 40% of all the bank branches of Public and Private Banks taken together are in rural areas, only 5.2% of villages are served by the branch system,23 an indication of the limitations of the banking system in reaching out to the rural population.
While priority sector lending norms encourage commercial banks to extend credit to MFIs and SBLPs, RBI regulations prevent commercial banks from lending at a rate higher than the Prime Lending Rate (PLR)24. This ceiling, coupled with the high transaction costs involved in serving rural customers, makes reaching out to the unbanked in remote rural areas a loss-making business proposition.
To overcome this limitation, RBI is currently in the process of revising regulation on the PLR, and a change is expected to be introduced effective April 2010.25 Additionally, the RBI is also encouraging using the BC model in reaching out to the unbanked. In this model banks use intermediaries (the BCs) to reach out to the unbanked population in villages and help them open no-frills accounts. BCs are enabled to service the customer on behalf of the bank, using technology-based solutions that help overcome some of the barriers and transaction costs that make serving rural areas through traditional branch infrastructure unviable.26
Further, at the policy level there is a strong drive towards achieving financial inclusion by providing all bankable people and institutions with access to credit, all insurable people and firms with insurance, and universal access to savings and payment services.27 The Raghuram Rajan Committee on Financial Sector Reforms has recommended the National Rural Financial Inclusion System (NRIFS) with the following objectives:
23. Source: Presentation by Dr. K.C.Chakrabarty, Deputy Governor, RBI at 20th SKoCH Summit 2009, Mumbai on 17 July 2009.24. The Prime Lending Rate is the lowest interest rate commercial banks charge their most credit-worthy customers.25. Source: Business Standard, http://www.business-standard.com/india/news/rbi-moots-base-rate-to-replace-plrapril/85514/on.26. In 2006 the RBI allowed non-profit organizations to become BCs of banks, as part of its larger agenda to deepen financial inclusion in In-
dia. entities like NGos, non-profit sister concerns of NBFCs, kirana stores, STD booths and gas stations can be appointed as BCs by banks to provide a range of financial services including savings.
27. Source: UNDeSA and UNCDF Report, ‘Building Inclusive Financial Sectors for Development’ (The Blue Book), 2006.
Figure 5: Amount Disbursed by Cooperative Banks and RRBs from 2005-09 (INR crore)
DeMAND AND SUPPLY IN THe MICRoFINANCe MARKeT

19
(i) enabling every adult to open a bank account
(ii) establishing a dense nationwide network of transaction points spanning the ‘last mile’
(iii) establishing an inter-bank exchange to ensure that transactions are recorded in real-time.
NRIFS has set a target to provide comprehensive financial services to at least 55.7 million unbanked rural households by 2012, and to all unbanked households by 2015.
Table 3 below, details the rapid growth of number of no-frills account opened. However, as of 31 March 2009, of the 8,866,00028 accounts that were opened by the 26 public and private sector banks that are using BCs, only 11% are operational.29 While the opening of these bank accounts is driven with impetus at the policy level, the initiative currently entails no measures to encourage people to use the new facilities to deposit their savings, nor does it effectively enhance people’s capacity to accumulate savings from their disposable income.
Table 3: Number of No-frills Accounts by Agency (in ‘000s)30
Year Public Sector banks Private Sector banks Foreign banks Total2006 333 156 0 4892007 5,865 861 6 6,7322008 13,910 1,846 33 15,7892009 29,859 3,124 41 33,025
2.1.3 SHG-Bank Linkage Program: Strong Base, Slow Growth
The SBLP is a government-supported initiative started in the 1980s by the NABARD to facilitate financial intermediation in rural areas. This programme encourages SHGs of women to save and then graduate to taking loans directly from a bank. Having run in its current form for almost two decades, the SBLP is by far the largest method of disbursement of microcredit in the country.
With a portfolio outstanding of INR 22,680 crore as on 31 March 2009 (USD 4.9 billion), the SBLP channel is twice the size of the portfolio of all MFIs. However, MFIs are growing twice as rapidly. Between 2006 and 2009, the size of the portfolio outstanding of MFIs has increased at a CAGR of 83%, while that of SBLP has increased at a CAGR of only 41%.
Though the portfolio of the SBLP is currently greater than that of MFIs, the MFI channel will soon overtake it. The SHG program is limited in its capacity to grow rapidly to scale, most notably because of the requirement that monthly savings be made by SHG members for six months before the first loan can be disbursed to the group by the bank it is ‘linked’ to. The MFI channel overtook the SBLP in disbursements in 2007 (see Figure 6), as SBLP loans have 2-3 year tenures and therefore new loans are disbursed less frequently than new loans by MFIs.
28. Source: Report of the RBI Working Group to Review the Business Correspondent Model, August 2009.29. Source: Report by S. Kochhar, Skoch Development Foundation, ‘National Study on Speeding financial inclusion’, July 2009.30. Source: Address delivered by Dr. K.C.Chakrabarty, Deputy Governor, Reserve Bank of India at the Mint’s ‘Clarity Through Debate’ series,
Chennai on 10 August 2009.
DeMAND AND SUPPLY IN THe MICRoFINANCe MARKeT
Of the 9 million no-frills accounts opened for the unbanked through BCs only 11% are operational
The loan portfolio of the SBLP channel is twice the size as that of MFIs, but is growing only at half the speed

20
4,444
3,876
6,916
11,396 12,254
8,849
6,570
2006 2007
SBLP MFI
2008 2009
14,081
Figure 6: Amount Disbursed by SBLP and MFI Channel from 2006-09 (INR crore)
2.1.4 Microfinance Institutions: NBFCs Emerge as Industry Leaders
Society 8%Trust 6%Section-25 6%Others 6%
NBFC 80%
The MFI channel includes organizations under a host of different legal forms that can be classified in two groups: for-profit organizations and not-for-profit organizations. The latter include Societies, Trusts and Section 25 companies, while the former are the Non-Banking Finance Companies (NBFCs).31
In terms of contribution to the aggregate portfolio of the MFI channel in 2009, NBFCs account for 80% of the total outstanding portfolio of INR 11,734 crore (USD 2.5 billion).32 The top three Indian MFIs, all of which are NBFCs, alone contributed to 48% of total MFI portfolio. The share of NBFCs grew from 65% of the total portfolio in 2007 to 71% of the total in 2008.
31. See Appendix I32. Source: Address delivered by Dr. K.C.Chakrabarty, Deputy Governor, Reserve Bank of India at the Mint’s ‘Clarity Through Debate’ series,
Chennai on 10 August 2009.
DeMAND AND SUPPLY IN THe MICRoFINANCe MARKeT
Figure 7: Distribution of GLP by Legal Structure
Figure 9: Growth in NBFC Market Share by GLP (INR lakh)Figure 8: Growth in NBFC Market Share by Clients
20,000,000
15,000,000
10,000,000
5,000,000
2007 2008 2009
Not-for-profit NBFC
0
19%
41%
59%
35%
65%
75%
25%
2007 2008 2009
1200000
1000000
800000
600000
400000
200000
0
Not-for-profit NBFC
35%
29%
65%71%
81%
19%19%

21
In terms of the number of clients NBFCs hold 75% of the approximately 18 million clients across India, namely 13.5 million clients. The total number of clients served by the MFI channel over the years has grown from 7.3 million in 2007 to 10.3 million in 2008 and the share of NBFCs has been growing as shown in Figure 9.
2.1.5 Geographical Reach of SBLP & MFIs: More than 50% Clients are in South India
Historically, SBLP and MFIs have concentrated their attention in the south, and for both channels, three of the top six states by number of clients, are still in South India: Andhra Pradesh, Tamil Nadu, and Karnataka. The South constitutes 66% of the SBLP portfolio and 59% of the MFI portfolio.
There is a notable overlap in the geographies served by the SBLP and MFIs: For the most part, MFIs have
followed the SBLP in selecting operating geographies. They capitalize on the ground work done by the SBLP in awareness building, inculcating credit discipline and groups formed at the start of their operations.
Karnataka
Orissa
Maharashtra
West Bengal
Tamil nadu
Andhra Pradesh
0 5000 10000 15000
32294018
14404366
22094596
23656143
23547493
494915851
MFI
SBLP
However, MFIs have been diversifying their portfolios across regions to a greater extent: 20% of the MFI portfolio is in eastern India and 12% is in Central India, while the SBLP portfolio in these regions is 13% and 9%, respectively.33
33. The division of Indian states into regions is the same adopted by as NABARD for its reports on microfinance.
DeMAND AND SUPPLY IN THe MICRoFINANCe MARKeT
66% 13% 9% 7% 2%
59% 20% 11%
3%
3%6% 1%
100%80%60%40%20%0%
MFI
SBLP
South East Central West North North East
Figure 11: State-wise Clients (in ‘000s) - SBLP & MFI
Figure 10: Region-wise Distribution of Portfolio - SBLP & MFI

22
Currently, 75% of all SBLP clients are in 6 states, while MFI display even greater concentration, and have 75% of their total client base in 5 states. Andhra Pradesh is the state where both channels have achieved maximum coverage, and where in terms of number of clients, SBLP is three times as big as MFIs.34 In less penetrated areas like Uttar Pradesh and Madhya Pradesh, MFIs have established a presence much faster than the SBLP.35 By contrast, the SBLP has managed to grow in Uttarakhand, Rajasthan, Bihar and Assam where MFIs have just started to operate.
2.2 Demand & Penetration
The market potential for microfinance in India, expressed through the estimated size of the total demand for microcredit, is huge: INR 330,049 crore (USD 72 billion). MFIs currently meet only 3.6% of this demand. The poorest districts are still underserved, and even in the most highly penetrated regions, the financial services offered are mostly limited to credit. The following sections of this chapter seek to measure the demand for microcredit and how the supply is distributed.
2.2.1 Mapping the Demand for Microcredit in India
over 430 million people, or 37% of the population in India,36 live below the poverty line (BPL). The vast majority of Indian households with an annual income less than INR 1.5 lakh (USD 3,260), a total of 700 million people,37 though not necessarily of BPL status, still lack access to essential financial services like credit, insurance, and savings facilities, and therefore constitute the potential target client base for microfinance services.38
Table 4: Estimated Demand for Micro-credit
No. of target households
Total Credit demand (INR
crore)
Total Credit demand (USD
billion)
Average Credit demand per
household (INR)
Average Credit demand per
household (USD)
Urban 24,712,703 71,832 15.62 29,067 632
Rural 117,508,000 258,217 56.13 21,974 478
Total 142,220,703 330,049 71.75 23.207 505
As shown in Table 4 above, the total demand for the sector can be estimated at INR 330,049 crore (USD 72 billion).39
MFIs typically offer loans of amounts that are in the range of 20% to 50% of a client’s annual household income. The value of 33% of a household’s income can be assumed as an average measure for a household’s demand for credit,40 which yields an average credit need of INR 29,000 (USD 630) for urban clients and INR 22,000 (USD 478) for rural clients. Very few MFIs provide loans of this size, except to clients with a proven track record of on time repayment. Keeping loan sizes small serves to maintain household leverage low, and mitigate the risks associated with unsecured lending. Yet, this data also points at another emerging risk, that of clients borrowing from multiple sources at the same time in order to meet their credit needs. In regions served by multiple competing MFIs such risk of multiple borrowings is high.
34. Source: NABARD data reports only number of SHGs; the average number of members per SHG is taken to be 13. 35. In percentage terms.36. Source: The Hindu, http://beta.thehindu.com/news/national/article63279.ece.37. Source: Intellecap analysis of sample data.38. Based on Reserve Bank of India regulations, all loans that have a principal amount of INR 50,000 (USD 1,100) or less are classified as
“micro credit”.39. The four tiers depict districts sorted by quartile, thus boundaries are outliers – Island of Diu at INR 4 crore (USD 870,000) total demand and
Greater Mumbai at INR 4,105 crore (USD 892 million).40. In India consumer loans offered by commercial banks have sizes up to 150% of the borrowers’ household income. The demand for credit as
33% of a household’s income is therefore a fairly conservative estimate.
DeMAND AND SUPPLY IN THe MICRoFINANCe MARKeT
MFIs currently only meet 3.6% of the
demand for micro-credit projected at INR 330,049 crore
(USD 72 billion)

23
Looking at credit demand from a geographical perspective, India can be divided into six regions.41 Based on population size and poverty levels, South India has the highest demand for icrocredit, which is in part why MFIs and the SBLP have the highest percentage of their portfolio in this region. The state with the highest estimated demand is Uttar Pradesh, followed by Maharashtra, the Southern states
and West Bengal, driven primarily by the large low income population in these regions.
Project Demand (INR crore)
4 - 247
Not Available
247 - 448
448 - 786786 - 4105
Figure 13: Micro-credit Demand by District
A closer look at how demand is distributed within each region can be offered by Figure 13, displaying the intensity of demand by district.42 What emerges is that each region, even the ones that rank lower on the overall scale – West, North, and North east – have certain districts where the demand is strong and comparable to the highest demand districts in the South. This hints at opportunity for microfinance across every state of the country.
41. The classification followed is based on that supported by NABARD.42. The four tiers depict districts are sorted by quartile, thus the boundaries are outliers – Diu at INR 4 crore total demand and Greater Mumbai
at INR 4,105 crore.
DeMAND AND SUPPLY IN THe MICRoFINANCe MARKeT
Figure 12: Demand by Region, % of Total Micro-credit Demand

24
2.2.2 Market Penetration: Poorest States Remain Under-Served
Looking at microcredit market penetration in terms of the number of customers served in relation with the total potential client base, MFIs and the SBLP together43 are close to achieving 53% penetration, of which 39% is by the SBLP and 14% through the MFI channel. By credit supply, the total market penetration is less than 10%: 7% by the SBLP and 3% by the MFI channel.44
2.2.3 Market Penetration by Number of Clients
The microfinance industry in India initially developed in the southern states because of the higher educational and social status of women, better financial literacy and the successful uptake of the SBLP. Figure 14 below presents market penetration in terms of number of clients served in each state. Andhra Pradesh remains the most highly penetrated market, with 45% of the target population receiving microfinance services. Interestingly, this implies that even in the most penetrated state there is still an unserved client base and many who are reached are under-served.
< 1%
15 - 25%> 25%
1 - 5%5 - 10%10 - 15%
Figure 14: Micro-credit Penetration by State (Clients/Market Potential)
43. Assuming that only one member per household is accessing microcredit, and that there is no overlap between the two programs in terms of the same borrowers taking loans from both sources at the same time.
44. Demand: INR 330,050 crores (USD 71.75 billion); Loan outstanding MFI: INR 11,734 crores (USD 2.55 billion) & SHG: INR 22,680 crores (USD 4.93 billion).
DeMAND AND SUPPLY IN THe MICRoFINANCe MARKeT
25
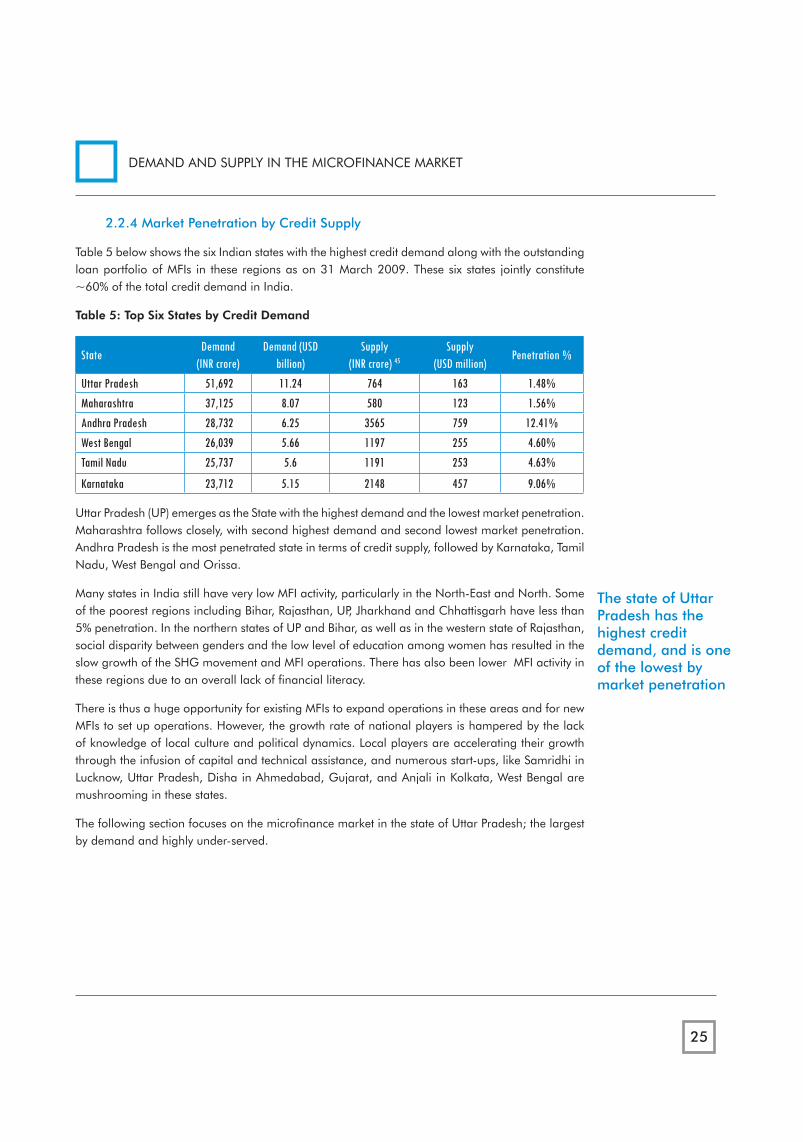
2.2.4 Market Penetration by Credit Supply
Table 5 below shows the six Indian states with the highest credit demand along with the outstanding loan portfolio of MFIs in these regions as on 31 March 2009. These six states jointly constitute ~60% of the total credit demand in India.
Table 5: Top Six States by Credit Demand
StateDemand
(INR crore)Demand (USD
billion)Supply
(INR crore) 45
Supply (USD million)
Penetration %
Uttar Pradesh 51,692 11.24 764 163 1.48%Maharashtra 37,125 8.07 580 123 1.56%Andhra Pradesh 28,732 6.25 3565 759 12.41%West Bengal 26,039 5.66 1197 255 4.60%Tamil Nadu 25,737 5.6 1191 253 4.63%
Karnataka 23,712 5.15 2148 457 9.06%
Uttar Pradesh (UP) emerges as the State with the highest demand and the lowest market penetration. Maharashtra follows closely, with second highest demand and second lowest market penetration. Andhra Pradesh is the most penetrated state in terms of credit supply, followed by Karnataka, Tamil Nadu, West Bengal and orissa.
Many states in India still have very low MFI activity, particularly in the North-east and North. Some of the poorest regions including Bihar, Rajasthan, UP, Jharkhand and Chhattisgarh have less than 5% penetration. In the northern states of UP and Bihar, as well as in the western state of Rajasthan, social disparity between genders and the low level of education among women has resulted in the slow growth of the SHG movement and MFI operations. There has also been lower MFI activity in these regions due to an overall lack of financial literacy.
There is thus a huge opportunity for existing MFIs to expand operations in these areas and for new MFIs to set up operations. However, the growth rate of national players is hampered by the lack of knowledge of local culture and political dynamics. Local players are accelerating their growth through the infusion of capital and technical assistance, and numerous start-ups, like Samridhi in Lucknow, Uttar Pradesh, Disha in Ahmedabad, Gujarat, and Anjali in Kolkata, West Bengal are mushrooming in these states.
The following section focuses on the microfinance market in the state of Uttar Pradesh; the largest by demand and highly under-served.
DeMAND AND SUPPLY IN THe MICRoFINANCe MARKeT
The state of Uttar Pradesh has the highest credit demand, and is one of the lowest by market penetration

26
Case Study: Uttar Pradesh
Uttar Pradesh, with a population of over 190 million people as on July 1, 2008, is India’s most populous state. over half the population, approximately 21.5 million households in the state earn less than INR 150,000 per annum, making UP the largest market in India for the microfinance industry.
Overview of the Economy
UP is the second largest state economy in India, contributing 8.17% to India's total GDP. over the last ten years the economy has grown at a rate of 4.4% per year,46 a rate lower than most other states. Thanks to its fertile soil and abundance of water UP produces food in surplus. The state has good road and rail connectivity and hosts 2.3 million Small Scale Industrial units,47 over 12% of the country’s total. Production in these units faces challenges of erratic power supply and unavailability of adequate raw materials at competitive prices.
The Formal Finance Sector
The state is served by a wide bank network. out of a total of 9,123 branches of all banks operating in the state, 53% operate in the rural areas and 17% in semi-urban areas.48 While the reach achieved in rural areas is impressive, the growth of the rural branch network of formal banking institutions has been stagnant for the last 3 years. For every 16,000 people in the state, there is only one bank branch, a low figure given that a branch typically serves only up to 10,000 people.
Historically, the demand for finance and the requirements of micro and small scale entrepreneurial activity in the state has been served by banks, small NBFCs and private money lenders. The Scheduled Commercial Banks often surpass prescribed targets for priority sector lending (PSL) as percentage of total credit, but have not met their Annual Credit Plans (total credit to be distributed)for the last three years. The overall credit-to-deposit ratio for the formal banking sector is also decreasing year on year. The supply of financial services in rural areas of the state is not growing in line with the demand generated by the growing population and inflation.
Microfinance Institutions
As of March 2009, there are 18 MFIs working in the state, with a client reach totaling approximately 800,000. of these, 12 are local players concentrating on one or two districts.
Table 6: MFIs in Uttar Pradesh
Number of Districts MFIs1-2 Jaago Samajik Arthik & Harit Vikas Sanghatan, Margadarshak Development Services Pvt Ltd,
Mimoza Enterprises Finance Pvt Ltd., Pahal, SE Investments, Sambhav Micro Finance Institute, Shramik Bharti, Disha Social Organisation
2-4 Bandhan, biswa, Nirmaan Bharati, Peoples Action for National Integration, Yuva Chetna Kendra5-10 Satin Credit Care, Cashpor, Sonata
15-22 SHARE Microfin, SKS
DeMAND AND SUPPLY IN THe MICRoFINANCe MARKeT
18 MFIs operating in Uttar Pradesh,
with a cumulative outreach of 800,000
clients
46. Source: Central Statistical organisation, Directorate of economics & Statistics of respective State Governments, and for All-India.47. Source: Development Commissioner, Ministry of Micro, Small and medium enterprises, http://www.dcmsme.gov.in/publications.48. Source: State Lead Bank for UP, http://www.slbcup.com/pages/bankatglance.html.

27
only few MFIs have a presence in more than three districts in the state, including some national players. existing MFIs are slowly expanding their reach in UP, and new MFIs are increasingly starting operations in the state. Newer MFIs such as Se Investments, Sonata and Utkarsh, show high growth and have developed innovative products for the local market. For example, Se Investments has successfully diversified into loans for small enterprises and auto rickshaw drivers.
0-5%
5-10%
10-15%
15-20%
0%
Currently only 39 out of 71 districts in UP have registered microfinance activity. The districts that display the greatest number of active MFIs are the ones in the North West, mainly Agra, Meerut and Mathura, as well as Kanpur, Lucknow, and a cluster of districts in eastern UP, which is notorious for its criminal activities. Cashpor Micro Credit has strived to build financial literacy and credit discipline in the nine districts of this area for the last 13 years.
Densely populated clusters and a homogeneous geography, along with good rail and road connectivity, make UP a cost-effective region for microfinance institutions. The concentration of low-income people in clusters and the high level of small-scale entrepreneurial activity in urban and semi-urban areas add to the market potential for micro credit. The high dependence on seasonal agriculture along with small land holdings and limited employment opportunities, encourage the uptake of micro-entrepreneurial activity, and migration to other states in search of low-skill employment. This seasonal migration is a vast opportunity for MFIs to provide interstate remittance services.
The reach of formal financial institutions for the low income population in UP is inadequate, and the unmet demand remains huge. Thus, there is a vast opportunity for MFIs to serve small farmers and micro-entrepreneurs, especially by developing products that address the credit needs of agriculture and allied activities.
Yet, the population of the state is deeply divided not only on the basis of religion but also on the basis of caste. These social divisions pose a challenge to MFI operations in the state, as inter-caste and inter-religious group affinity tends to be lower. In addition, the lack of financial literacy and credit discipline increase the effort required by MFIs to engage with this segment and increase the uptake of microfinance in the state.
The state also has a strong network of money lenders and middle men in various value chains that have traditionally provided the low income segment with credit. These actors are likely to resist the spread of microfinance, as the industry directly conflicts with their interests. In addition, a highly criminalized political environment poses challenges to the industry, demanding a conscious effort on the part of MFIs to show political neutrality in their operations.
DeMAND AND SUPPLY IN THe MICRoFINANCe MARKeT
Figure 15: MFIs in Uttar Pradesh
Only 39 of 71 districts of Uttar Pradesh have registered microfinance activity

28
2.3 Beyond Credit: the Market for Insurance, Savings, and Other Services
Indian MFIs are arguably thriving in a gap left by the absence of more affordable formal sources of credit, but are slowly evolving towards a role greater than that of mere providers of loans. ‘Plain vanilla’ loans for income generation purposes still constitute 95% of an average MFI’s portfolio,49 but factors such as increased competition have made MFIs shift their focus to designing products tailored to the clients’ needs, to increase client stickiness.
Beyond credit, an entire range of financial services is now being looked at by MFIs as a complement to their product portfolio. Credit-linked life insurance has long been a standard offering of MFIs, though providing it is in the best interest of the institutions themselves, to mitigate credit risk while earning commissions from insurance companies. However, more sophisticated services such as special purpose loans, a variety of other insurance products, and remittance facilities are emerging as segments in which there is a strong demand. MFIs, even the ones that lack a strong livelihood orientation, see opportunity in venturing into the commercial provision of these services. This trend points to a more holistic engagement of the client with the financial markets, as MFIs’ product offerings align with the mission for financial inclusion.
2.3.1 Special Purpose Loans: Moving Towards Consumer Finance
MFIs are increasingly expanding their range of credit products beyond the traditional income generation loan or productive asset financing to encompass loans designed for special purposes. Along with increasingly popular education loans and credit to finance access to water and sanitation facilities, MFI product portfolios are evolving to include loans for the purchase of consumer goods. These loans are typically offered to clients as supplementary to the ones they may have outstanding and are designed to finance the purchase of a very specific item, for example a solar lantern, a refrigerator, a water purification device, stoves, and other durable items. Most of the financial products developed for these purposes have been part of pilot projects wherein MFIs stretched beyond their core activity of credit supplier, and also served as distributor or promoter of the goods. As such, most of these loan products have not graduated to becoming part of the product portfolio of the MFI.
Home improvement loans are also emerging as a promising attempt to bridge the gap in the housing finance needs of the poor. SKS in Andhra Pradesh has been piloting a house improvement product targeted at members who have been with SKS for at least three years. The product has a ticket size that is higher than that of most other types of loans, and typically between Rs 50,000-150,000, and a tenure between three and five years. This product is offered as an individual mortgage-backed loan, marking a shift from the group model.
Some MFIs have also created tailored credit schemes to finance the working capital needs of some clients. For example, SKS has tied up with wholesaler chain Metro Cash & Carry to extend inventory credit to small provision stores called kirana shops, in rural areas. The cost of a week's worth of stock is paid upfront to the wholesaler by the MFI and the repayment by the store owner is expected within one week.
DeMAND AND SUPPLY IN THe MICRoFINANCe MARKeT
'Plain vanilla' loans for income
generation purposes still constitute 95%
of an average MFI's loan portfolio...
... but special purpose loans are
emerging to bridge the gap between
demand and supply
49. Source: Intellecap analysis of sample data

29
2.3.2 Insurance: Strong Growth Potential, Synergies with Credit
In India, a minimum of 94% of the 130 million households earning less that USD 2 per day lack any form of insurance cover.50 ‘Microinsurance’ is the financial service that enables the lower income population to mitigate material risks through the insurance market, reducing their vulnerability and hence increasing their welfare. In India, it is provided by private and government-owned insurance companies, community institutions working directly with the poor, and government agencies responsible for social security programs. Insurance products can be categorized into four main types: life insurance, health insurance, asset insurance, and agricultural (crop and weather) insurance. Livelihood-focused institutions like BASIX have been consistent in providing a range of different insurance services tailored to their clients’ needs and livelihoods, but most Indian MFIs, and mainly the smaller ones, have still not gone beyond offering compulsory credit-life insurance to their clients, where the amount taken as a loan is insured in the event of the borrower’s death. In the market, 80% of microinsurance is provided by formally registered insurance providers (companies), 90% of which is provided as compulsory credit-linked life insurance.
The potential for insurance can be gauged by the unmet demand in the market. By some estimates, only 30 million people and 14 million adults are covered by life microinsurance in India.51 Unlike credit, that has a ready demand, insurance is driven by the customer’s adversity to risk, combined with an awareness of business risks, and is thus linked to consumer education. even the commercially-minded MFIs could look at the insurance market as a business opportunity, as providing insurance cover to a community would improve its risk profile, making both the credit and the insurance businesses more sustainable. However, under the current regulatory framework, NBFC MFIs face constraints in the collection and remittance of premiums and were excluded by the provisions made by the Micro-insurance Regulations of 2005 that allow not-for-profit MFIs to serve as special micro-insurance agents.
2.3.3 Savings: Unmet Need; Rise of Proxy Products (Investments)
Under the current RBI regulations, NBFC MFIs, which account for the majority of India’s microfinance portfolio, find it unfeasible to collect deposits from their clients. Though RBI’s concern about the safety of public savings outside of the banking system is justified, practitioners and academics alike agree that the availability of saving facilities is more important than access to credit, and the formal means by which the poor can collect and access them are currently limited. MFIs too would benefit from collecting clients savings, as it would ultimately result in lowering their cost of funds.
The demand for savings accounts can be gauged by the extent to which the country’s people lack access to basic saving facilities: 65% of the population, equivalent to 650 million people or 150 million households, does not have a bank account.52 MFIs report that the demand for savings is actually very high among clients, to the point where alternative financial products that can serve the function of savings are being sought and offered. one of such products are Gold Loans, which allows MFI clients to take a loan to purchase gold. The gold is kept by the MFI as collateral until the loan is repaid. equitas, in Tamil Nadu, has included Gold Loans in their basket of products. These
50. Source: Report by CGAP Working Group on Microinsurance, ‘Making insurance markets work for the poor: microinsurance policy, regula-tion and supervision – India case study’, 2009.
51. Ibid. 52. We are indebted to Financial Information Network and operation Ltd (FINo) for this information.
DeMAND AND SUPPLY IN THe MICRoFINANCe MARKeT
65% of the population, equivalent to 650 million people or 150 million households, do not have a bank account
At least 94% of all low income households in India lack any form of insurance cover

30
loans have a term of up to 2 years and up to Rs. 15,000 in value, and already constitute 1% of the MFI’s GLP.53 The success of these products indicates that a deep engagement with the customer is a key factor in meeting the demand.
2.3.4 Investments: Growing Interest from Mutual Funds
Mutual fund investment is another opportunity for the low-income households to realize returns comparable to those from savings. A great number of funds have introduced investment plans that cater to this segment of the population: Bharti AXA Investment Managers introduced a daily Systematic Investment Plan (SIP) in September 2008, with a minimum required investment of INR 300 (USD 6.6). SBI Mutual Fund and Relince respectively launched Chota SIP and Reliance Common Man SIP, plans wherein a person could invest as less as INR 100 (USD 2.2) per month. Sahara Mutual Fund has filed an application with Securities and exchange Board of India (SeBI) for launching a daily-SIP plan wherein one can invest INR 10 (USD 22 cent) per day. UTI Asset Management Company had introduced a UTI-Retirement Benefit Pension Fund with a minimum investment of INR 50 (USD 1.1) per month. SeWA bank is providing this service to its members. While mutual fund investments are normally subject to complying with the possession of a Permanent Account Number (PAN) by the Income Tax Department card requirements and meeting Know Your Customer (KYC) norms, the SeBI decreed that investment in Micro SIPs up to INR 50,000 (USD 1,087) per year per investor shall be exempted from the ordinary requirements.54
For fund houses managing a large number of low ticket investors is operationally unfeasible due to high operational expenses, and this creates scope for collaborating with MFIs and NGos and other BCs in distributing the product.55 This could help low-income households in accessing this service. However, an SIP is not a simple saving product with low risk, but a complex investment tool, thus the risks and returns need to be communicated to the client before the product is sold to them.
2.3.5 Remittances: A Value Added Service
Remittances play a key role in channeling money to rural regions, where the majority of the population lacks savings accounts. The market for inward remittances sent by workers abroad to India in 2008/09 was approximately USD 50 billion.56 About 70% of the India business of Western Union, a global money transfer company, comes from villages,57 indicating that the majority of the remittance market in India is in fact rural. Money transfer companies and their network of disbursement agents constitute an alternative channel for delivering and disbursing remittance money. Western Union is working with the Indian Postal Service to offer its services through 8,500 post offices, has established 20,000 branches across India, and is looking at increasing its penetration in rural areas by partnering with MFIs.
In 2007 Spandana, headquartered in Hyderabad, Andhra Pradesh and currently the second Indian MFI by size of loan portfolio, entered into a strategic alliance with Western Union to pilot the offer of in-bound money transfer services to peri-urban and rural areas through its branch network. In this model, the MFI acts as a sub-agent to the money transfer company’s master agents. While Spandana discontinued this pilot offering due to lack of profitability of the venture, Western Union
53. equitas Micro Finance India, http://equitas.in.54. Source: Securities and exchange Board of India (SeBI), Letter to Association of Mutual Funds of India, 19 June 2009.55. This is hypothetical. The only MFI that to our knowledge is distributing this product is SeWA Bank. 56. The Hindu Business Line, http://
www.thehindubusinessline.com/2009/09/26/stories/2009092651190600.htm.57. outlook India Business, http://business.outlookindia.com/article.aspx?240795
DeMAND AND SUPPLY IN THe MICRoFINANCe MARKeT
Investment plans are available to low income households
which require contributions as small
as INR 10 (USD 22 cent) per day
The market for inward remittances
to India in 2008 was worth approximately
USD 50 billion

31
is still looking for other MFIs to partner with. Under the BC arrangement, agents are allowed to process remittance transactions on behalf of banks in remote locations unreached by the branch network. While this institutional option still excludes NBFC MFIs, it is potentially game changing for the micro-remittance industry, as it could significantly increase the reach of money transfer services in rural areas, thereby contributing to the financial development of rural communities.
DeMAND AND SUPPLY IN THe MICRoFINANCe MARKeT

32
3Indian MFIs: Growth for old and New Institutions Alike

33
3.1 Dramatic Industry Evolution
over the last two years the organization and dynamics of Indian microfinance has evolved. The industry emerged from the financial crisis more consolidated; the market that was made-up of numerous, small and medium sized, non-profit players gave way to one dominated by fewer large commercial players that are successfully attracting equity and debt capital, human resources and clients at a fast rate. New age MFIs, with professional management teams and aggressive growth plans, are also managing to attract equity and debt, and successfully weather the crisis. In sharp contrast, some of the older and smaller players, many of which failed to attract equity or transform legal structures before the crisis, are shrinking or slowing their growth, sometimes losing human resources and clients to the bigger players. The NBFCs have grown to capture 81% of the market, attracting unprecedented investor interest and media attention and have created a self-regulatory body, MFIN.
In the new market scenario, for-profit MFIs can be categorized into three groups based on their portfolio growth rate, organizational age and portfolio size: Leaders, Moderates and Young Turks. While the aggregate portfolio of the industry has grown by ~103% since 2008, the growth in portfolios of individual MFIs has been variable. The Leaders grew between one and two times the industry average, the Moderates grew at a rate below the industry average and the Young Turks grew more than twice the rate of the industry.
Figure 16: Sample MFIs by Growth Rates, Age & Portfolio Size Note: The size of the circle denotes GLP (figure not to scale)
INDIAN MFIS: GRoWTH FoR oLD AND NeW INSTITUTIoNS ALIKe
NBFCs account for 81% of the microfinance market by GLP
SKDRDP is the only non-profit in the top 10 MFIs by GLP

34
on average, the portfolio of the Young Turks has grown three to five times between 2008 and 2009, with equitas and Sahayata showing extremely high portfolio growth of 13x and 16x respectively. The Leaders have also exhibited consistent performance, averaging 122% growth, with Bandhan-NBFC showing the highest growth at 183%, followed by Spandana at 156%. Growth rates of the Moderates have been lower with a 37% average growth, and only VFS showing close to 100%.
MFI Class DescriptionLeaders This group includes SKS, Spandana, SHARE, Bandhan, Asmitha, BASIX and Grameen Koota - the largest
NBFC MFIs in the country, together managing 65% of the industry portfolio. SKS is the largest and fastest growing MFI, Spandana enjoys high efficiency and robust bottom-lines, SHARE was the first MFI to acquire an NBFC license, Bandhan has demonstrated scale despite having had a non-profit structure for a long period, Asmitha is the youngest of the Leaders, BASIX is the first MFI to start as a NBFC and provide integrated livelihood support services to its clients and Grameen Koota has emerged as a strong regional player.
Moderates This group includes MFIs that have transformed from non-profits to NBFCs and have demonstrated moderate growth. MFIs such as BISWA, BSS, BWDA, ESAF and VFS are part of this group. Many of these MFIs started as NGOs and maintained their non-profit legal status for a longer time than the Leaders, but eventually transformed into NBFCs in order to ensure sustainability, wider access to funds and achieve greater outreach.
Young Turks These are high growth young MFIs promoted by teams with prior experience in banking, financial services or microfinance. This group includes MFIs such as Arohan, Equitas, Mimo, Sahayata, Sarala, Swadhaar and Ujjivan. Many of these institutions started their operations in unexplored or underserved geographies (refer Figure 3 in Chapter one), are backed by strong senior management and governance and are highly capitalized. These MFIs have demonstrated the robustness of their business model within two to three years of starting operations, and their growth rates have outpaced those of the Leaders primarily because of their small size, although Ujjivan and Equitas have managed to attain a significant size in a short span of time.
The following analysis utilizes data for the 19 NBFC MFIs in the Intellecap sample.
3.2 Leaders and Young Turks Attract Investors
Since 2007, when equity investments in the sector took off, investors have consistently shown a preference for MFIs that have high growth potential. Thus, the Leaders and the Young Turks dominate investor pipelines.
Infusion of equity has fuelled the growth of the Young Turks, which have grown 416% and 627% year on year in 2008 and 2009 respectively. While the GLP of the Leaders is 14.7 times that of the Young Turks, their equity base in merely 5 times that of the Young Turks, indicating that the Young Turks have been able to instill investor confidence and attract equity early in their life cycle. These MFIs also dominated the scene with highest number of equity investments, seven in FY 2009 absorbing INR 233 crores (USD 50.6 mn). While the Moderates also received six equity investments,58 the amount was much lower at INR 137 crores (USD 29.8 mn). SKS Microfinance alone raised INR 366 crores (USD 79.6 mn) pushing the total of Leaders to three equity investments totaling INR 441 crores (USD 95.8 mn).
58. This count includes Moderates that are not a part of the Intellecap sample.
INDIAN MFIS: GRoWTH FoR oLD AND NeW INSTITUTIoNS ALIKe
Equity has fuelled the growth of the
Young Turks, which have grown 416% and 627% year on year in 2008 and 2009 respectively.

35
3.3 Decrease in Spread; MFIs Bear Rise in Financial Costs
The media has been critical of the microfinance industry in India recently: The Wall Street Journal,59 The economist and The economic Times have questoned the industry for its high interest rates, accumulation of profits, and contribution to the over-indebtedness of clients.
Intellecap’s analysis shows that these critiques are not entirely sound. While the incomes of MFIs have increased, the growth in income is not proportional to the rising the cost of debt, indicating that MFIs are absorbing part of the rising costs. The yield for all MFIs in the sample is 29% for 2009, up from 21.5% in 2007.60 Some of the drivers that allow for greater yields are:
1. Increasing non-interest income through fees and other credit-related activities such as selling of insurance, remittance services and livelihood promotion activities
2. Recognizing premiums upfront for portfolio-buyout transactions 61
3. Levying higher interest rates in new geographies, while remaining competitive in mature markets
20092007 2008Leaders Moderates Young Turks
8.5%
6.5%
9.0%8.9%
10.7%
9.7%
12.3%12.0%
9.9%
The cost of borrowing62 for MFIs has been consistently growing, with a marked increase in 2009 because of the global economic slowdown and the liquidity crisis (see Figure 17). The average cost of borrowings for the sample has grown to 12.1% from 10.5% in 2008, an increase of 15%.
Until october 2008, both the repo rate63 and the reverse repo rate64 were kept high in order to combat inflation, amplifying the liquidity pressure on banks which increased their lending rates to MFIs. Although the poor’s demand for credit is fairly elastic, MFIs did not pass the entire increase in the cost of borrowing to their clients. This finding has been validated through interviews with promoters and management of MFIs. With the easing of monetary policy towards the end of 2008, there has been an easing of liquidity pressure too, through a gradual reduction in the cost of debt for Indian MFIs.
3.302.95 2.88
6.34
4.06
3.41
2007 2008 2009
Leaders Young Turks
Figure 18 shows the ratio of total income of an MFI to financial expenses, which appears to be declining for both Leaders and the Young Turks. The Leaders absorb some part of the increase in financial expenses and do not pass the entire cost to the clients. Although the Young Turks are still showing a high ratio, it is comparable to that of the Leaders in 2007. It is thus expected that the Young Turks too will follow a declining trend.
Figure 17: Cost of Borrowing
Figure 18 : Ratio of Total Income to Financial Expense
59. WSJ- A Global surge in tiny loans spurs credit bubble in a slum, August 2009, economist- The debate over a bubble in micro lending, August 2009, economic Times- Gold rush over for microfinance, Mar 2010.
60. Total income as a percentage of average GLP.61. MFIs sell non-hypothecated loans to banks and receive cash in return. The loans would then be serviced by the MFI, but be accounted as 62. Interest paid on bank borrowings divided by average debt.63. The Repo Rate is the rate at which banks borrow money from the Reserve Bank of India. An increase in this rate results in borrowing becom-
ing more expensive.64. The Reverse Repo Rate is the rate at which Reserve Bank of India (RBI) borrows money from banks. An increase in this rate results in banks
parking more funds with the RBI, reducing liquidity in the credit markets.
INDIAN MFIS: GRoWTH FoR oLD AND NeW INSTITUTIoNS ALIKe

36
3.4 Leaders Raise the Bar for Operating Efficiency
10.7% 10.3% 10.0%
Leaders Moderates Young Turks
2007 2008 2009
8.7% 7.8%11.0%
63.9%
31.8%
19.0%
The Leaders are stable in their operating expense Ratio (oeR), achieving only minor improvements over three years (see Figure 19). However, based on each MFI’s operating model, region of operations and strategy there are variations within the group–Spandana is the most efficient with an oeR of 6%, while BASIX and SKS have very high oeRs at 16% and 13% respectively. Factors affecting operating costs of an MFI include -
1. expansion strategy: Aggressively investing in expansion to new geographies versus deepening engagement with existing clients and in older geographies
2. Transaction model: Reducing the time spent in conducting group meetings, increasing the group size and maintaining higher borrower to client ratios contribute to increasing the staff’s payload
3. Urban-Rural composition: Running operations in urban areas leads to a higher oeR, owing to higher salary and rent costs
4. Investments in infrastructure: higher recurring expenditure on technology has an impact on the cost structure
The Young Turks show very high oeRs initially owing to heavy investments to fuel their growth, but rapidly fall as these institutions grow. The Leaders have been able to reduce their costs by taking advantage of economies of scale. New MFIs typically take 4-5 months or longer to operate at capacity.
It is also worth noting that reduction in oeR is primarily driven by reductions in non-personnel expenses. For all NBFCs in the sample, the personnel expense ratio has increased from 6.1% in 2007 to 6.7% in 2009; the non-personnel related operating expenses have reduced from 4.7% in 2007 to 3.8% in 2009.
3.5 Improved Productivity Drives Operating Efficiency
Greater efficiency also results from improved staff productivity in terms of both volume and value. The Young Turks have shown a marked improvement of 115% over two years in their borrowers per personnel (management and field staff) ratio, which now stands at 246, better than the Moderates at 167 but still lower than the Leaders at 304. The loan officer to client ratio in the industry is significantly higher.
Figure 19: Operating Expense as a % of Average GLP
INDIAN MFIS: GRoWTH FoR oLD AND NeW INSTITUTIoNS ALIKe
Spandana is the most efficient MFI
with an OER of 6%
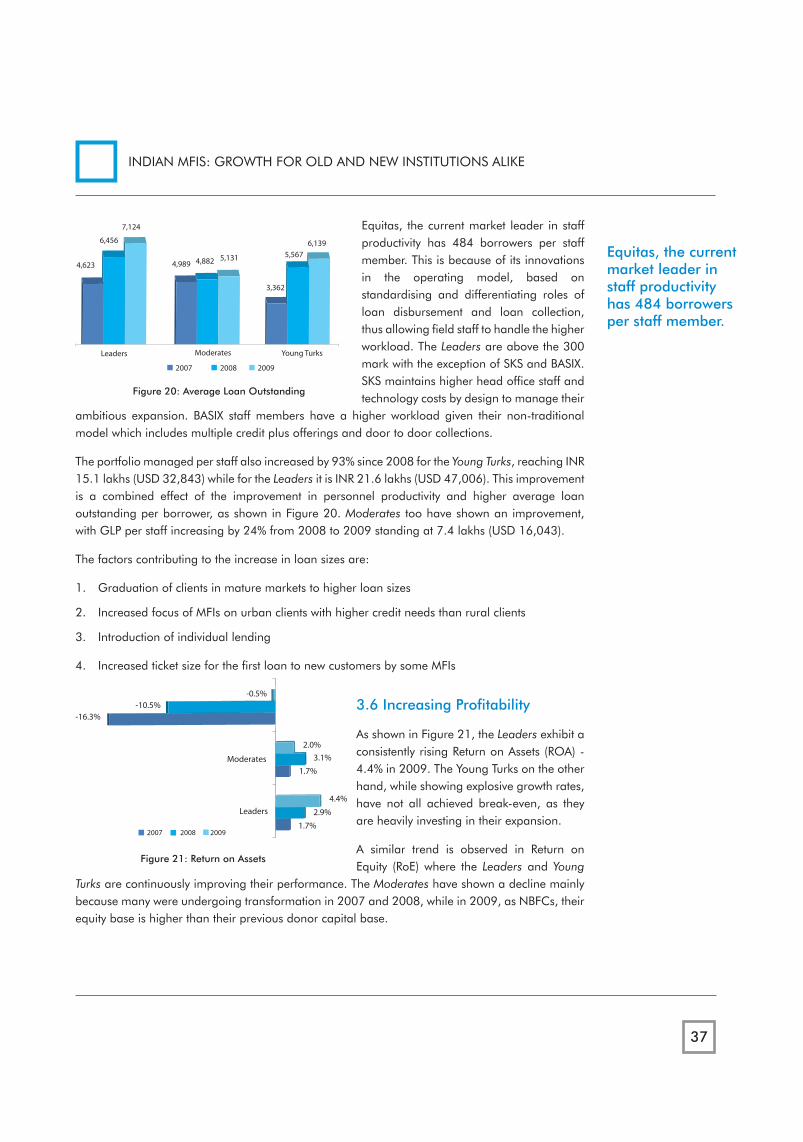
37
4,623
6,456
7,124
4,989 4,882 5,131
3,362
5,5676,139
2007 2008 2009
Leaders Moderates Young Turks
equitas, the current market leader in staff productivity has 484 borrowers per staff member. This is because of its innovations in the operating model, based on standardising and differentiating roles of loan disbursement and loan collection, thus allowing field staff to handle the higher workload. The Leaders are above the 300 mark with the exception of SKS and BASIX. SKS maintains higher head office staff and technology costs by design to manage their
ambitious expansion. BASIX staff members have a higher workload given their non-traditional model which includes multiple credit plus offerings and door to door collections.
The portfolio managed per staff also increased by 93% since 2008 for the Young Turks, reaching INR 15.1 lakhs (USD 32,843) while for the Leaders it is INR 21.6 lakhs (USD 47,006). This improvement is a combined effect of the improvement in personnel productivity and higher average loan outstanding per borrower, as shown in Figure 20. Moderates too have shown an improvement, with GLP per staff increasing by 24% from 2008 to 2009 standing at 7.4 lakhs (USD 16,043).
The factors contributing to the increase in loan sizes are:
1. Graduation of clients in mature markets to higher loan sizes
2. Increased focus of MFIs on urban clients with higher credit needs than rural clients
3. Introduction of individual lending
4. Increased ticket size for the first loan to new customers by some MFIs
-0.5%-10.5%
-16.3%
2.0%3.1%
1.7%
4.4%
2.9%
1.7%
Leaders
Moderates
2007 2008 2009
3.6 Increasing Profitability
As shown in Figure 21, the Leaders exhibit a consistently rising Return on Assets (RoA) - 4.4% in 2009. The Young Turks on the other hand, while showing explosive growth rates, have not all achieved break-even, as they are heavily investing in their expansion.
A similar trend is observed in Return on equity (Roe) where the Leaders and Young
Turks are continuously improving their performance. The Moderates have shown a decline mainly because many were undergoing transformation in 2007 and 2008, while in 2009, as NBFCs, their equity base is higher than their previous donor capital base.
Figure 20: Average Loan Outstanding
Figure 21: Return on Assets
INDIAN MFIS: GRoWTH FoR oLD AND NeW INSTITUTIoNS ALIKe
Equitas, the current market leader in staff productivity has 484 borrowers per staff member.

38
14%20%
28%23% 24%
11%
-1%
-26%-32%
ModeratesLeaders
Young Turks
2007 2008 2009
The rising profitability of the Leaders is driven by their ability to take advantage of economies of scale, as they are able to better leverage their initial investments. These MFIs are also successfully supplementing their interest income with fee based revenue through insurance, managing portfolios, and other product sales. The Young Turks and Moderates are expected to follow the same path in the coming years.
3.7 Deleveraging Balance Sheets
While there has been a general fall in debt-equity ratios across all MFIs, it has been most pronounced among the Moderates because of their transformation from unregulated not-for-profit entities to NBFCs with minimum capital adequacy requirements (CAR). The Young Turks are the least leveraged MFIs, with Ujjivan and Sahayata at less than 1x. These MFIs have large equity bases which allow them to be less dependent on commercial debt which is difficult to access for early stage MFIs. The next step for these MFIs is to start leveraging their equity, which should not be difficult given that they now have a proven record and seasoned portfolios.
The debt-equity ratio in the industry is expected to stabilize at between 4x and 5x, given the more stringent capital adequacy norms that will require NBFCs to maintain a 15% CAR starting in 2012. Most NBFCs are already working toward complying with this stricter requirement, which explains their reducing debt-equity ratios.
3.8 Portfolio Quality: Deterioration in Pockets, Healthy Overall
While global PAR > 30 deteriorated from a median of 2.2% to 4.7% during the first five months of 2009,65 the average PAR > 30 for Indian MFIs stood at <1% in 2009. The Young Turks exhibit the best performance at 0.72%, down from 1.32% in 2008. While there have been instances of increases in PAR in Kolar, Lucknow, Mysore and Tumkur districts, the industry as a whole exhibits a healthy portfolio.
3.9 NBFCs Exhibit Higher Costs and Profitability, Lower Leverage
A performance comparison of NBFC MFIs is presented against the not-for-profit (NFP) MFIs Table 7.
65. CGAP occasional Paper, March 2010
Figure 22: Return on Equity
INDIAN MFIS: GRoWTH FoR oLD AND NeW INSTITUTIoNS ALIKe
Economies of scales allow the
Leaders to better leverage their initial
investments.

39
Table 7: Key Financial Metrics for FY 2009 by Legal Structure
NBFCs NFPsTotal Yield 29.0% 18.6%Operating Expense/ GLP 10.5% 7.0%Cost of borrowing 11.9% 9.8%Funding Expense Ratio 9.98% 10.37%PBT margin 24.2% 4.1%RoA 4.0% 0.6%RoE 23.0% 17.0%Debt: equity 4.10 20.62
The yield for NBFCs is very high compared to NFPs. However, higher yield cannot be attributed to higher interest rates. NBFCs have increased their revenue through fee-based income. The cost of borrowing is also low for NFPs due to their access to concessional debt and savings as debt, both of which also allow for higher leverage.
Table 8 shows increase in interest yield of some NGo-MFIs over last three years-
Table 8: Yield of Select NGO-MFIs
NGO-MFI 2007 2008 2009Cashpor 14.3% 25.4% 23.3%Gram Utthan 15.9% 16.3% 18.5%IIRM 7.9% 13.9% 25.9%
3.10 Indian MFIs: Lowest Costs, Highest Returns
A comparison between the Indian microfinance industry and global markets shows that Indian MFIs have the lowest yields, lowest operating costs, and the highest return on assets. This comparison explains why Indian MFIs are increasingly becoming an attractive option for global investors. Higher operating efficiency allows Indian MFIs to charge amongst the lowest interest rates in the world, and still achieve high returns.
Table 9: Global benchmarking68
Ratio66 Africa MENA ECA LAC Asia India67 Total Yield 38% 31% 32% 47% 31% 28%Operating Expense Ratio 45% 27% 19% 45% 23% 10%Return on Assets -3% 1% -0.5% 0.5% -1% 3.6%
66. For definitions see Appendix 467. 29 Sample MFIs including profit and not-for-profit entities68. 2008 MFI Benchmarks; published by MIX Market
INDIAN MFIS: GRoWTH FoR oLD AND NeW INSTITUTIoNS ALIKe

40
4The Sector through an Investment Lens

41
The global financial slowdown has made investors more aware of the risks of Indian microfinance, but has not dampened their interest in the sector. Both equity investors and lenders remained bullish, and in FY 2009 Indian microfinance received 75% more capital than in FY 2008. The INR 11,734 crore (USD 0.2 bn) portfolio outstanding of the sector was fuelled largely by debt, which was the source of 89% of all capital to the sector, while equity funded the other 11%.
4.1 Boom in Equity to Indian Microfinance
4.1.1 Sector Attracted USD 285 Million in Equity
In FY 2009, the microfinance sector saw changes both in the supply and demand for equity capital; new categories of investors emerged along with a new class of professionally run, high growth MFIs starting operations in new geographies. Between March 2008 and December 2009, the sector attracted over INR 1256 crore (USD 273 mn) through ~29 deals. In FY 2009, 40% of all equity deals in the Banking and Financial Services Sector were in microfinance.
Mar 08 Jun 08 Dec 08Sept 08 Mar 09 Jun 09 Sep 09 Dec 09
MAS by FMO 435
3,660
400
1475060
90
71 249 40 80
940144 185
38
25
25
25
500
125 2,400
72204
533 480450
500220
500
Grameen Koota by Aavishkaar Goodwell
Suryoday by AavishkaarGoodwell
ESAF by Dia Vikas
Sahayata by MicroVenutresKOPSA by Dia Vikas
Saija by Accion International
Utkarsh by Aavishkaar Goodwell, IFC
Bandhan by SIDBI
Ujjivan by Sequoia, Lok, Unitus & others
Spandana by Temasek
Ashirvaad by Lok Capital
Asmitha by BlueOrchard
BSFL by Aashkaar Goodwell, Lok Capital, SIDBI
Equitas by Bellwether, IndiaFinancial, MVA
SKS by Bajaj Allianz
Madura by Unitus
SKS by Sandstone, Kismet
ASA-GV byMicroVest, Unitus, Vinod Khosla
Equitas by MicroVentures, Bellwether
MAS by ICICI Venture
Satin by Lok CapitalArohan by MSDF, Lok Capital
Asmitha by Blue Orchard
Jagannatha from Lok Capital
Equitas by Aavishkaar Goodwell
Swadhaar FinServe fromMSDF, ACCION & Unitus
ASA-GV by Unitus EquityFund, Vidod Khosla
ASOMI by Inco�n
Figure 23: Deals in Indian Microfinance April 2008 – December 2009Note: Spandana-Temasek deal was being negotiated when the report was being written
THe SeCToR THRoUGH AN INVeSTMeNT LeNS
In FY 2009, 40% of all equity deals in the Banking and Financial Services Sector were in microfinance.

42
4.1.2 Equity Flow Based on Performance, Growth Rates and Geography
An analysis of the recent equity transactions in the sector reveals that investors continued to show a bias towards larger, faster growing MFIs. In addition, some distinct investor preferences emerge – investee MFIs were largely professionally managed institutions rather than those managed by promoters with a purely developmental background and increasingly operate in geographically diverse regions, rather than focusing their portfolio in the Southern states.
While 54% of the equity to the sector in FY 2009 went to the Leaders, the largest few MFIs, the evolution in the Indian market has meant that there is growing investor interest for well managed MFIs of all ages and sizes. The Young Turks, ambitious startup MFIs with professional management, received 29% of the equity to the sector in FY 2009 via seven deals. Investors in Young Turks included microfinance investment vehicles (MIVs), mainstream venture capitalists (VCs) and High Net-worth Individuals (HNIs). As a result of the rise in the number of investible MFIs, numerous first time investors entered the fray in 2009.
over the course of the year, investors also sought out investment opportunities in MFIs operating in relatively unsaturated markets and those with a wider geographical spread. Most investors with multiple investments in the sector, especially MIVs, have a significant exposure to the Southern states and are keen to diversify. Consequently, there has been less investor interest in medium and small MFIs in the South. Previously unchartered territory such as eastern Uttar Pradesh and Bihar which have seen limited investments thus far are increasingly attractive propositions.
Regional MFIs have also gained investor confidence in the last year, given their ability to understand the local context and thus serve demand and mitigate external risks well. This has been demonstrated by recent investments in Bandhan in West Bengal, Sahayata Microfinance in Rajasthan and ASA-GV in Tamil Nadu.
The strong investor bias towards MFIs with promoters with a professional background in lending, risk management in financial service sectors, or those with significant experience in the corporate sector continued over the course of the year. This trend is indicative of the industry mainstreaming: as MFIs grow in size and raise more commercial capital, management of risks and returns and transparency is essential. 81% of the equity that flowed to MFIs via the 29 equity deals in the industry between March 2008 and December 2009 went to professionally managed MFIs.
4.1.3 Entrance of New Investors
Consistently high growth and strong portfolio quality has helped strengthen investor confidence in the sector, encouraging new classes of investors to foray into Indian Microfinance. Beyond the traditional MIVs and Development Finance Institutions (DFIs) and early adopters amongst the VCs and Private equity (Pe) funds, Blue Chip Investors, Hedge funds and HNIs are also now participating in the market.
THe SeCToR THRoUGH AN INVeSTMeNT LeNS
54% of the equity to the sector in FY 2009 went to the
Leaders.

43
Table 10: Category-wise investors in FY 2009
Investor Category Prominent Actors
Tradit
ional
MF In
vesto
rs Development Finance Institutions FMO, SIDBI, Dell Foundation, Incofin, ACCION
Microfinance Investment Vehicles Lok capital, Unitus, Aavishkaar Goodwell, Bellweather, Microventures, India Financial Inclusion Fund
Private Equity Funds Blue Orchard, Kismet, SVB, ICICI Venture, Midwest Venture Alliance, Sequoia Capital, Kismet Capital
Venture Capitalists Venture East, SONG Advisors, Khosla Ventures, Catamaran Venture Fund
New
Entra
nts Blue Chip Investors Temasek Holdings, Argonaut Private Equity
High Net-Worth Individuals Suresh Kalpathi, Narayan Ramchandran
Hedge Funds Tree Line Asia Master Fund, Sandstone Capital
4.1.3.1 Blue Chip Investors
Deal sizes for most of the top 10 MFIs has increased to over INR 250 crore (USD 54 mn) per round, making them attractive to large private equity funds with an interest in making one big investment in the sector. These investors are willing to pay significant premiums for large, high growth, pre-IPo MFIs, where exits within 2-3 years are visible. The investment by Temasek in Spandana is a case in point.
4.1.3.2 Venture Capital Funds
Venture Capital investors hitherto had limited opportunities to invest in Indian microfinance as the more established MFIs required large sums of capital, and most small MFIs were not investible, as they lacked professional management and demonstrated limited potential for scale. The emergence of Young Turks such as Sahayata Microfinance, Suryoday Microfinance and Janalakshmi Financial Services, offer VCs a way to enter the market as they are typically looking to invest INR 25-70 crores (USD 5-15 mn) in promising early stage businesses.
4.1.3.3 High Net-Worth Individuals
The maturity of the market and demonstrated success of the business model by the Leaders has built the confidence of individual investors too. Recent angel investments in Indian MFIs such as equitas and Janalakshmi are evidence of this trend. As a result of the RBI limit on foreign holdings in microfinance NBFCs, there is a dearth of domestic capital in the market. The participation of HNIs is thus expected to accelerate during the next few years, especially in early stage Young Turks looking to raise INR 10-50 crores (USD 2mn – 10.8mn).Given the limited number of domestic VC and Pe funds; HNIs are being increasingly sought by MFIs looking to raise INR 10-50 crores. This could lead to valuations among the smaller MFIs coming down, as the domestic money comes at a discount.
4.1.3.4 Hedge Funds
A recent phenomena in Indian microfinance is the participation of hedge funds, validation of the bullish view of the sector taken by investors. Sandstone Capital invested in SKS in FY 2009, and Singapore based hedge fund, Tree Line Asia Master Fund led Janalakshmi Financial Services’ second round of fund raising.
THe SeCToR THRoUGH AN INVeSTMeNT LeNS
Blue chip investors, HNIs and Hedge funds are entering the Indian microfinance market.

44
4.1.3.5 Microfinance Investment Vehicles
MIVs continue to be the largest provider of equity capital to early and mid stage MFIs in India. As their investments mature there are two paths that these funds can take: sell their stake to later-stage entrants, typically mainstream Pe funds or larger MIVs, or consolidate their holdings by investing more. Currently MIVs usually invest up to the second round of capital infusion with the intention of exiting by round four or later.
4.1.4 Larger MFIs Commanded Higher Valuations
In the Indian market, portfolio size commands disproportionately high premiums, as size connotes stability, ability to leverage, and high return potential. The Leaders are thus the ‘pick of the lot’, and their valuations are further driven up by the market supply-demand dynamics as considerable investor interest is concentrated on these few MFIs.
early stage Young Turks and some Moderates have been awarded lower valuations. At smaller sizes, value is driven by performance, growth rates and the quality of management team. First round investors investing INR 10 – 25 crore (USD 2.2 to 5.5 mn) take a calculated call primarily on the MFI management team and have many opportunities to invest at between 1 - 2.5 times book value in these smaller MFIs. Second round investors who have the ability to bring in INR 25 - 50 crores (USD 5.5 – 10.8 million) are currently investing at between three and five times book value.
Investors are increasingly seeking differentiating factors in potential investees - operating in relatively untapped areas, for example, is attractive given the market potential and avoidance of the risks associated with saturated markets and lending to over-indebted clients. At this stage business model innovations are awarded premiums too, especially measures that improve client servicing, enhance customer stickiness and build vertical penetration in business that has grown primarily through horizontal expansion.
4.1.5 Sector Witnessing its First Investor Exits
In the last two years some early investors have been able to exit via secondary sales, typically to DFIs, HNIs or MIVs. For example, Sequoia Capital bought out Kalpathi Investments’ 10% stake in equitas and Hivos Triodos Funds, the International Finance Corporation and Shore Capital sold their stakes in BASIX to Lok Capital, Aavishkaar Goodwell, India Microfinance Development Company and SIDBI. There is also heightened investor interest in the initial public offering (IPo) being planned by SKS which will set a precedent for exits in the Indian microfinance market.
Box 2: Did the Kolar Incident Make a Difference?
The impact of the Kolar incident on valuations, and capital to the sector was not as widespread as expected, given the media hype. It was limited to regional players with large exposures to the district. National players emerged unscathed as the percent of their portfolios impacted was minor. Some regional MFI valuations dropped after the Kolar incident, and the plight of smaller MFIs that were previously unable to attract equity was exacerbated.
THe SeCToR THRoUGH AN INVeSTMeNT LeNS
Some early investors have exited via
secondary sales to DFIs, HNIs and MIVs in
the last two years.
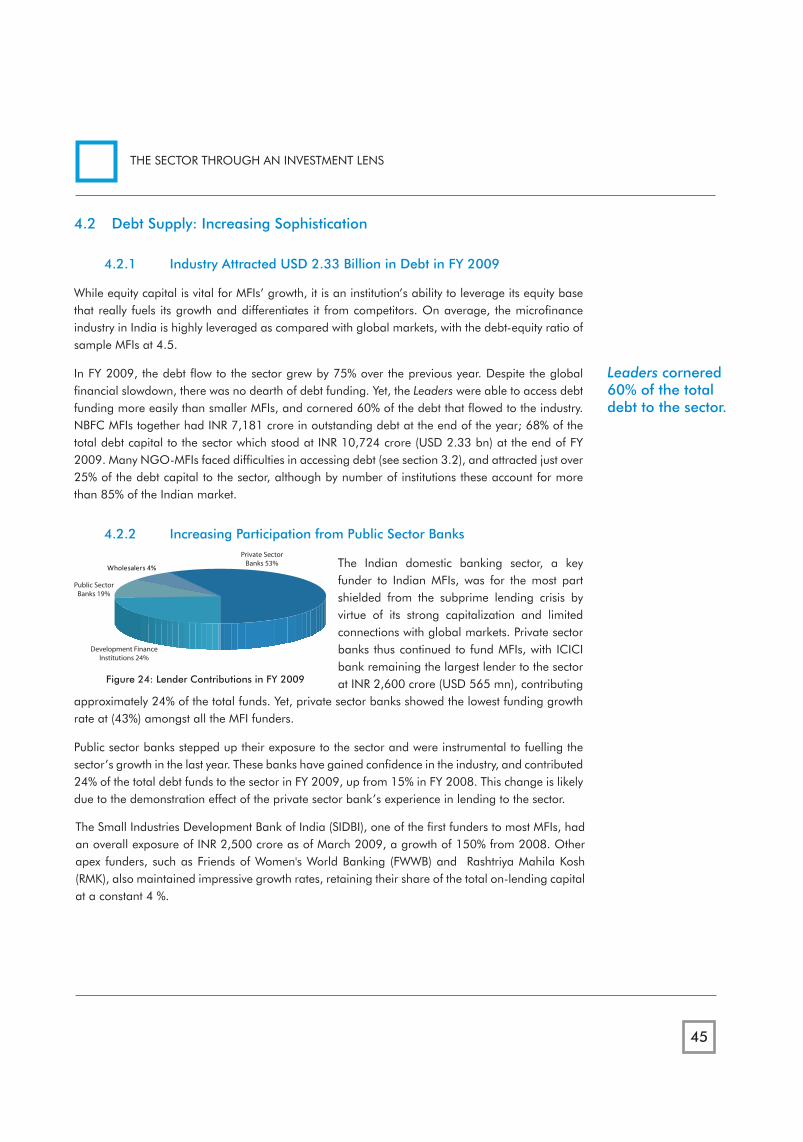
45
4.2 Debt Supply: Increasing Sophistication
4.2.1 Industry Attracted USD 2.33 Billion in Debt in FY 2009
While equity capital is vital for MFIs’ growth, it is an institution’s ability to leverage its equity base that really fuels its growth and differentiates it from competitors. on average, the microfinance industry in India is highly leveraged as compared with global markets, with the debt-equity ratio of sample MFIs at 4.5.
In FY 2009, the debt flow to the sector grew by 75% over the previous year. Despite the global financial slowdown, there was no dearth of debt funding. Yet, the Leaders were able to access debt funding more easily than smaller MFIs, and cornered 60% of the debt that flowed to the industry. NBFC MFIs together had INR 7,181 crore in outstanding debt at the end of the year; 68% of the total debt capital to the sector which stood at INR 10,724 crore (USD 2.33 bn) at the end of FY 2009. Many NGo-MFIs faced difficulties in accessing debt (see section 3.2), and attracted just over 25% of the debt capital to the sector, although by number of institutions these account for more than 85% of the Indian market.
4.2.2 Increasing Participation from Public Sector Banks
Development FinanceInstitutions 24%
Public SectorBanks 19%
Wholesalers 4%
Private SectorBanks 53% The Indian domestic banking sector, a key
funder to Indian MFIs, was for the most part shielded from the subprime lending crisis by virtue of its strong capitalization and limited connections with global markets. Private sector banks thus continued to fund MFIs, with ICICI bank remaining the largest lender to the sector at INR 2,600 crore (USD 565 mn), contributing
approximately 24% of the total funds. Yet, private sector banks showed the lowest funding growth rate at (43%) amongst all the MFI funders.
Public sector banks stepped up their exposure to the sector and were instrumental to fuelling the sector’s growth in the last year. These banks have gained confidence in the industry, and contributed 24% of the total debt funds to the sector in FY 2009, up from 15% in FY 2008. This change is likely due to the demonstration effect of the private sector bank’s experience in lending to the sector.
THe SeCToR THRoUGH AN INVeSTMeNT LeNS
Leaders cornered 60% of the total debt to the sector.
The Small Industries Development Bank of India (SIDBI), one of the first funders to most MFIs, had an overall exposure of INR 2,500 crore as of March 2009, a growth of 150% from 2008. other apex funders, such as Friends of Women's World Banking (FWWB) and Rashtriya Mahila Kosh (RMK), also maintained impressive growth rates, retaining their share of the total on-lending capital at a constant 4 %.
Figure 24: Lender Contributions in FY 2009

46
Table 11 : Lender category-wise exposure to MFIs in FY 2009
Lender Category Prominent ActorsPrivate Sector Banks ICICI Bank, AXIS Bank, ABN AMRO, HDFC BankDevelopment Finance Institutions SIDBI, NABARDPublic Sector Banks SBI, PNB, Indian bank, Corporation BankDomestic Lending Intermediaries FWWB, RMK, Trust MicrofinMicrofinance Debt Investment Vehicles Oikocredit- Manaveeya Holdings, Hivos-Triodos, Opportunity
International
Aside from standard term-loans and portfolio buy-outs by banks, NBFC MFIs can also harness capital through wholesale lenders such as FWWB and RMK, and can tap into international debt funders through the SeBI route, via instruments such as NCDs. Non-profit MFIs also have the option of accepting client savings, an inexpensive way to fund their portfolios, and are permitted to accept external commercial borrowings (eCBs) of up to USD 5 million.
Recognizing the need to diversify their funding sources and minimise the cost of capital, Indian MFIs are actively exploring alternative funding instruments beyond traditional debt (term loans and portfolio buy-outs) and equity. As the sector matures, innovations in instruments are rapidly emerging, as are institutions to support this niche market, including IFMR Trust, Unitus Capital and Grameen Capital India. A number of other DFIs are in the process of designing alternate funds to support the growth of the sector. In addition to providing diversity of sources of funds, these new alternate instruments and institutions are also paving the way for the entry of new classes of investors such as mutual funds and insurance companies.
4.2.3 Sophistication in Debt Instruments
Collateralized debt instruments via term loans and portfolio buyouts continued to be the primary sources of debt capital for Indian microfinance. However, in the last year, the sector witnessed increasing sophistication in debt instruments. This is an indication that the industry is maturing and that banks and other participating institutions such as mutual funds are willing to subscribe to these innovative instruments. The volume of capital brought in to the sector through these alternate instruments, while still only a fraction of the total, is an indication of the future of financing in Indian microfinance.
In the near term, securitization is likely to become increasingly popular. The last year saw a rise in securitization transactions, including a multi-originator transaction structured by IFMR Capital, allowing smaller MFIs too to utilize this asset-backed instrument to raise capital. While the volume of funds generated through securitization will remain a small fraction of the total debt supply to the industry in the near future, there is an increasing acceptance among financial institutions for Pass Through Certificates (PTCs) issued through securitization. In FY 2009, both Leaders and Young Turks used securitization deals to diversify their sources of debt.
THe SeCToR THRoUGH AN INVeSTMeNT LeNS

47
THe SeCToR THRoUGH AN INVeSTMeNT LeNS
As the microfinance industry matures, there will likely be increased acceptance of unsecured debt instruments such as NCDs, Commercial Papers (CPs) and Subordinated Debt. While some of the Leaders have already issued NCDs and CPs, the uptake of these unsecured instruments is limited by the need for MFIs to obtain high credit ratings. In the next few years as the credibility of many smaller institutions grows, these unsecured instruments too are likely to gain popularity, and open up the Indian microfinance market for mutual funds and other institutional investors.
Table 12: Emerging Debt Instruments
Debt Instrument Description
Securitization
Stru• ctured financial instrument asset-backed by part of the MFI’s loan portfolioMFI creates a special purpose vehicle (SPV) and transfers its rated loan portfolio to it• Portfolio is divided into tranches based on rating – senior to junior with different • yields; a cash guarantee is also provided by the MFI
Excellent instrument for Leaders and Young Turks as they tend to have highly rated • portfoliosSmaller MFIs can participate via structured pooled deals•
NCD
Unsecured loan instrument with a fixed maturity of two to three years• Not convertible to equity• Rank above all unsecured creditors and other investors• Provides a lower cost alternative to equity• Provides liquidity to investors as they can be listed•
Commercial Paper
Unsecured money market instrument issued in the form of a promissory note• Mature in as little as 15 days, with a maximum of up to one year• MFIs should obtain credit rating from an RBI recognized credit rating agency• Useful for meeting working capital needs – e.g. payroll Lower cost alternative to bank line • of creditOpens MFI industry to other financial institutions such as Mutual Funds, FIIs•
Table 13: Notable Transactions in Emerging Debt Instruments
MFI Deal Size (INR crore) Deal Size (USD mn) Investor Securitization
SKS 200 43.48 ICICI BankSKS 100 21.74 Yes BankEquitas 16 3.48 IFMR
Non-Convertible DebtSKS 25 5.43 Yes BankSKS 75 16.30 Standard Chartered Bank Spandana 80 17.39 Standard Chartered BankGrameen Koota 20 4.35 MicroVest, an MIV
Commercial PaperSKS 50 10.87 Religare Asset Management CompanySpandana 25 5.43 Rabo Bank

48
5The Global economic Slowdown and Indian Microfinance Clients

49
5.1 The Financial Crisis and Microfinance
The global economic slowdown that peaked in the second half of 2008 directly affected India’s financial sector, including the clients of MFIs, to various degrees. From the point of view of the poor, the effects of the financial crisis are interwoven with those of the food crisis that preceded it: the rise in commodity prices that began in the first quarter of 2008 resulted in higher household expenditure on food, and, in cases where the financial crisis has impacted income generation, the livelihoods of the poor have been even more severely affected. Fortunately, sectors such as agriculture and the food processing industry remained largely unaffected, and in some regions, the demand for jobs in these sectors has increased and added to the income generating avenues for some existing and potential microfinance clients.
5.2 The Impact on Clients of MFIs
5.2.1 Mixed Impact on Income; Job Losses in Urban Export-Oriented Enterprises
For certain segments of the poor population the crisis manifested itself as job losses, and thus a loss of livelihood sources. The worst affected were migrant workers and home-based women workers, who were employed in export-oriented industries such as textiles and garments, gems and jewelry, predominantly in urban centers.
Home-based women workers, estimated to constitute about 50% of the 15 million women workers in the informal economy, lost jobs as export-oriented industries faced greater competition and fewer orders. Many women suffered a reduction in wages because they are usually paid on a piece-rate basis and do not enjoy any known non-wage benefits or job security or bargaining power.69 By some estimates, between 40% and 45% of India’s exports originate in the small-scale unorganized sector,70 rendering the poor, who are at the end of these value chains highly vulnerable to any global fluctuations. An exception seems to be the food processing industry whose products continue to enjoy a steady demand from europe, US, Middle east and Southeast Asia despite the recession.
on a positive note, the resistance of the agriculture sector to the effects of the crisis, due to a sustained demand for food despite the rise in prices, has allowed India’s rural economy to remain upbeat. It is observed that demand in the lower end of the domestic market continued to be strong across food, agriculture and textile sectors, and so people employed in such clusters remained relatively unaffected by the crisis.71 For instance, wage earners from agriculture were not affected as the demand for agricultural produce and hence labor remained strong. The demand for food, especially cereals, is not expected to decline even if marginal incomes are stressed because the poor are expected to switch to basic foods.
As a result of this, the process of reverse migration of low-income workers - from urban back to rural areas - has begun. However, these workers do not always find employment in rural areas and hence go from being income earners and breadwinners to being dependents of their household’s meager disposable income.
69. Source: Jayati Ghosh in UNDP Report ‘Global Financial Crisis: Impact on India’s Poor - Some Initial Perspectives, Global Crisis and the Indian economy, 2009.
70. Source: Bibek Debroy in UNDP Report ‘Global Financial Crisis: Impact on India’s Poor - Some Initial Perspectives’, Impact of the economic Downturn on Non-farm Sector Workers, 2009.
71. Source: Vijay Mahajan in UNDP Report ‘Global Financial Crisis: Impact on India’s Poor - Some Initial Perspectives’, Impact of the economic Downturn on Non-farm Sector Workers, 2009.
THe GLoBAL eCoNoMIC SLoWDoWN AND INDIAN MICRoFINANCe CLIeNTS
More than 7 million women workers informally employed in export-oriented industries lost their jobs

50
5.2.2 Increase in Food and Medicine Bills; Reduced Disposable Incomes
With the economic slowdown affecting incomes and rising food prices sucking more out of their budgets, poor households saw a reduction in their disposable incomes.
It is estimated that food accounts for up to 80% of a poor household’s expenditure.72 Wheat and rice form dominant sources of nutrition in the diet of most Indian consumers and jointly account for about 22% of household expenditure in rural areas and 13% in urban areas.73 Between March 2008 and July 2009, the wholesale price of cereals and pulses showed a rise of 18% and 26% respectively, impacting the food budgets of households. Drugs and medicines form another key item in the poor’s essential consumption basket. Between March 2008 and July 2009, the wholesale prices for this category increased by 21%, placing further burden on poor households.
Intellecap conducted a discussion with 15 woman clients across two branches of Aajeevika, an urban MFI in Delhi,74 to understand how the rise of commodity prices in the market had affected their livelihoods. Clients reported that the food price crisis had changed their purchasing habits on vegetables and other food items, as they could only afford to buy half as much as they used to. Some had switched to buying goods from sellers on the road-side instead of from regular shops, thus compromising on quality in favor of lower cost. Similar restraints on consumption also extended into their expenditure during festivals, with people feeling like they did not have enough money to enjoy the occasion with their families in the same way they used to. The same trend was seen in terms of spending money on visits to hometowns and villages during festivities.
In addition to the self-imposed reduction in consumption, the daily surplus that used to be kept aside in order to meet unforeseen expenditures in the event of diseases or other calamities was also reported to have diminished after the crisis. In households where the income earned by one member used to be enough to sustain the entire family, now more family members are engaged in daily work. In some cases this has also resulted in children being moved from private schools to government schools and college students are interrupting their studies to find work and contribute to the family income. Families used to borrowing money from money lenders are also faced with drastic hikes in interest rates. Aajeevika clients mention monthly interest rates rising from 3-5% to 5-10%.
5.2.3 Difficult and Costlier Access to Microfinance Loans
The stretched cash flows of client households and the direct impact of the crisis on the MFIs’ finances hold multiple implications for client-MFI transactions some of which are:
Difficulty in Accessing Loans
Because MFIs, especially the small and medium-sized ones, are struggling to access debt and equity funding, many of them have been forced to downsize their expansion plans and growth targets. Some are also unable to keep up with the current demand for loans and have delayed disbursements and reduced the size of follow-on loans, namely, loans of higher amounts taken following the successful closure of a previous loan cycle.
72. Source: India Today, http://indiatoday.intoday.in/site/Story/38457/Prices+vs+inflation.html?page=0.73. Source: Vijay Mahajan in UNDP Report ‘Global Financial Crisis: Impact on India’s Poor - Some Initial Perspectives’, Impact of the economic
Downturn on Non-farm Sector Workers, 2009.74. Source: Interview with MFI Aajeevika’s clients at Holambi and Bawana slum branches on 2 october 2009.
THe GLoBAL eCoNoMIC SLoWDoWN AND INDIAN MICRoFINANCe CLIeNTS
Food accounts for 80% of a
poor household's expenditure and
the prices of cereals and pulses
rose by 18% and 26% respectively over 15 months

51
Loan Repayment
With reductions in disposable income, increase in food and medicine bills, and a greater need for cash to finance consumption or businesses, the amount of cash available to poor households for loan repayments is likely to have been affected. In addition, migration due to job loss could also be a cause for clients to default on their repayments. Surprisingly, there are no reports of significant rise in default rates amongst MFI clients. The data on portfolio at risk (PAR) for MFIs in our sample does not support concerns over declining portfolio quality: in 2009 the average PAR>30 has decreased for MFI of Tiers 1, 2 and 3 over 2008 values.
Savings
In the context of the financial crisis, high food inflation has determined an increase in household expenditure. This, when coupled with a reduction in household income, as may be the case for households affected by job losses or salary reduction, affects the ability of MFI clients to accumulate savings. With the regulatory environment making it de facto unfeasible for Indian NBFC MFIs to accept savings from their clients, the negative effect that would have resulted from saving contraction or withdrawal has not materialized.
THe GLoBAL eCoNoMIC SLoWDoWN AND INDIAN MICRoFINANCe CLIeNTS
There are no reports of significant rise in default rates among MFI clients that can be linked to the crisis

52
6The Road Ahead

53
Chapter 6: The Road Ahead
Looking ahead, there are some trends that we expect will shape the industry in the year to come.
6.1 Continued Growth, Emerging Markets
The untapped demand in the huge market for financial services at the base of the pyramid in India will continue to be the major growth driver for MFIs in the year to come. The Leaders and the Young Turks will pursue geographic diversification and continue to find opportunities to sustain their fast growth. Industry expansion in near term is likely to be steady, largely propelled by the sustained growth in credit outreach, and is expected to remain organic.
Strong regional players are likely to show moderate growth. In the coming year the sector in India could see the entry of more foreign players, such as ASA that has entered West Bengal, and some Indian MFIs, such as Basix, are seeking business opportunities abroad. Such cross border interactions could expedite the adaptation of best practices from more mature markets to the Indian context.
Rural and urban markets are both expected to grow in the next year. The higher density of population in cities and peri-urban markets make these high growth regions and an increase in the weight of the urban portfolio on the total is likely. MFIs will also continue to expand in virgin rural markets.
Poor under-served states such as Bihar, Uttar Pradesh and Rajasthan are also expected to witness a flurry of MFI activity in the next few years, given the vast opportunity. These markets are hugely underserved, and are fast being evaluated by MFIs.
6.2 Changing Business Model: Social is Commercial
At a time when the industry is at an inflection point between the pursuit of social goals and commercial objectives, and the adoption of for-profit models for the delivery of microfinance has become the predominant trend, there can be found hints as to what direction the evolution of the business model for microfinance in India will take. While the shift to commercial microfinance is necessary to ensure commercial sustainability of the enterprise, the question arises of whether the business can also retain its social focus, and whether MFI promoters will ever be incentivized to do so.
The business model of leading MFIs, including some of the most explicitly commercially-oriented institutions, is progressively breaking away from the cookie-cutter approach of standard loan products, operational processes and methods of client engagement, and is resolutely becoming more attentive to the needs of the customers. As the market matures, MFIs are in need of building brand equity to attract and retain customers, minimize costs and keep competition at bay. one way of doing this is to place greater focus on branding, and customization of products and services to customer needs. Some MFIs are even looking at attaching membership benefits, for example offering clients subsidised food rations. In serving customer needs better, MFIs are implicitly becoming increasingly social.
THe RoAD AHeAD
Cross border interactions could expedite the adaptation of best practices from more mature markets to the Indian context
54
Housing and education loans, micro insurance and income generation loans with repayment terms and tenure suited to customers’ cash flows are among the emerging product offerings. Some resolutely business-minded MFIs stand out for introducing innovative financial products desired by clients. Players with a more specific livelihood or sector focus, such as dairy farmers or small producers, can be expected to develop financial products specifically for their target clients. Having said this, group based loans are still expected to continue to drive scale in the market at least for the next 2-3 years.
The move away from the plain vanilla model is creating a transformation in the way promoters view the business from client acquisition to servicing. Innovations seen in business processes thus far include door to door collections of repayments, technology-mediated repayment to simplify transactions, outsourcing of back office processes, data management and staff hiring and training. These changes are indicative of the future evolution of the microfinance business model and the changing DNA of MFIs, as it is ever more apparent that client centricity is the key to commercial success.
6.3 Regulation: Potentially Game Changing
Regulation heavily influences the development of the microfinance industry. The competitive landscape is likely to change dramatically in the near future, as are the overall compliance and transparency expectations as a result of recent regulatory changes.
With effect from November 2009, the Reserve Bank of India has authorized new entities to be appointed as Business Correspondents of banks: among the new players are micro/small retail (“kirana”) stores, medical shops, Public Call office (PCo) operators and petrol pumps. Many of these agents have a considerable presence in areas served by MFIs, thus their entry to the market as banking correspondents is likely to heat up the competitive landscape. Going forward competition for MFIs is expected to come from non-traditional actors like rural retail chains, petrol bunks and communications companies who are looking to create additional value propositions for their clients by providing micro-credit and other financial services.
In addition to their growing network of agents through the Business Correspondent arrangement, banks have overcome another key limitation that has in the past prevented them from servicing the lower income segment; interest rate caps. Starting April 1st 2010 the interest rate ceiling that binds banks no longer applies to small ticket size loans. They will be free to set the price loans of a value up to INR 2 Lakh (USD 4,350). This will pave the way for banks to enter the microfinance space in a commercially viable manner.75 This could either lead to additional competition for MFIs, or could be beneficial for clients, if banks work with MFIs to help them transition their mature customers. either way, this change has the potential to drastically alter the microfinance landscape in the next few years.
A new draft of the much awaited Microfinance Bill was introduced in the Indian Parliament at the beginning of 2010 and is likely to be finally passed this year. The Bill would for the first time appoint an official regulator for the microfinance sector in India, NABARD, and has provisions that allow MFIs to accept deposits from clients, and removes the cap on microloan interest rates. Unfortunately, the bill does not apply to NBFC MFIs, thus excluding institutions that contribute about
75. Source: economic Times, http://economictimes.indiatimes.com/news/economy/finance/Loan-pricing-set-to-be-more-transparent articleshow/5558734.cms
THe RoAD AHeAD
The move away from the plain
vanilla model is transforming the
way promoters view the business from
client acquisition to servicing
Going forward competition for MFIs is expected to come from non-traditional
actors like rural retail chains, petrol bunks
and communications companies

55
80% market share. Yet, if passed, the bill could bring significant clarity to operating non-profit MFIs in India.
Finally, given that current regulation has not evolved with the needs of NBFC MFIs, and that the industry is more sensitive to the risks of uncontrolled lending and the lack of transparency in the aftermath of the sub-prime crisis and localized incidents such as in Kolar district, leading NBFC MFIs are pro-actively self-regulating. The self regulatory organization of NBFC MFIs, MFIN, is developing a code of conduct, supporting the set up of a credit bureau to facilitate credit information sharing, and lobbying for other institutionalized regulatory changes for the sector. These include provisions that are already accessible to non-profit MFIs, such as allowing MFIs to mobilize client savings, act as business correspondents, access external commercial borrowings and act as micro-insurance agents. These measures are likely to increase the sector’s credibility, and should help bolster investor and lender confidence. The government initiative to provide biometric national ID cards for all by the end of 2010 will also play a role in facilitating these efforts.
6.4 Technology: In Search of the Next Frontier
The most prominent application of technology in the industry is the management of information systems (MIS) used by MFIs to support their transactional history and data management. MFIs’ approaches to information management differ: some invest heavily in technology solutions, while other players remain fairly low-tech, proving that efficiency is also achievable through a lean business process. Spandana and SKS are a classic example of these two very different approaches to technology; with the former investing less than a third of the latter in technology and incurring less than a fifth of the latter in technology maintenance costs.
MFIs are increasingly finding that investment in technology does not necessarily translate into greater efficiency. The selection of the right solution and the institution’s ability to leverage and integrate it with their business model is essential. There is also a limit to how technology can be infused in the microfinance model as it stands, as human interaction is the lynchpin of MFI credit operations and there can be risks in relying too much on technology. For example, while technology may allow loan officers to serve over 1000 clients, is it in fact desirable for an MFI that they do so? Knowing the client is what allows loan officers to deal efficiently with delinquency issues. If clients were to become just another number to the field staff, these social dynamics central to the model would no longer hold.
In addition, appropriate technology need not always be associated with high investment. A small revolution ignited this year with the launch of MoSTFIT, the first web-based open source MIS for microfinance . MoSTFIT is a good solution for early-stage MFIs looking to manage the complexity and the fast growth rates of the business in a cost effective way. open source solutions have the advantages of lower costs and benefit from the work of a community of developers that ensures constant innovation, no vendor-specific limitations or lock-in, and more importantly, they facilitate the establishment of an open standard in the industry.
With regulation and the changing the market landscape, what is going to be the next frontier in technology? Will the new solutions that are being developed for BCs change the way that MFIs operate in the near future?
76. Mifos, an initiative of the Grameen Foundation, is the first ever open Source MIS specifically for the microfinance industry. It was first released in october 2006.
THe RoAD AHeAD
NBFC MFIs are developing a code of conduct and supporting the set up of a credit bureau to facilitate credit information sharing
There is a limit to the impact of technology as human interaction is the lynchpin of MFI credit operations and relying too much on technology could be risky

56
The current operating models of BCs and MFIs are fundamentally different and are not easily compatible from a technology point of view. While the latter disburse loans and collect repayments from groups of clients, the former service individuals by acting as agents of banks for a range of financial transactions, from savings to remittances. MFIs make heavy use of personnel to service their clients and efficiently disburse loans and collect repayments with minimal technology. BCs on the other hand employ fewer staff, but require fairly sophisticated technology to ensure transactional accuracy in remittances, funds transfer, bill payments, savings, etc.
Mobile communication giants are also looking at entering the space bringing with them their own variety of platforms and solutions. Their expertise, along with developments in information management such as the credit bureau for MFI clients and the establishment of unique IDs (UID) for all citizens, technology could be better leveraged in the near future to store, analyze and share information on financial transactions across MFIs. existing solutions such as proprietary smart cards are not interoperable and biometric solutions have limits on the information storage and access front. The system that is likely to prevail will need to set a common standard; perhaps open solutions may have an important role to play.
6.5 Outlook on Capital to the Sector
The Indian microfinance industry is expected to continue on its growth trajectory in the coming years. Using past performance of the Leaders and discount factors77, Intellecap estimates that the industry will cross 109.5 million borrowers and INR 140,000 crore (USD 30 bn) by 2014, as shown in tables 13 and 14.
Table 13: Industry Growth Projections by Number of Borrowers (in thousands)
2010 2011 2012 2013 2014Leaders 17,995 30,344 45,085 60,937 76,246
Moderates 2,600 4,222 6,758 9,572 12,937
Young Turks 2,155 3,668 5,535 7,572 9,634
Others 5,441 6,676 7,946 9,263 10,764
Total 28,192 44,911 65,324 87,344 109,581
Table 14: Industry Growth Projections by GLP
2010 2011 2012 2013 2014 INR Crore USD bn INR Crore USD bn INR Crore USD bn INR Crore USD bn INR Crore USD bn
Leaders 15226 3.31 30148 6.55 51588 11.21 77762 16.90 106189 23.08
Moderates 1696 0.37 3282 0.71 6096 1.33 9813 2.13 14791 3.22
Young Turks 2073 0.45 4126 0.90 7110 1.55 10800 2.35 14924 3.24
Others 2918 0.63 3789 0.82 4844 1.05 5963 1.30 7360 1.60
Total 21913 4.76 41345 8.99 69639 15.14 104338 22.68 143265 3114
THe RoAD AHeAD
The operating models of BCs and MFIs are
fundamentally different, thus their
technologies are not easily compatible
77. Refer Appendix 5 for details on the methodology used to project industry growth

57
Debt and equity supplied to the sector too will increase to fuel this growth. over the next few years, equity investor interest is expected to sustain and grow, and both public and private sector banks are likely to maintain a steady exposure to microfinance. Intellecap estimates that for the next five years equity will entail 15% of capital needs, while debt will fund the other 85%. Given this, the debt required by the industry in 2014 is INR 33,170 (USD 7.21 bn) and the equity required in 2014 is INR 4,282 (USD 0.93 bn).
6.5.1 Debt
Table 15: Projected Debt Needs
2010 2011 2012 2013 2014
INR Crore USD bn INR Crore USD bn INR Crore USD bn INR Crore USD bn INR Crore USD bn
Leaders 6635 1.44 12683 2.76 18225 3.96 22248 4.84 24163 5.25
Moderates 572 0.12 1364 0.30 2412 0.52 3184 0.69 4262 0.93
Young Turks 909 0.20 1743 0.38 2532 0.55 3129 0.68 3491 0.76
Others 726 0.16 782 0.17 946 0.21 1005 0.22 1253 0.27
Total 8842 1.92 16573 3.60 24115 5.24 29565 6.43 33170 7.21
As MFIs grow, reducing the dependence on term loans and diversifying their sources of funds will be the key to bringing down their cost of debt. The sector is still primarily funded by collateralized debt instruments, and while this is expected to continue, unsecured instruments will slowly account for more of the capital raised, especially by the Leaders. While more sophisticated debt structures are emerging, the key buyers are expected to remain domestic banks in the near term.
Within collateralized instruments, securitization is on the rise, and is likely to replace part of the debt currently funded by term loans. The tenure of term loans offered to MFIs by most banks has come down from two or three years to one year. Thus, credible MFIs are negotiating lines of credit instead, a trend that is expected to grow as the industry matures.
In the next three to five years, corporate bonds in the form of NCDs and CPs, which are non-collateralized debt instruments, will see increased adoption among the MFIs. Understanding of the capital markets is thus increasingly essential for MFIs to be able to harness these instruments and keep their cost of funds low. Across debt instruments, tenures are shorter that what MFIs have been used to. Asset-liability management will thus be ever more important in the years to come, separating the market Leaders from the rest.
6.5.2 Equity
The supply of equity to Indian MFIs too will keep pace with their growth. New funds, especially those based in the US and europe, are entering the market, and supply from investors will sustain as long as growth rates and Roe remain high. In the near future, some of the Leaders are planning IPos to raise public equity.
THe RoAD AHeAD
Non-collateralized instruments such as NCDs and CPs will see increased uptake in the next few years

58
SKS is likely to go public in 2010, and SHARe has announced its intentions of doing the same in the next three years. With an exit visible, investor interest in pre-IPo capital-raising for the Leaders will be very high, as will premiums.
Table 16: Projected Equity Needs
2010 2011 2012 2013 2014
INR Crore USD bn INR Crore USD bn INR Crore USD bn INR Crore USD bn INR Crore USD bn
Leaders 1705 0.37 2161 0.47 2120 0.46 1542 0.34 2540 0.55
Moderates 207 0.05 360 0.08 440 0.10 556 0.12 387 0.08
Young Turks 287 0.06 405 0.09 479 0.10 503 0.11 741 0.16
Others 88 0.02 107 0.02 114 0.02 142 0.03 613 0.13
Total 2287 0.50 3033 0.66 3153 0.69 2743 0.60 4282 0.93
While current valuations are driven by fundamentals, these are likely to fall with any visible fall in portfolio quality, apparent inadequacies in credit processes and if the Leaders are unable to demonstrate in the near term that they are capable of reducing their dependence on one or two states in South India. A fall in industry growth or performance too will bring valuations down from their current levels.
Given the high growth rates that MFIs have been achieving in India, any M&A activity is likely to be driven more by the desire of the MFIs to expand into new geographical regions rather than to increase size. expansion in new geographies typically takes longer than within familiar territory owing to the linguistic and cultural differences across the country. Yet, at this time, the cost of acquisition and integration is relatively high, compared with the investment required for organic growth. Also, structuring the deal to ensure that the acquired MFI promoters’ interests and incentives are maintained is often hard. Thus, limited transactions of this nature are expected in the next year. In the longer term, there may be some consolidation in the industry. Prominent investors are betting on this trend, including Aavishkaar Goodwell, which is in the process of setting up a new USD 120 mn fund, part of which will have a targeted M&A focus. The industry is however likely to witness portfolio acquisitions and even instances of purchase of bad assets, as these provide tax exemption benefits and present arbitrage opportunities.
Aside from IPos, secondary sales will to continue to be the primary exit route for investors in the near term. Strategic sale transactions are uncommon in Indian microfinance, primarily because MFIs are promoter-run, and thus not keen to give away control. In the next few years, if the industry is more consolidated, strategic sales could become more prominent.
THe RoAD AHeAD
Valuations will fall with continued dependence of the Leaders on a few
states in South India
M&A activity is likely to be driven more by
the desire of the MFIs to expand into new geographies rather
than to increase size

59
ABoUT THe AUTHoRS
Devyani Parameshwar
Devyani works with the Business Consulting Group at Intellecap on researching and designing business models that address developmental challenges such as access to finance, water, sanitation and other basic services. She is also keenly interested in social enterprise to enhance the livelihoods of those at the bottom of the pyramid, especially in urban areas. She moved to Intellecap from IMS Health, where she consulted to the pharmaceutical industry in the US.
Devyani studied Physics and International Relations at Wellesley College in Massachusetts. When not at work she enjoys running, reading and exploring new places and cultures.
Neha Aggarwal
Neha is an Associate with the Business Consulting Group at Intellecap. She has worked on various research engagements focusing on India, Asia and Africa which has enriched her experience and understanding of microfinance. She has been working extensively in the areas of primary data collection, financial analysis and reporting.
Neha holds a Post Graduate Diploma in Management from Institute of Rural Management, Anand (IRMA). She’s a movie buff, and her hobbies include reading and listening to music.
Roberto Zanchi
Roberto has over three years of experience in the area of enterprise-based solutions to development problems in India. At Intellecap he has focused on researching across different sectors and on helping organizations to evaluate and make strategic plans for business opportunities in microfinance, agriculture, and water and sanitation. He has also worked as a core member on the editorial team of Intellecap's thematic publication, Microfinance Insights.
Roberto holds an MSc in economics and Management from Bocconi University in Milan and has also studied at the Indian Institute of Management, Ahmedabad. In his free time Roberto enjoys learning new languages, good food, and traveling, and is an amateur photographer.
Sagar Siva Shankar
over the past 4 years, Sagar has navigated the field of business solutions for development in different sectors ranging from livelihoods, to agriculture, microfinance and others. Recognizing that we are still far away from finding definite answers to the challenges faced in these sectors, he focuses on the "journey" rather than the destination. At Intellecap, he focuses his attention on research, enterprise support and business development for the Business Advisory practice.
Sagar holds a MBA in International Business from the Indian Institute of Foreign Trade, and spends time out of work on books, music and his bicycle.

60
APPeNDIX 1: MAIN LeGAL STRUCTUReS IN INDIA
Access Grants Access Equity Access DebtOffer- Loans,
Savings, Insurance
Society Regulated under the
Societies Registration Act 1860, governed by the Registrar of Societies
Yes, foreign grants post FCRA
clearance
No, undefined ownership structure
Yes, eCBs up to INR 23 crore (USD 5 mn) /
year
Direct lending; can act as ‘business
correspondent’ BC to banks. Accepting savings is not recognized by law. Can act as an agent to insurance companies
Trust Regulated under Indian
Trusts Act 1882
Section 25 Co. Regulated under
Companies Act, 1956
Yes, foreign grants post FCRA
clearance
Yes, No minimum entry capital ; FDI
allowed, but cannot pay dividends
Yes, eCBs up to INR 23 crore (USD 5 mn)/
year
Direct lending up to INR 50,000 (USD 1087) for business & INR 125,000 (USD 2717) for housing; can act as BC to Banks.
Accepting savings is not recognized by law. Can act as an agent to insurance companies
Urban Cooperative BankRegistered with the Registrar of Cooperatives and governed by RBI and
Central/State Govt.
Yes
Minimum capital INR 1,00,000 (USD 2174) ownership
limited to the community-members;
No FDI, Dividends allowed
Yes, eCB not allowed
Legitimate lending activity; Can accept
both time and demand deposits from its
member-clients; Can provide insurance as an
agent
Cooperative Society, MACS
Regulated by State Cooperative Acts
and Mutually Aided Cooperative Societies Act
respectively
Yes
No min capital requirement; No
FDI; In cooperative societies, equity
contribution restricted to members and respective state
governments and in MACS members
alone
Can access eCB; max. limit INR 23 crore
(USD 5 million)per year;
minimum CAR not stipulated
Legitimate lending activity; can accept deposits from its
member-clients; can provide insurance as an
agent
Non Banking Finance Company - NBFC
Incorporated under the Companies Act 1956,
Sec 45-I of RBI Act and governed by the Registrar
of Companies, RBI
Yes, but taxable
Minimum entry capital of INR 2 crores;
(USD 0.44 mn) FDI permitted; minimum domestic equity of
INR 2.3 crore (USD 0.5 million)
No eCBs, can access domestic debt, minimum
CAR of 12% from Mar 2010
, 15% from March 2011
Legitimised lending, Can take deposits if >2 years of operations and satisfies multiple legal stipulations , but RBI
has permitted no MFI to do this so far, Cannot be an agent for micro insurance provision
Bank Incorporated under the Companies Act 1956 and governed by the
Registrar of Companies, RBI, SeBI if listed
Yes, but taxable
Min capital of INR 300 crores, (USD 65.2 mn)Single/related entities
ownership limited to 10%; FDI max. 74%
under automatic route
Minimum CAR 9%
Legitimised lending, Can take deposits and should maintain an SLR of 25%, CRR of 5% A Local Area Bank (LAB) is a legal form that is restricted to operate within 3 contiguous
districts with a minimum capital of INR 25 crores (USD 5.4 mn) and CAR
of 12.5% (e.g. KBSLAB of BASIX Group). However, RBI discontinued giving licenses to such LABs
since 2002.

61
APPeNDIX 2: PooReST STATeS: PeNeTRATIoN AND oPeRATING eNVIRoNMeNT
State Penetration by Clients Operating Environment
Bihar 3% Law and order and infrastructure improving•Poor social status for women•Low penetration of SHG movement•Major players: SKS, Cashpor, Bandhan, Nidan•
Jharkhand 4% Improving infrastructure and governance •Rich in minerals and metal ores•Naxal activity in 8 of the 22 districts•Major players: SKS, share, Bandhan, Vedika•
Uttar Pradesh 4% Most populous state with high population density•Deeply divided society on the basis of religion and caste•Some established local players•Startups such as Utkarsh•Strong SSe sector •Less developed cooperative structure•Some parts of the state are lawless•Migrating work force•Major players: SKS, Cashpor, share, Satin, Sonata•
Rajasthan 5% Scattered population•Main location are well connected but small habitats are •poorly connected by road networkHostile climatic condition•Low penetration of SHG movement•Nomadic and migrating labour force constitute most of •the BoPStrong presence of grant based development initiatives •Major players: SKS, Spandana, Pushtikar, basix, Sahayata•
Madhya Pradesh
6% Poor connectivity (road and rail both)•Less developed agriculture and SMe industries•Less developed agriculture•Poor irrigation facility•Presence of economically backward districts with poor •infrastructure and no industry presenceLess local employment •Major players: SKS, share, Spandana, ASA, basix•
Chattisgarh 11% High Naxal activity in the state•Rich in natural resources particularly minerals and coal•Surplus power production•Govt. Schemes for infrastructure development•Growing SMe industry•Major Players: SKS, share, biswa, KAS, basix, eSAF•
orissa 21% Naxal activity in some parts•MFIs operating in orissa are experiencing higher PAR•Natural calamities at regular intervals•Major players: Asmitha, Spandana, SKS, biswa, KAS•

62
LIST OF MICROFINANCE INSTITUTIONS IN THE INVERTING THE PYRAMID 2009 DATA SAMPLE
For-profit MFIs Not-for-profit MFIs
Arohan SKDRDP
Asmitha Cashpor
Bandhan Gram Utthan
BASIX IDF
BISWA Sahara Uttarayan
BSS AWS
BWDA CReSA
equitas Need
eSAF Samhita
GK IIRM
Mimo
Sahayata
Samhita
Sarala
SHARe
SKS
Spandana
Swadhaar
Ujjivan
VFS
Lenders Microfinance Institutions
Hongkong and Shanghai Banking Corporation
Arohan
ABN Amro Capital Trust
ICICI Bank equitas
Investors Se Investments
Aavishkaar Goodwell SKDRDP
Grameen Foundation Suryoday
Legatum Other Stakeholders
Michael and Susan Dell Foundation MIX Market
MicroVest Micro Housing Finance Corporation
D
APPeNDIX 3: SoURCeS oF DATA

63
Financial Ratio Numerator Denominator
PBT Margin Profit before tax Total income
RoA Profit after tax Average assets
Roe Profit after tax Average equity
Interest yield Interest income from loan Average GLP
Total Yield Total income Average GLP
Funding expense ratio Interest expense on borrowings & deposits Average GLP
operating Cost/GLP operating expense Average GLP
Personnel Cost/GLP Personnel expense Average GLP
Non Personnel Cost/GLP Administrative & depreciation cost Average GLP
LLPe/GLP Loan loss provision expense Average GLP
Cost of Borrowing Interest paid on borrowings Average borrowings
Net Interest Margin (Interest income from loan)- (interest
expense on borrowings)
Average GLP
Debt: equity Borrowings Total equity
Average GLP/
active borrower
GLP Active borrowers
APPeNDIX 4: LIST AND DeFINITIoN oF FoRMULAe USeD

64
APPeNDIX 5: CAPITAL PRoJeCTIoNS MeTHoDoLoGY
Market Size Estimation Methodology
The growth in GLP and clients served by Indian MFIs in the next five years has been estimated using the weighted average growth rates of GLP and clients from 2007 to 2009 for a sample of NBFC and NFP MFIs78. To determine the projected growth rates:
1. Leaders: The growth rate for the last two years with 50% weightage for each year, across the different scenarios
2. Moderates: The growth rate of the Leaders for the last two years with a one-year time lag, 50% weightage for each year, across the different scenarios
3. Young Turks: The growth rate of the Leaders for the last two years with 50% weightage for each year, across the different scenarios
4. other MFIs: The growth rate of the last two years, 50% weightage for each year, across the different scenarios
The resulting growth rate determined for each class of MFI for each year was then multiplied with the preceding year’s number of clients and GLP to estimate projected market size. In order to ensure that the estimates are realistic, these were then further discounted most probable scenario 10% in year one, 20% in year two, 30% in year three and 40% for years four and five.
In order to account for new MFIs that could enter the market, the study assumed that 20 new MFIs will enter the market each year. of these, 20% will follow the growth trajectory of Young Turks with a one year time lag, while the remaining will follow the growth trajectory of other MFIs with a one year time lag. Further, the study assumed that all new MFIs will end their first year of operations with 7,500 borrowers and loan portfolio of INR 1 crore each.
The projected growth of new MFIs too will be discounted based on the scenario being projected. The total projections are then a sum of the projected figures for new MFIs and those of existing MFIs.
Capital Projections Methodology
The projected capital needs of the microfinance sector are based on the estimated GLPs, as the market size determines the incremental capital required by the industry every year. The incremental demand for this capital will be met by equity and debt.
The study assumes that equity will form 15% of total capital needs throughout the projection period for NBFC MFIs given the RBI capital adequacy norms. Thus, the equity required in a given year is 15% of the next year’s capital requirements. For the other MFIs, the study assumes that equity will form 10% of total capital needs as they are not regulated by the RBI, and often access grants. The projections include returns generated from the portfolio as equity.
The remaining capital required is assumed as being met by debt. Therefore, the debt requirement for a given year is 85% of the incremental capital required in the next year for NBFC MFIs, and 90% for other MFIs.
78. Data was sourced from audited financial statements, primary interviews and Sa-dhan.

65