
ACID GAS INJECTION: A REVIEW OF EXISTING OPERATIONS - PHASE I
71
ACID GAS INJECTION: A STUDY OF EXISTING OPERATIONS PHASE I: FINAL REPORT Report Number PH4/18 April 2003 This document has been prepared for the Executive Committee of the Programme. It is not a publication of the Operating Agent, International Energy Agency or its Secretariat.
Transcript of ACID GAS INJECTION: A REVIEW OF EXISTING OPERATIONS - PHASE I

ACID GAS INJECTION: A STUDY OF EXISTING OPERATIONS
PHASE I: FINAL REPORT
Report Number PH4/18 April 2003
This document has been prepared for the Executive Committee of the Programme. It is not a publication of the Operating Agent, International Energy Agency or its Secretariat.
ACID GAS IN EXISTING OPERATIONS
PHASE I: FINAL REPORT
Background to the Study
tions in global s, such as fuel
al storage is not a new technology. However, it is acknowledged that all the technical issues related to geological storage have not yet been
nology can be
fields as part of ad, Turkey and a, a CO2-EOR
wan, which will f CO2 from the
to a deep saline aquifer since 1996. To develop an understanding r and Weyburn.
n existing CO2-ues and help to
udied in an effort to obtain Such activities pment of deep projects in the
g naturally existing accumulations of CO2 to determine what
arlier, there are operation since ntribute to our
nown lberta Research
e first phase of that study, which has compiled information on the geological setting of the acid gas injection sites and operating/engineering experiences from these projects. An interim report2 has already been published
tion at the end of 2001. The panded version of that one, covering all of the acid gas operations in both Alberta
and started in 2002. Phase II of the study involves a due diligence exercise on a selected site that will establish that such projects are technically and economically sound and that the carbon balance is positive to allow such projects to be included in carbon trading regimes in the future. The proposed Phase III would involve a monitoring project.
JECTION: A STUDY OF
Geological storage of CO2 is considered to be an option that could achieve deep reducemissions of anthropogenic CO2, if used in conjunction with other mitigation measureswitching, energy efficiency and renewable energy. Geologic
fully resolved. Those issues outstanding will have to be addressed before the techaccepted by the policy makers and the public for wide-scale implementation. Worldwide, there are currently some 74 projects in which CO2 has been injected into oil CO2 enhanced oil recovery (CO2-EOR) operations, mostly in the USA, but also in TrinidCanada. In the USA, some 33 Mt of CO2 is injected annually into oil fields. In Canadproject has been established by EnCana at the Weyburn oil field in southern Saskatcheinject a total of 19 Mt of CO2 over 25 years. In the North Sea, some 1 Mt per year oSleipner gas field has been injected inof the fate of the injected CO2, detailed monitoring projects are underway at both SleipneIn addition, some work is also underway in the USA to study the fate of injected CO2 iEOR operations. Such information will assist in addressing the outstanding technical issdevelop public confidence in the technology. In addition, there are a number of other related activities that have been stinformation that could assist in improving understanding of geological storage of CO2. include the study of deep well injection of industrial wastes in the USA, the develorepositories for nuclear waste disposal and natural gas storage1. In addition, research USA, Europe and Australia are studyininformation can be gained from these occurrences relevant to geological storage of CO2. Whilst smaller in scale than the CO2-EOR and Sleipner injection operations mentioned esome 42 acid gas injection projects operating in western Canada. Many have been in the mid 1990s. These represent another repository of knowledge that could counderstanding of the geological storage of CO2. The IEA Greenhouse Gas R&D Programme has participated in a project to find out what is kabout the 42 acid gas injection projects in Canada. The study was undertaken by the ACouncil (ARC) and the Alberta Geological Survey (AGS). This report covers th
on this, covering the 31 acid gas injection projects in Alberta in operacurrent report is an exand British Columbia, including new operations approved
1 This work was undertaken for the CO2 Capture Project by Lawrence Berkeley National Lab. A summary report was published by Benson et al at the GHGT-6 Conference, whilst the full report can be found at www.co2captureproject.com 2 IEA Greenhouse Gas R&D Programme, Report No PH4/15, January 2003.
i
Technical Background
anada, contains carbon dioxide domestic sale, 990’s, sulphur sulphur in the as of the order
t efforts have been made to reduce gas flaring. One alternative to flaring, sulphur recovery, is not considered to be economically viable in
y turned to acid
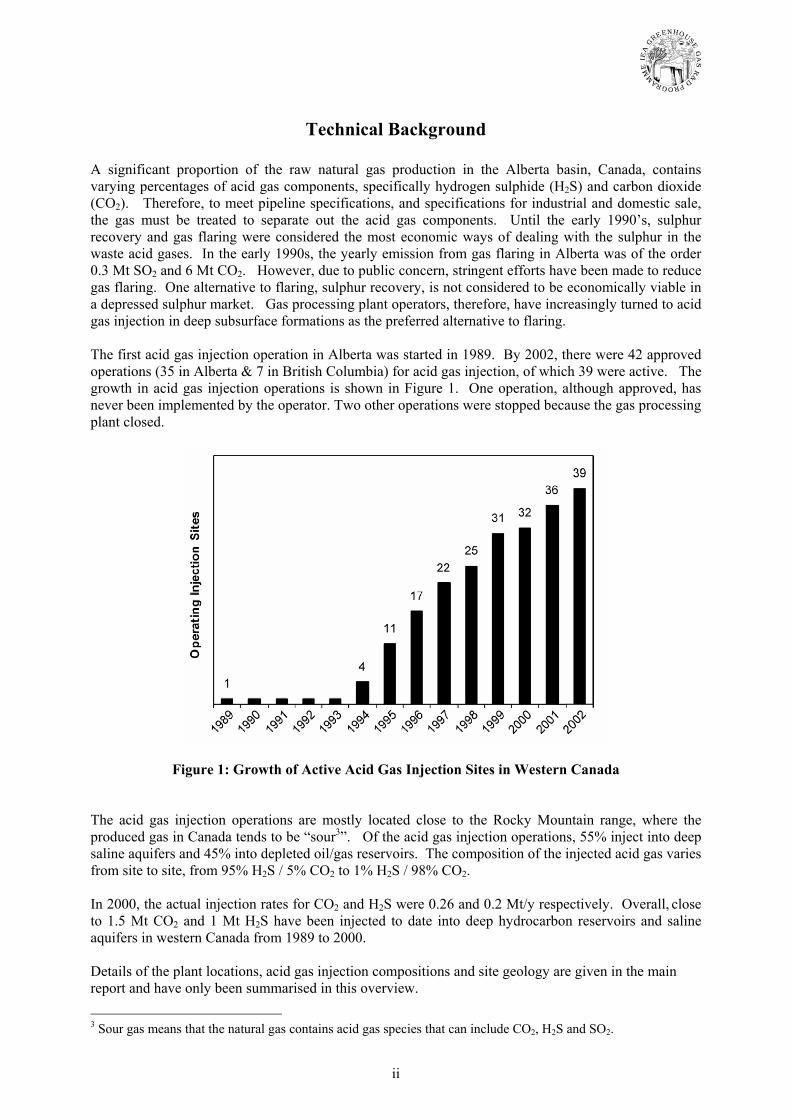
re 42 approved operations (35 in Alberta & 7 in British Columbia) for acid gas injection, of which 39 were active. The growth in acid gas injection operations is shown in Figure 1. One operation, although approved, has never been implemented by the operator. Two other operations were stopped because the gas processing plant closed.
A significant proportion of the raw natural gas production in the Alberta basin, Cvarying percentages of acid gas components, specifically hydrogen sulphide (H2S) and (CO2). Therefore, to meet pipeline specifications, and specifications for industrial andthe gas must be treated to separate out the acid gas components. Until the early 1recovery and gas flaring were considered the most economic ways of dealing with thewaste acid gases. In the early 1990s, the yearly emission from gas flaring in Alberta w0.3 Mt SO2 and 6 Mt CO2. However, due to public concern, stringen
a depressed sulphur market. Gas processing plant operators, therefore, have increasinglgas injection in deep subsurface formations as the preferred alternative to flaring. The first acid gas injection operation in Alberta was started in 1989. By 2002, there we
Figure 1: Growth of Active Acid Gas Injection Sites in Western Canad
a
The acid gas injection operations are mostly located close to the Rocky Mountain range, where the 5% inject into deep
servoirs. The composition of the injected acid gas varies from site to site, from 95% H S / 5% CO to 1% H S / 98% CO .
In 2000, the actual injection rates for CO2 and H2S were 0.26 and 0.2 Mt/y respectively. Overall, close to 1.5 Mt CO2 and 1 Mt H2S have been injected to date into deep hydrocarbon reservoirs and saline aquifers in western Canada from 1989 to 2000. Details of the plant locations, acid gas injection compositions and site geology are given in the main report and have only been summarised in this overview.
produced gas in Canada tends to be “sour3”. Of the acid gas injection operations, 5saline aquifers and 45% into depleted oil/gas re
2 2 2 2
3 Sour gas means that the natural gas contains acid gas species that can include CO2, H2S and SO2.
ii

Results and Discussion
e study are summarised with particular emphasis on what can be learnt from the acid gas injection operations that is transferable to geological storage operations for CO2. The following a
ites, • • Operational safety and reservoir integrity
and the British perations must
ith applications led on those of id gas injection
at the applicants submit detailed information regarding surface facilities, injection well configurations, characteristics of the injection reservoir or
re reviewed by rces, minimize
pproval is granted, a set of licensed operating parameters is established by the regulators. After that, the operators have to submit biannual progress reports to the regulatory agencies on their
ions if they feel e such case is cheduled in the
ory process for f operation of acid gas injection sites. In addition, there is a tried and tested surface
hich has allowed regulators to decide on enforcement of plant closures in the event of concerns regarding the operation of the injection well and its possible impact on the integrity
n those for CO2 tions provide a ere no current
Operational knowledge base After 14 years of operation, a considerable knowledge base has now been built up relating to the operation of these acid gas injection facilities. This knowledge base relates principally to pipeline transportation and operational experiences in surface and injection well operations, since no subsurface
rable to new CO2 geological storage projects.
The results of th
reas are discussed:
• Regulation of acid gas injection sOperational experience,
Regulation of acid gas injection sites in Canada
The regulatory bodies concerned are: the Alberta Energy and Utilities Board (AEUB) Columbia Ministry of Energy and Mines. In Alberta, applications for acid gas injection oconform to a set of specific requirements given in Chapter 4.2 of Guide 65 that deals wfor conventional oil and gas reservoirs4. Requirements in British Columbia are modelAlberta. Prospective operators are required to apply for and obtain approval before acoperations can commence. The regulators require th
aquifer, and injection operations. Before approval of any operation, the applications athe regulatory bodies to ensure that they maximize conservation of hydrocarbon resouenvironmental impact and ensure public safety. When a
operations. The regulatory bodies concerned will exercise powers to close down operatthat safety procedures required by the approval schedule have been breached. Onmentioned in the main report where injection pressures were significantly higher than sapproval. It is clear that, in both Alberta and British Columbia, there is a well-developed regulatthe approval omonitoring procedure w
of the reservoir. Regulations framed for acid gas injection should be more stringent thainjection alone, because H2S is a highly toxic chemical species. However, these regulauseful benchmark for countries that are considering new CO2 storage projects whregulations exist.
monitoring is undertaken. Such operational experience should be directly transfe
4 Alberta Energy Utilities Board, Guide 65: Resources Applications for Conventional & Gas Reservoirs, 2000. This can be found at: http://www.eub.gov.ab/bbs/products/guides/g65.pdf
iii

Operational safety.
perational staff tional safety is
ease of the acid ral steel tubing asing, which is
jection well to ling a “packer” rage formation.
This is pressure tested for integrity once a year. A down-hole safety valve or check valve is id gas from the ith valves.
blished around tors are required to have a
ective ERP, the alarm systems, ns.
s transporting the acid gases are usually short typically 100 to 200m 5 and generally are sion, a common
dration also prevents operational problems associated with hydrate formation that can cause compressor breakdown and
to store CO2 in
ical reservoirs, although the acute toxicity of H2S will warrant increased safety measures. Rese T r hese measures inclu
roval process requires that a detailed assessment of the regional geology and his process is
e geological setting and characteristics, another feature required in the app st formation or reservoir, and the
e potential ndwater and/or
• The setting of licensed operating limits is a key feature in the regulatory process that is designed to protect the integrity of the injection. The licensed operating parameters include the
d maximum injection volumes. The bottom hole injection pressure is set no higher than 90% of the fracture pressure to ensure that fracturing of the cap rock does not occur, but in many cases it is much lower, even at 90% of the original reservoir pressure when injection takes place into a depleted oil or gas reservoir.
Since H2S is a highly toxic species, even small releases can constitute a serious risk to oand the local environment. One of the key design features, therefore, in ensuring operathat of the injection well. This has to be designed and operated to prevent accidental relgas. In acid gas injection operations, the injection well typically consists of a cent“string” (i.e. series of connected tubes) with an outer annulus bounded by a steel ccemented to the subsurface formations. Several safety features are incorporated in the inprevent leakage. The casing is isolated from the tubing string and the acid gas by instalin the annulus between the casing and the tubing string just above the subsurface sto
incorporated in the tubing string so that if something fails at the surface, the flow of acformation will be prevented. The well head of the injection well is similarly protected w As part of the regulatory process, it is required that an Emergency Planning Zone is estathe injection well in the case of an accidental release of acid gas. The operadetailed emergency response plan (ERP) for use in the event of a leak. To have an effarea surrounding the injection site should be equipped with H2S detection and windsocks, self-contained breathing apparatus, and remote unit and plant shutdown statio Pipelineconstructed of mild steel. Pipelines are designed to minimise the risk of leakage. Corrocause of pipeline failure, is avoided by dehydrating 6 the acid gas. Dehy
plugging.
Such operational safety principles and experience are transferable to projects proposinggeolog
rvoir integrity and protection of overlying water resources
he e are a number of measures employed to maintain the integrity of the reservoir. Tde:
• The apphydrogeology, is undertaken to select the location of the injection well. Tdesigned to evaluate the potential for leakage before approval is granted.
• Knowledge of throval process, is critical to assess the integrity of the ho
short-and long-term fate of the injected acid gas. Of particular importance armigration pathways from the injection zone to other formations, shallow grouthe surface.
setting of the following:o Maximum well head and bottom hole injection pressures o Maximum daily injection rates an
5 There are cases of pipelines up to 5500m. 6 Moisture contents of less than 0.5 mole % are maintained by removing the water condensed after each compression stage rather than using a separate dehydration stage.
iv

Typically, the fracture pressures are defined from pressure depth-correlation data for the Alberta basin if site-specific tests have not been carried out.
neral resources,
he type of fluid III wells under
is noted that the oil recovery in at less stringent
or Class Ia wells that are designated for the injection of oil field and industrial waste fluids9. aring zones are
ell. However, odies to study
trast can be drawn with natural gas regulations in Europe which s located above gas spread is to
ggested that an Underground
A, Class I wells equire a permit. , appears to be
Canada. One area where the regulations differ, however, is that migration and
ction. There are regulatory and nd insight into
integrity of the th the cap rock
les) and second with the cements in the injection wells (both in existing and old abandoned wells that are puncturing, or penetrating the reservoir). Of these possible failure modes, there is considerable concern with regard to the impact that CO2 alone could have on cements in abandoned well bores. Since many oil and gas fields in Canada are penetrated by significant numbers of existing and abandoned wells, the potential risk of a failure could be high, which could be enhanced
ck and injection well sing the long-term
gas.
A key feature of the regulations is protection of groundwater and other energy and miand of equity and mineral rights. The classification of the injection wells is based on tthey will hold. Injection wells on acid gas projects are typically considered as Class AEUB guidelines7, which covers wells injecting hydrocarbon, inert and sour gases8. It same well classification for acid gas injection applies to CO2 injected for enhanced Canada. Testing and cementing requirements for Class Ib, II and III wells are somewhthan fHowever Class Ib, II and III wells have to be designed to ensure that useable water beisolated. Possible migration pathways are also an issue in the choice of location of the injection wit is noted that no subsequent subsurface monitoring is required by the regulatory bwhether migration is occurring. A concall for the monitoring of vertical leakage by gas migration (if any) towards the aquiferthe reservoir to ensure that leakage remains minimal and acceptable. Also, any lateral be monitored using a set of monitoring wells10. Also noteworthy, is a study undertaken by Battelle for the USDOE11 in which it was suinjection well for CO2 into an aquifer would be Class I under the provisions of theInjection Control (UIC) programme of the Federal Safe Drinking Water Act. In the USare wells that inject hazardous or non-hazardous wastes into geological formations and rMuch of the information required in the permit applications for Class I wells in the USAsimilar to those for acid gas injection in in the USA detailed groundwater modelling studies are required to study plume monitoring will be required of surface water and overlying aquifer used for water abstraa number of operational acid gas injection operations in the USA - comparison of the USmonitoring requirements with those in Canada might provide additional information apractices that might be adopted for CO2 storage. Another issue could be the reactions of the acid gas and its consequent impact on the reservoir. There are two possible modes of reaction that could occur, first reaction wi(which in most cases are sha
by the presence of H2S. The degree of reaction of the acid gas with the cap rocements needs to be fully understood, otherwise there is a risk of compromicontainment of the injected
7 Alberta Energy Utilities Board, Guide 51, Injection and Disposal Wells – well classifications, completion, logging and testing, March 1994. 8 It is noted in several operations the acid gas is dissolved in the produced water and hence, when injected, the well classification becomes IB or II 9 Fluids to be injected in Class 1a wells include: phenolic waste waters, acid or caustic solutions, aqueous solutions of halogenated organic compounds, solutions containing heavy metals. 10 IEA Greenhouse Gas R&D Programme File Note on Geological Storage of CO2 - Conflicts with and experience to be gained from natural gas storage, 4th January 2001. 11 Project No. DE-RAC26-98FT40418, Carbon Dioxide Sequestration in Saline Formations – Engineering and Economic Assessment – Final Technical Report, July 9, 2001
v

vi
Expert Group Comments
The draft of this report was not sent out to expert review because the previous interim report had been reviewed in this way and the experts’ comments have been included in the final report.
reservoirs and ompared to the less there is a
that can be drawn upon for reference in connection with wide scale gulation of acid
wells that are
ation that will n, if it can be
reservoirs, that cement integrity in the injection wells has not been compromised and there are no associated environmental problems, then this should build confidence that CO2 alone will be stored effectively as well. However, at present o demonstrate credible evidence for acid gas containment within a geological reservoir without a detailed monitoring programme being undertaken at an acid gas injection site.
tion facility (or he development
of the knowledge of injection of CO2 and other gaseous species. Such a project should consider both surface and sub–surface monitoring to provide confidence on containment of the injected gas in the reservoir, in particular examining the possibility of any surface migration. The monitoring programme should look at the interaction of the injected acid gases with the reservoir rocks, since the extent to which the injected H2S might be trapped by mineral fixation is an important question to be resolved. Also, the impact on reservoir integrity, in terms of reaction with the cap rock and with the cement of the well bore, need to be studied.
Major Conclusions
To date, close to 1.5 Mt CO2 and 1 Mt H2S have been injected into deep hydrocarbonsaline aquifers in western Canada. Whilst the quantities of gas injected are modest camount of CO2 injected in CO2-EOR operations in the USA and Canada, nevertheconsiderable body of knowledgeimplementation of CO2 storage in the future. Information and experience exists on the regas injection sites and the design and operation of compressors, pipelines and injection relevant to larger CO2 storage operations. Any operation where gases are injected into geological reservoirs will provide informhelp develop confidence in geological storage of CO2. In the case of acid gas injectiodemonstrated that the injected acid gases have been contained within the geological
it might be difficult t
Recommendations Consideration should be given to developing a monitoring project at a new acid gas injecat several facilities reflecting the range of reservoirs that are being utilized) to assist in t

Characteristics of Acid Gas Injection Operations in Western Canada
Report to
International Energy Agency – Greenhouse Gas R&D Programme
Dr. Stefan Bachu Dr. William D. Gunter Alberta Geological Survey Alberta Research Council Alberta Energy and Utilities Board
February 2003
Contents Introduction………………………………………………………………………………..4 Acid gas injection operations……………………………………………………...5 Compilation project and report structure………………………………………….8 Historical background……………………………………………………………………10 Site selection and operations……………………………………………………………..13 Acid gas properties…………………………………………………………….…13 Surface operations……………………………………………………………..…19 Subsurface considerations…………………………………………………….….21 Review of operations in Alberta…………………………………………………………22 Subsurface characteristics………………………………………………………..22 Licensed operations……………………………………………………………...24 Surface characteristics……………………………………………………...……24 Issues…………………………………………………………………………………..…25 Conclusions………………………………………………………………………………26 References……………………………………………………………………………..…28 Appendix…………………………………………………………………………………31 Figures Figure 1. Location of the Alberta basin in Canada…………………………………….….4 Figure 2. Histogram of active acid gas injection operations in the Alberta basin……...…6 Figure 3. Location and status of the acid gas injection operations in the Alberta basin, Canada, at the end of 2002…………………………………….……………...…7 . Figure 4. Cumulative amount (all sites) of acid gas approved to be injected, and actually- injected into deep aquifers and reservoirs in the Alberta basin, Canada:
a) injection rate, and b) volume…………………………………………….…14 Figure 5. Cumulative amount (all sites) of approved CO2 and H2S to be injected into deep aquifers and reservoirs in the Alberta basin, Canada: a) injection rate, and
b) mass…………………………………………………………………………15 Figure 6. Cumulative amount (all sites) of CO2 and H2S actually-injected into deep
aquifers and reservoirs in the Alberta basin, Canada, to the end of 2000: a) injection rate, and b) mass…………………………………..………………16
Figure 7. Solubility of water in acid gas as a function of pressure for: a) different acid gas
composition (CO2 and H2S) at 30oC, and b) different temperatures for an acid gas with a composition of 49% CO2, 49% H2S and 2% CH4 (see also Lock, 1997; Wichert & Royan, 1996, 1997)……………………….…………………17
2
Figure 8. Phase diagrams for methane (CH4), carbon dioxide (CO2), hydrogen sulphide (H2S) and a 50%-50% acid gas mixture; hydrate conditions for CO2 and H2S; and a 4-stage acid-gas compression cycle (after Wichert & Royan, 1996, 1997)…………………………………………………………..………….……18
Figure 9. Size of approved acid gas operations in western Canada: a) injection rate, and b) injection volume…………………………………………...…………..……27 Tables Table 1. Summary of captured and missing subsurface information for the acid gas injection operations in western Canada…………………………………………9 Abbreviations AEUB Alberta Energy and Utilities Board, the regulatory agency in Alberta, Canada AGS Alberta Geological Survey, a Group within AEUB ARC Alberta Research Council, a research organization in Alberta, Canada B.C. British Columbia, a province in Canada EPR Emergency response plan EPZ Emergency protection zone
3

INTRODUCTION Over the past decade, oil and gas producers in the Alberta basin in western Canada (Alberta and British Columbia) (Figure 1) have been faced with a growing challenge to reduce atmospheric emissions of hydrogen sulphide (H2S), which is produced from “sour” hydrocarbon pools. Sour oil and gas are hydrocarbons that contain H2S and CO2, which have to be removed before the produced oil or gas is sent to markets. Since surface desulphurization through the Claus process is costly and the surface storage of the produced sulphur constitutes a liability, increasingly more operators are turning to acid gas disposal by injection into deep geological formations. Acid gas is a mixture of hydrogen sulphide and carbon dioxide (H2S and CO2), with minor traces of hydrocarbons, that is the byproduct of “sweetening” sour hydrocarbons. In addition to providing a cost-effective alternative to sulphur recovery, the deep injection of acid gas reduces emissions of noxious substances into the atmosphere and alleviates the public concern resulting from sour gas production and flaring.
4

Although the purpose of the acid gas injection operations is to dispose of H2S, significant quantities of CO2 are being injected at the same time because it is uneconomic to separate the two gases. Actually, more CO2 than H2S has been injected to date into deep geological formations in western Canada. In the context of current efforts to reduce anthropogenic emissions of CO2, the acid gas injection operations in western Canada represent a commercial-scale analogue to geological storage of CO2. The latter is an immediately-available and technologically-feasible means of reducing CO2 emissions into the atmosphere that is particularly suited for land-locked regions located on sedimentary basins, such as the North American mid-continent. Large-scale injection of CO2 into depleted oil and gas reservoirs and into deep saline aquifers is one of the most promising methods of geological storage of CO2, and in this respect it is no different from acid gas injection operations. However, before implementation of greenhouse gas geological storage, a series of questions need addressing, the most important ones relating to the short- and long-term fate of the injected CO2. Thus, the study of the acid gas injection operations in western Canada provides the opportunity to learn about the safety of these operations and about the fate of the injected gases, and represents a unique opportunity to investigate the feasibility of CO2 geological storage. In the 13 years since the first operation in the world started injecting acid gas into a depleted reservoir on the outskirts of the city of Edmonton in Alberta, no safety incidents have been reported except for a well blow-out in northern Alberta where the operator has significantly exceeded the permitted injection pressure. Given the H2S nature, which is more toxic and corrosive than CO2, the success of these acid gas injection operations indicate that the engineering technology for CO2 geological storage is in a mature stage and ready for large-scale deployment. The major issues that need addressing in the near future are the long-term containment of the injected gases in the subsurface, and the safety of large-scale operations. This review of acid gas injection operations in western Canada may help in addressing these issues. Acid Gas Injection Operations in Western Canada In Alberta, the Oil and Gas Conservation Act requires that operators apply for and obtain approval from the Alberta Energy and Utilities Board (AEUB), a provincial regulatory agency, to dispose of acid gas. Similarly, in British Columbia (B.C.) operators have to apply to the B.C. Ministry of Energy and Mines for approval. Before approving any operation, the regulatory agencies review the application to maximize conservation of hydrocarbon resources, minimize environmental impact and ensure public safety. To adequately address these matters, the regulators require that the applicants submit information regarding surface facilities, injection well configurations, characteristics of the injection reservoir or aquifer, and operations. After approval for acid gas injection is granted, the operators have to submit to the regulatory agencies biannual progress reports on the operations. No application has been rejected to date; however, in some cases the operator had to provide additional information and/or had to make changes to satisfy requirements and requests from the regulatory agencies. In some cases the regulatory agencies, in granting approval, imposed operating conditions to ensure safety.
5

The first acid gas injection operation in Alberta was started in 1989, and the next one in 1994. To date, forty-seven applications for injection of acid gas produced at 42 different gas plants have been approved in western Canada (35 in Alberta and 7 in British Columbia). The seeming contradiction between the number of applications and number of injection operations stems from the fact that in several places injection took or takes place in different units, or the quality of the injected stream is different, in which case an application has to be submitted and approved for each case. For clarification, in the following the different acid gas sources at different gas plants and land locations are designated as acid gas operations, and the injection cases themselves are referred to as injection sites. The Appendix presents the captured information by injection site, and not by operation. Of the 42 approved operations, 39 were active as of December 2002. One operation, in the Pembina field west of Edmonton in Alberta, although approved, was never implemented by the operator. Two other operations, also in Alberta, have been rescinded after an active period, either because the injection volumes reached the approved limit, and the operator moved to another site or injection formation, or because the gas plant producing the acid gas has been decommissioned, with the sour gas being processed at another, nearby plant. At the Zama operation with multiple sites in northern Alberta, injection into two reefal carbonate reservoirs has been shut down in 1998 and 2000 by the regulatory agency because the operator greatly exceeded the approved injection volume or pressure. Figures 2 and 3 present, respectively, the histogram and location of acid gas injection operations in western Canada at the end of 2002.
6

� ��� ���������
N
����������
�
���
� ���
��
� �
�
�����
�����
������
� �
�
���
�� �
��
��
� �
�
��������
�������
�� !��"
"�����"
��
���
����������
����
# $�% %����&���������������
������������
������������� ����������������
�����
�������
�����
'���
!(����
���)�������
*��+(��
�(��)�����������(��,����(�
�(��)��-���-����+������)�(��
./�%
0�
0�
0�
0�
0.
00
01
02
03
0/
����&
��. ���
��1
��3���
�����.
��1�&
�(��)��-���-����+����)-���4�+������������������
�(����,,���5�+���������,����(���
����������� ����� ����� ����������� ����� ���������������� ������������������� �� ������ � � �� �����������������
1�
1�
1�%
����&
��. ���
��1
��3���
�����.
��1�&
03
0/
1�
1�
1�%
0.
00
01
02
./�%
0�
0�
0�
0�
7

Compilation Project and Report Structure In January 2002, the Alberta Geological Survey (AGS), a group in the Alberta Energy and Utilities Board, and the Alberta Research Council (ARC), jointly undertook a project funded by Canadian federal and provincial governments and agencies, and by the International Energy Agency (IEA) Greenhouse R&D Programme, to review the information submitted to the AEUB by operators in the process of obtaining approval for and running the acid gas injection operations active in Alberta prior to December 2001. The original deadline of the project was September 2002. In June 2002, the first industry participant joined the project, at which time the funding sponsors agreed to expand the scope of the project to include the 7 acid gas injection operations active in British Columbia and 4 additional acid gas operations approved in Alberta since December 2001. Concomitantly, the project deadline was extended to March 31, 2003. The Alberta Geological Survey compiled the subsurface characteristics and the Alberta Research Council compiled the surface facilities of the acid gas operations. Historical files with the respective regulatory agencies in Alberta and British Columbia were searched for applications for acid gas injection operations, for approvals and amendments, and for the subsequent progress reports submitted by operators. Relevant information from these hard copy documents was entered into a database specially designed and implemented at AGS for internal use and report generation. Several synthesis tables were generated that compile and present information from the acid gas injection sites. A series of self-explanatory graphs were produced on the basis of the synthesis tables, which are grouped into 3 categories: host rock, host fluids and injection operations. These reports and associated graphs are included in the Appendix. Because the suitability for and approval of acid gas injection operations are determined by the characteristics and containment properties of the injection aquifer or reservoir, which then affect operation and engineering characteristics, the review is summarized in Tables 1 to 6 in the Appendix in the following order. Table 1 shows the geology of the injection unit and of the underlying and overlying formations. Table 2 summarizes the characteristics of aquifer and reservoir rocks and fluids. Table 3 summarizes licensed operating parameters, such as injection pressure, rate and volumes, and the radius of the emergency protection zone (EPZ). The latter is established for the case of an atmospheric release of acid gas, either as a result of an escape to the surface from the injection zone, or as a result of failure in surface facilities. In Table 3, the licensed injection rate and volume for sites 4336 and 4343 of the same operation is the same, as explained in the footnote, although injection takes place through two different wells approximately 4.5 km apart, one for acid gas mixed with water and the other one for dry gas. Tables 4, 5 and 6 summarize engineering characteristics of the acid gas injection operations, such as: injection wells, pipelines, and gas plant compressors, respectively. Tables 1-3 have only 47 lines each, corresponding to the 47 injection sites, while Tables 4-6 have more lines because there are injection operations with multiple wells and pipelines and/or compressors. Common to each table is a site number or plant (operation) number. The two designations were necessary because one plant compressor train could serve several injection sites, and at each injection site there could be several injection wells. The plant
8

designation number ends in “00”. The non-zero integers making up the plant number are the group indicator for the sites belonging to that particular plant. For example, plant number 1500 refers to site numbers 1510, 1522, and 1563 in the tables. Lack of data or information in the original applications is denoted in the Appendix tables by a blank (i.e., no data were submitted), and the absence of the data should definitely not be construed as a compilation omission. If a data category does not apply to a certain case, such as water salinity for an oil reservoir, or oil gravity for an aquifer, then NA (not applicable) is used. With regard to the reviewed documentation, this report contains all the information currently existing with the regulatory agencies in Alberta and British Columbia. Documentation is missing (does not exist) for two sites (sites 2469 and 3465 in the Appendix) because these initially did not require an acid-gas application since they were originally water disposal operations that changed later on to “sour-water”. Table 1. Summary of captured and missing subsurface information for the acid gas injection operations in western Canada. Information Type # Sites with # Sites w/o NA % Missing InformationDepth 46 2 5 Thickness 44 4 8 Lithology 47 1 2 Porosity 42 6 13 Permeability (DST) 4 44 92 Flow capacity 27 21 44 keff gas 7 41 85 Permeability (est) 15 33 69 Fracture gradient 41 7 15 Net pay 43 5 10 Caprock formation 44 4 8 Caprock thickness 41 7 15 Caprock lithology 43 5 10 Underlying formation 38 10 21 Thickness of und. Form. 29 19 40 Lithology of und. Form. 38 10 21 Temperature 41 7 15 Pressure 46 2 4 Volume 34 14 29 Salinity 24 24 50 Oil gravity 8 3 37 6 Gas weight 17 31 Initial pressure 38 10 21 Startup pressure 21 5 22 10 Table 1 above presents a summary of the captured information for the 47 acid gas injection operations in western Canada. It must be emphasized here that the information
9
presented herein is “as submitted” by the operators, with no additional checking and interpretation by AGS and/or by staff in the regulatory agencies, except for evidently and blatantly wrong data. The data were adequately checked for data-entry accuracy, but were not checked for validity. Any data inconsistencies reflect the data and information as submitted by operators. Missing data for some sites are due to the lack of submissions by operators, or to unavailability within the regulatory agency. In cases that data and information were not submitted, no additional search was performed to fill in from other sources. Currently, on aggregate, approximately 25% of the required information is missing (Table 1). No analysis of the compiled information is included in the current report, whose objective, as stated, was only to compile the information currently existing with regulatory agencies. The verification of the submitted information, the collection of additional data and the analysis of the information form the objective of another project phase. HISTORICAL BACKGROUND A significant portion of raw natural gas production in the Alberta basin, Canada, contains varying percentages of acid gas components, specifically hydrogen sulphide (H2S) and carbon dioxide (CO2). To meet pipeline and sales gas specifications, this raw sour natural gas must pass through gas processing facilities to separate out the acid gas components. Furthermore, a number of sour oil pools produce solution gas that contains significant amounts of H2S and CO2 (e.g., 4% and 17% respectively at Wayne–Rosedale; Ho et al., 1996). Prior to 1988, if sulphur-recovery technology could not economically remove the sulphur from the acid gas, the alternative was to burn the acid gas in flare stacks or incinerators. Each flaring source was permitted to emit up to 10 t/d of sulphur. To reduce the waste and pollution resulting from sour-gas flaring, regulatory agencies in Alberta and British Columbia require since 1989 that gas plants with a sulphur throughput of more than 1 t/d recover the sulphur from the gas stream (Longworth et al., 1996). The amount of recovered sulphur increases from 70% for plants producing 1 to 5 t/d, to 96% for plants producing more than 10 t/d. Nevertheless, even with sulphur recovery in place, significant volumes of tail, or acid gas, are generated, and this is often flared from stacks at the well sites. In the early 1990s, the yearly average emission from gas flaring in the Alberta basin was in the order of 0.3 Mt SO2 and 6 Mt CO2 (Longworth et al., 1996). Until the late 1980s and early 1990s, sulphur recovery and acid gas flaring were considered the most economic ways of dealing with the sulphur in sour and acid gases. As a result of public concern about flaring, including environment degradation, human and animal health, and waste, the regulatory agencies increasingly require that operators reduce emissions, particularly in regions where the public concern is high. Because the sulphur world supply is dominated by recovered sulphur and environmental pressure has driven desulphurization to the point that the supply has exceeded demand, large tonnages of sulphur are being poured into block storage throughout the world (Connock, 2001), including the Alberta basin. Since desulphurization is uneconomic in a weak sulphur market, and flaring is publicly unacceptable, operators in the Alberta basin are increasingly turning to acid gas disposal through injection into deep subsurface formations, mostly in saline aquifers, but also in depleted oil and gas reservoirs. The on-
10

site geological disposal is particularly attractive if, otherwise, operators have to build their own sulphur recovery plant or a pipeline to the nearest plant with available capacity, each alternative having its own difficulties or undesirable effects, such as cost, economic risk, pipeline right of way, and plant proliferation (Keushnig, 1995). The acid gas injection sites in the Alberta basin are by and large located mostly in the region close to the Rocky Mountain thrust and fold belt that corresponds to sour gas production from deep reservoirs (Figure 3). Two sites in B.C. are actually located within the thrust and fold belt. At 26 sites approval was given to inject the acid gas into deep saline aquifers in regional-scale flow systems confined by regional-scale aquitards. At 17 sites injection took or takes place in depleted oil and/or gas reservoirs, and at 4 sites the acid gas is injected into the underlying water leg of depleted oil and gas reservoirs (sites designated as “reservoir” in the Appendix, but with “water” as the reservoir fluid). The acid gas could increase oil or gas recovery if it is injected to maintain reservoir pressure (Longworth et al., 1996; Connock, 2001). Because site selection and approval must meet a set of stringent requirements imposed by regulatory agencies to address H2S emissions (Keushnig, 1995; Longworth et al., 1996), the sites meet also the criteria for and are located in areas suitable for CO2 storage in geological media in the Alberta basin (Bachu, 2000; Bachu & Stewart, 2002). In 1989, Chevron Canada Ltd. started the first acid-gas injection operation at Acheson (site 3340 in the Appendix), on the outskirts of Edmonton in Alberta, designed to handle a mixture of 15% H2S and 85% CO2 by injecting it at a depth of 1100 m into a depleted sandstone oil reservoir (Lock, 1997). The operation experienced elemental sulphur deposition, which plugged the injection well (Longworth et al., 1996). The next operation, by a different company, started in 1994 by injecting 20% H2S and 80% CO2 into a water-saturated carbonate reef in central Alberta. Also in 1994, Chevron Canada Ltd. started acid gas injection at 30 MPa pressure into a carbonate aquifer 2800 m deep at Pembina, west of Edmonton. The approved acid gas composition is 74% H2S, 21% CO2, 1% hydrocarbon gases and 4% water (Lock, 1997). In 1995, PanCanadian Petroleum Ltd. started mixing, at surface, acid gas with produced water at elevated pressure, and injected the solution (“sour water”) into a water-saturated sandstone zone underlying an oil pool at Hansman Lake (site 3581 in the Appendix), and into a deep, dolomitized carbonate-shelf aquifer at Thompson Lake in eastern Alberta (Kopperson et al., 1998a,b). Both injection zones are overlain by shales. The sandstone aquifer has high porosity (30% on average) and permeability (up to several darcies, or 10-12 m2), while the carbonate zone has 22% porosity. Also in 1995, PanCanadian started an acid-gas injection operation at Wayne-Rosedale, northeast of Calgary in Alberta (site 3195 in the Appendix). The acid gas mixture (20% H2S and 80% CO2), with an estimated daily production rate of 21,000 m3/d, was the result of sweetening a 34oAPI oil with an associated solution gas containing 4% H2S and 17% CO2 (Ho et al., 1996). Injection takes place in a 26 m water-saturated carbonate-reef unit, characterized by 6% porosity, 150 x 10-15 m2 (150 md) permeability, 65oC temperature and 15.5 MPa formation pressure, confined by tight dolomite units. At in-situ conditions, the acid gas density is ~543 kg/m3 (Ho et al., 1996).
11

In 1995, Pennzoil Canada Inc. started injecting a mix of 20% H2S and 80% CO2 at 120,000 m3/d into a depleted oil reservoir in a pinnacle carbonate reef ~1510 m deep at Zama X2X in northern Alberta (site 1563 in the Appendix). Because the acid gas was miscible with oil in that reservoir, at one point during the operation it was used in conjunction with a miscible-flood scheme to enhance the oil recovery (Davison et al., 1999). The ~115 m dolomitized reef, with an average porosity of 7.6%, is underlain by ~45 m of tight lime mudstone and is overlain by 60 to 90 m of anhydrite. The critical point of the acid gas mixture is 42oC and 7.64 MPa. At target operating conditions of 14.5 MPa and 76oC (initial reservoir pressure and temperature), the injected acid gas is supercritical, with a density of ~500 kg/m3 and a viscosity of 0.04 cp (Davison et al., 1999). The caprock threshold displacement pressure was measured in the laboratory to be 22.3 MPa. Considering that the initial differential pressure across the caprock was ~7 MPa, the maximum operating pressure was established at 30 MPa. Because the formation water naturally contains significant amounts of both CO2 and H2S, acid gas injection was not expected to cause dissolution of reservoir rock and/or precipitation. This site was subsequently shut down by AEUB because the operator greatly exceeded the injection pressure limit. To date, the largest operation in the Alberta basin in British Columbia (sites 4336 and 4342 in the Appendix) is also the largest in the world, with a licensed capacity of 391,000 m3/d, but operating only at 280,000 m3/d. Acid gas is injected into the same formation through two wells some 4.5 km apart, because dry gas is injected through one (site 4336) and acid gas mixed with water is injected through the other (site 4343). The acid gas stream contains 85% H2S and 15% CO2 (340 and 78 t/d H2S and CO2, respectively), and the approved injection rate and volume are for both wells. The acid gas is or was mixed with water at surface, prior to injection, at the following sites: 718, 997, 2469, 2573 (up to 1999), 3465 and 3581. Sites 2469 and 3465 are actually water disposal sites with a minor amount of dissolved acid gas (“sour water” disposal) and injection at these sites is done “randomly” through 49 and 19 wells, respectively. Because these are water disposal schemes approved previously as such, the operators did not have to submit a special application to the regulatory agency to inject sour water. Operations at two sites, 997 and 3581, were rescinded in 1997 and 1998, respectively, either because the injection volumes reached the approved limit, and the operator moved to another site or injection formation, or because the gas plant producing the acid gas has been decommisioned. Injection at site 312 was rescinded in 1999 because it reached the approved limit, and it was immediately replaced by injection into an underlying formation (site 320 in the Appendix) Injection at sites 1510 and 1563 at Zama into depleted reservoirs (Figure 3) were shut down by the regulatory agency in May 1998 and December 2000, respectively, because the operator greatly exceeded the approved injection volume or pressure. Injection for that acid gas operation continues into an aquifer (site 1522). One operation in the Pembina field (Figure 3; site 844 in the Appendix), although approved, was never implemented.
12

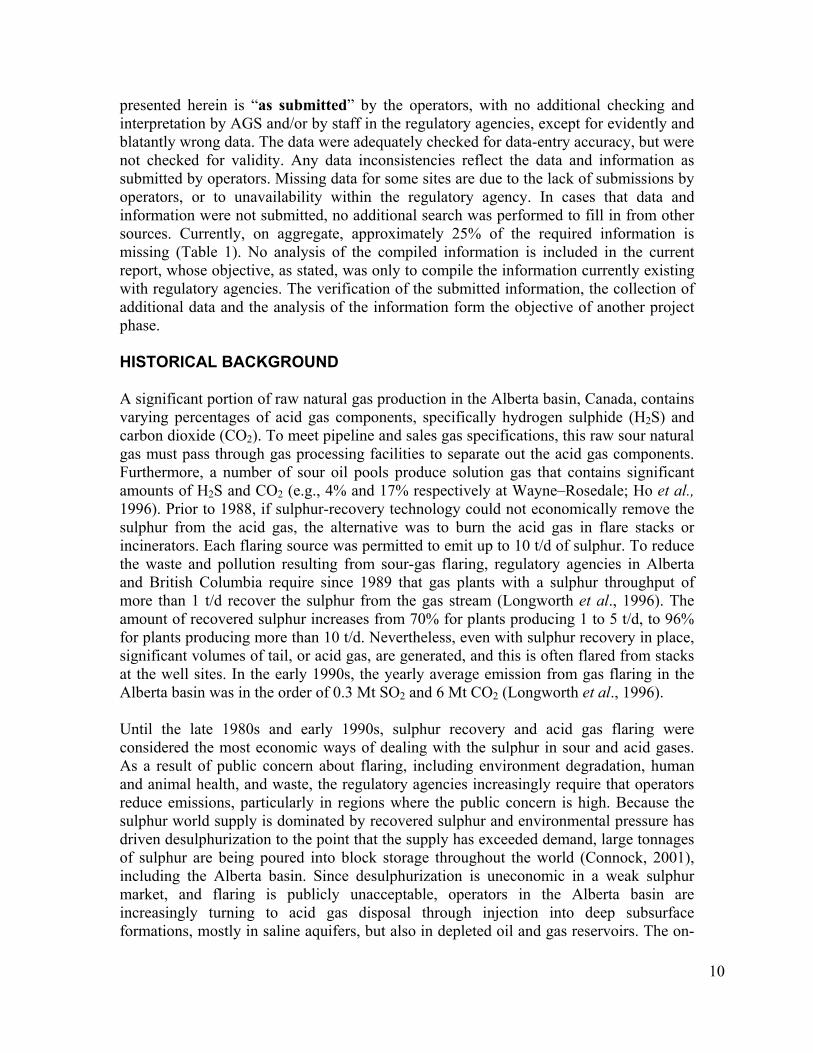
Currently, acid gas injection in the Alberta basin occurs over a wide range of aquifer and reservoir characteristics, acid-gas composition, and operating conditions. The composition of the injected acid gas varies from site to site, from 85% H2S and 15% CO2 to 2% H2S and 98% CO2. Figure 4 presents the variation since 1989 of the approved and actual injection rates and volumes, cumulative for all active acid gas injection operations in western Canada. Figure 5 shows the corresponding approved injection rates and volumes of H2S and CO2, also cumulative for all sites. The drop in the cumulative approved injection rate and the leveling-off in approved injection volumes in 1999-2000 (Figures 4 and 5) corresponds to the shut down of the two injection sites, 1510 and 1563, for injecting beyond the licensed limits. The actual injection rates and volumes are significantly below the approved limits (Figure 4). In 2000, the last year with complete records, the actual cumulative injection rates for CO2 and H2S in the Alberta basin reached 0.26 and 0.20 Mt/yr, respectively, with a total of 1.1 Mt CO2 and 0.6 Mt H2S injected to date (Figure 6), driven by the need to dispose of H2S driven by the need to dispose of H2S. All the injection rates and volumes presented in this report are at standard conditions (15oC and 101.3 kPa). SITE SELECTION AND OPERATIONS In Alberta, applications for acid gas disposal must conform to the specific requirements listed in Chapter 4.2 of Guide 65 that deals with applications for conventional oil and gas reservoirs (AEUB, 2000). Requirements in B.C. are modeled after those in Alberta. The selection of an acid-gas injection site needs to address various considerations that relate to: proximity to sour oil and gas production that is the source of acid gas; confinement of the injected gas; effect of acid gas on the rock matrix; protection of energy, mineral and groundwater resources; equity interests; wellbore integrity and public safety (Keushnig, 1995; Longworth et al., 1996). The surface operations and the subsurface aspects of acid gas injection depend on the properties of the H2S and CO2 mixture, which include, but are not limited to non-aqueous phase behavior, water content, hydrate formation and the density and viscosity of the acid gas (Carroll & Lui, 1997; Ng et al., 1999). Knowledge of the phase equilibria for acid gas allows the optimization of the injection process while addressing corrosion, hydrate formation and compressor-outlet pressure concerns. Acid Gas Properties The acid gas obtained after the removal of H2S and CO2 from the sour gas may also contain 1% to 3% hydrocarbon gases, and is saturated with water vapor in the range of 2 to 6%. In general, the ability of acid gas to hold water increases with temperature and decreases with the addition of small amounts of methane. However, unlike the case of hydrocarbon gases, the solubility of water in both H2S and CO2, hence in acid gas, decreases as pressure increases up to 3-8 MPa, depending on temperature, after which it dramatically increases (Figure 7). The solubility minimum reflects the pressure at which the acid gas mixture passes into the dense liquid phase form, where the solubility of water can increase substantially with increasing pressure due to the molecular attraction between these polar compounds (Wichert & Royan, 1996, 1997). This property of the acid gas mixture is used in dewatering the acid gas, to avoid pipe and well corrosion, by
13

�
����
����
����
����
����
����
����
���
���
�����
��
��
����
�
��
�
���
��
���
�
��
���
��
�
���
���
���
��
����
����
��
��
����
�
��
�
���
��
��
��
���
����
�
��� ����
������
������
��� ����
��
��
������������� ����� ������� ������������� ����� �� ������������������������ ��� ��� ����������������������� ������� ��������������������� ����� �� ����� � � !� ������������� ���� ������������
�
��
��
��
��
��
��
��
��
�
�
����
����
����
�
��
��
��
��
��
��
��
��
�
�
����
����
����
14
���
���
�
���
���
��
��
���
���
���
��
��
���
���
����
����
����
���
����
����
���
����
���
����
����
����
����
��
���
��
���
��
��
�
���
��
��
��
����
��
� ���
���
��
��
���
���
�
�
�
��
��
��
���
����
����
����
���
����
����
���
����
���
����
����
����
����
��
��
��
���
�
���
���
��
��
��
����
��
� ���
���
��
�
��
��
������������� ����� ������� ������������� ����������� ����
���������������������������� �������� �������������
����� ��!����� �� ���"� � � :� ������������� ��"� ������� �� 15

�
����
���
����
���
����
���
����
���
����
���
�
���
���
���
��
����
����
����
����
���
��
��
����
�
��
�
���
��
��
��
���
��
�
��
��
��
��
��
��
��
��
�
�
����
�
��
��
��
��
��
��
��
��
�
�
����
��
��
����
�
��
�
���
��
��
���
�����
� �
���
� �
���
��
��
������������� ����� ������� ���������������� ����
��� ��� ����������������������� ������� �������������
����!��"�#��� �# ���$� � � $�����!����������%%%&� ������������� ��$� ���#��� �� 16

��� � � � �� ��
������������
���
�
�
�
��
��
��
���
�
����
�
���
���
���
����
���
��
����
���
��
�
����
���
���
����
����
��
�
������������
�����
�
�
�
�
��
�������
���������
��������
��������
��������
�
����
�
���
���
���
����
���
��
����
���
��
�
������������ ����������������������������������������������������������������������������������������������
�������
������ !"�#����� ��������������������������������������������$������������������%&'���
�#
%&'���������'���
%������(��)#�*&&�+�,��$����-�.����#�*&&/#�*&&�� 17
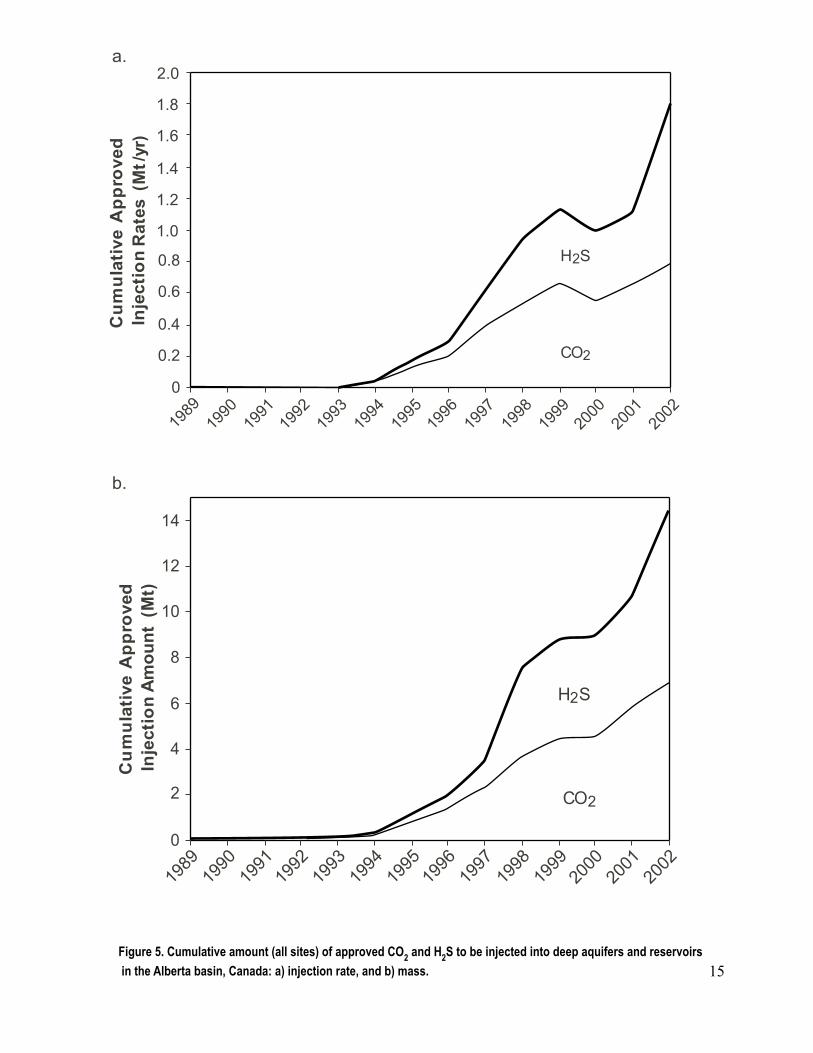
compressing the gas from about 100 kPa to around 8 to 10 MPa for injection, and reducing thus the water content to less than half a mole % (Wichert & Royan, 1996, 1997). While there are not many published properties of the acid gas mixture, the properties of pure CO2 and H2S have been thoroughly examined and reported. In their pure state, CO2 and H2S have similar phase equilibria, but at different pressures and temperatures (Carroll, 1998a). They exhibit the normal vapour/liquid behavior with pressure and temperature (Figure 8), with CO2 condensing at lower temperatures than H2S. Methane (CH4) also exhibits this behavior, but at much lower temperatures. The phase behavior of the acid gas binary system is represented by a continuous series of two-phase envelopes (separating the liquid and gas phases) located between the unary bounding systems in the pressure-temperature space (Figure 8). If water is present, both CO2 and H2S form hydrates at temperatures up to 10oC for CO2 and more than 30oC for H2S (Carroll & Lui, 1997). If there is too little water, the water is dissolved in the acid gas and hydrates will generally not form. However, phase diagrams show that hydrates can form without free water being present (Carroll, 1998a,b), thus operating above the hydrate-forming temperature is desirable.
The properties of the acid gas mixture are important in facility design and operation because, to optimize storage and minimize risk, the acid gas needs to be injected: (1) in a dense-fluid phase, to increase storage capacity and decrease buoyancy; (2) at bottom-hole
18

pressures greater than the formation pressure, for injectivity; (3) at temperatures in the system generally greater than 35oC to avoid hydrate forming, which could plug the pipelines and well; and (4) with water content lower than the saturation limit, to avoid corrosion. Surface Operations The sweetening of sour gas takes place at gas processing plants where the natural gas is processed to reach pipeline and sales specifications. A variety of solvents, solvent mixtures and processes are available for gas sweetening; and the selection of the optimum solvent or solvent mixture, and process depends on a variety of factors such as sour gas composition, pipeline specification, and compression requirements. In western Canada, the gas sweetening processes employ amines or amine derivatives as the chemical solvents of choice. In the sweetening process, after separation of any gas liquids, the sour gas is flowed through a contactor or absorber tower in a one- or two-stage process where the sour gas typically comes in contact with an amine or amine derivative solution. The amine or its derivative reacts with the acid gas, dissolving it, trapping it in the water phase and allowing the sweet components of the natural gas to pass on through. By the time the natural gas reaches the top of the tower, all of the CO2 and H2S should have been absorbed by the amine solution. Because the cost of the separation step is a major part of the acid gas injection operation, amine solvent mixtures are being optimized to increase the efficiency of the process, better amine forms are being developed, and other solvents are being used in multi-stage separation processes (chemical solvents – e.g. K2CO3; physical solvents – e.g. Selexol). After separation, the gas is now sweet, meeting pipeline and market specifications for allowable acid gas content. The gas-saturated amine solvent is collected from the bottom of the tower and is regenerated by heating the aqueous solution to approximately 170oC. The water-saturated acid-gas stream leaves the regeneration unit at 35 to 70 kPa and must be cooled and then compressed in excess of the subsurface storage formation pressure for injection. Typically, four stages of compression are required to provide the required discharge pressure (Figure 8). During compression, the acid gas mixture heats up and, therefore, cooling is required after each stage of compression. It is desirable to keep the compression cycle at a higher temperature than the stability field for hydrates to prevent compressor breakdown and plugging. The hydrate-forming temperature at any pressure of an acid gas increases with increasing content of H2S. In the limit, compression temperatures maintained above 35oC will avoid hydrates forming (Figure 8). Even if hydrate forming is avoided, excess water accelerates corrosion of the steel in contact with the acid gas, and ultimately this is the main reason why dehydration of the acid gas is needed. By the 4th stage in a cycle (Figure 8), compression will tend to dewater the acid gas up to a maximum pressure between 3 and 5 MPa (Figure 7) if there are no hydrocarbon impurities present. Further compressing the acid gas to higher pressures increases the solubility of water in the acid gas, such that any residual excess water dissolves into the acid gas, and more than counteracts the decrease in solubility due to interstage cooling. Hence, a separate dehydration step may not be needed because no
19

free-water will be present in the system (Clark et al., 1998). Thus, by collecting the condensed water during each compression stage and by keeping the temperature a few degrees above the hydrate stability temperature, the probability of hydrate formation and corrosion are minimized, and lower-quality, less expensive steels can be used for transporting the acid gas mixture to the subsurface storage formation. To avoid pump cavitation, the acid gas must not enter the two-phase region during compression. Higher temperatures, although required in the process to avoid hydrate formation and plugging of the lines, lead to accelerated corrosion. Both plugging and corrosion can lead to containment failure. Additional safety precautions require addition of chemical inhibitors to the acid gas stream (e.g., methanol to lower hydrate formation temperatures, and glycol to extract the excess water from the acid gas stream) or use of special corrosion-resistant steels. Both add to the cost of the operation. Corrosion monitoring is normally done to assess the effectiveness of the treatments. Once the acid gas is compressed, it is transported through a pipeline to the injection wellhead usually at a short distance from the gas plant. The well consists of a central steel tubing string with an outer annulus bounded by a steel casing that is cemented to the subsurface formations. The acid gas flows down the well tubing and into the subsurface storage formation through perforations in the well casing. The discharge pressure from the compressor must exceed the sum of: formation pressure minus the pressure-head in the well tubing (weight of the fluid column), the pressure loss or gain due to elevation change from the compressor to the well head, and all the pressure losses along the way from the compressor into the formation (due to friction in the pipeline to the wellhead and in the tubing string, and across perforations). Ultimately, the discharge pressure must consider the desired injectivity into the subsurface storage formation, which depends on the thickness and permeability of the formation and on the viscosity and density of the acid gas at in situ conditions. The high pressures after the fourth compression stage stabilize, upon cooling, the high-density liquid-phase of the acid gas, which can have a density of approximately 75% of the density of water, providing the hydrocarbon content is not greater than approximately 2%. Considering that in most cases the pressure of the subsurface injection formation is near hydrostatic, the hydraulic head provided by the acid gas provides a significant amount of the total pressure required to inject it into the subsurface formation. Several safety features are generally incorporated in the injection well to prevent leakage. The casing is isolated from the tubing string and the acid gas by installing a packer in the annulus between the casing and the tubing string just above the subsurface storage formation, which is pressure tested for integrity once a year. A down-hole safety valve or a check valve can be incorporated in the tubing string so that if equipment fails at surface, the back-flow of acid gas from the formation to the surface will be prevented. The wellhead of the injection well is similarly protected with valves. Other safety measures can be taken if needed. Although a number of safety valves are always installed, both in the well and in the surface facilities, to be able to isolate the containment lines for the acid gas injection
20

system into small volumes, the release of even small volumes of acid gas can be harmful. Consequently, the operators are required to have a detailed emergency response plan (ERP) if a leak occurs that may impact humans. An emergency planning zone, the EPZ (i.e. area of land which may be impacted by the release of H2S), is defined around the sour gas facility. To have an effective ERP, the area surrounding the injection site should be equipped with H2S detection and alarm systems, windsocks, self-contained breathing apparatus, and remote unit and plant shutdown stations. Subsurface Considerations The general location for an acid-gas injection well is often influenced by the proximity to sour gas oil or gas production facilities that are the source of acid gas. The specific location is based on a general assessment of the regional geology and hydrogeology, which is designed to evaluate the potential for leakage (Longworth et al., 1996) and which includes: 1. size of the injection zone, to confirm that it is large enough to volumetrically hold all
of the injected acid gas over the project lifetime; 2. thickness and extent of the overlying confining layer (caprock), and any stratigraphic
traps or fractures that may affect its ability to contain the acid gas; 3. location and extent of the underlying or lateral bounding formations; 4. folding or faulting in the area, and an assessment of seismic (neotectonic) risk; 5. rate and direction of the natural flow system, to assess the potential for migration of
the injected acid gas; 6. permeability and heterogeneity of the injection zone; 7. chemical composition of the formation fluids (water for aquifers, oil or gas for
reservoirs); 8. formation temperature and pressure; 9. analyses of formation and caprock core (if available); and, finally, 10. a complete and accurate drilling history of offsetting wells within several km of the
injection well, to identify any wells or zones that may be impacted by the injected acid gas.
In addition to the above technical requirements, the regulatory agencies require that environmental concerns must be addressed, such as injection-formation suitability, wellbore integrity, operating parameters (to ensure formation and well integrity), and optimization of the injection space, considered to be a limited resource. Disposal wells in the Alberta basin are classified into four classes, depending on the nature of the injected fluid (AEUB, 1994). Class Ia wells are used for the disposal of oilfield or industrial waste fluids. Class Ib wells are used for the disposal of produced water and common oilfield waste streams. Class II wells are used for the disposal of brine and brine-equivalent fluids. Class III wells are used for the injection of hydrocarbons, or inert or other gases. Class IV wells are used for injection of potable water or steam. The classification serves to define well completion requirements. Because of the nature of acid gas injection operations, the wells are considered as Class III disposal wells, unless the acid gas is dissolved in produced water prior to injection, in which case the well is designated as
21
either Class Ib or Class II, depending on the produced-water designation (AEUB, 1994). Completion and logging requirements are similar for Class II and III wells, and include: 1. all geological zones must be identified using logs and/or cores; 2. all potential hydrocarbon-bearing zones and the shallow potable groundwater
aquifers must be hydraulically isolated by cement; 3. injection must be through tubing, and the annulus must be filled with a corrosion-
inhibiting fluid; 4. hydraulic isolation and cement integrity must be confirmed by a full-length casing
log; and 5. safety devices must be installed both above the ground and in the well bore to ensure
that failure of any component in the system does not result in environmental damage. If the injection pressure drops for any reason, the well is automatically shut-in, to prevent acid gas backflow. Knowledge of the geological setting and characteristics is critical to assess the integrity of the host formation or reservoir, and the short- and long-term fate of the injected acid gas. Of particular importance are potential migration pathways from the injection zone to other formations, shallow groundwater and/or the surface. These potential pathways are of three types: the caprock pore space (“membrane”), natural and/or induced fractures (“cracks”) through the confining strata, and improperly completed and/or abandoned wells (“punctures”). To avoid diffuse gas migration through the caprock pore space, the difference between the pressure at the top of the injection aquifer or reservoir and the pressure in the confining layer must be less than the caprock threshold displacement pressure, which is the pressure needed for the acid gas to overcome the capillarity barrier and displace the water which saturates the caprock pore space. To avoid acid gas migration through fractures, the injection zone must be free of natural fractures, and the injection pressure must be below a certain threshold to ensure that fracturing is not induced. The maximum bottomhole injection pressure is set by regulatory agencies at 90% of the fracturing pressure. In the absence of site-specific tests, the pressures are limited by pressure-depth correlations, based on basin-wide statistical data for the Alberta basin. From this point of view, injection into a depleted oil or gas reservoir has the advantages of injection pressures being low and of wells and pipelines being already in place (Keushnig, 1995). REVIEW OF OPERATIONS All references to tables in the following are to Tables 1-6 in the Appendix. Subsurface Characteristics The depth of the injection zone varies mostly in the 1100-2300 m range, although in a few cases it is as shallow as 705 m, and as deep as 3478 m (Tables 1 and 2). The shallow injection zones (i.e. at 705 m, 809 m and 913 m depth) correspond actually to sour water injection. The thickness of the injection zone, as defined geologically, varies between 4 and 276 m; however, the actual net pay, defined by rocks with porosity and permeability
22

adequate for injection, reaches only 100 m. At 26 sites the acid gas is injected into a deep saline aquifer, and at 17 sites it is injected into a depleted oil or gas reservoir, and at 4 sites in the water leg underlying a reservoir. Of these, 28 are in carbonate rocks and 19 are in sandstones (Table 1). Shales constitute the overlying confining unit (caprock) in most cases, although tight limestones, evaporites and anhydrites are also present. Their thickness varies between 2 and 270 m. (Table 1). The porosity of the injection zone varies between 4% and 30% (Table 2). The carbonate rocks generally have low porosity, except for carbonate reefs. Only the porosity of sandstone rocks displays a general trend of decreasing porosity with increasing depth. Rock permeability is indicated for less than half of the sites cases and varies from as low as 0.55 mD to as high as 10,400 mD, although most values are of the order of 101-102 mD (Table 2). Formation temperature varies between 35oC at 1397 m depth and 110oC at 3432 m depth (Table 2), although higher temperatures than the lowest one are recorded at shallower depth (e.g. 56oC at 1138 m), and a relatively low temperature (82oC) is indicated for a deep injection zone (2450 m). The relatively wide spread in temperature variation with depth for the acid-gas injection zones is due to the variability in geothermal gradients across the Alberta basin, which exhibits a trend of increasing gradients from the south, where they are as low as 20oC/km, to the north, where they reach more than 50oC/km (Bachu, 1993). The original formation pressure is generally subhydrostatic with respect to freshwater, which is characteristic of the Alberta basin (Bachu, 1999), and, except for one very low case of 5915 kPa that actually corresponds to a sour water injection operation, varies between 8900 kPa and 35,860 kPa (Table 2). The cases where the pressure seems to be slightly above hydrostatic correspond actually to high salinity formation waters. If the real formation water density is taken into account, then pressure at all sites is hydrostatic or less. In the case of acid gas injection into depleted oil or gas reservoirs, the original reservoir pressure was drawn down as a result of production, such that formation pressure at the start of acid gas injection was less than the original formation pressure, sometimes significantly, reaching as low as 1170 kPa (Table 2). Production-induced drawdown occurs also in the case of injection into an aquifer underlying an oil pool, and into an aquifer located very close to an oil pool. In 10 cases the formation pressure at start up was below the critical pressure of CO2. Generally, formation waters are very saline, with salinity varying in a very wide range, from ~24,000 mg/l to ~341,000 mg/l (Table 2). Although there is a broad trend of increasing salinity with depth, exceptions are due to injection zones being either characterized by fresher water influx, or in the vicinity of evaporitic beds. The very high salinity encountered at a relatively shallow depth corresponds to injection into a carbonate aquifer in eastern Alberta overlain by thick halite beds. For the case of acid gas being injected into depleted oil reservoirs, the oils are medium to very light (33oAPI to 68oAPI) (Table 2). Because acid gases will likely have a lower minimum miscibility pressure (MMP) than conventional hydrocarbon gases, their use in enhanced oil recovery often warrants consideration, as was done in the case of one of the Zama sites (Davison et al., 1999). Reservoir gases are generally light (specific gravity less than 0.75) except for
23

four cases of 0.851, 0.915, 1.024 and 1.121 (Table 2). Because acid gas is generally heavier than these reservoir gases, consideration may be given also for its use in enhanced gas recovery. Licensed Operations The licensed parameters for the acid gas operations are listed in Table 3. The composition of the acid gas licensed for injection varies between 15% CO2 and 85% H2S, and 98% CO2 and 2% H2S, with C+ gases for the balance. The maximum approved well-head injection pressure (WHIP) and bottom hole injection pressure (BHIP) reach 19,000 kPa and 37,400 kPa, respectively. The maximum approved well head pressure (WHIP) is generally lower than the formation pressure, except for the few cases where the injection reservoir has been depleted prior to operations start up. The maximum approved bottom hole injection pressure (BHIP) is always higher than the formation pressure, to ensure injectivity. Approved daily injection rates vary between 2,800 and 900,000 m3/day, and maximum allowed injection volumes vary between 6⋅106 and 1,876⋅106 m3. Operation lifetime ranges generally from 10 to 25 years. In the case of the 2.8 years life-time operation (Table 3), the operator has indicated in the original application that it will seek approval for another site in due time. Emergency planning zones in case of an accidental acid gas escape into the atmosphere vary between as small as 40 m and as large as 8.5 km around the injection well. Surface Characteristics Injection well characteristics are listed in Table 4. Casing depths range from 856 to 3,334 meters. Casing diameter ranges from 114 to 244 mm, while the tubing diameter ranges from 60 to 178 mm. The annulus fluid is sealed by a packer and is corrosion inhibited by being filled with either fresh water, KCl water, produced water, crude oil, or diesel. Pipeline characteristics are compiled in Table 5. The pipelines connect the plant compressors to the injection wells, and range in length from 100 m to 20 km, with diameters ranging from 48 to 168 mm and wall thickness from 4 to 11 mm. Typically, only the shorter pipelines are stainless steel. The majority of the pipelines are mild carbon steel. Currently, stress levels in the pipeline are less than half the approved levels, and do not exceed 30%, while licensed levels are as high as 61%. No attempt has been made to compare the sweetening steps for the sour gas stream for the different sites. The comparison starts at the compression stage, where the acid gas stream has been concentrated to a mixture of H2S and CO2, with accessory water vapour and hydrocarbon components. Table 6 summarizes the characteristics of the gas plant compressors. The majority of the compressors are diesel. Four-stage compression dominates, with power ranging from 50 to 4000 HP. The design discharge rate of the acid gas stream ranges from 7,000 to 800,000 m3/day (i.e. flow rates through the compressors). Generally, the rates of injection actually used are close to the maximum approved rates. However, this is not true for the compressor discharge pressures. They are generally more than 25% lower than the maximum approved wellhead injection
24

pressure (WHIP). Maximum wellhead injection pressures range from 2.8 MPa to 8.9 MPa. In the majority of cases dehydration is supplied by the compression cycle as discussed previously, and only in a few cases triethylene glycol, refrigeration or a desiccant is used. Generally, the compressed acid gas is injected in a pressure-temperature range where the liquid phase is stable, resulting in an appreciable head pressure being generated due to the height of column of this liquid in the wellbore. ISSUES Critical issues are for the most part environmental and safety-related, and they directly affect the economics of acid gas injection. Either a slow or rapid acid gas leak can result in loss of life or contamination of the bio- and atmosphere leading to degradation of the environment. Surface safety is addressed through engineering, installation of safety valves and monitoring systems, and emergency procedures in case of H2S leaks. Subsurface issues are of two inter-related categories: the effect of the acid gas on the rock matrix and well cements, and plume containment. When the acid gas contacts the subsurface formation, it will readily dissolve in the formation water in an aquifer, or connate water in a reservoir, and create weak carbonic and sulphuric acids. This leads to a significant reduction in pH that accelerates water-rock reactions. Depending on mineralogy, rock dissolution or precipitation may occur, affecting the porosity and permeability of the host rock. The fact that both CO2 and H2S are dissolving in the formation water leads to some complex reaction paths (Gunter et al., 2000; Hitchon et al., 2001) where carbonates precipitate and dissolve, and pyrite/pyrrhotite precipitates. Dissolution of some of the rock matrix in carbonate strata, or of the carbonates surrounding the sand grains in sandstone units results in lower injection pressures in the short term. A major concern with the injection process is the potential for formation damage and reduced injectivity in the vicinity of the acid gas scheme. The reduction in injectivity could possibly be the result of fines migration, precipitation and scale potential, oil or condensate banking and plugging, asphaltene and elemental sulphur deposition, and hydrate plugging (Bennion et al., 1996). Cement compatibility with the acid gas, primarily in the injection well, but also in neighboring wells, is crucial for safety and containment. For example, a non-carbonate and calcium cement blend shattered when tested in an acid-gas stream for several weeks (Whatley, 2000). Thus, the compatibility of the acid gas with the cement that bonds the casing to the formation should be tested at a minimum. While the cement for the newly implemented acid-gas operation can be tested and properly selected prior to drilling, the cements in nearby wells are already in place and their condition is largely unknown. Some of these wells could be quite old, with the cement already in some stage of degradation as a result of brine composition. The acid gas, when reaching these wells, may enhance and speed up the cement degradation, leading to possible leaks through the well annulus and/or along casing. If the acid gas is injected into the originating or other oil or gas pool, the main concern is the impact on further hydrocarbon recovery from the pool and acid-gas production at the
25

pump, although the operation may prove successful, like the Zama X2X pool (Davison et al., 1999). If the gas mixture is injected into an aquifer, the degree to which it forms a plume and migrates from the injection well depends on various factors, including pressure and temperature, solubility, interplay between driving forces, like buoyancy, and aquifer hydrodynamics, and aquifer heterogeneity, which controls gravity override and viscous fingering. The fate of the injected acid gas in the subsurface is not known, because subsurface monitoring is not required, and it is difficult and expensive. Only the well-head gas composition, pressure, temperature and rate have to be reported to regulatory agencies. There is only one recently reported case (2002) where the operator believed, when it applied for the injection license, that the disposal zone is isolated by a fault from an adjacent pool in the same formation producing oil with a high H2S content, only to have acid gas breakthrough at two offset producing wells some 900 m away from the injection well after several months since the start of injection. However, the operator, owner of both the oil pool and of the acid gas disposal facility, decided to continue both operations. CONCLUSIONS From an engineering point of view, acid gas injection has been developed into a mature technology. It can be injected as a dry gas or a solution gas, depending on the wastewater available. The size of the operations approved to date in western Canada is relatively small, with approved injection rates and volumes generally less than 0.1 million m3/d and 200 million m3, respectively, with no obvious historical trend, although a few very large operations have been approved in 2002 (Figure 9). One may initially expect an increase in operation size as knowledge and technology advances, but the lack of a historical trend is more a reflection of economic and geological considerations than of technological know-how. Compared to other options, acid gas injection has less environmental consequences than sulphur recovery (where leaching of the sulphur piles can lead to groundwater contamination) or flaring (which essentially substitutes SO2 for H2S in the atmosphere, as well as releasing CO2). Knowledge of the phase-equilibria and properties of the acid gas is extremely important in designing a safe injection operation, which minimizes corrosion, hydrate formation and cavitation, leading to a dense-fluid phase for injection. Both monitoring for gas leaks and corrosion, and plans for mitigation if a leak occurs, are an essential part of the technology. Equally important for a safe acid gas injection operation is the proper characterization and selection of the subsurface injection zone (reservoir or aquifer). Critical elements are containment and prevention of leakage and/or migration through natural or man-made conduits, such as fractures (“cracks”) and abandoned wells (“punctures”). Maintaining the integrity of the confining aquitard (or caprock), which is subjected to physical and chemical stresses, is essential.
26

�����������
�
�
�
�
�
�
�
�
�
�
�
�
�
��
��
��
��
�
�����������������������
����
���
����
����
���
����
����
����
����
����
����
�
��
��
���
���
��
��
�
��
� �
���
���
���
��
��
��
����
���
����
����
���
����
����
����
����
����
����
�
��
��
����
��
��
��
���
���
��
��
��
�� �
���
���
�
��
��
�������������� ����������������������������������������������a:��������������������������������������������
27

Acid gas injection is more than an industrial, scaled-up analogue for geological storage of CO2. The experience gained so far in North America, particularly in Canada, can be applied elsewhere in the world. As gas resources become more depleted, deeper and more sour gas will be produced; and therefore application of this technology will result in the reduction of significant CO2 emissions even without the incentive of CO2 emission trading. With the advent of trading, acid gas injection should become even more appealing to oil and gas producers. By the end of 2002, close to 1.5 Mt CO2 and 1 Mt H2S have been successfully injected into deep hydrocarbon reservoirs and saline aquifers in Canada alone. If one considers also the 16 operations in the United States, this experience shows that CO2 storage in geological media is a technology that can successfully be expanded to and applied in large-scale operations that will reduce CO2 emissions into the atmosphere from large CO2 point sources. The technology and experience developed in the engineering aspects of acid gas injection operations (i.e., design, materials, leakage prevention and safety) can be easily adopted for large-scale operations for CO2 geological storage, since a CO2 stream with no H2S is less corrosive and hazardous. Although the fate of the injected acid gas has not been monitored to date, the subsurface information about aquifer and reservoir rocks and fluids may provide a wealth of information as to what characteristics a good CO2-storage site should have. This information can be used for the screening and identification of future sites for the geological sequestration and storage of CO2. In addition, monitoring the fate of the injected acid gas at one or more such sites will provide invaluable information about the long-term fate of injected acid and greenhouse gases. Finally, H2S has the potential to become a valuable energy source. Besides hydrocarbons, sulphur and H2S represent the only additional store of chemical energy that occurs naturally on Earth in substantial quantity (Connock, 2001). Just as CH4 is oxidized to CO2 to recover energy, oxidation of H2S to SO2 can provide energy. If technology can be developed to make this economically attractive, then the acid gas components for injection would become CO2 and SO2 instead of CO2 and H2S (Connock, 2001). REFERENCES Adams, G. H. & Rowe, H. G. 1981. Slaughter Estate Unit CO2 pilot – surface and downhole equipment construction and operation in the presence of H2S. Journal of Petroleum Technology, 33:6, 1065-1074. AEUB (Alberta Energy and Utilities Board) 1994. Guide 51: Injection and Disposal Wells. Alberta Energy and Utilities Board, Calgary, AB. DOI eub.gov.ab.ca/bbs/products/guides/g51-1994.pdf. AEUB (Alberta Energy and Utilities Board) 2000. Guide 65: Resources Applications for Conventional & Gas Reservoirs. Alberta Energy and Utilities Board, Calgary, AB, 113-136. DOI eub.gov.ab.ca/bbs/products/guides/g65.pdf. Bachu, S. 1993. Basement heat flow in the Western Canada Sedimentary Basin: Tectonophysics, 222:1, 119-133.
28

Bachu, S. 1999. Flow systems in the Alberta Basin: Patterns, types and driving mechanisms. Bulletin of Canadian Petroleum Geology, 47, 455-474. Bachu, S. 2000. Sequestration of carbon dioxide in geological media: criteria and approach for site selection. Energy Conversion and Management, 41:9, 953-970. Bachu, S. & Stewart, S. 2002. Geological sequestration of anthropogenic carbon dioxide in the Western Canada Sedimentary Basin. Journal of Canadian Petroleum Technology, 41:2, 32-40. Bennion, D. B., Thomas, F. B., Bennion, D. W. & Bietz, R. F. 1996. Formation screening to minimize permeability impairment associated with acid gas or sour gas injection/disposal. CIM Paper 96-93 Presented at the 47th Annual Technical Meeting of the CIM Petroleum Society, Calgary, AB, June 10-12, 1996. Carroll, J. J. 1998a. Phase diagrams reveal acid-gas injection subtleties. Oil & Gas Journal, 96:9, 92-96. Carroll, J. J. 1998b. Acid-gas injection encounters diverse H2S, water phase changes. Oil & Gas Journal, 96:10, 57-59. Carroll, J. J. & Lui, D. W. 1997 Density, phase behavior keys to acid gas injection. Oil & Gas Journal, 95:25, 63-72. Clark, M. A., Syrek, W. Y., Monnery, W. D., Jamaluddin, A. K. M., Bennion, D. B., Thomas, F. B., Wichert, E., Reed, A. E. & Johnson, D. J. 1998 Designing an optimized injection strategy for acid gas disposal without dehydration. In: Proceedings of the Seventy-Seventh Gas Processors Association Annual Convention, Tulsa, OK, 49-56. Connock, L. 2001. Acid gas injection reduces sulphur burden. Sulphur, 272, 35-41. Davison, R. J., Mayder, A., Hladiuk, D. W. & Jarrell, J. 1999. Zama acid gas disposal/miscible flood implementation and results. Journal of Canadian Petroleum Technology, 38:2, 45-54. Gunter, W. D., Perkins, E. H. & Hutcheon, I. 2000. Aquifer disposal of acid gases: modeling of water-rock reactions for trapping acid wastes. Applied Geochemistry, 15, 1085-1095. Hitchon, B., Perkins, E. H. & Gunter, W. D. 2001. Recovery of trace metals in formation waters using acid gases from natural gas. Applied Geochemistry, 16, 1481-1497. Ho, K. T., McMullen, J., Boyle, P., Rojek, O., Forgo, M. & Beatty, T. 1996. Subsurface acid gas disposal scheme in Wayne-Rosedale, Alberta. SPE Paper 35848, In: Proceedings of the Gas Technology Symposium, Calgary, AB, Canada, 28 April – 1 May 1996, SPE, 699-704. Keushing, H. 1995. Hydrogen sulphide – if you don’t like it, put it back. Journal of Canadian Petroleum Technology, 34:6, 18-20. Kopperson, D., Horne, S., Kohn, G., Romansky, D., Chan, C. & Dugworth, G. L. 1998a. Injecting acid gas with water creates new disposal option. Oil & Gas Journal, 96:31, 33-37. Kopperson, D., Horne, S., Kohn, G., Romansky, D., Chan, C. & Dugworth, G. L. 1998b. Two cases illustrate acid gas/water injection scheme. Oil & Gas Journal, 96:32, 64-70.
29
Lock, B. W. 1997. Acid gas disposal – A field perspective. In: Proceedings of the Seventy-Sixth Gas Processors Association Annual Convention, San Antonio, TX, March 10-12, 1999, Tulsa, OK, p. 161-170. Longworth, H. L., Dunn, G. C. & Semchuk, M. 1996. Underground disposal of acid gas in Alberta, Canada: regulatory concerns and case histories. SPE Paper 35584, In: Proceedings of the Gas Technology Symposium, Calgary, AB, Canada, 28 April – 1 May 1996, SPE, 181-192. Ng, H-J., Carroll J. J. & Maddocks, J. R. 1999. Impact of thermophysical properties research on acid gas injection process design. In: Proceedings of the Seventy- Eighth Gas Processors Association Annual Convention, Nashville, TN, March 1- 3, 1999, Tulsa, OK, 114-120. Whatley, L. 2000. Acid-gas injection proves economic for west-Texas plant. Oil & Gas Journal, 98:21, 58-61. Wichert, E. & Royan, T. 1996. Sulfur disposal by acid gas injection. SPE Paper 35585, In: Proceedings of the Gas Technology Symposium, Calgary, AB, Canada, 28 April – 1 May 1996, SPE, 193-200. Wichert, E. & Royan, T. 1997. Acid gas injection eliminates sulfur recovery expense. Oil & Gas Journal, 95:17, 67-72.
30

Synthesis Reports
Acid Gas Injection Operations
in Western Canada
Synthesis Tables 1. Reservoir Geology 2. Reservoir Properties and Fluids 3. Licensed Injection Operations 4. Acid Gas Injection Wells 5. Pipelines 6. Gas Plant Compressors
Synthesis Graphs Host Rock Host Fluids Operations
31

Table 1: Reservoir Geology
Site No.
Unit Type Name Lithology Thk (m)
Underlying FormationName Lithology Thk (m)
Caprock FormationName Lithology Thk (m)
Injection FormationInj. Zone Depth Net Pay
Contained Fluid
Halfway Fm Charlie Lake Fm Doig Fm4 79101Oil & Gas Shaly siltstone312 15561552 - 4 SandstoneReservoir Qtz-sandstone
Belloy Fm Montney Fm Taylor Flat Fm37 396250Water Sandstone320 19421905 - 13 SiltstoneAquifer Sandstone
Wabamun Gp Exshaw Fm Graminia Fm203 10130Water Siltstone449 29182715 - 10 ShaleAquifer Limestone
Wabamun Gp Exshaw Fm Graminia Fm218 7130Water Arg-silty carb.581 25032285 - 10 ShaleAquifer Limestone
Ellerslie Mbr Ellerslie Mbr Ellerslie Mbr17 1412Oil Shale625 14391422 - 17 ShaleReservoir Sandstone
Wabamun-Winterburn Exshaw Fm Winterburn Gp276 10Water Limestone718 981705 - 100 ShaleAquifer Limestone
Wabamun Gp Banff Fm Blueridge Mbr6 50190Water Dolomitic shale844 22282222 - 8 LimestoneAquifer Limestone
Halfway Fm Charlie Lake Fm Doig Fm10 2515Oil Shaly siltstone997 14011391 - AnhydriteReservoir Sandstone
Leduc Fm Ireton Fm Cooking Lake Fm18 8518Oil Carbonates1034 26952677 - 18 ShaleReservoir Dolostone
Nordegg Mbr Lower Mannville Fm Pekisko-Banff21 1515Oil & Gas Dolomitic shale1189 15621541 - 6 ShaleReservoir Sandstone
Wabamun Gp Exshaw Fm95 5010Oil Carbonates1242 18401745 - 88 ShaleReservoir Dolostone
Wabamun Gp Exshaw Fm131 8Oil1396 20581927 - 50 ShaleReservoir Dolostone
Kiskatinaw Fm Belloy & Kiskatinaw Golata Fm35 2185Gas Shale1489 13901355 - 8 AnhydriteReservoir Qtz-arenite
Keg River Fm Muskeg Fm 270Water1510 1493 - EvaporitesReservoir Dolostone
Slave Point Fm Fort Simpson Fm Fort Vermilion Mbr68 1513Gas Anhydrite1522 13851317 - 8 ShaleReservoir Limestone
Zama & Keg River Muskeg Fm Lower Keg River107 4575Oil & Gas Carbonates1563 15851478 - 25 AnhydriteReservoir Carbonates
Belloy Fm Montney Fm Debolt Fm12 240Water Dolostone1630 16731661 - 10 ShaleAquifer Sandstone
Leduc Fm Ireton Fm 22Water1734 1200 - 30 ShaleReservoir Dolostone
Keg River Fm Muskeg Fm Chinchaga Fm56 35150Water Anhydrite1895 11661110 - 18 EvaporitesAquifer Dolostone
Wabamun Gp Ellerslie-Wabamun Graminia-Blueridge7Water Shaly siltstone1971 1167 - 16 Lime mudstoneAquifer Limestone
Beaverhill Lake Gp Leduc-Cooking Lak 150Water2081 1958 - 10 Lime mudstoneAquifer Dol. Limestone
Keg River Fm Muskeg Fm Chinchaga Fm81 35140Water Anhydrite2101 14541373 - 81 AnhydriteAquifer Dolostone
Keg River Fm Muskeg Fm Lower Keg River49 85Water Dolostone2271 16501601 - 15 EvaporitesAquifer Dolostone
Acid-gas Injection Operations Alberta Geological Survey32

Site No.
Unit Type Name Lithology Thk (m)
Underlying FormationName Lithology Thk (m)
Caprock FormationName Lithology Thk (m)
Injection FormationInj. Zone Depth Net Pay
Contained Fluid
Leduc FmWater2469 -Reservoir Carbonates
Upper Leduc Nisku Fm Lower Ireton112 1020Water Shale2573 14531341 - 40 DolostoneAquifer Dolostone
Wabamun Gp Banff Fm Wabamun-Winterbu66 90168Water Limestone2636 28472781 - 60 LimestoneAquifer Dolostone
Belloy Fm Montney Fm Taylor Flat Fm82 70250Water Carbonate-rich 2719 21182036 - 10 Shaly siltstoneAquifer Siliciclastics & ca
Keg River Fm Prairie Evaporite F Cambrian System17 185Water Clastics2830 14331416 - 10 SaltAquifer Dolostone
Belloy Fm Montney Fm Stoddart Gp21 264Water Carbonates2982 16101589 - 29 ShaleAquifer Sandstone
Cooking Lake Fm Duvernay Fm Mildred Mbr80 5142Water Limestone3084 20902010 - 40 ShaleAquifer Limestone
Leduc Fm Ireton Shale Waterways Fm54 2Water Shale3195 19341880 - 5 ShaleAquifer Dolostone
Ostracod-Basal Qtz 104Water3340 12861182 - 3Aquifer Sandstone
Basal Quartz Sd 71Water3465 984913 -Aquifer Clastics
Cummings Mbr Lloydminster Mbr Woodbend Gp29Oil Carbonates3581 838809 - SandstoneReservoir Sandstone
Glauconitic Ss Upper Mannville Fm Glauconitic & Sunbu 750Oil & Gas Shale & siltston3651 - 4 Shale & siltstoneReservoir Sandstone
Belloy Fm Montney Fm Taylor Flat Fm43 45199Water Dolomitic shale3720 24502407 - 26 ShaleAquifer Sandstone
Kiskatinaw Fm Taylor Flat Fm Golata Fm41 3020Water Shale3804 18011760 - 24 Sand & shaleAquifer Sandstone
Nisku Fm Calmar Fm Nisku-Upper Ireton92 4Water Dolomitic shale3968 34783386 - 14 ShaleReservoir Carbonates
Baldonnel Fm Nordegg Mbr Charlie Lake Fm48Oil4058 15351487 - 30Reservoir
Pardonet Fm Charlie Lake Fm182Gas Anhydrite4174 28152633 - 27Reservoir Carbonates
Debolt Fm Stoddart Gp32Oil4248 21962164 - 15 SiltstoneReservoir Carbonates
Halfway Fm Charlie Lake Fm Doig Fm61 189185Water Shale4292 17131652 - 9 DolostoneAquifer Sandstone
Halfway Fm Charlie Lake Fm Doig Fm27 3559Water Shale4336 16171590 - 13 AnhydriteAquifer Sandstone
Halfway Fm Charlie Lake Fm Doig Fm27 3559Water Shale4343 16171590 - 13 AnhydriteAquifer Sandstone
Baldonnel Fm Nordegg Mbr Charlie Lake Fm58 40020Gas Anhydrite4489 13551297 - 25 ChertReservoir Dolostone
Kiskatinaw Fm Kiskatinaw Fm Golata Fm13 3025Gas Mudstone4512 24562443 - 10 ShaleReservoir Sandstone
Debolt Fm Montney Fm75 83Water4680 1025950 - 4 ShaleAquifer Carbonates
Acid-gas Injection Operations Alberta Geological Survey33

Table 2: Reservoir Properties and Fluids
Site No.
Reservoir volume
(1000 m³)
Porosity (fraction)
Permeability (md)
Formation Pressure Formation Temperature
(°C) Original Startup (kPa) (kPa)
Na (mg/l)
Ca (mg/l)
TDS (mg/l)
HCO (mg/l)
API gravity
Specific gravity
Molecular mass
Formation Water Oil Produced Gas3
Avg. Injection depth (m)
312 1520068 NA 37.3 0.712 20.621554 15
320 0.12 1670076 53400 4760 471 NA NA NA1620006101924 30
449 0.06 27000 41530 9830 481 NA NA NA1528135692817 75
581 0.08 2024470 NA NA NA3202394 35
625 0.15 1024560 NA 23200 2880 397 0.684 19.8694005391431 50
718 0.10 5915 21605 5756 293 NA NA NA843
844 0.20 1776269 NA NA NA1072225
997 0.12 1280060 9500 9289 340.8 869 0.7022 20.341396 6
1034 0.16 2858882 NA 37 0.742 21.5742686 124
1189 1213558 4215 16850 3964 105 0.6695583016311552 155
1242 0.05 1798258 NA 56.6 NA NA521793
1396 0.05 2031763 NA 33.4 NA NA1151993
1489 0.21 1303547 6100 52095 5485 278 NA1567221821373 500
1510 0.06 1500079 5842 35.2 NA NA342
1522 0.08 1339449 3110 NA1351
1563 0.04 1447976 13394 48600 11400 1435 36.15 0.691 201683554501532
1630 0.18 1670057 12855 54500 5240 257 NA 0.604 17.51568043961667
1734 0.10 53 9465 27100 11100 771 68.1 0.73 21.1120000137100
1895 0.05 1116456 NA NA NA2660003081138
1971 0.13 890045 NA NA NA201
2081 0.07 1570071 15700 NA NA NA671
2101 0.04 1129252 NA NA NA2261414
2271 0.05 1323758 13237 NA NA NA13500013001626
2469 NA 32600 4510 552 NA 1.121 NA106618
2573 0.22 35 7500 24330 3160 971 NA 1.024 NA7892450841397
2636 0.09 24680103 NA NA NA3072814
Acid-gas Injection Operations Alberta Geological Survey34

Site No.
Reservoir volume
(1000 m³)
Porosity (fraction)
Permeability (md)
Formation Pressure Formation Temperature
(°C) Original Startup (kPa) (kPa)
Na (mg/l)
Ca (mg/l)
TDS (mg/l)
HCO (mg/l)
API gravity
Specific gravity
Molecular mass
Formation Water Oil Produced Gas3
Avg. Injection depth (m)
2719 0.12 2000076 NA 0.62 36.791400003302077
2830 0.06 1379038 106920 21976 126 NA NA NA3414302411425
2982 0.20 1374460 54500 5240 257 NA 0.604 17.51568042091600
3084 0.05 70 15459 48930 30968 166 51.5 0.65 18.82226634812050 30
3195 0.06 65 15500 30200 11100 895 NA 0.915 26.51224494161907 153
3340 0.16 930051 1700 NA 0.693 20.451234
3465 NA NA NA949
3581 0.30 5200 NA NA230824 6500
3651 11500 1170 0.851 24.6
3720 0.12 2308482 55253 2505 795 NA NA NA15921623202429
3804 0.11 1650063 60100 4330 207 NA NA NA1620003791781 9
3968 0.10 35860110 11000 NA NA NA615009203432 693
4058 0.09 68 8300 13793 173 3853 NA NA1511 5
4174 3214582 4200 21200 146 5338 NA3648002724 1
4248 0.04 76 17596 0.629 18.237600011412180
4292 0.12 1568564 8549 110 854 NA NA NA237421683
4336 0.12 1311361 66490 2442 2330 NA NA NA17769138631604
4343 0.12 1311361 29600 1420 807 NA NA NA1604
4489 0.10 1115464 6031 13793 173 3853 NA1326
4512 0.09 2313382 2000 NA 0.573 16.62450
4680 0.10 53 7670 26900 1620 555 NA 0.593 38.4177800988 10401
Acid-gas Injection Operations Alberta Geological Survey35

Table 3: Licensed Operations
Site No. CO
(mol frac)H S
(mol frac)
Licensed Inj. Gas 2 2
Total Approved Inj. Volume(1000 m³)
Maximum Approved BHIP (kPa)
WHIP(kPa)
Life time EPZ (km)(years)
Max. Approved Injection Rate
(1000 m³/d)
0.25 0.75312 14910 5000 10 3.027 34500
0.32 0.66320 22000 8000 15 3.560 263000
0.15 0.75449 33000 12000 5.330 63000
0.79 0.20581 35800 13000 10 6.234 124100
0.57 0.42625 10546 9000 2058 213000
0.31 0.01718 8596 3750 0.06 6000
0.65 0.35844 20300 10500 15 2.416 38000
0.44 0.34997 26000 13000 10 1.14.2 16000
0.31 0.631034 31380 12300 25 5.512 40000
0.95 0.041189 11000 7500 15 0.440 70000
0.29 0.671242 21500 9000 20 3.72.8 8100
0.45 0.521396 20303 12000 11 5.018 35000
0.57 0.411489 13035 7100 25 3.75 18700
0.70 0.301510 16707 12000 1.7210 88000
0.70 0.301522 21000 11000 3.0210 220000
0.61 0.381563 14500 12000 8 17.0160 157000
0.70 0.301630 17982 10000 15 1.321 94200
0.87 0.131734 9000 1535 64000
0.34 0.641895 11500 7000 15 2.065 140000
0.80 0.171971 18220 9800 10 2.011 41000
0.50 0.482081 21760 11700 15 2.940 185100
0.34 0.642101 18925 7600 15 3.826.3 106000
0.75 0.252271 18192 9500 15 3.274.6 290000
0.50 0.502469 8273
0.70 0.172573 15274 8000 1.545 160000
0.45 0.552636 10500 28 109000
0.51 0.492719 24607 9000 20 5.042 150000
0.88 0.092830 22000 10000 12 1.224 86000
0.71 0.252982 14210 9000 15 2.221 58200
0.72 0.253084 20000 10000 15 1.925 115000
0.82 0.173195 20000 10000 15 1.028 140000
0.83 0.153340 6000 6 30000
0.60 0.133465 11000
Acid-gas Injection Operations Alberta Geological SurveyFootnote: For Site No. 4343 see Site No. 4336 for the total approved injection rate and volume (same operation) 36
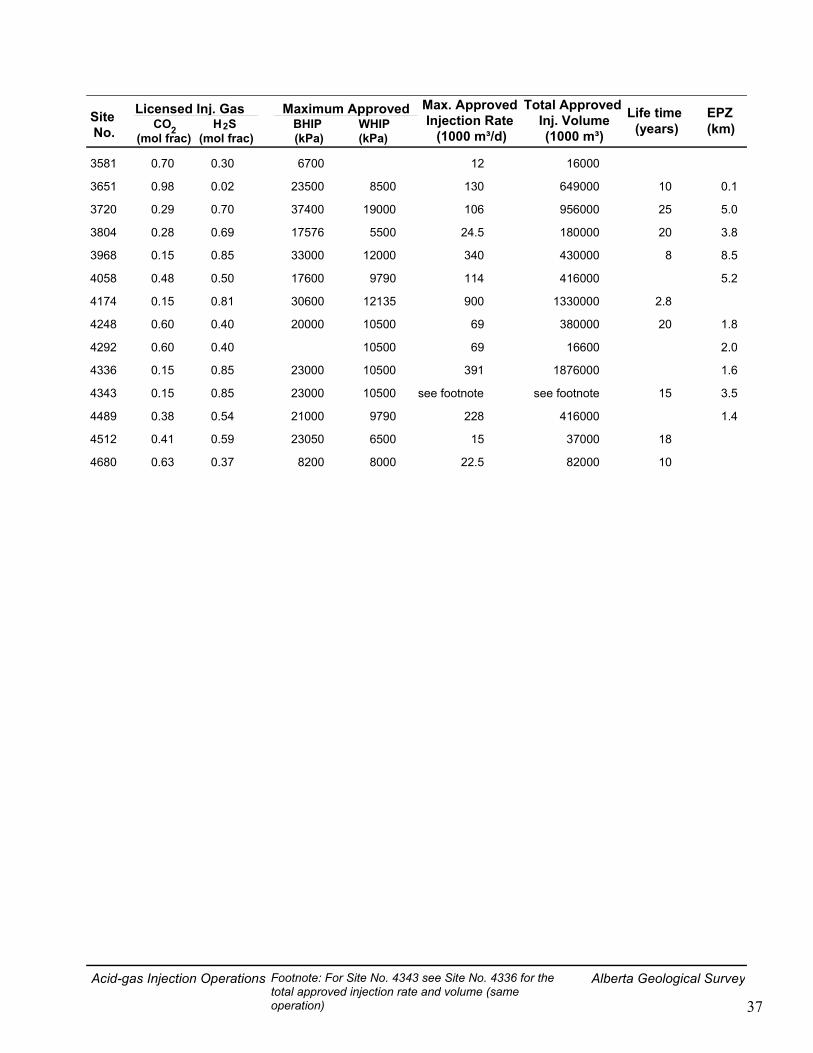
Site No. CO
(mol frac)H S
(mol frac)
Licensed Inj. Gas 2 2
Total Approved Inj. Volume(1000 m³)
Maximum Approved BHIP (kPa)
WHIP(kPa)
Life time EPZ (km)(years)
Max. Approved Injection Rate
(1000 m³/d)
0.70 0.303581 6700 12 16000
0.98 0.023651 23500 8500 10 0.1130 649000
0.29 0.703720 37400 19000 25 5.0106 956000
0.28 0.693804 17576 5500 20 3.824.5 180000
0.15 0.853968 33000 12000 8 8.5340 430000
0.48 0.504058 17600 9790 5.2114 416000
0.15 0.814174 30600 12135 2.8900 1330000
0.60 0.404248 20000 10500 20 1.869 380000
0.60 0.404292 10500 2.069 16600
0.15 0.854336 23000 10500 1.6391 1876000
0.15 0.854343 23000 10500 15 3.5see footnote see footnote
0.38 0.544489 21000 9790 1.4228 416000
0.41 0.594512 23050 6500 1815 37000
0.63 0.374680 8200 8000 1022.5 82000
Acid-gas Injection Operations Alberta Geological SurveyFootnote: For Site No. 4343 see Site No. 4336 for the total approved injection rate and volume (same operation) 37
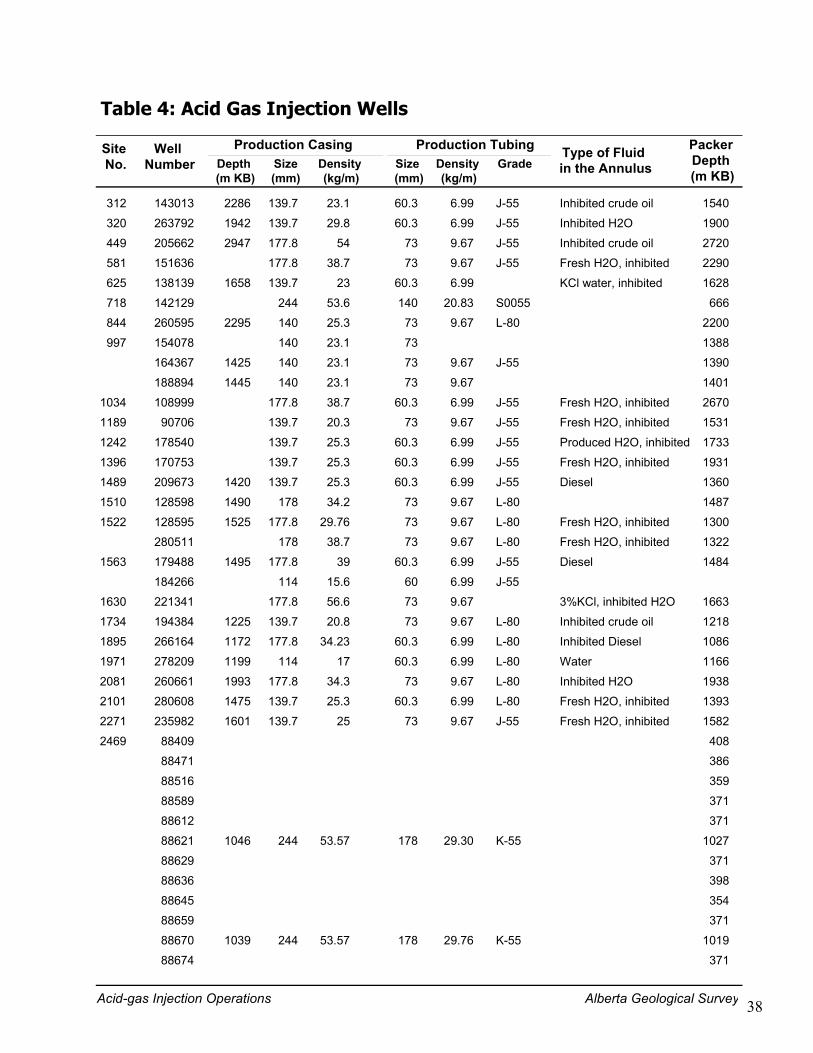
Table 4: Acid Gas Injection Wells
Site No.
Well Number Depth
(m KB)
Production TubingSize(mm)
Production Casing Type of Fluid in the Annulus
Packer Depth (m KB)
Size (mm)
Density (kg/m)
Density (kg/m)
Grade
312 143013 139.7 23.1 60.3 J-556.99 Inhibited crude oil 15402286320 263792 139.7 29.8 60.3 J-556.99 Inhibited H2O 19001942449 205662 177.8 54 73 J-559.67 Inhibited crude oil 27202947581 151636 177.8 38.7 73 J-559.67 Fresh H2O, inhibited 2290625 138139 139.7 23 60.3 6.99 KCl water, inhibited 16281658718 142129 244 53.6 140 S005520.83 666844 260595 140 25.3 73 L-809.67 22002295997 154078 140 23.1 73 1388
164367 140 23.1 73 J-559.67 13901425188894 140 23.1 73 9.67 14011445
1034 108999 177.8 38.7 60.3 J-556.99 Fresh H2O, inhibited 26701189 90706 139.7 20.3 73 J-559.67 Fresh H2O, inhibited 15311242 178540 139.7 25.3 60.3 J-556.99 Produced H2O, inhibited 17331396 170753 139.7 25.3 60.3 J-556.99 Fresh H2O, inhibited 19311489 209673 139.7 25.3 60.3 J-556.99 Diesel 136014201510 128598 178 34.2 73 L-809.67 148714901522 128595 177.8 29.76 73 L-809.67 Fresh H2O, inhibited 13001525
280511 178 38.7 73 L-809.67 Fresh H2O, inhibited 13221563 179488 177.8 39 60.3 J-556.99 Diesel 14841495
184266 114 15.6 60 J-556.991630 221341 177.8 56.6 73 9.67 3%KCl, inhibited H2O 16631734 194384 139.7 20.8 73 L-809.67 Inhibited crude oil 121812251895 266164 177.8 34.23 60.3 L-806.99 Inhibited Diesel 108611721971 278209 114 17 60.3 L-806.99 Water 116611992081 260661 177.8 34.3 73 L-809.67 Inhibited H2O 193819932101 280608 139.7 25.3 60.3 L-806.99 Fresh H2O, inhibited 139314752271 235982 139.7 25 73 J-559.67 Fresh H2O, inhibited 158216012469 88409 408
88471 38688516 35988589 37188612 37188621 244 53.57 178 K-5529.30 1027104688629 37188636 39888645 35488659 37188670 244 53.57 178 K-5529.76 1019103988674 371
Acid-gas Injection Operations Alberta Geological Survey 38

Site No.
Well Number Depth
(m KB)
Production TubingSize(mm)
Production Casing Type of Fluid in the Annulus
Packer Depth (m KB)
Size (mm)
Density (kg/m)
Density (kg/m)
Grade
2469 88686 37188727 244 53.57 178 K-5529.76 968101888731 244 53.57 178 K-5529.76 999105588748 36689961 244 53.57 168 29.80 98893189967 244 53.57 178 K-5529.30 1012107489973 37189997 37190041 37190053 37190070 39990074 39290105 178 29.76 140 J-5520.83 988103490130 37190168 37190196 37190208 37190229 244 53.57 178 K-5529.76 1010103490273 244 53.57 178 K-5529.30 1014102890281 34490297 37190301 37190306 244 53.57 178 K-5529.76 1017109090342 9034290352 31790356 244 178 K-5529.76 1006101090361 244 178 K-5529.76 1020106891440 39991461 244 53.57 178 K-5529.76 1024103791496 3959154491554 244 53.57 178 K-5529.76 1085108791566 244 53.95 140 J-5520.90 1023104291636 40991637 178 29.76 140 J-5520.80 10531076
152071 244 54 178 K-5529.80 10011020162252 244 53.7 178 K-5529.301009
2573 204185 177.8 56 73 J-5514.14 Water 132413442636 290514 139.7 25.3 73 L-809.67 Fresh H2O, inhibited 276829572719 263896 139.7 29.8 60.3 L-806.99 Fresh H2O, inhibited 203021452830 204006 177.8 30 73 L-809.67 Inhibited crude oil 14241500
Acid-gas Injection Operations Alberta Geological Survey 39

Site No.
Well Number Depth
(m KB)
Production TubingSize(mm)
Production Casing Type of Fluid in the Annulus
Packer Depth (m KB)
Size (mm)
Density (kg/m)
Density (kg/m)
Grade
2982 221031 139.7 23.07 73 K-559.67 Inhibited crude oil 15983084 228593 139.7 20 60 J-55 200521243195 202360 177.8 34.2 73 L-809.67 KCl water, inhibited 187919963340 83493 177.8 34 73 J-559.67 117513653465 55392 912
55409 92255412 91555457 91255466 139.7 91755480 139.7 90194555493 177.8 90595155526 89355553 90655591 89155615 89455647 89855649
150266 946150267 950175435 960194314 937
3581 52915 856186679 987
3651 14517 139.7 25.3 73 J-559.67 1445151014519 178 34.2 60 J-556.99 14831546
3720 4444 178 34.23 60 L-806.99 240124953804 263546 140 23.1 60.3 J-556.99 176120103968 161153 177.8 43.2 73 L-809.67 337933354058 5000458 177.8 34.3 89 L-8013.70 14141509
5013792 178 34.2 89 L-8013.80 141614874174 5001572 177.8 43.2 114 L-8018.9027114248 5004038 22214292 5013892 178 38.7 73 L-80 165821054336 5010427 140 23.7 73 L-809.67 157716474343 5010429 178 34.3 73 L-809.67 156816744489 5000496 140 20.8 73 L-809.67 129013244512 5008653 178 43.2 89 L-8013.80 243033074680 5016659 140 25.3 73 2000 series f2.49 928.6935
Acid-gas Injection Operations Alberta Geological Survey 40

Table 5: Pipelines
Site No.
Pipeline Length (m)
Pipe Grade
Pipe OutsideDiameter (mm)
Pipe Wall Thickness (mm)
Max Operating Pressure (kPa)
Max Allowable Stress Level (%)
312 2250 259
320
449 420 316 SS 48.3 3.68 12800 49
581 3480 359 88.9 4.8 13000 33.5
625 500 B 88.9 11.13 13960 23
718
844
997
1034 150 316 SS 60.3 5.54 11380 36
1189 1460 290 88.9 4.78 8280 27
1242 600 304 SS 60.3 5.54 14240 38
1396
1489 3000 290 60.3 4.8 13790 30
1510 5450 359 88.9 4 12400 38
1522 450 359 88.9 4.8 12400 32
810 359 88.9 4 12400 38
1563 190 359 88.9 4 14890 46
4300 359 88.9 4 14890 46
1630 130 Sch 160 60.3 8.74 17250 25
1734 100 316L SS 88.9 5.4 10340 27
1895 1050 290 60.3 3.2 9930 32
1971 13000
2081 316L SS 60.3 16500
2101 800 304 SS 60.3 3.91 10500 48
2271 200 290 114.3 4 12400 61
2469
2573 200 SS 60.3 5.54 9075
2636 650 359 60.3 4.8 10800 19
2719
2830
2982
3084
3195
3340 2200 290 60.3 3.9 7000 19
Acid-gas Injection Operations Alberta Geological Survey 41
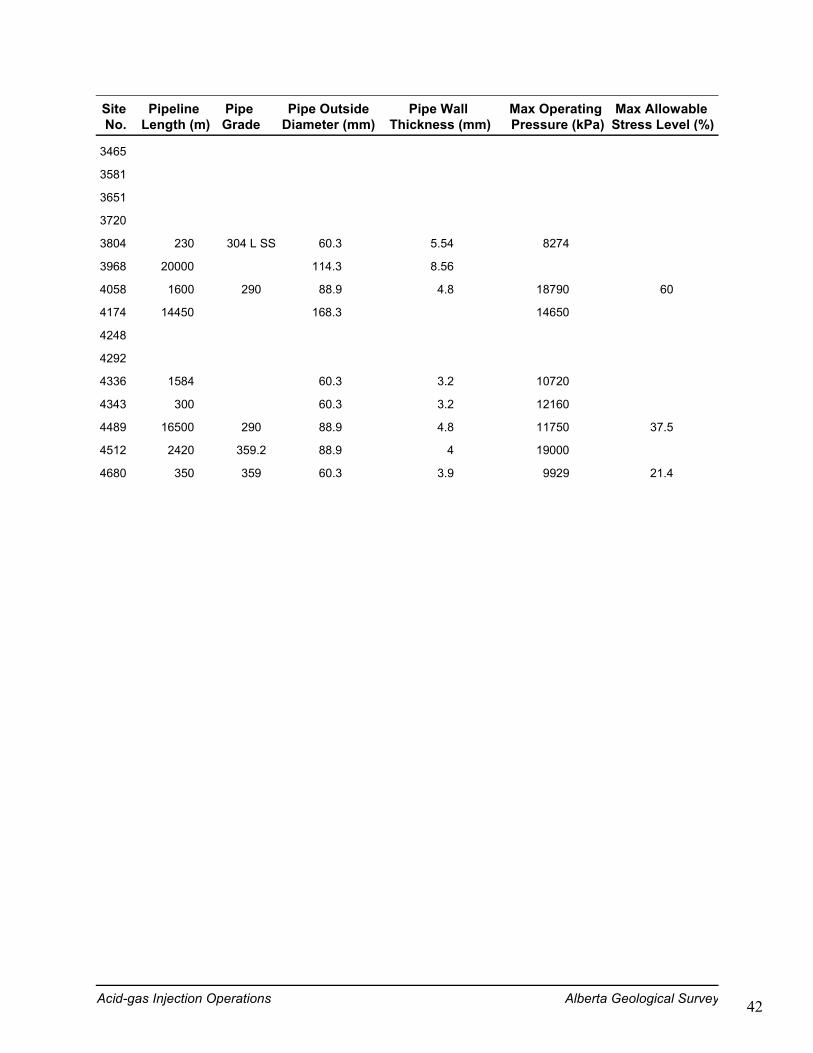
Site No.
Pipeline Length (m)
Pipe Grade
Pipe OutsideDiameter (mm)
Pipe Wall Thickness (mm)
Max Operating Pressure (kPa)
Max Allowable Stress Level (%)
3465
3581
3651
3720
3804 230 304 L SS 60.3 5.54 8274
3968 20000 114.3 8.56
4058 1600 290 88.9 4.8 18790 60
4174 14450 168.3 14650
4248
4292
4336 1584 60.3 3.2 10720
4343 300 60.3 3.2 12160
4489 16500 290 88.9 4.8 11750 37.5
4512 2420 359.2 88.9 4 19000
4680 350 359 60.3 3.9 9929 21.4
Acid-gas Injection Operations Alberta Geological Survey 42

Table 6: Gas Plant Compressors
Plant No.
Manufacturer HP Rating
DriverType
No. of stages
Design Rate (1000 m³/d)
Discharge Pressure (kPa)
Dehydration Method
300 Refrigeration
300 Diesel
400 Ariel 200Diesel 4 30 7250 None
500 Diesel 4 Refrigeration
600 300Diesel 4 5600 None
700
800
900
1000
1100 Knox Western 300Diesel 4 36 4400 TEG
1200 Ariel 50Diesel 4 6820 None
1300 Ariel 250Diesel 4 23 8330 None
1400 Ariel 150Diesel 4 7 8350 Dry Desiccation
1500 560Diesel 4 84 8700 None
1500 Ariel 617Electric 5 105 7550 None
1600 300Diesel 4 5500 Refrigeration
1700 Ariel 350Diesel 4 30 5800 TEG
1800 4 None
1900 150Diesel 4 14 6840 None
2000 4 8000 None
2100 Ariel 250Diesel 4 26 4100 None
2200 5 TEG
2400
2500 Dresser Rand 800Diesel
2600
2700
2800 300Diesel 4 6100 None
2900
3000
3100
3300 200Diesel 4 15 2800 TEG
3400
3500
3600 Ariel 1100Diesel 4 198 8357
Acid-gas Injection Operations Alberta Geological Survey 43

Plant No.
Manufacturer HP Rating
DriverType
No. of stages
Design Rate (1000 m³/d)
Discharge Pressure (kPa)
Dehydration Method
3700 Diesel 103
3800 Energy Industries 250Diesel 4 22 7350 no dehydration
3900 1900Electric 5 169 8275 refrigeration
4000 Ariel 1500Electric 4 106 6700 TEG
4100 Dresser 4000Diesel 4 800 7585 prior dehydration
4200 Ariel Electric 5 50
4300 Gemini 2400Electric 5 422 8936
4400 Ariel 1500Electric 4 106 4450 refrigeration
4500 Ariel 200Diesel 4 15 5500 TEG
4600 Energy Industries 250Diesel 4 7 TEG
Acid-gas Injection Operations Alberta Geological Survey 44

Synthesis Graphs
Acid Gas Injection Operations
in Western Canada
Host Rock Injection Reservoir Type and Lithology Net Pay of Injection Reservoir Range of Porosity of Host Rock Porosity vs. Depth of Host Rock
45

Reservoir Type and Lithology for Acid Gas Injection Operations
Acid-gas Injection Operations Host Rock Alberta Geological Survey
0 4 8 12 16 20 24 28
Reservoir
Aquifer
Number of Acid Gas Sites
Carbonate
Siliciclastic
46

Acid-gas Injection Operations Host Rock Alberta Geological Survey
Net Pay of Injection Reservoir or Aquifer
0
10
20
30
40
50
60
70
80
90
100
312
320
449
581
625
718
844
997
1034
1189
1242
1396
1489
1563
1510
1522
1630
1734
1895
1971
2081
2101
2271
2469
2573
2636
2719
2830
2982
3084
3195
3340
3465
3581
3651
3720
3804
3968
4058
4174
4292
4248
4336
4343
4489
4512
4680
Net
Pay
(m)
Carbonate
Siliciclastic
47

Porosity of Host Rock for Acid Gas Injection Operations
Acid-gas Injection Operations Host Rock Alberta Geological Survey
0
0.05
0.1
0.15
0.2
0.25
0.3
0.35
312
320
449
581
625
718
844
997
1034
1189
1242
1396
1489
1510
1522
1563
1630
1734
1895
1971
2081
2101
2271
2469
2573
2636
2719
2830
2982
3084
3195
3340
3465
3581
3651
3720
3804
3968
4058
4174
4248
4292
4336
4343
4489
4512
4680
Poro
sity
(fra
ctio
n)
Core Plug Porosity
Porosity Range
48

Porosity of Acid Gas Injection Zones
Acid-gas Injection Operations Host Rock Alberta Geological Survey
0
500
1000
1500
2000
2500
3000
35000 0.05 0.1 0.15 0.2 0.25 0.3 0.35
Porosity (fraction)
Dep
th (m
KB
)
Carbonate
Siliciclastic
49

Synthesis Graphs
Acid Gas Injection Operations
in Western Canada
Host Fluids Original Formation Pressure at Injection Zones Formation Temperature of Injection Zones Formation Water Salinity Oil API Gravity in Depleted Oil Reservoirs used
for Injection Specific Gravity in Depleted Gas Reservoir used
for Injection
50

Original Formation Pressure in Acid Gas Injection Zones
Acid-gas Injection Operations Host Fluids Alberta Geological Survey
0
500
1000
1500
2000
2500
3000
35000 5000 10000 15000 20000 25000 30000 35000 40000
Pressure (kPa)
Dep
th (m
KB
)
Hydrostatic pressure assuming fresh water
51

Formation Temperature in Acid Gas Injection Zones
Acid-gas Injection Operations Host Fluids Alberta Geological Survey
0
500
1000
1500
2000
2500
3000
35000 20 40 60 80 100 120 140 160 180 200
Temperature (oC)
Dep
th (m
KB
)
Geothermal gradients
25 °C/km30 °C/km35 °C/km40 °C/km45 °C/km50 °C/km
52

Formation Water Salinity in Acid-Gas Injection Zones
Acid-gas Injection Operations Host Fluids Alberta Geological Survey
0
500
1000
1500
2000
2500
3000
35000 50000 100000 150000 200000 250000 300000 350000
Formation Water Salinity (TDS mg/l)
Dep
th (m
KB
)
53
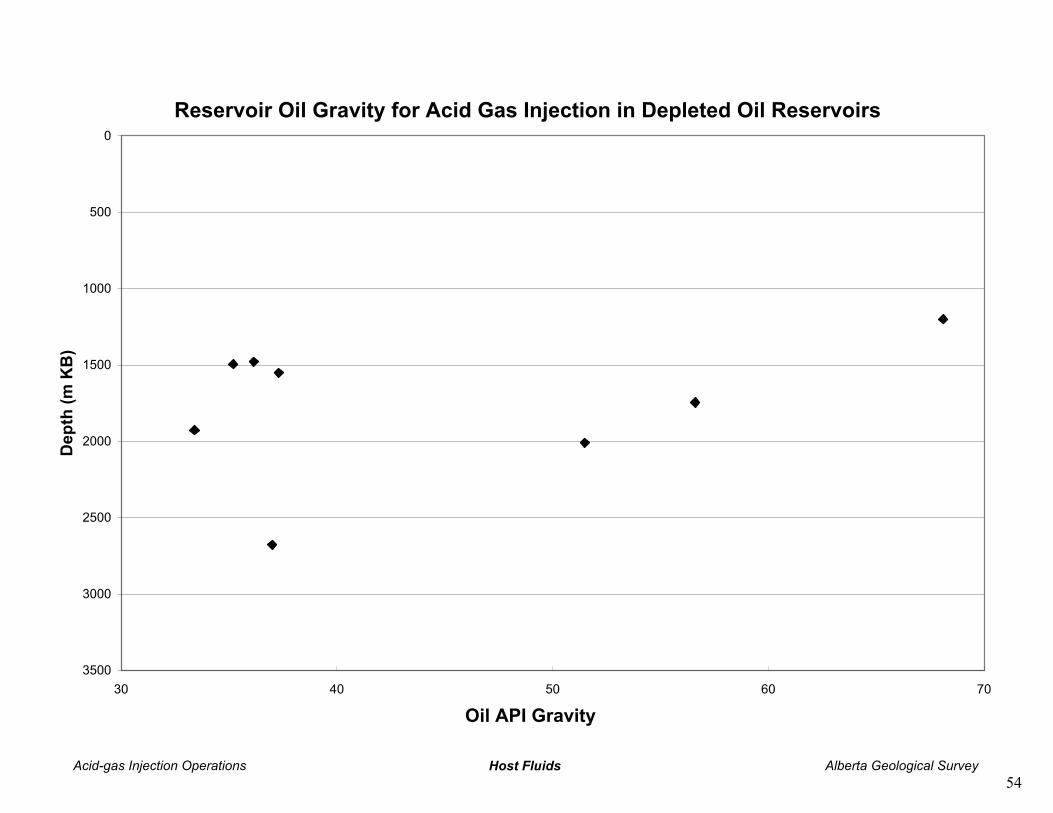
Reservoir Oil Gravity for Acid Gas Injection in Depleted Oil Reservoirs
Acid-gas Injection Operations Host Fluids Alberta Geological Survey
Oil API Gravity
0
500
1000
1500
2000
2500
3000
350030 40 50 60 70
Dep
th (m
KB
)
54

Specific Gravity of Natural Gas in Depleted Gas Reservoirs Used for Acid Gas Injection
Acid-gas Injection Operations Host Fluids Alberta Geological Survey
Gas Specific Gravity
0
500
1000
1500
2000
2500
3000
35000.4 0.5 0.6 0.7 0.8 0.9 1 1.1
Dep
th (m
KB
)
55

Synthesis Graphs
Acid Gas Injection Operations
in Western Canada
Acid Gas Injection Operations
Injection Interval Depths Wellhead and Formation Pressures of Acid Gas
Injection Operations Bottom Hole Injection Pressures vs. Depth Maximum Approved Acid Gas Injection Rate Composition of Injected Acid Gas in Alberta In-situ Pressure, Temperature and Phase
Conditions for the Injected Acid Gas Well Statistics for Injection Sites Pipeline Length
56

Depth of the Injection Zone Interval for Acid Gas Injection Operations
Acid-gas Injection Operations Injection Operations Alberta Geological Survey
0
500
1000
1500
2000
2500
3000
3500
312
320
449
581
625
718
844
997
1034
1189
1242
1396
1489
1563
1510
1522
1630
1734
1895
1971
2081
2101
2271
2469
2573
2636
2719
2830
2982
3084
3195
3340
3465
3581
3651
3720
3804
3968
4058
4174
4292
4248
4336
4343
4489
4512
4680
Dep
th (m
KB
)
Approximate depth of CO2 phase change to supercritical fluid
57

Pressures Associated with Acid Gas Injection Operations
Acid-gas Injection Operations Injection Operations Alberta Geological Survey
0
5000
10000
15000
20000
25000
30000
35000
40000
45000
312
320
449
581
625
718
844
997
1034
1189
1242
1396
1489
1510
1522
1563
1630
1734
1895
1971
2081
2101
2271
2469
2573
2636
2719
2830
2982
3084
3195
3340
3465
3581
3651
3720
3804
3968
4058
4174
4248
4292
4336
4343
4489
4512
4680
Pres
sure
(kPa
)
Maximum Approved Bottom Hole Injection Pressure (BHIP)
Injection Formation Pressure at Startup
Maximum Approved Wellhead Injection Pressure (WHIP)
58

Approved Maximum Bottom Hole Injection Pressure for Acid Gas Injection Operations
Acid-gas Injection Operations Injection Operations Alberta Geological Survey
0
500
1000
1500
2000
2500
3000
35000 5000 10000 15000 20000 25000 30000 35000 40000 45000
Bottom Hole Injection Pressure (kPa)
Dep
th (m
KB
)
59

Maximum Approved Daily Acid Gas Injection Rate for Injection Operations
Acid-gas Injection Operations Injection Operations Alberta Geological Survey
0
100
200
300
400
500
600
700
800
900
1000
312
320
449
581
625
718
844
997
1034
1189
1242
1396
1489
1510
1522
1563
1630
1734
1895
1971
2081
2101
2271
2469
2573
2636
2719
2830
2982
3084
3195
3340
3465
3581
3651
3720
3804
3968
4058
4174
4248
4292
4336
4343
4489
4512
4680
Dai
ly In
ject
ion
Rat
e (1
000
m3 /d
)
Carbonate
Siliciclastic
60

Licensed Composition of the Injected Acid Gas
Acid-gas Injection Operations Injection Operations Alberta Geological Survey
0
0.1
0.2
0.3
0.4
0.5
0.6
0.7
0.8
0.9
1
312
320
449
581
625
718
844
997
1034
1189
1242
1396
1489
1563
1510
1522
1630
1734
1895
1971
2081
2101
2271
2469
2573
2636
2719
2830
2982
3084
3195
3340
3465
3581
3651
3720
3804
3968
4058
4174
4292
4248
4336
4343
4489
4512
4680
Mol
e Fr
actio
n of
Inje
cted
Gas
H2S (mol fraction)
CO2 (mol fraction)
61

Acid-gas Injection Operations Injection Operations Alberta Geological Survey
0
5000
10000
15000
20000
25000
30000
10 20 30 40 50 60 70 80 90 100 110
Temperature (oC)
Pres
sure
(kPa
)
Carbonate Critical Point H2S Vapourization curve of H2S
Siliciclastic Critical Point for CO2 Vapourization curve of CO2
Liquid CO2
Gaseous CO2 Gaseous H2S
Liquid H2S
Supercritical CO2
Supercritical H2 S
In situ P-T and Phase Conditions for Acid Gas Injection Zones, with CO2 and H2S Phase Diagrams
62

Well Statistics around Acid Gas Injection Sites in Alberta
Acid-gas Injection Operations Injection Operations Alberta Geological Survey
0
10
20
30
40
50
60
70
80
312/3
20 449
581
625
718
844
997
1034
1189
1242
1396
1489
1563
/1510
/1522
1630
1734
1895
1971
2081
2101
2271
2469
2573
2636
2719
2830
2982
3084
3195
3340
3465
3581
3651
3720
3804
3968
4058
4174
4248
/4292
4336
/4343
4489
4512
4680
Num
ber o
f Wel
ls a
roun
d th
e In
ject
ion
Site
Total surrounding wells
Abandonned wells
149 wells total
63
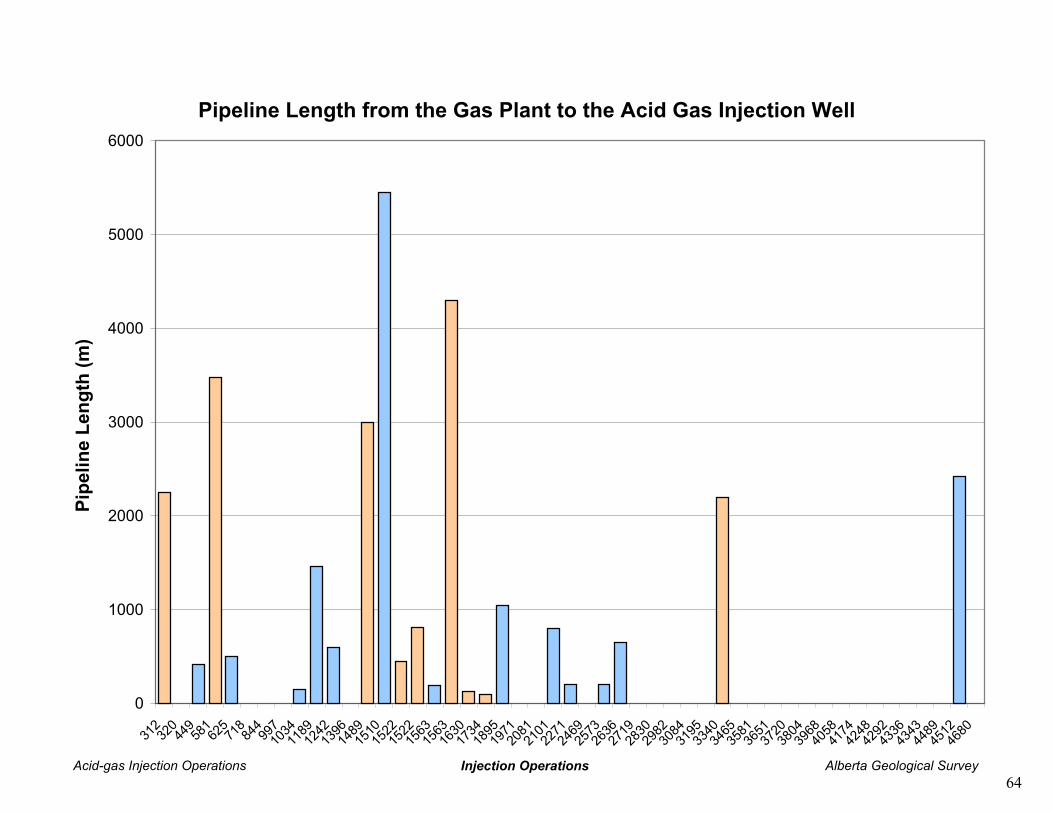
Pipeline Length from the Gas Plant to the Acid Gas Injection Well
Acid-gas Injection Operations Injection Operations Alberta Geological Survey
0
1000
2000
3000
4000
5000
6000
31232
044
958
162
571
884
499
710
3411
8912
4213
9614
8915
1015
2215
2215
6315
6316
3017
3418
9519
7120
8121
0122
7124
6925
7326
3627
1928
3029
8230
8431
9533
4034
6535
8136
5137
2038
0439
6840
5841
7442
4842
9243
3643
4344
8945
1246
80Pi
pelin
e Le
ngth
(m)
64


![ATX-101 (DEOXYCHOLIC ACID) INJECTION ADVISORY …ghk.h-cdn.co/assets/cm/15/11/5500ae2372422_-_ucm436604.pdf · ATX-101 (deoxycholic acid [DCA] injection) is a first-in-class, injectable](https://static.fdocuments.net/doc/165x107/5fde35f6a3f51d515e21d8cc/atx-101-deoxycholic-acid-injection-advisory-ghkh-cdncoassetscm15115500ae2372422-.jpg)