Acid-Base pH Titration Introduction · Acid-Base pH Titration ... Prelab & Report: ... Double click...
14
Appendix B: Example of Traditional Investigation Acid-Base pH Titration Introduction Measurement of pH The hydrogen ion concentration is one of the more important properties of an aqueous solution. The H + concentration affects the solubility of species, the formation of complexes, and the kinetic rate of chemical reactions. From a personal standpoint, the buffer system which regulates the pH of blood is extremely important. Excess acid produces acidosis while excess base causes alkalosis, both very harmful conditions. The H + concentration can be expressed in terms of pH. pH = – log [H + ]. pH may be measured two ways in the lab: by using indicators (which include pH paper) or by using a pH meter/instrument. Note: determining pH is the only instance in which we use the log 10 . This is because we are dealing with powers of 10 of concentrations. Ordinarily, we only use the natural log (ln) in calculations.. pH Meter/Instrument The pH meter/instrument consists of a sensitive meter for measuring small voltages (on the order of millivolts) and a combination electrode/probe. When the electrode is placed in the solution, it forms an electrochemical cell (something like a battery) that has a voltage. The voltage of the cell is dependent on [H + ]: thus, by measuring the voltage, we obtain a measure of [H + ]. Electrodes that can be used with pH meters come in all shapes and sizes, depending on their intended use, but fundamentally they are nearly all the same. One of the electrodes is a reference electrode; while the one that is actually sensitive to H + (aq) is almost always a so-called glass electrode. The wire in the inner compartment of the electrode is in contact with a solution of known and fixed H + (aq) concentration. The wall of the compartment is formed of a special thin glass that is permeable to H + (aq). As a result, the voltage that this electrode, together with a reference electrode, generates when placed in a solution depends on the [H + ] in the solution. This voltage, in turn is translated into a pH reading on the instrument. In lab we will be using a combination electrode which incorporates both the reference and glass electrode into a single unit. During a titration, both the pH and volume of titrant are recorded. A plot of pH versus volume of titrant generates a titration curve (see graph 1 or 2). The actual equivalence point occurs at the mid-point of the sharp rise in the curve. In order to determine this point more accurately, a first derivative plot is prepared (see graph 3). Since a derivative is actually the instantaneous slope at a point, the mid-point will have a break (slope-undefined) because the slope values increase as the curve approaches a vertical line then decreases again after the mid-point region. The “break” point, as determined by intersecting extrapolated lines, is the equivalence point of the titration (graph 3). A second derivative plot is also prepared to more precisely pinpoint the equivalence point—the point where the extrapolated line cuts the x-axis (graph 4). Since the x-axis designates the volume of titrant used, a very exact value for volume of titrant can be obtained. This volume is then used to determine the molar mass of the acid and the K a value. Electronic Supplementary Material (ESI) for Chemistry Education Research and Practice. This journal is © The Royal Society of Chemistry 2016
Transcript of Acid-Base pH Titration Introduction · Acid-Base pH Titration ... Prelab & Report: ... Double click...
Appendix B: Example of Traditional Investigation
Acid-Base pH TitrationIntroductionMeasurement of pHThe hydrogen ion concentration is one of the more important properties of an aqueous solution. The H+ concentration affects the solubility of species, the formation of complexes, and the kinetic rate of chemical reactions. From a personal standpoint, the buffer system which regulates the pH of blood is extremely important. Excess acid produces acidosis while excess base causes alkalosis, both very harmful conditions.
The H+ concentration can be expressed in terms of pH. pH = – log [H+]. pH may be measured two ways in the lab: by using indicators (which include pH paper) or by using a pH meter/instrument. Note: determining pH is the only instance in which we use the log10. This is because we are dealing with powers of 10 of concentrations. Ordinarily, we only use the natural log (ln) in calculations..
pH Meter/InstrumentThe pH meter/instrument consists of a sensitive meter for measuring small voltages (on the order of millivolts) and a combination electrode/probe. When the electrode is placed in the solution, it forms an electrochemical cell (something like a battery) that has a voltage. The voltage of the cell is dependent on [H+]: thus, by measuring the voltage, we obtain a measure of [H+]. Electrodes that can be used with pH meters come in all shapes and sizes, depending on their intended use, but fundamentally they are nearly all the same. One of the electrodes is a reference electrode; while the one that is actually sensitive to H+ (aq) is almost always a so-called glass electrode. The wire in the inner compartment of the electrode is in contact with a solution of known and fixed H+ (aq) concentration. The wall of the compartment is formed of a special thin glass that is permeable to H+ (aq). As a result, the voltage that this electrode, together with a reference electrode, generates when placed in a solution depends on the [H+] in the solution. This voltage, in turn is translated into a pH reading on the instrument. In lab we will be using a combination electrode which incorporates both the reference and glass electrode into a single unit.
During a titration, both the pH and volume of titrant are recorded. A plot of pH versus volume of titrant generates a titration curve (see graph 1 or 2). The actual equivalence point occurs at the mid-point of the sharp rise in the curve. In order to determine this point more accurately, a first derivative plot is prepared (see graph 3). Since a derivative is actually the instantaneous slope at a point, the mid-point will have a break (slope-undefined) because the slope values increase as the curve approaches a vertical line then decreases again after the mid-point region. The “break” point, as determined by intersecting extrapolated lines, is the equivalence point of the titration (graph 3). A second derivative plot is also prepared to more precisely pinpoint the equivalence point—the point where the extrapolated line cuts the x-axis (graph 4). Since the x-axis designates the volume of titrant used, a very exact value for volume of titrant can be obtained. This volume is then used to determine the molar mass of the acid and the Ka value.
Electronic Supplementary Material (ESI) for Chemistry Education Research and Practice.This journal is © The Royal Society of Chemistry 2016
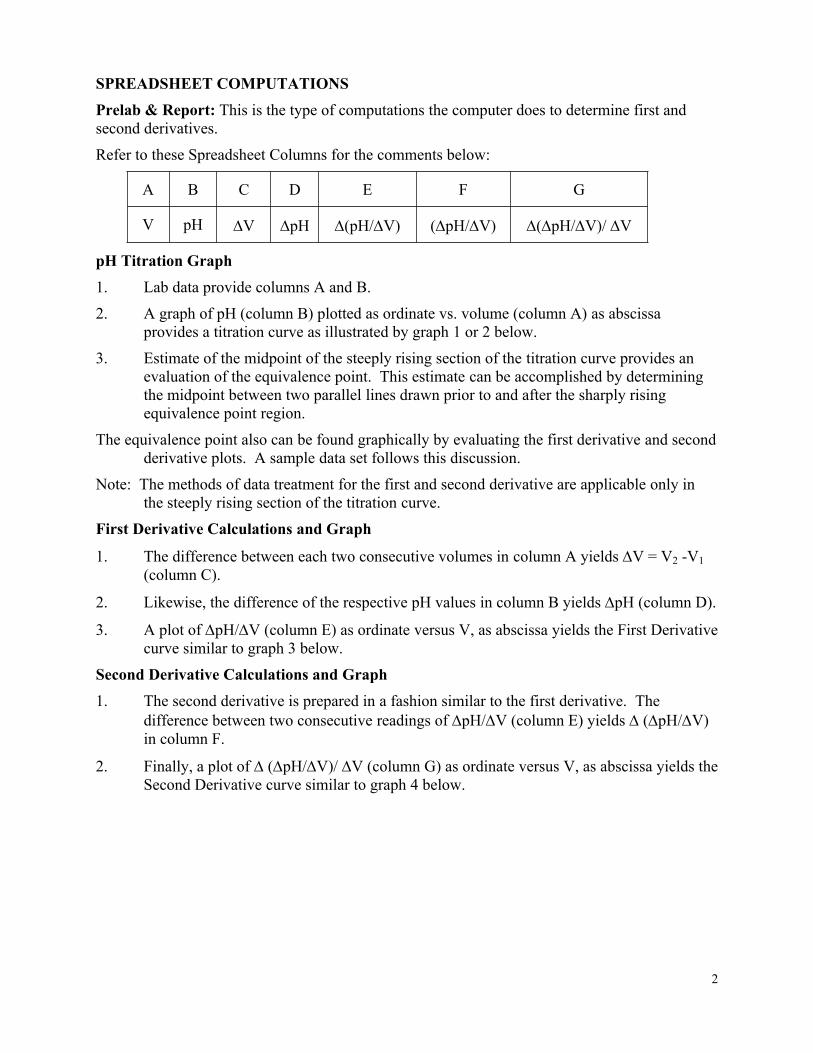
SPREADSHEET COMPUTATIONSPrelab & Report: This is the type of computations the computer does to determine first and second derivatives.
Refer to these Spreadsheet Columns for the comments below:
A B C D E F G
V pH V pH (pH/V) (pH/V) (pH/V)/V
pH Titration Graph1. Lab data provide columns A and B.
2. A graph of pH (column B) plotted as ordinate vs. volume (column A) as abscissa provides a titration curve as illustrated by graph 1 or 2 below.
3. Estimate of the midpoint of the steeply rising section of the titration curve provides an evaluation of the equivalence point. This estimate can be accomplished by determining the midpoint between two parallel lines drawn prior to and after the sharply rising equivalence point region.
The equivalence point also can be found graphically by evaluating the first derivative and second derivative plots. A sample data set follows this discussion.
Note: The methods of data treatment for the first and second derivative are applicable only in the steeply rising section of the titration curve.
First Derivative Calculations and Graph
1. The difference between each two consecutive volumes in column A yields V = V2 -V1 (column C).
2. Likewise, the difference of the respective pH values in column B yields pH (column D).
3. A plot of pH/V (column E) as ordinate versus V, as abscissa yields the First Derivative curve similar to graph 3 below.
Second Derivative Calculations and Graph1. The second derivative is prepared in a fashion similar to the first derivative. The
difference between two consecutive readings of pH/V (column E) yields (pH/V) in column F.
2. Finally, a plot of (pH/V)/V (column G) as ordinate versus V, as abscissa yields the Second Derivative curve similar to graph 4 below.
2

Sample Data: A B .Volume of NaOH, mL pH
49.68 6.40
49.80 6.56
49.88 6.70
49.95 6.81
Treatment of Sample Data:
Graph # 1. Raw Data.
Graph # 2. Raw Data.
3
A B C D E F GV pH V pH pH/V (pH/V) (pH/V)/V
49.6849.8049.8849.95
6.406.566.706.81
0.120.080.07
0.160.140.11
1.331.751.57
0.42-0.18
3.5-2.25

Titration curve for 50.0 mL of an unknown Titration curve for 50.0 mL of anstrength HCl solution titrated with 0.100 M unknown strength HOAc solutionNaOH titrated with 0.100 M NaOH(Strong Acid-Strong Base) (Weak Acid-Strong Base)
4

Graph # 3. First Derivative plot for titration of 50.0 mL of an unknown strength HOAc solution with 0.100 M NaOH. (Refer to Graph # 2.)
Graph # 4. Second Derivative plot for the titration of 50.0 mL of an unknown strength HOAc solution with 0.100 M NaOH. (Refer to graphs # 2 and 3.)
5

6

ACID-BASE pH TITRATIONProcedure for Collecting Data for the pH Titration (IN PARENTESES are steps you should not have to perform-provided the equipment was set up
correctly.)
This experiment involves titration of a known mass of potassium dihydrogen phosphate using a previously standardized NaOH solution. Volume and pH data for titration curves are obtained. Using these data the equivalent weight can be calculated and the Ka value for H2PO4
-.
Computer Set Up1. Make sure the pH probe is connected to DIN 1 on the ULI interface. (Plug in and turn on
the ULI module, the printer, and the computer.)
2. Double click to open the CHM1046 Lab folder then launch the program by double clicking on the Logger Pro icon.
3. If the Setup Interface window is not immediately displayed, select Interface option from under Setup menu. Make sure the ULI interface is turned on (switch to solid dot); then choose P#2USA28X2 from port options. The Interface designation should change from a question mark (?) to ULI Rev. 5.10 (which is the version of ULI used). )
4. Select Open from under File menu and select pH Titration.
5. Obtain two buffers, pH 4 and pH 7. Select Calibrate from under the Experiment menu. In the DIN1 box, pH will be displayed.
6. Remove pH probe from storage solution, rinse with distilled water, and carefully dry. Place the pH probe in the pH 4 buffer. Click the Perform Now calibration button. Once the voltage readings have stabilized (note that the last digit may fluctuate back and forth), record pH of first buffer as 4.00. Rinse and dry probe and place in pH 7 buffer. Repeat procedure and record buffer as 7.00. Then, click OK to complete calibration.
7. Graph axes should range from 1 to 14 for pH (y-axis) and 0 to 50 for volume (x-axis). If range for volume is not correct, click on last value and type in 50 for volume (x).
Titration of Potassium Dihydrogen Phosphate Set Up8. Weigh between 0.35 to 0.45g KH2PO4 to nearest ±0.1 mg into a 400 mL beaker and add
approximately 100 mL distilled water.
9. (a) While one team member continues with set up outlined in steps 3-5, another team member needs to estimate the volume of base required to reach the equivalence point using the measured quantity of KH2PO4 (Molar mass 136.08 g/mole), the stoichiometry of the reaction, and the Molarity of the NaOH. If the base is approximately 0.1M, equivalence should be in 25-35 mL range.
(b) Fewer points need to be taken in the flatter portions of the titration so larger increments of 3-5 mL of NaOH can be added before and after the equivalence point region.
7

(c) To obtain the most accurate data, many data points need to be taken in the region of the equivalence point (when the pH rapidly rises). Thus, as the equivalence point region is approached, smaller and smaller increments should be added - 1 mL, then 0.5 mL, and in the region from 1.5 mL before to 1.5 mL after the equivalence point, increments of 0.10 - 0.20 mL of NaOH solution should be added. [Note: Watch the pH throughout the experiment to make sure that your estimated equivalence point volume was correct. The equivalence point is being approached when the graph begins to turn upward (usually near pH 7 for many weak acids). If the pH is near 7, begin to add smaller and smaller volume increments of NaOH.]
10. Set up a buret filled to the 0.00 mark exactly with standardized NaOH. To avoid splashing and thus loss of solution, carefully slide a magnetic stirring bar into the acid solution in the beaker.
11. Place the beaker on a magnetic stirrer, place the pH probe into the solution, carefully clamp so that the probe will not be hit by the stirring bar, and arrange the buret above the beaker so added base will not splash out of the beaker. You want to minimize splashing as well as addition on added distilled water since these actions will alter the pH results.
12. Turn the magnetic stirrer on low so the stirring bar mixes the solution but does not create a vortex and splash solution out of the beaker. DO NOT TURN ON THE MAGNETIC STIRRER'S LIGHT; this will heat up the solution and change pH values.
Titration of Potassium Dihydrogen Phosphate13. Once all equipment is correctly set up, click COLLECT to begin the program.
14. BEFORE any base has been added, click KEEP and type in 0.00 for the volume in the window provided. Each time the KEEP button is clicked the probe samples the solution and the program records pH.
15. Add increments of base as outlined in step 9. After each addition of base, click KEEP and type in volume read from buret to ±0.01 mL.
16. When all 50.00 mL of base has been added, click STOP in the menu bar and proceed to analysis section of experiment.
Analysis of pH Titration17. Before beginning data analysis, you may want to save your data to the CHM1046 Lab
folder. First click on the Table Window. If any mistake typing in a volume had been made, the error can be corrected at this time by double-clicking on the erroneous value and typing in correct value. After all corrections have been made, select Print Window from under File menu to obtain copy of data for inclusion into report.
18. Click on Graph Window and choose Examine from under the Analyze menu.
Note: A small window in the upper left corner of the graph will appear. This window indicates the pH and Volume data point that the cursor is currently on. If you do not want to use this to help you select data region, you can close by clicking on the small box in the upper right hand corner of the window at any time.
8

19. In the first graph of pH vs. Volume, there are 3 regions. Select the first region of analysis, before the steep rise in pH, by clicking and dragging the mouse along the curve. The region selected is designated by two vertical lines || indicating the beginning and ending points. Click on the R= button (meaning regression) in the menu bar or alternately you can select Linear fit from under the Analyze menu. The data will be displayed in the following format showing appropriate values for the slope (m) and y-intercept (b).
y = mx + bm: 0.11 b: 12.35 (these are just example values)Cor = 0.98
20. Record the equation in your notebook in Data Table for pH vs. Volume in the following format.
pH = 0.11V + 12.35
• Note 1: You should move the equation window above the line by clicking on the black bar at the top of the window and holding down the mouse as you move the window.
• Note 2: If you do not like the region select, close the data window by clicking on the small box in the upper right corner; then repeat the procedure.
• Note 3: The Cor, an abbreviation for correlation coefficient, should be close to ±1 (sign depends on whether slope is + or –.) The correlation coefficient indicates how close your data fits a straight line.
21. Now choose the second region of analysis, where the pH is rapidly changing, and repeat the procedure. Move the data window to a convenient location to the right or left of the line. Record second equation in data table inserting the appropriate slope and y-intercept values. Finally repeat the procedure a third time for the bottom equation
22. Repeat the procedure for the third region of analysis before the rapid pH rise and record the equation in data table.
23. To print graph for “pH vs. Volume,” click anywhere on graph to clear the vertical bar; then select Print Window from under the File menu.
Note: You will have to write in the correct labels for the y-axis (pH) since y-axis labels do not print out correctly.
For a guide, a made-up set of data with their associated equations are shown to the right of each table. This data was imported into Graphical Analysis for analysis.
9

10

Include Table in Notebook: pH vs Volume:
Position of Lines
Equation in slope-intercept form For example, the data from above case would be:
Top line pH = 0.0212(Vol) + 10.7
Mid line pH = 8.91(Vol) – 1.75
Bottom line pH = 0.0110(Vol) + 4.41
24. To analyze the 1st Derivative, click on the y-axis title (pH). Deselect pH by clicking on check in box and select the first derivative (dpH/dV). Click OK.
25. Follow same procedure as above for left and right regions of graph. Record equations in 1st Derivative Data Table for ∆pH/∆V vs. V. Print 1st Derivative graph and label y-axis.
Note: Since it might be difficult to determine whether you have obtained a good pair of equations, focus in on the area of interest on the X-axis-expand this area until you get good resolution. The equation on the left should have a “large” negative value. The equation on the right should have a “large” positive value. Look at the graph shown below.
11

Include Table in Notebook: 1st Derivative (pH/V vs V)
Position of Lines
Equation in slope-intercept form For example, the data from above case would be:
Left line FD = 53.6(Vol) –1.09E3
Right line FD = -147(Vol) + 3.06E3
26. To analyze the 2nd Derivative, click on the y-axis title (dpH/dV). Deselect; then select the second derivative (d[dpH/dV]dV). Click OK.
27. The region to analyze is where the graph crosses the x-axis. Select the data points forming the line that crosses the x-axis. Record equation in 2nd Derivative Data Table for ∆(∆pH/∆V)/∆V vs. V. Print 2nd Derivative graph and label y-axis.
Note: Again, it might be difficult to "know" whether one has chosen a "good" equation. Again, expand the X-axis. The "y-intercept" for this equation needs to be either a very large positive or a very large negative number.
12
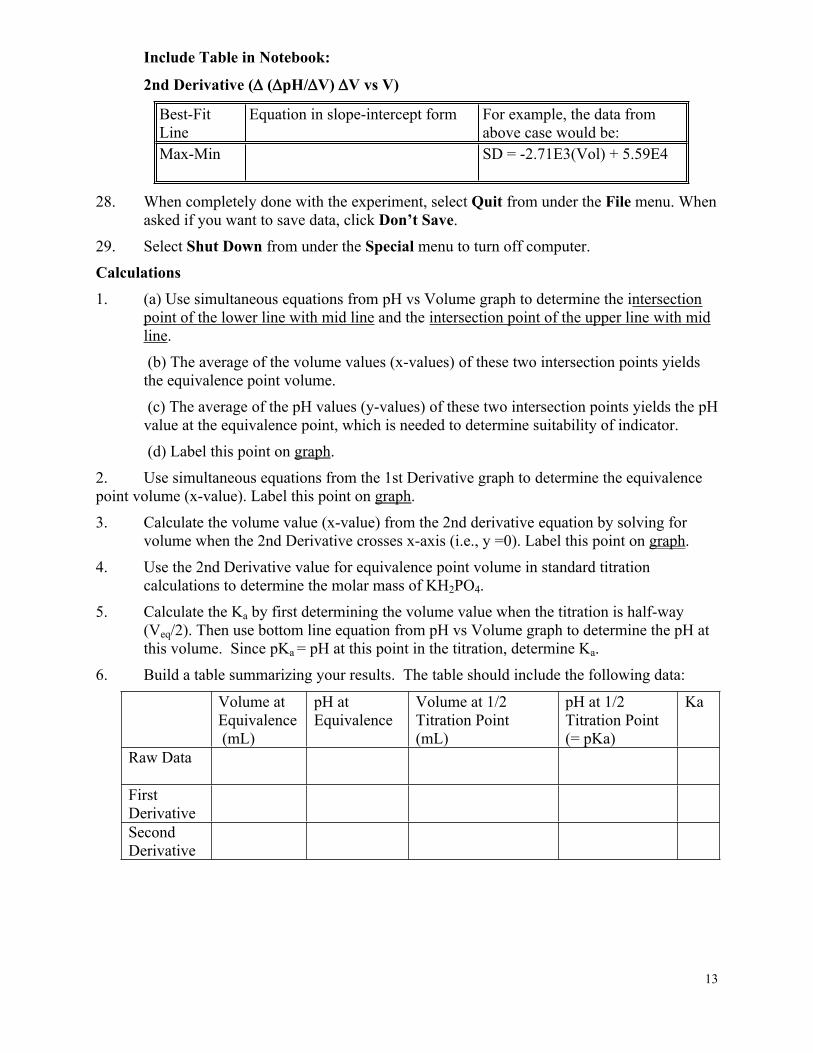
Include Table in Notebook:
2nd Derivative ( (pH/V)V vs V)
Best-Fit Line
Equation in slope-intercept form For example, the data from above case would be:
Max-Min SD = -2.71E3(Vol) + 5.59E4
28. When completely done with the experiment, select Quit from under the File menu. When asked if you want to save data, click Don’t Save.
29. Select Shut Down from under the Special menu to turn off computer.
Calculations1. (a) Use simultaneous equations from pH vs Volume graph to determine the intersection
point of the lower line with mid line and the intersection point of the upper line with mid line.
(b) The average of the volume values (x-values) of these two intersection points yields the equivalence point volume.
(c) The average of the pH values (y-values) of these two intersection points yields the pH value at the equivalence point, which is needed to determine suitability of indicator.
(d) Label this point on graph.
2. Use simultaneous equations from the 1st Derivative graph to determine the equivalence point volume (x-value). Label this point on graph.
3. Calculate the volume value (x-value) from the 2nd derivative equation by solving for volume when the 2nd Derivative crosses x-axis (i.e., y =0). Label this point on graph.
4. Use the 2nd Derivative value for equivalence point volume in standard titration calculations to determine the molar mass of KH2PO4.
5. Calculate the Ka by first determining the volume value when the titration is half-way (Veq/2). Then use bottom line equation from pH vs Volume graph to determine the pH at this volume. Since pKa = pH at this point in the titration, determine Ka.
6. Build a table summarizing your results. The table should include the following data:
Volume at Equivalence (mL)
pH at Equivalence
Volume at 1/2 Titration Point(mL)
pH at 1/2 Titration Point(= pKa)
Ka
Raw Data
First DerivativeSecond Derivative
13

Acid-Base pH TitrationFormal Report Outline1. Name Title and Date (name(s) of partners)2. Purpose3. Theory including (as a minimum):
a. pH measurementb. titration theoryc. indicator theoryd. equivalence vs endpoints,e. graphical analysis - pH titration, first and second derivative graphs.
4. Procedure including:a. description of the standardization technique employed.b. diagram of experimental set-up.c. changes to procedure.
5. Data (Be sure to label or title everything).a. mass of acid used and Molarity of NaOH.b. the three graphs all with proper name, date and experiment title c. simultaneous equations (well-labeled!)d. Include a table for the three sets of graphs (raw data, 1st derivative and 2nd
derivative) that includes the following data: volume at equivalence, pH at equivalence, volume at half titration, pH at half titration, pKa and Ka obtained (see above).
6. Calculations (Be sure to label or title everything)a. Graph 1 - pH titration curve- calculations using simultaneous equations, detn. volume
at equivalence. b. Graph 2 - 1st Derivative - calc. with simultaneous equations, detn. volume at
equivalence pointc. Graph 3 - 2nd Derivative - Set y = 0, solve for x, volume at equivalence point.d. For each, determine the equivalence pH by plugging in the equivalence volume into
the mid line of the pH versus Volume (raw) data.e. Determine the half-titration volume for each data setf. Determine the half titration pH by plugging in the half titration volume into the
bottom line of the pH vs Volume (raw) data.g. Calculate the Ka of the acid. h. When the titration is halfway [HPO4 2– ] = [H2PO4 –]; therefore, one has K = [H3O+].
When one determines the pH at the half titration volume, one has pH = pKa. One can easily compute the [H3O+] which will yield the Ka. Compare the experimental value obtained in this experiment to the Ka for KH2PO4 from your text.
i. mw of acid. (Remember: it is monoprotic.)j. % error of MW from the theoretical molecular weight given.
7. Discussiona. Compare the values for the equivalence point volume obtained from the three graphs.
Which value is most accurate? How good is the precision between the three values?b. Compare the experimental Ka to the text Ka. Explain any differences.c. Discuss suitability of phenolphthalein as an indicator in this titration.d. Error analysis.
14