ACIAR Project annual report · Web viewThe project will develop relations with smallholders, larger...
31
Trip report #1 project Coffee green scales in Papua New Guinea: highland Arabica coffee and yield loss project number ASEM/2010/051 period of report October 2011 date due December 2011 date submitted December 2011 prepared by Alex J Brook, CABI. co-authors/ contributors/ collaborators Dr Wendy Shaw, UNSW; Dr Mark Kenny, CIC; Mr Ingu Bofeng, CIC; Dr Sean Murphy, CABI. approved by
Transcript of ACIAR Project annual report · Web viewThe project will develop relations with smallholders, larger...

Trip report #1project Coffee green scales in Papua New
Guinea: highland Arabica coffee and yield loss
project number ASEM/2010/051
period of report October 2011
date due December 2011
date submitted December 2011
prepared by Alex J Brook, CABI.
co-authors/ contributors/ collaborators
Dr Wendy Shaw, UNSW; Dr Mark Kenny, CIC; Mr Ingu Bofeng, CIC; Dr Sean Murphy, CABI.
approved by

Trip report 1: Coffee green scales in Papua New Guinea: highland Arabica coffee and yield loss
Contents
Contents ii
1 Summary 3
2 Background 4
3 Purpose of travel, destinations and activities 5
4 Trip activities 64.1 Goroka meetings and field trips 6
4.1.1 Project objectives and activities 6
4.1.2 Field trips in surrounding area 9
4.2 Aiyura meetings and field work / trips 11
4.2.1 Meetings with project staff 11
4.2.2 Field work Aiyura and surrounding area 11
4.3 Future trips 17
5 IP, variations to plans, budget etc. 185.1 Intellectual property 18
5.2 Variations to future activities 18
5.3 Variations to personnel 18
5.4 Problems and opportunities 18
5.5 Budget 19
6 Action points and recommendations 20
7 References 22
8 Appendices 23
Page ii

Trip report 1: Coffee green scales in Papua New Guinea: highland Arabica coffee and yield loss
1 SummaryThe purpose of the trip to Papua New Guinea was to meet and discuss the ongoing project. The project team convened at Goroka, Eastern Highlands Province for meetings and field trips. Visits to processors were also conducted and potential useful links identified. Part of the team then moved to Aiyura and conducted field trials to test methods of assessing in-situ yield. The methods were tested and the best identified along with recommendations for a sampling protocol which are being used in the field.
There were no issues of concern with regards to: Intellectual Property; budget or staffing. However, there were problems with tribal fighting in the Kainantu area, and there are likely to be variations to future activities with the pending PNG elections in 2012.
Priority action points from the trip were: 1) conduct surveys of cgs infestations on a selection of smallholder farms within the Eastern Highlands Province; 2) conduct interviews of smallholders to determine both their views of cgs and yield loss, and farmer perceptions / estimates of farm costs and income; 3) Establish controlled research station experiments to determine yield loss; 4) survey and interview holders of larger farms (including plantations) and processors to gather historical information on cgs and yield and yield loss.
Page 3
Trip report 1: Coffee green scales in Papua New Guinea: highland Arabica coffee and yield loss
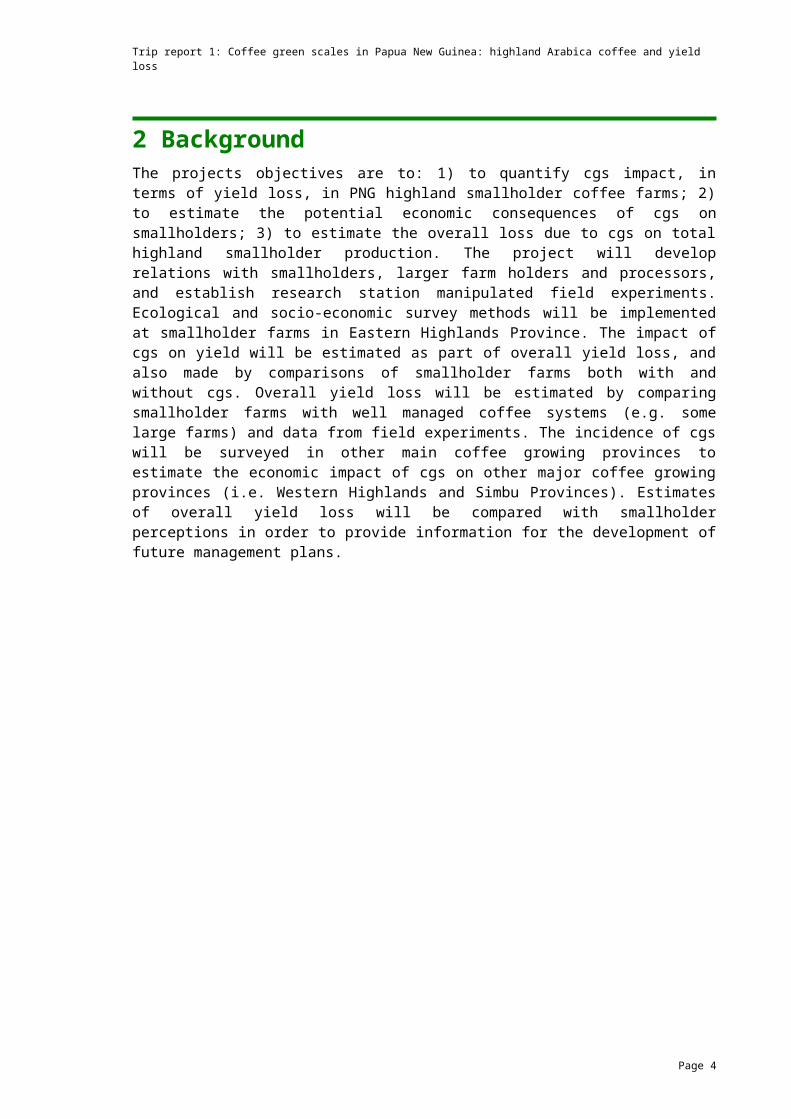
2 BackgroundThe projects objectives are to: 1) to quantify cgs impact, in terms of yield loss, in PNG highland smallholder coffee farms; 2) to estimate the potential economic consequences of cgs on smallholders; 3) to estimate the overall loss due to cgs on total highland smallholder production. The project will develop relations with smallholders, larger farm holders and processors, and establish research station manipulated field experiments. Ecological and socio-economic survey methods will be implemented at smallholder farms in Eastern Highlands Province. The impact of cgs on yield will be estimated as part of overall yield loss, and also made by comparisons of smallholder farms both with and without cgs. Overall yield loss will be estimated by comparing smallholder farms with well managed coffee systems (e.g. some large farms) and data from field experiments. The incidence of cgs will be surveyed in other main coffee growing provinces to estimate the economic impact of cgs on other major coffee growing provinces (i.e. Western Highlands and Simbu Provinces). Estimates of overall yield loss will be compared with smallholder perceptions in order to provide information for the development of future management plans.
Page 4

Trip report 1: Coffee green scales in Papua New Guinea: highland Arabica coffee and yield loss
3 Purpose of travel, destinations and activitiesAll air travel was undertaken using standard airline economy class flights. The purpose of the trip to Papua New Guinea was to meet and discuss the ongoing project in order to achieve the Objectives set out in the SRA proposal (ASEM/2010/051). The project team convened at Goroka, Eastern Highlands Province for meetings and field trips. Following this, the team moved to the CIC Research Station at Aiyura, EHP (see table below for details).
Trip activities, dates, attendees and locationsNo. Trip activity Date Attendees Location1 Meetings: project
objectives & activities.3rd – 5th October 2011
Alex Brook CABI; Dr Wendy Shaw UNSW; Dr Mark Kenny CIC
Goroka, EHP
2 Field trip to visit processors: build links with local processors.
6th – 7th October 2011
Alex Brook, CABI; Dr Wendy Shaw, UNSW; Dr Mark Kenny, CIC
Goroka, EHP & surrounding area
3 PNG - Australia 7th October Dr Wendy Shaw, UNSW
4 Meeting with local processors.
10th October 2011
Alex Brook CABI; Local Processors.
Goroka, EHP & surrounding area
5 Meetings with CIC staff. 11th – 12th October 2011
Alex Brook, CABI; Mr Ingu Bofeng CIC; Ms Susan May Inu, CIC
Aiyura, EHP
6 Field work at CIC Aiyura. 13th – 17th October 2011
Alex Brook CABI; Mr Ingu Bofeng, Mr Arima Fumo, Mr Boro Asiota, Mr Marvin Pasawa.
Aiyura & surrounding area, EHP
7 Field trips & field work in EHP.
17th – 19th October 2011
Alex Brook CABI; Mr Ingu Bofeng, Mr Arima Fumo, Mr Boro Asiota, Mr Marvin Pasawa.
Asuro, EHP
8 PNG - UK 20th October Alex Brook, CABI.
Page 5

Trip report 1: Coffee green scales in Papua New Guinea: highland Arabica coffee and yield loss
4 Trip activitiesThree main activities were undertaken on the trip to EHP, Papua New Guinea, these were: 1) meetings to discuss the objectives and activities undertaken to achieve the project objectives; 2) field trips to meet and discuss building links with processors in EHP; and 3) field work conducted in EHP to assess and train CIC staff in assessing and estimating in-situ cherry production. These are discussed in detail in the following section.
As a result of continued unrest in the Kainantu area, near the CIC Aiyura research station, some planned field work was not possible. However, contingency plans were discussed and alternatives were found (see section 9 problems and opportunities).
4.1 Goroka meetings and field tripsThe initial plan was to meet in Goroka on Monday 3rd October to 7th October and discuss project progress and activities. In attendance were to be: Mr Alex Brook (CABI); Dr Wendy Shaw (UNSW); Dr Mark Kenny (GM, CIC); Mr Ingu Bofeng (CIC), and Miss Susan May Inu (CIC) at CIC Goroka to. However, due to the unrest near Aiyura only Dr Kenny from CIC was able to attend (see section 9 Problems and opportunities).
Discussion topics included: 1) Project Background; 2) Aims, Objectives; 3) Assumptions; 4) Project Plan & Timeline; 5) staffing, and budget; 6) Risks to the project; 7) Project communication - meeting schedule, reports, etc.; 8) Summary - open issues and things to takeaway and think about. The methods being used were also discussed, and also ways to identify processors and smallholders suitable for the project.
On 7th October, Dr Wendy Shaw returned to UNSW, Australia. Mr Alex Brook was to travel to Aiyura to setup and work with Mr Ingu Bofeng on various aspects of ecological assessments, field trials and methods until 20th October. However, due to tribal fighting this was delayed to 10th October.
4.1.1 Project objectives and activitiesTribal fighting in the Kainantu area halted all immediate travel to Aiyura. This change of arrangement for the meeting and implications for future work were discussed in order to adapt to the unpredictability around Aiyura. This became the first topic of our meeting and much of the discussions referred to both Eastern and Western Highlands Provinces, with WHP being the contingency plan. However, Dr Kenny’s opinion was that it was still possible for the project team to use EHP but focussing on the Goroka area, thus avoiding Kainantu. If it did become difficult in Aiyura then the CIC sub-research station at Mt Hagen is a possible alternative for field trials / testing ecological survey methods.
A presentation describing how our approach to estimate yield loss utilises input from multiple approaches (e.g. see Figure 1). The top far left shows smallholders with varying degrees of cgs, and bottom controlled experiments and larger growers. Information is captured by various methods e.g. records from processors, socio-economic surveys and ecological surveys. These all feed into an estimate of yield loss in EHP. The incidence will then be measured in other provinces and with information from EHP, yield loss estimates will be determined for other provinces.
Page 6

Trip report 1: Coffee green scales in Papua New Guinea: highland Arabica coffee and yield loss
Figure 1: Part of the presentation showing how yield data will be captured from the multiple approaches in the activities. From left: smallholder, controlled experiments, larger growers; methods or points where data is captured; estimates in EHP; Estimates in other Provinces.
Objective 1: To quantify cgs impact, in terms of yield loss, in highland smallholder coffee farms.Where to capture data from farmers:
For WHP, we have baseline data on farmers from ASEM/2004/041 but unlike EHP we have no fine detailed follow-up data i.e. case studies. This would need to be captured this if this was to be used as a contingency. Dr Kenny mentioned that CIC previously employed ‘service providers’, who are local people from farming communities. Service providers can be utilised for, for example, checking cherry weights before roadside buyers do so which provides a ‘filter’ link in the commodity chain.
Form the contingency discussions it became clear that it was a real possibility of engaging with Dr Kenny’s community in the Wagi Valley, WHP. There are a range of small holders (circa 300) with up to 500 trees on each farm, with varying degrees of cgs infestation. Dr Kenny has no cgs, but he knows many with a broad range of infestations. This of course is not EHP but was thought to be a useful as a contingency plan to capture data if EHP proved to be too dangerous. However, as the situation appears to have settled down then EHP will be used as planned. The farms in Dr Kenny’s community can be used in Objective 3 (Activity 6) which is a first step in identifying farmers to estimate cgs in other provinces.
Potential processors were then identified and contacted in and around Goroka area, which included wet and / or dry factories. The team then produced a ‘letter of introduction’ with a brief project description to hand to managers as we visited those on the shortlist. Many were forthcoming with views and were positive to the work, although some were unable to help (see 4.1.2). For the smallholders Ms Susan May Inu has a detailed list of farms and
Page 7

Trip report 1: Coffee green scales in Papua New Guinea: highland Arabica coffee and yield loss
farmers who participated in previous project which will be used. In addition it would be useful to contact Dr George Curry (ACIAR Farming Systems Project) as he may also have useful information.
CGS yield loss and surveys
It is known from farmer perceptions that the loss in EHP due to cgs is estimated at circa 50% which is the average of a very rough and broad estimate. This project aims to narrow down the current estimates giving a more accurate picture but never the less it will be “estimates” rather than “pin-point”.
Controlled field trials in experimental blocks will be set up at Aiyura to determine graduated impacts (from minor to major infestation) of cgs and coffee yield. The nature of the relationship will then be understood e.g. see hypothetical graph, Figure 2 below. However, since the appointment of a new farm manager, and despite intensive searches throughout the cgs Aiyura research station, only limited cgs numbers of infested trees could be found. The new farm manager is very proud of his “healthy” trees. There are in the vicinity to Aiyura a number of farmers currently involved in other CIC projects that do have cgs which can be utilised for this aspect of research.
Figure 2: Possible cgs - yield loss relationship. Solid grey line indicates no impact on yield loss until a threshold; solid black line indicates linear relationship; dashed grey line indicates immediate impact.
0
20
40
60
80
100
0 20 40 60 80 100
Yiel
d
CGS % Infestation
Hypothetical CGS - Yield relationship
Ecological surveys were scheduled to start in the fourth quarter and to continue over a nine month growing season to peak harvest. It was pointed out that this would be regardless of non-stop growing that now occurs due to climate change. It was also decided as a working-plan, that ecological surveying to be carried out 3 to 4 times per year as stated in the SRA, i.e. first survey in the fourth quarter of 2011; second in the first quarter of 2012; and third in the second / third quarters of 2012 when the growing season reaches peak production. The first survey of next growing season would then be in the last quarter of 2012 and following this there will be two more surveys in 2013. A minimum of 20 smallholder farms without cgs and 40 with varying degrees of cgs infestations will probably be required to give a representative and robust sample. The methods to be used in these surveys are discussed in section 4.2.
It was also noted that other factors such as variety and other disease would need to be recorded during survey work. Typical varieties include: Blue Mountain (now ‘Typica’ – most common around Goroka), Arusha and Mondonova.
Page 8

Trip report 1: Coffee green scales in Papua New Guinea: highland Arabica coffee and yield loss
Communications:CIC mail server is unreliable and at present full to capacity, with no immediate plan to rectify. However, since the appointment of Dr Kenny as GM, he had secured reliable satellite internet connection with assistance from SIL. Five additional methods to CIC email were also identified:
1. Project staff to use g-mail (or similar web-based) accounts for email
2. Dropbox will be set up for document and data sharing
3. Use of telephone when all else fails (buy cheap phone cards for international calls), or
4. Skype, or
5. Post or Fax
To reduce file size and provide details for annual reports in the correct format, the ACIAR annual report template will be sent out unformatted as a word file, to key project members i.e. Alex, Wendy, Mark & Tom or Ingu & Susan.
Logistics: CIC vehicles are old but CIC has plans to replace them.
There are no anticipated constraints on CIC staffing.
DataDatabase of previous project work especially all socio-economic raw data to be forwarded on a CD/DVD for Wendy and Alex. Much of this data will assist in providing additional context for the current project. Dr Kenny said that Susan will do this.
All data is to be shared – see communications above and “dropbox”.
ConclusionsThe use WHP smallholder farmer data was discussed because of the efficiency of the processors in keeping data but was later abandoned due to good contacts and data being available around Goroka, Bena, Asuro and Lufa (& Marawaka?). These are easily accessed, away from Kainantu and CIC has previously surveyed farms at these locations. This also minimises risks to CIC staff particularly if they were to survey around Kainantu.
4.1.2 Field trips in surrounding areaA field trip was conducted over several days to talk to local processors and some larger growers, these included:
Sihereni Coffee Project
Type = wet mill; David Oromarie GM (not present).
This was a plantation but does not use fertiliser or other chemicals – essentially organic. The trees were circa 50 years old; using ‘recycled’ trees. Records on productivity are kept but no records of pest infestations such as cgs are kept.
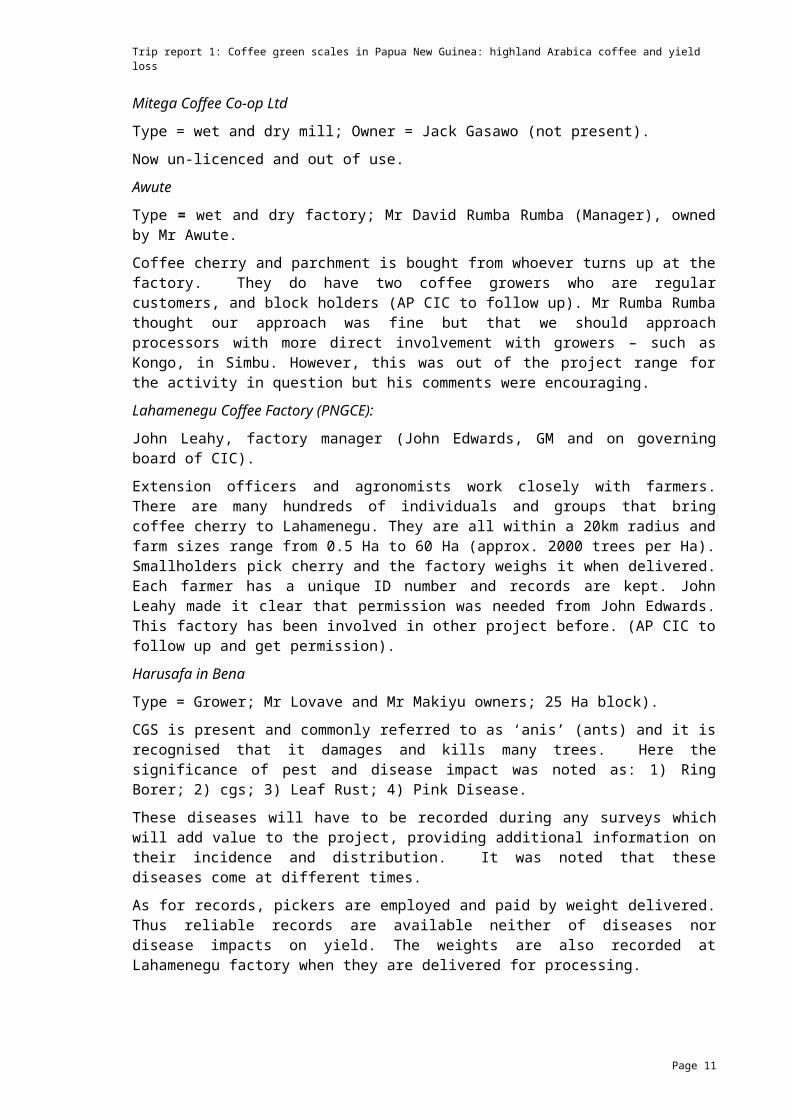
Mitega Coffee Co-op Ltd
Type = wet and dry mill; Owner = Jack Gasawo (not present).
Now un-licenced and out of use.
Awute
Type = wet and dry factory; Mr David Rumba Rumba (Manager), owned by Mr Awute.
Coffee cherry and parchment is bought from whoever turns up at the factory. They do have two coffee growers who are regular customers, and block holders (AP CIC to follow
Page 9

Trip report 1: Coffee green scales in Papua New Guinea: highland Arabica coffee and yield loss
up). Mr Rumba Rumba thought our approach was fine but that we should approach processors with more direct involvement with growers – such as Kongo, in Simbu. However, this was out of the project range for the activity in question but his comments were encouraging.
Lahamenegu Coffee Factory (PNGCE):
John Leahy, factory manager (John Edwards, GM and on governing board of CIC).
Extension officers and agronomists work closely with farmers. There are many hundreds of individuals and groups that bring coffee cherry to Lahamenegu. They are all within a 20km radius and farm sizes range from 0.5 Ha to 60 Ha (approx. 2000 trees per Ha). Smallholders pick cherry and the factory weighs it when delivered. Each farmer has a unique ID number and records are kept. John Leahy made it clear that permission was needed from John Edwards. This factory has been involved in other project before. (AP CIC to follow up and get permission).
Harusafa in Bena
Type = Grower; Mr Lovave and Mr Makiyu owners; 25 Ha block).
CGS is present and commonly referred to as ‘anis’ (ants) and it is recognised that it damages and kills many trees. Here the significance of pest and disease impact was noted as: 1) Ring Borer; 2) cgs; 3) Leaf Rust; 4) Pink Disease.
These diseases will have to be recorded during any surveys which will add value to the project, providing additional information on their incidence and distribution. It was noted that these diseases come at different times.
As for records, pickers are employed and paid by weight delivered. Thus reliable records are available neither of diseases nor disease impacts on yield. The weights are also recorded at Lahamenegu factory when they are delivered for processing.
Nowek Ltd – Kamaliki,
Type = wet and dry processing; Mr Terry Shelly, managing director / owner.
Unfortunately there will be no links for our project here as the supply is unreliable. Mr Shelly claimed that the biggest problem with yield was the unwillingness of growers to grow; loss of cherry loyalty to certain factories; generational disinterest; access to roads and transport was still a problem; and although there was some air freighting it was too expensive. He estimated that PNG could get farmers to produce 4-5 million 60kg bags – which would require 120 million trees in total. However, 80% of current trees need replanting as they are too old.
ConclusionsEastern Highland processors fall into two categories when dealing with smallholders, those that do have strong links and those that do not. For those that do have strong links (e.g. Lahamenegu) there are records throughout the commodity chain. Records exist from the farm to the processor and beyond, which was found to be the case in Western Highlands Province in 2010. These records include annual productivity from smallholders and thus yield.
Smallholder, and some larger growers, knowledge and perception of cgs remain limited in terms of yield, and estimates vary widely, if at all. This was amplified by the visit to Harusafa, which corroborated the results from the previous study (ASEM/2004/047), that farmers do not really know how much coffee is lost to cgs. To alleviate this gap in the data, one option is to triangulate and cross-tabulate farm yields overall (as delivered to processor gate, and recorded) with annual insect infestation data from ecological studies. The second approach is to only revisit growers who participated in case studies (Lufa, Bena etc.) and find out if they have kept records, and what the records now suggest. This is not definitive data but it will possibly assist in more accurate prediction. Surveying and
Page 10
Trip report 1: Coffee green scales in Papua New Guinea: highland Arabica coffee and yield loss
interviewing elsewhere, with farmers who have not been through the previous research project, will probably not render new data about grower perceptions of yield, other than; don’t know, or wide variations, which we already know.
4.2 Aiyura meetings and field work / trips
4.2.1 Meetings with project staffMeetings were held with CIC staff who were unable to attend the Goroka meeting due the travel ban to brief them on the previous meetings.
4.2.2 Field work Aiyura and surrounding areaIn-situ cherry estimates will be important in the monitoring of cgs and estimating potential yield, and is a major part of the project in Objective 1 Activity 1. Such cherry production estimates are published in the scientific literature, and have been widely used from Africa to South America, for both forecasting production and agricultural experimentation (Cilas & Descroix, 2004). For example, Rocha et al (2010) used a method to quantify yield loss due to coffee leaf scorch. Upreti et al (1991) also devised a method that can rapidly estimate total cherry production from a tree by counting the total cherry from a vertical quadrant of a tree. The sample is then multiplied by four to estimate total tree cherry production per tree. Other methods count cherry on a random sub-set of primary branches and are then multiplied by the total number of primary branches to estimate total cherry production e.g. Browning and Gordon (1989). These methods have been found to be reliable in other countries but have not been tested in the context of the Papua New Guinea coffee industry. In order to test these methods, two published methods from the scientific literature were trialled (methods 1 & 2) along with two adapted / unpublished methods (methods 3 & 4). All methods were tested at the CIC Aiyura research station.
Methods assessedTrees were selected at random. Total branches, flowering nodes, flowers, fruiting nodes and total cherry were recorded from each tree in order to assess the accuracy of the four methods being tested:
Method 1: The method was first published by Upreti et al (1991). Here a quadrant based sampling procedure which estimates the two most important components of yield, fruiting nodes/tree and fruits/node. Total cherry production from a tree is estimated by counting the total cherry from vertical quadrant of a tree (equal to one quarter of the total tree). The estimate is then multiplied by four to estimate total tree cherry production. The accuracy of the yield estimated was reported by the authors to be 92%. From this yield prediction equations can be derived.
Method 2: The method was first published by Browning and Gordon (1989). Two branches are tagged and the number of fruiting nodes and cherry are counted. This is then multiplied by the total number of branches.
Method 3: This method was an adapted method based on methods 1 and 2, but sampling from two branches within the bottom, middle and top parts of the canopy. The estimates were then multiplied by the total number of branches within the three sections of the canopy.
Method 4: This method was an existing method that is used in PNG, where two branches in the North, South, East and West aspect are selected and then sampled by counting cherry. These are then multiplied by the total number of branches.
CGS was then assessed by dividing the whole tree canopy into bottom, middle and top. These sections were further divided into quarters and the following recorded: 1) presence of cgs; 2) presence of sooty mould; 3) an overall score of 1, 2, 3 or 4 for infestation
Page 11

Trip report 1: Coffee green scales in Papua New Guinea: highland Arabica coffee and yield loss
severity (based on work conducted by CIC in previous experiments. However, due the absence of cgs at Aiyura, as previously mentioned, it was impossible to relate cgs to yield.
ResultsThe results of the four methods tested are shown in Figure 3 and . It can clearly be seen that Method 1 is the most accurate, which is the method that estimates total cherry production from a tree by counting the total cherry from a vertical quadrant of a tree, equal to one quarter of the total tree. The estimate is then multiplied by four to estimate total tree cherry production. Method 1 was then tested further across more farms and other coffee tree characteristics, e.g. flowers, flowering nodes, cherry and cherry nodes.
Figure 3: Plot of fitted and observed cherry estimates from the four methods trialled. In all cases the explanatory x axis, is total cherry, where the total cherry on a tree was counted and paired with the results of the estimated method, the response variable y axis = Estimated total cherry. Scattered crosses are observed data and the red line is the fitted data with 95% confidence intervals (blue line).
Page 12

Trip report 1: Coffee green scales in Papua New Guinea: highland Arabica coffee and yield loss
Table 1: Accuracy of cherry estimates from the four methods tested in coffee farms in PNG. “F value and significance” shows if the estimated method had a significant relationship with the actual total cherry on a tree. The “R2” value indicates the accuracy, and the methods are then ranked in order of their respective accuracies.
Method F-Value & Significance
Regression Line R2 Accuracy (ranked)
1 (Upreti) F1,8 = 110.41; P < 0.001
y = 34.4 + 0.8968 R2 = 0.9324 1
2 (Browning) F1,8 = 4.02; P = 0.08 N.S.
y = 97.9 +0.611 R2 = 0.3344 4
3 F1,8 = 9.0; P < 0.017 y = 136 + 1.679 R2 = 0.5292 2
4 F1,8 = 7.69; P < 0.024 y = -2 + 1.778 R2 = 0.4901 3
Assessment of chosen method The most accurate method was that of the Upreti et al (1991) method (1) and like their study this method achieved an accuracy of 93%. The method was further tested across other coffee blocks at Aiyura and a limited number of smallholder farms. Again, total measures of cherry were counted together with the sampling method (see Figure 4 and Table 2). As can be seen in Table 2, all estimates of tree characteristics were reliable achieving an accuracy of between 75% and 90%. The results of the regression analysis resulted in highly significant relationship confirming this as a reliable method. It should be noted that the limited number of farms was because of the tribal unrest.
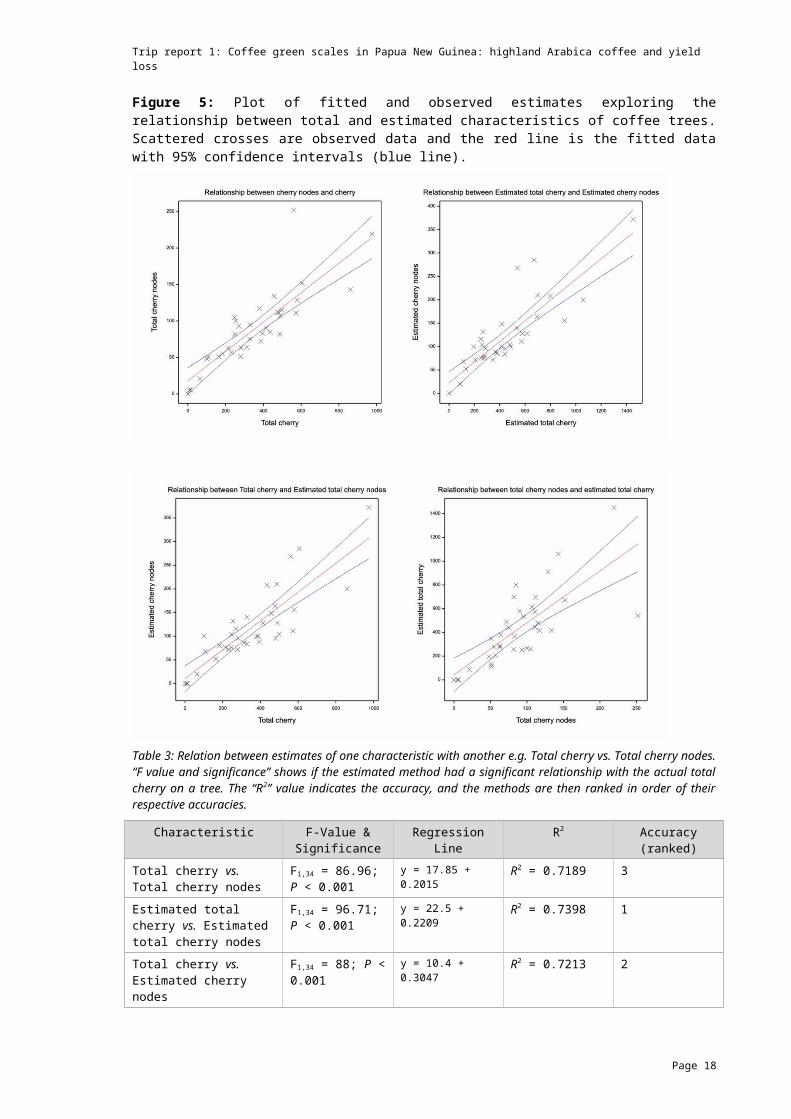
Additional, tests were conducted exploring the relationship between; for example, cherry nodes and cherry (see Figure 5 and Table 3). This was in order to determine if a more rapid sub-sampling of trees could be achieved on additional trees i.e. a greater number of trees but sampled in less detail. If this was reliable, then firstly; the Upreti quadrant method would be used in full on a sub-set of trees within a farm to estimate cherry; and secondly; an additional supplement of trees sampled in less detail could also add estimates of yield by using the relationship between cherry nodes and cherry.
As can be seen in Table 3 the relationship between estimated total cherry and Estimated cherry nodes, is highly significant with an R2 value of 0.73. Thus after assessing a sample of trees within a farm using the full Upreti quadrant method, an additional sub-set of trees can be sampled. This would Estimate cherry nodes which can be reliably related to estimated cherry and would save resources in terms of time and increase the number of samples.
Page 13

Trip report 1: Coffee green scales in Papua New Guinea: highland Arabica coffee and yield loss
Figure 4: Plot of fitted and observed estimates from the most accurate method trialled of various coffee tree characteristics e.g. flowers, cherry, etc. In all cases the explanatory x axis, is total, where the total on a tree was counted and paired with the results of the estimated method, the response variable y axis = Estimated total cherry. Scattered crosses are observed data and the red line is the fitted data with 95% confidence intervals (blue line).
Table 2 Accuracy of cherry estimates from the chosen method (method 1) tested in coffee farms in PNG. “F value and significance” shows if the estimated method had a significant relationship with the actual total cherry on a tree. The “R2” value indicates the accuracy, and the methods are then ranked in order of their respective accuracies.
Characteristic F-Value & Significance
Regression Line R2 Accuracy (ranked)
Cherry F1,34 = 273.14; P < 0.001
y = -32.8 + 1.3174 R2 = 0.8892 2
Cherry Nodes F1,34 = 103.06; P < 0.001
y = 1.5 + 1.309 R2 = 0.7519 4
Flower Nodes F1,34 = 202.18; P < 0.001
y = 7.7 + 0.9602 R2 = 0.8560 3
Flowers F1,8 = 76.34; P < 0.001
y = -92 + 1.245 R2 = 0.9051 1
Page 14

Trip report 1: Coffee green scales in Papua New Guinea: highland Arabica coffee and yield loss
Figure 5: Plot of fitted and observed estimates exploring the relationship between total and estimated characteristics of coffee trees. Scattered crosses are observed data and the red line is the fitted data with 95% confidence intervals (blue line).
Table 3: Relation between estimates of one characteristic with another e.g. Total cherry vs. Total cherry nodes. “F value and significance” shows if the estimated method had a significant relationship with the actual total cherry on a tree. The “R2” value indicates the accuracy, and the methods are then ranked in order of their respective accuracies.
Characteristic F-Value & Significance
Regression Line R2 Accuracy (ranked)
Total cherry vs. Total cherry nodes
F1,34 = 86.96; P < 0.001
y = 17.85 + 0.2015 R2 = 0.7189 3
Estimated total cherry vs. Estimated total cherry nodes
F1,34 = 96.71; P < 0.001
y = 22.5 + 0.2209 R2 = 0.7398 1
Total cherry vs. Estimated cherry nodes
F1,34 = 88; P < 0.001
y = 10.4 + 0.3047 R2 = 0.7213 2
Total cherry nodes vs. Estimated cherry
F1,8 = 42.35; P < 0.001
y = 42.4 + 4.378 R2 = 0.5546 4
Page 15

Trip report 1: Coffee green scales in Papua New Guinea: highland Arabica coffee and yield loss
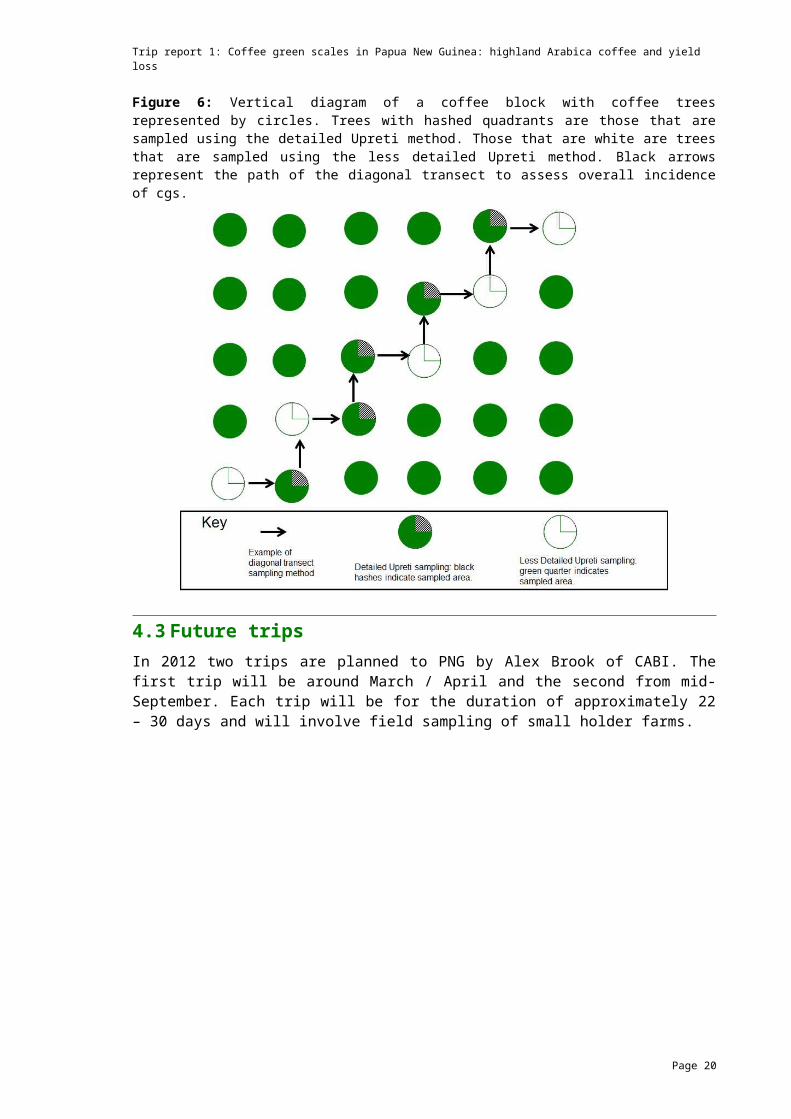
Assessing the incidence of cgs and in-situ yield – a protocolThe incidence of cgs will be assessed at each farm, along with in-situ estimates of yield and associated yield loss. The diagonal transect method (see Figure XXXX) will be used to assess the incidence within a farm, and then a subset of coffee trees will be assessed using the chosen Upreti quadrant method. Additional, supplemental samples will also be taken as mentioned earlier. Other factors such as shade level, age, and other diseases will be recorded. The protocol at each farm is as follows and will record:
1. An estimate of total number of trees.2. Age and variety.3. Soil type and altitude4. Any other disease present.5. Inputs (if any)6. A diagonal transect method as used in ASEM/2004/047 will be used to assess the
incidence (presence / absence) of cgs within a farm (Figure 6). Standard CIC protocol to be used.
7. Five trees are to be sampled using a detailed Upreti method, recording in a single quadrant (not the whole tree): 1) total cherry; 2) total cherry nodes; total flowering nodes.
8. A further five trees are to be recorded using a less detailed Upreti method, recording a single quadrant (not the whole tree), and recording: 1) total cherry nodes; and 2) total flower nodes – and NOT total cherry.
9. CGS will be quantified on the Upreti method sampled trees. Quantification will be by: 1) scoring the presence / absence of cgs in each quarter of the bottom, middle and top of the canopy giving a score out of four; 2) scoring the presence / absence of sooty mould in each quarter of the bottom, middle and top of the canopy giving a score out of four; 3) scoring the presence / absence of ants in each quarter of the bottom, middle and top of the canopy; and 4) Giving a score of severity of each of the presence / absence measures of cgs.
Figure 6: Vertical diagram of a coffee block with coffee trees represented by circles. Trees with hashed quadrants are those that are sampled using the detailed Upreti method. Those that are white are trees that are sampled using the less detailed Upreti method. Black arrows represent the path of the diagonal transect to assess overall incidence of cgs.
Page 16

Trip report 1: Coffee green scales in Papua New Guinea: highland Arabica coffee and yield loss
4.3 Future tripsIn 2012 two trips are planned to PNG by Alex Brook of CABI. The first trip will be around March / April and the second from mid-September. Each trip will be for the duration of approximately 22 – 30 days and will involve field sampling of small holder farms.
Page 17
Trip report 1: Coffee green scales in Papua New Guinea: highland Arabica coffee and yield loss
5 IP, variations to plans, budget etc.
5.1 Intellectual propertyNo IP issues to report.
5.2 Variations to future activitiesNo variations apart from the note sent from DFAT / ACIAR sent 23rd September 2011 regarding PNG elections where we have been advised to limit travel activities:
PNG National Elections in June-July 2012. Issue of writs (and nominations open): 27 April Nominations close: 4 May Voting commences: 23 June Voting ends: 6 July Return of writs (scheduled to be returned on or before): 27 July
5.3 Variations to personnelMr Tom Kukhang is now director of science at CIC Research Station. This is a welcome addition to the CIC staff capacity. The CIC Project management structure is therfore: tier 1: Dr Kenny; tier 2: Mr Tom Kukhang; tier 3: Mr Ingu Bofeng & Miss Susan May Inu; tier 4: Mr Arima Fumo & Mr Borro Asiota. No other changes are reported.
At present there is another large on-going project but there should be no other drains on staff availability that has occurred in the past.
5.4 Problems and opportunitiesAt the beginning of October 2011 at least 15 people (possibly 30+ according to local sources) were killed in tribal fighting when clashes erupted in Kainantu town in Eastern Highlands Province. The clashes were between two local tribes, the Agarabi and Kamano. Police said guns and knives were used in the fighting, and that a settlement was burned to the ground. Extra police were sent to the area but this was not until circa 6th October.
http://www.postcourier.com.pg/20111003/news01.htm http://www.bbc.co.uk/news/world-asia-pacific-15147220 http://www.theaustralian.com.au/news/breaking-news/tribal-warfare-leaves-15-
dead-in-png/story-fn3dxity-1226157445424
This all happened whilst Alex Brook was travelling from the UK and whilst Dr Shaw was in transit from Australia. The unrest was in the Kainantu area, near the CIC Aiyura research station, and some planned field work was not possible because of a CIC travel ban. Only Dr Kenny was able to attend the meeting in Goroka. Many CIC staff remained in Aiyura to stay with their families. However, contingency plans were discussed under the “Risks” heading in the meeting, where any risks to achieving activities were to be identified and contingency plans made. This real case scenario made it an opportunity to identify risks and produce a plan so that alternative activities could be conducted in the Goroka area.
Dr Shaw was not intending on travelling to Aiyura, but Alex Brook was due to travel to Aiyura on 8th October. After consulting the UK Foreign Office, ACE travel advice, CABI HQ, locals, expatriates and after extra police had arrived, Alex Brook decided travel to Aiyura (10th October) and conducted field work at the research station until 19th October.
Page 18

Trip report 1: Coffee green scales in Papua New Guinea: highland Arabica coffee and yield loss
5.5 BudgetNothing to report
Page 19
Trip report 1: Coffee green scales in Papua New Guinea: highland Arabica coffee and yield loss
6 Action points and recommendationsThe core action points are as follows and can be found in more detail within the SRA document ASEM/2010/051, within objective 1
Activity 1: Regular surveys of cgs infestations on a selection of smallholder farms within the Eastern Highlands Province. Surveys will be conducted from the onset of flowering through to harvest for two growing seasons at approximately the 1500m altitudinal zone.
CIC: to conduct ecological surveys to be conducted every three months on different sizes of smallholder farms, with and without cgs. A representative subset of these covering a range of CGS infestations will be surveyed more frequently, e.g. every two months; to gather more detailed information. A minimum of 20 smallholder farms without cgs and 40 with varying degrees of cgs infestations will probably be required to give a representative and robust sample.
CIC: In addition, overall yield loss will be determined by comparing smallholder farms, without cgs, with “optimal production systems”. These will be on station experiments (Activity 3) and well managed larger plantations (Activity 4).
Activity 2: Interview smallholders to determine both their views of cgs and yield loss, and farmer perceptions / estimates of farm costs and income.
UNSW & CIC: change in smallholder sensitisation (identified in ASEM/2004/047) will be tested and exploited by using different socio-economic survey techniques; structured interview techniques. This will enable us to understand farmer estimates so they can be compared with the independent estimates in Activity 1. In order to ensure that this will work we plan to run a pilot study in the first six months to see if the sensitised smallholders are real. Having the comparisons will be valuable and we will also make sure that time is not wasted. It will enable us to reveal if farmers recognise the problem of cgs.
Activity 3: Establish controlled research station experiments to determine yield loss.
CIC: On station experimental coffee blocks at Aiyura (CIC, EHP) will be used to provide a finer tuned measure of overall yield loss. Within these blocks differing infestation levels will be established and maintained e.g. zero, low, intermediate and high. The influence of other diseases will be mitigated by control measures, and major environmental variables will be considered. Sampling will be the same as in Activity 1 but more regularly, i.e. every month.
Activity 4: Survey and interview holders of larger farms (including plantations) and processors to gather historical information on cgs and yield and yield loss.
CIC: Survey larger farm and plantation holders to access records kept on issues such as yield loss due to cgs and cgs management strategies will provide additional longitudinal / timeline data.
Other Action points and recommendations. CIC: Mr John Edwards to be contacted to explore further the possibilities of
accessing small holder yield data.
CIC: to explore other processors.
ALL: All data is to be shared.
CIC: to catch up with all aspects of the surveys.
CIC: to utilise existing experimental farms for the
Page 20

Trip report 1: Coffee green scales in Papua New Guinea: highland Arabica coffee and yield loss
CABI: Alex to arrange trip to PNG in March / April 2012 and join the CIC team in the field.
UNSW: Dr Wendy Shaw to maintain contact with Ms Susan May Inu of CIC and coordinate socioeconomic activities.
Page 21

Trip report 1: Coffee green scales in Papua New Guinea: highland Arabica coffee and yield loss
7 ReferencesBrowning, G. and A. Dorward (1989). A survey methodology for assessing yield potential and coffee berry losses in peasant coffee. Experimental Agriculture, 25: 235-242.
Cilas, C. and F. Descroix (2004). Yield estimation and harvest period. Coffee: Growing, Processing, Sustainable Production. N. J. Wintgens. Weinheim, Wiley-VCH Verlag GmbH & Co. KGaA: 595-601.
Rocha, J.G., Zambolim, L., Zambolim, E.M., Ribeiro do Vale, F.X., Junior, W.C.J. and Filho, A.B. (2010). Quantification of yield loss due to coffee leaf scorch. Crop Protection, 29: 1100-1104.
Upreti, G., Bittenbender, J.L., and Ingamells, J.L. (1991). Rapid estimation of coffee yield. COLLOQUE Scientifique International sur le Café, 14. San Francisco (Estados Unidos).
Page 22

Trip report 1: Coffee green scales in Papua New Guinea: highland Arabica coffee and yield loss
8 AppendicesAppendix 1: Output from Simple Linear Regression of 4 methods trialled.Regression analysis Method 1:Response variate: U_CHERRY_Upreti_Normal
Fitted terms: Constant, TOTAL_CHERRY
Summary of analysis
Source d.f. s.s. m.s. v.r. F pr.
Regression 1 192933. 192933. 110.41 <.001
Residual 8 13979. 1747.
Total 9 206912. 22990.
Percentage variance accounted for 92.4
Standard error of observations is estimated to be 41.8.
Estimates of parameters
Parameter estimate s.e. t(8) t pr.
Constant 34.4 25.2 1.36 0.210
TOTAL_CHERRY 0.8968 0.0853 10.51 <.001
Regression analysis Method 2:Response variate: B_CHERRY
Fitted terms: Constant, TOTAL_CHERRY
Summary of analysis
Source d.f. s.s. m.s. v.r. F pr.
Regression 1 89490. 89490. 4.02 0.080
Residual 8 178045. 22256.
Total 9 267534. 29726.
Percentage variance accounted for 25.1
Standard error of observations is estimated to be 149.
Estimates of parameters
Parameter estimate s.e. t(8) t pr.
Constant 97.9 90.0 1.09 0.308
TOTAL_CHERRY 0.611 0.305 2.01 0.080
Page 23

Trip report 1: Coffee green scales in Papua New Guinea: highland Arabica coffee and yield loss
Regression analysis Method 3:Response variate: U_CHERRY_CutDown
Fitted terms: Constant, TOTAL_CHERRY
Summary of analysis
Source d.f. s.s. m.s. v.r. F pr.
Regression 1 676400. 676400. 9.00 0.017
Residual 8 601559. 75195.
Total 9 1277958. 141995.
Percentage variance accounted for 47.0
Standard error of observations is estimated to be 274.
Estimates of parameters
Parameter estimate s.e. t(8) t pr.
Constant -136. 165. -0.82 0.435
TOTAL_CHERRY 1.679 0.560 3.00 0.017
Regression analysis Method 4:Response variate: F_CHERRY
Fitted terms: Constant, TOTAL_CHERRY
Summary of analysis
Source d.f. s.s. m.s. v.r. F pr.
Regression 1 758681. 758681. 7.69 0.024
Residual 8 789326. 98666.
Total 9 1548006. 172001.
Percentage variance accounted for 42.6
Standard error of observations is estimated to be 314.
Estimates of parameters
Parameter estimate s.e. t(8) t pr.
Constant -2. 189. -0.01 0.992
TOTAL_CHERRY 1.778 0.641 2.77 0.024
Appendix 2: Output from Simple Linear Regression of the chosen method (Method 1) comparing multiple tree parameters.Regression analysis CherryResponse variate: EY_totalcherry
Fitted terms: Constant, W_totalcherry
Summary of analysis
Source d.f. s.s. m.s. v.r. F pr.
Regression 1 2918532. 2918532. 273.14 <.001
Page 24

Trip report 1: Coffee green scales in Papua New Guinea: highland Arabica coffee and yield loss
Residual 34 363299. 10685.
Total 35 3281831. 93767.
Percentage variance accounted for 88.6
Standard error of observations is estimated to be 103.
Estimates of parameters
Parameter estimate s.e. t(34) t pr.
Constant -32.8 33.0 -1.00 0.327
W_totalcherry 1.3174 0.0797 16.53 <.001
Regression analysis Cherry NodesResponse variate: EY_totalcherrynodes
Fitted terms: Constant, W_totalcherrynodes
Summary of analysis
Source d.f. s.s. m.s. v.r. F pr.
Regression 1 162742. 162742. 103.06 <.001
Residual 34 53690. 1579.
Total 35 216432. 6184.
Percentage variance accounted for 74.5
Standard error of observations is estimated to be 39.7.
Estimates of parameters
Parameter estimate s.e. t(34) t pr.
Constant 1.5 13.2 0.11 0.913
W_totalcherrynodes 1.309 0.129 10.15 <.001
Regression analysis Flowering NodesResponse variate: EY_totalfloweringnodes
Fitted terms: Constant, W_totalfloweringnodes
Summary of analysis
Source d.f. s.s. m.s. v.r. F pr.
Regression 1 512382. 512382. 202.18 <.001
Residual 34 86168. 2534.
Total 35 598550. 17101.
Percentage variance accounted for 85.2
Standard error of observations is estimated to be 50.3.
Estimates of parameters
Parameter estimate s.e. t(34) t pr.
Constant 7.7 11.0 0.70 0.488
W_totalfloweringnodes 0.9602 0.0675 14.22 <.001
Regression analysis FlowersResponse variate: EY_totalflowers
Page 25

Trip report 1: Coffee green scales in Papua New Guinea: highland Arabica coffee and yield loss
Fitted terms: Constant, W_totalflowers
Summary of analysis
Source d.f. s.s. m.s. v.r. F pr.
Regression 1 2073953. 2073953. 76.34 <.001
Residual 8 217344. 27168.
Total 9 2291298. 254589.
Percentage variance accounted for 89.3
Standard error of observations is estimated to be 165.
Estimates of parameters
Parameter estimate s.e. t(8) t pr.
Constant -92. 104. -0.89 0.401
W_totalflowers 1.245 0.142 8.74 <.001
Appendix 3: Output from Simple Linear Regression of chosen method against other characteristics.
Regression analysis Total cherry nodes vs. Total cherryResponse variate: W_totalcherrynodesFitted terms: Constant, W_totalcherry
Summary of analysis
Source d.f. s.s. m.s. v.r. F pr.Regression 1 68285. 68284.8 86.96 <.001Residual 34 26699. 785.3 Total 35 94984. 2713.8 Percentage variance accounted for 71.1Standard error of observations is estimated to be 28.0.
Estimates of parameters
Parameter estimate s.e. t(34) t pr.Constant 17.85 8.93 2.00 0.054W_totalcherry 0.2015 0.0216 9.33 <.001
Regression analysis Estimated total cherry nodes vs. Estimated total cherry.Response variate: EY_totalcherrynodesFitted terms: Constant, EY_totalcherry
Summary of analysis
Source d.f. s.s. m.s. v.r. F pr.Regression 1 160132. 160132. 96.71 <.001Residual 34 56300. 1656. Total 35 216432. 6184. Percentage variance accounted for 73.2Standard error of observations is estimated to be 40.7.
Page 26

Trip report 1: Coffee green scales in Papua New Guinea: highland Arabica coffee and yield loss
Estimates of parameters
Parameter estimate s.e. t(34) t pr.Constant 22.5 11.8 1.90 0.066EY_totalcherry 0.2209 0.0225 9.83 <.001
Regression analysis Estimated total cherry nodes vs. Total cherryResponse variate: EY_totalcherrynodesFitted terms: Constant, W_totalcherry
Summary of analysis
Source d.f. s.s. m.s. v.r. F pr.Regression 1 156114. 156114. 88.00 <.001Residual 34 60318. 1774. Total 35 216432. 6184. Percentage variance accounted for 71.3Standard error of observations is estimated to be 42.1.
Estimates of parameters
Parameter estimate s.e. t(34) t pr.Constant 10.4 13.4 0.78 0.444W_totalcherry 0.3047 0.0325 9.38 <.001
Regression analysis Estimated total cherry vs. total cherry nodesResponse variate: EY_totalcherryFitted terms: Constant, W_totalcherrynodes
Summary of analysis
Source d.f. s.s. m.s. v.r. F pr.Regression 1 1820351. 1820351. 42.35 <.001Residual 34 1461480. 42985. Total 35 3281831. 93767. Percentage variance accounted for 54.2Standard error of observations is estimated to be 207.
Estimates of parameters
Parameterestimate s.e. t(34) t pr.Constant 42.4 69.0 0.61 0.543W_totalcherrynodes 4.378 0.673 6.51 <.001
Page 27