A.Chupyra, BINP Novosibirsk, May 25-30, 2008 1 BINP CAPACITIVE AND ULTRASONIC HYDROSTATIC LEVEL...
59
A.Chupyra, BINP Novosibi rsk, May 25-30, 2008 1 BINP CAPACITIVE AND ULTRASONIC HYDROSTATIC LEVEL SENSORS A.G. Chupyra, G.A. Gusev, M.N. Kondaurov, A.S. Medvedko, R.V. Pilipenko, Sh.R. Singatulin BINP, 630090, Novosibirsk, Russia NANOBEAM 2008
-
Upload
howard-little -
Category
Documents
-
view
225 -
download
0
Transcript of A.Chupyra, BINP Novosibirsk, May 25-30, 2008 1 BINP CAPACITIVE AND ULTRASONIC HYDROSTATIC LEVEL...

A.Chupyra, BINP Novosibirsk, May 25-30, 2008
1
BINP CAPACITIVE AND ULTRASONIC HYDROSTATIC LEVEL SENSORS
A.G. Chupyra, G.A. Gusev, M.N. Kondaurov, A.S. Medvedko, R.V. Pilipenko, Sh.R. Singatulin
BINP, 630090, Novosibirsk, Russia
NANOBEAM 2008

A.Chupyra, BINP Novosibirsk, May 25-30, 2008
2
1. INTRODUCTION
2. CAPACITIVE LEVEL SENSOR SASE
3. ULTRASONIC LEVEL SENSOR ULSE
4. DATA ACQUISITION SYSTEM OF LEVEL MEASUREMENTS
5. COMPARISION OF TWO KINDS OF THE SENSORS
6. REFERENCES
NANOBEAM 2008

A.Chupyra, BINP Novosibirsk, May 25-30, 2008
3
1. IntroductionSlow ground motion study for future accelerator projects and
alignment of large accelerator machine components with high accuracy are important tasks now. One of the prevalent tool
for solution of these tasks are Hydrostatic Level Sensors designed to work into the Hydrostatic Levelling System, which is based on on principle of communicating vessels. Each vessel is equipped with a sensor, measuring the water level. All water level measuring sensors are linked to its neighbors by a system of tubes. So the principle is based on the equilibrium of the pressure of liquid in communicating vessels.
The principal was even known in ancient Greece.
NANOBEAM 2008

A.Chupyra, BINP Novosibirsk, May 25-30, 2008
4
NANOBEAM 2008
Assuming that the liquid used has a homogeneous density “” and the gravitational force “g” and air pressure “P” are the same at both vessels, one can deduce the elevation difference between two vessels merely by subtracting the measured height of the liquid column at each vessel from the other.

A.Chupyra, BINP Novosibirsk, May 25-30, 2008
5
It can be assumed that the gravitational forces are almost identical at two vessel locations if the vessels are located in a less then 10 square km area.
An air circuit between the vessels is used to maintain the system at the same atmospheric pressure. There is only one small opening provided in the air circuit. The pressure from that location is distributed to all other vessels.
For measurements at room temperature, water is the simplest choice for the type liquid. It is inexpensive and safe.
NANOBEAM 2008

A.Chupyra, BINP Novosibirsk, May 25-30, 2008
6
NANOBEAM 2008
There are two kinds of hydraulic circuit configuration: 1) configuration with four vessel ports (two for air and two for liquid) using
plastic pipes (as rule with I.D.=12 mm, O.D.=14 mm);2) configuration, with two vessel ports using single pipe (I.D.=20 mm, O.D.=22 mm or more) half filled with water and horizontally placed enough to keep
water-air gap continuity all along the pipe.

A.Chupyra, BINP Novosibirsk, May 25-30, 2008
7
The first configuration can have differential error produced either by water specific mass changing with temperature in case of non-horizontal hydraulic circuit or by outgassing and as, a result, air bubbles in water circuit. If bubbles are big enough to overlap water pipe they become an obstruction to liquid communication and create mistakes in measurements. The second configuration has no differential error produced by water specific mass changing with temperature in principle and it has no any problems with air bubbles, but, of course, this kind of tubes need more delicate operation.
NANOBEAM 2008

A.Chupyra, BINP Novosibirsk, May 25-30, 2008
8
The first BINP capacitive HLS sensor SAS at SLAC, Sector 10 in the network of slow ground motion study for NLC project.
NANOBEAM 2008

A.Chupyra, BINP Novosibirsk, May 25-30, 2008
9
NANOBEAM 2008

A.Chupyra, BINP Novosibirsk, May 25-30, 2008
10
HLS system at sector B of
Tevatron, FNAL.
The system was installed on 2003
to study online a behaviour of
Tevatron magnets.
It was installed 24 capacitive
sensors on quadripole magnets
at sector B.
Total pipe length is about 800
meters.
NANOBEAM 2008

A.Chupyra, BINP Novosibirsk, May 25-30, 2008
11
24 SAS-T sensors were
delivered to FNAL in 2004.
They were installed on
magnet lines near detectors
CDF and D0.
The SAS-T was in detail
presented in our report on
IWAA04 [2].
In 2004 year the new modification of capacitive sensor (SAS-T) was developed.Equally with level measurement capability this sensor has a built-in two-coordinate tilt sensor. The range of tilt angle measurement is 17 milliradians with sensitivitybetter than 0.05 milliradian.
NANOBEAM 2008

A.Chupyra, BINP Novosibirsk, May 25-30, 2008
12
HLS system in MINOS tunnel (FNAL) to study ground motion for ILC project.
NANOBEAM 2008

A.Chupyra, BINP Novosibirsk, May 25-30, 2008
13
In accordance with the program of collaboration between BINP
and SLAC high-resolution capacitive (SASE) and ultrasonic (ULSE)
hydrostatic level sensors for the Linac Coherent Light Source (LCLS) Undulator Alignment System were developed and fabricated. The required water level working range is +/- 2.5
mm relative to the middle of the water communication pipe. The
required resolution of the sensors must be not worse 1 m with an accuracy of 5 m over 5 mm measurement range. At first pilot series of the sensors was fabricated and tested. Then final version of the sensors was developed and fabricated.
NANOBEAM 2008

A.Chupyra, BINP Novosibirsk, May 25-30, 2008
14Test stand with pilot patterns of SASE and ULSE at SLAC. May 2006
NANOBEAM 2008
A.Chupyra, BINP Novosibirsk, May 25-30, 2008
15
The overview of HLS monitoring system installation at LCLS undulator (from report of Georg Gassner, SLAC - “HLS Monitoring System” August, 2006).
1 - Girder,
2 – ULSE sensor,
3 – SASE sensor
NANOBEAM 2008

A.Chupyra, BINP Novosibirsk, May 25-30, 2008
16
Goals on last development • To obtain required metrological
characteristics:
working range 5 mm,
resolution not worse 1 m ,
accuracy not worse 5 m .• Mechanical design of the
sensors
must fit same water pipe and same bracket
• The sensors must have same interface for Data acquisition system
The detailed view of the sensor’s
Installation on one girder:
1 – one ULSE sensor
2-4 – three SASE sensors
NANOBEAM 2008

A.Chupyra, BINP Novosibirsk, May 25-30, 2008
17
2 CAPACITIVE LEVEL SENSOR SASE
The presented capacitive level sensor SASE is intended for monitoring of
LCLS Undulator vertical position:
• Displacement range - 5 mm ;
• Resolution – not worse 1 m;
• Accuracy - 5.0 μm;
• Sampling rate – 0.5 Hz.
SASE works on principal of capacitance-based sensing. The principal is to
create a capacitor, the liquid surface being one electrode, the sensor
electrode placed in air medium upper of water surface being the second
electrode of capacitor, the capacitance of which is measured in order to
derive the distance between these two electrodes.
NANOBEAM 2008

A.Chupyra, BINP Novosibirsk, May 25-30, 2008
18
NANOBEAM 2008
C2 2
C1 1
D2
D1
1
111 DAC
2
222 DAC
)1()1(11
1 k
kD
kC
AD
22
11
A
Ak
21
111CCC
21 DDD
CAPACITANCE BASED METHOD OF LEVEL MEASUREMENTS

A.Chupyra, BINP Novosibirsk, May 25-30, 2008
19
A method used for measurement is to convert variable capacitance into frequency, after that to convert the frequency to digital form. The developed circuit uses the idea presented at the work of N.Toth and Gerard C.M. Meijer [1]. General idea of the converter is an RC-generator with oscillating frequency determined by it’s internal parameters. To connect by turns Cr and Cz one can measure 3 periods T0,T1, T2 and calculate Cz removing parasitic capacitance C.
z
r
C
C
TT
TT
02
01
NANOBEAM 2008
T0 11 sec
T2 => 11 to 18 sec
depending on water level in vessel.
measurement period is 2 Hz.

A.Chupyra, BINP Novosibirsk, May 25-30, 2008
20
NANOBEAM 2008
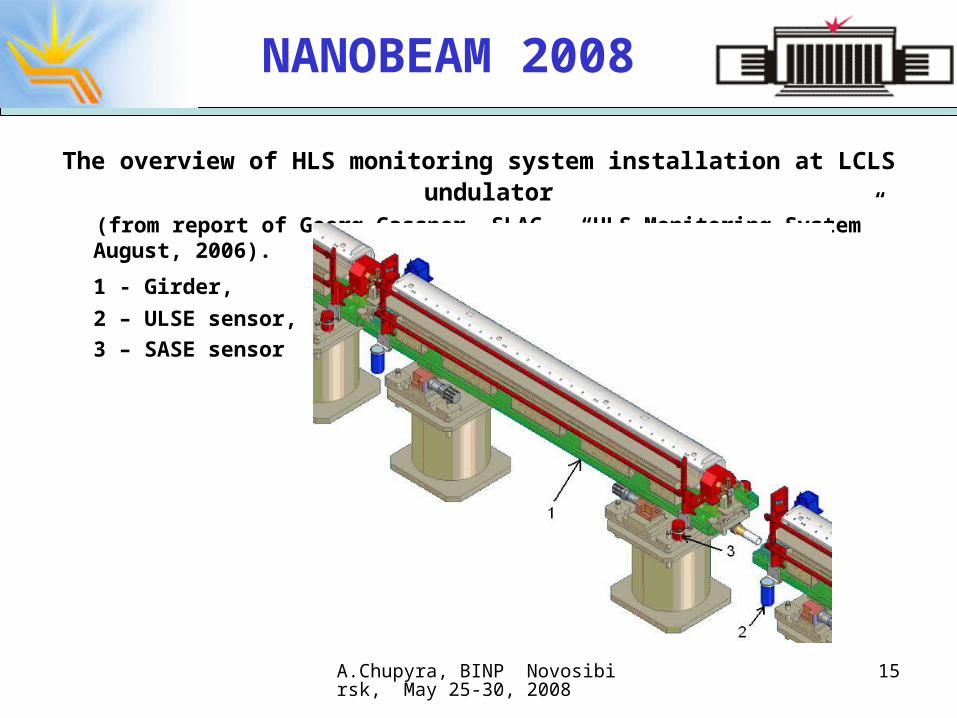
SASE consists of two independent
parts: upper one with electronics
inside (usually named as head) and
lower one (usually named as vessel)
filled with water. The general view of
the sensor is shown at the picture
on the left. All the body parts are
done with stainless steel. On the top
there is a special nest for a 1.5 inch
ball to provide alignment survey.
Inside the vessel there is a hole for
placement of temperature probe.
A.Chupyra, BINP Novosibirsk, May 25-30, 2008
21
Picture of SASE general view.
NANOBEAM 2008

A.Chupyra, BINP Novosibirsk, May 25-30, 2008
22
The electronics of SASE is mounted on two printed circuit boards. The board 1 includes C=>F converter and flash microcontroller. The board 2 includes Lantronix XPort [3], Power supply controller, DC-DC converter and transformer.On the picture below a view of the SASE electronics is presented. The board 1 is at the left side, the board 2 is at the right one.
NANOBEAM 2008

A.Chupyra, BINP Novosibirsk, May 25-30, 2008
23
3. ULTRASONIC LEVEL SENSOR ULSE
The presented ultrasonic level sensor ULSE is also intended for monitoring of LCLS Undulator vertical position:• Displacement range - 5 mm ;• Resolution – not worse 0.2 m;• Accuracy - not worse 5.0 μm;• Sampling rate – 100 Hz.
A pulse-echo method is used in ULSE for water level measurements. The ultrasonic hydro-location is well known and widely distributed method of distance measurements for many applications.
NANOBEAM 2008

A.Chupyra, BINP Novosibirsk, May 25-30, 2008
24
Some basic principles of the pulse-echo method for water level
measurements:• Determine the location of free water surface in a vessel• Accurately measuring the time required for a short ultrasonic
pulse, generated by a transducer, to travel through a thickness of water, to reflect from the free water surface or from the reflective surface, and to be returned to the transducer.
• The result is expressed by the relation:
• d is the distance,
• v is the velocity of sound waves in water,
• t is the measured round-trip transit time.
2/tvd
NANOBEAM 2008

A.Chupyra, BINP Novosibirsk, May 25-30, 2008
25
One of precise methods was described by Markus Schlösser and
Andreas Herty at their report presented at the 7th International
Workshop on Accelerator Alignment [4]. Their idea is to locate not
only the water surface in a vessel, but also two addition surfaces
with calibrated distance between them and at the calibrated
distance to alignment reference target. This idea pushed us to
develop the Ultrasonic Level Sensor for precise measurement of
the absolute vertical displacements of accelerator structures.
NANOBEAM 2008

A.Chupyra, BINP Novosibirsk, May 25-30, 2008
26
Principle of organizing
the reference surfaces
at the ULSE(Picture is from the
M. Schlösser & A. Herty report)
H - distance from the water surface Hw
to external reference surface (point) Hp
12
112
RR
Rof
tt
ttDDH
NANOBEAM 2008
A.Chupyra, BINP Novosibirsk, May 25-30, 2008
27
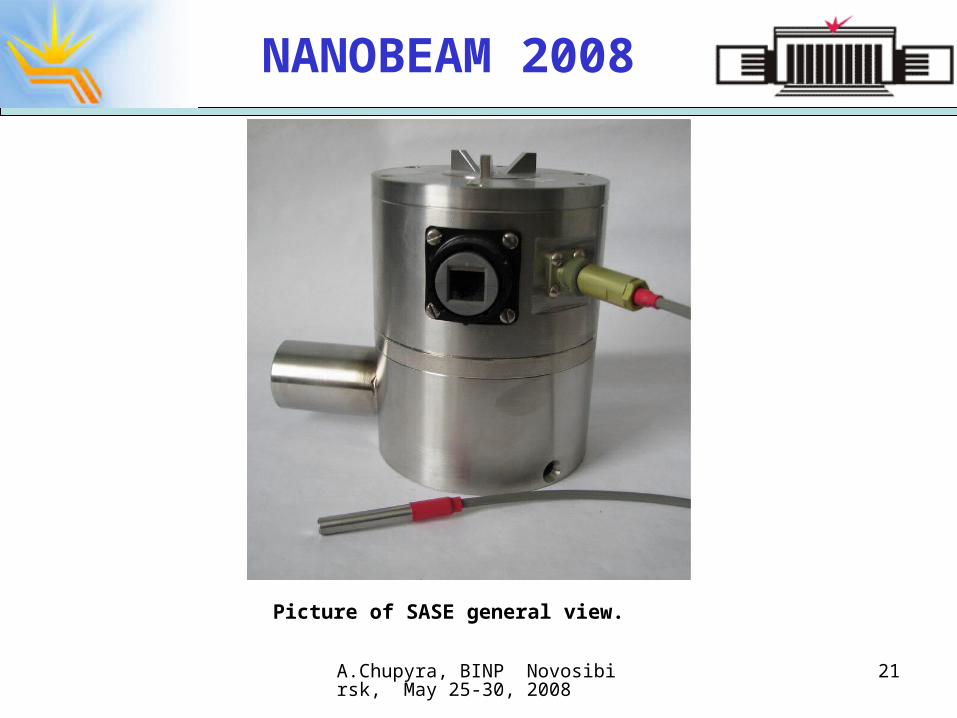
Special transducers => immersion transducers• Transducers are designed to operate in a liquid environment • They usually have an impedance matching layer that helps to radiate
more sound energy into the water and to receive reflected one.• Immersion transducers can be equipped within a planner or focused lens. • A focused transducer can improve sensitivity and axial resolution by
concentrating the sound energy to a smaller area. • The sound that irradiated from a piezoelectric transducer does not
originate from a point, but from all the surface of the piezoelectric element.
• Round transducers are often referred to as piston source transducers because the sound field resembles a mass in front of the transducer.
Choice of transducer for ULSE and physics of hand-picked transducer werein detail described in our report on IWAA06 [5].
NANOBEAM 2008

A.Chupyra, BINP Novosibirsk, May 25-30, 2008
28
Sound field pictures of the typical piezoelectric transducer
VDfN /)2/( 2
For a piston source transducer with:
Diameter D,
Central frequency f, Sound velocity V the estimation of the near/far field transition point:
NANOBEAM 2008

A.Chupyra, BINP Novosibirsk, May 25-30, 2008
29
Characteristics of Krautkramer H10KB3 ultrasonic transducer
NANOBEAM 2008

A.Chupyra, BINP Novosibirsk, May 25-30, 2008
30
Sound velocity in water equal to 1483m/sec at 20°C.
Displacement resolution 0.2µm => time resolution 140 picosecond
Accuracy about 5µm => accuracy about 3.4 nanosecond. The signal repetition frequency at the ULS was chosen 100 Hz.One second averaging time interval for different systemscomparison.
Type R1 2t R2 2t OF 2t dH dt
mm µs mm µs mm µs mm µs
ULSE 55 74.17 62.5 84.29 75 101.46 ±2.5 ±1.7
In compliance with the mechanical design of the ULSE we should measure three distances: R1, R2, OF
NANOBEAM 2008

A.Chupyra, BINP Novosibirsk, May 25-30, 2008
31
12
112 tt
ttDDH of
The goal of ULSE electronics is to measure time intervals with the accuracy as fine as possible and to calculate the resulting values
R1 R2 OF
Transmission ReceivingNext transmission
Time diagram of one measuring cycle
NANOBEAM 2008

A.Chupyra, BINP Novosibirsk, May 25-30, 2008
32
Real oscillograms of reflected signals.
NANOBEAM 2008

A.Chupyra, BINP Novosibirsk, May 25-30, 2008
33
Time diagram of “zero level” comparator operation
Stop
Gate
Reflected signal
NANOBEAM 2008

A.Chupyra, BINP Novosibirsk, May 25-30, 2008
34
NANOBEAM 2008
ULSE consists of ultrasonic transducer,
vessel with tube outlet, reference part,
temperature probe. The reference part
has two reference surfaces to calibrate
the measurements and special nest for a
1.5 inch ball to provide alignment survey.
There are no any electronics inside the
body of ULSE. The electronics is placed
into separate box, which can be located on
some distance (up to 2 meters) from
the mechanical body of ULSE.

A.Chupyra, BINP Novosibirsk, May 25-30, 2008
35
General view of the ULSE and its electronic box.
NANOBEAM 2008

A.Chupyra, BINP Novosibirsk, May 25-30, 2008
36
The internal view of the box with electronics.
NANOBEAM 2008
A.Chupyra, BINP Novosibirsk, May 25-30, 2008
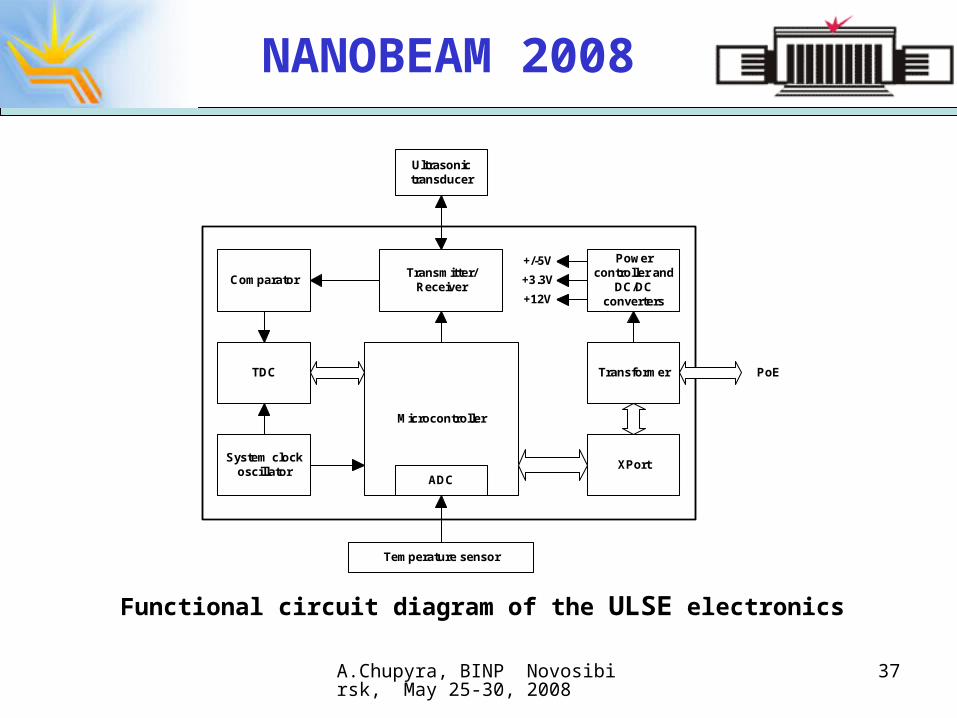
37
Functional circuit diagram of the ULSE electronics
text
Ultrasonictransducer
ComparatorTransmitter/
Receiver
Microcontroller
TDC
XPort
Transformer
Powercontroller and
DC/DCconverters
Temperature sensor
System clockoscillator
ADC
+/-5V
PoE
+3.3V
+12V
NANOBEAM 2008

A.Chupyra, BINP Novosibirsk, May 25-30, 2008
38
4. DATA ACQUISITION SYSTEM OF LEVEL MEASUREMENTS
Data acquisition is organized with help of Local Area Network based on
Power over Ethernet (PoE) interface and standard system of commands
Field Point F1001, National Instruments Corp [6].
PoE interface is a system to transmit electrical power, along with data, to
remote devices over standard twisted pair cable in an Ethernet network.
PoE interface operates under IEEE 802.3af specification. The specification
provides 48 V DC over two out of four available pairs on a Cat3./Cat5. cable
with a maximum current of 400 mA for a maximum load power of 15.4 W.
NANOBEAM 2008

A.Chupyra, BINP Novosibirsk, May 25-30, 2008
39
Functional diagram of HLS Data
acquisition system. • All sensors (ULSE or SASE type) are connected up to standard switches with Power over Ethernet capability (one channel of the switch per one sensor).
• The switches are connected to local area network based on Ethernet.
• Number of the used sensors can easily vary by changing number of switches.
• Length of the connecting cables between the sensors and the switches can be as long as 100 meters.
Switch with Power over Ethernet capability
ULSEorSASE
ULSEorSASE
ULSEorSASE
ULSEorSASE
ULSEorSASE
Ethernet LAN
NANOBEAM 2008

A.Chupyra, BINP Novosibirsk, May 25-30, 2008
40
5. COMPARISION OF TWO KINDS OF THE SENSORS
Ultrasonic sensor has a lot of benefits in comparison with capacitive one:• more high absolute accuracy • more sensitivity at more high sample rate• measuring data don’t depend on electronics drifts (temperature and
time) because of calibration capability during each measuring cycle• no dependence of relation “signal/noise” from measuring level• high linearity of transfer coefficient (output signal => level)• no need in precise calibration – only accurate measurement of two
linear sizes for reference part
NANOBEAM 2008
A.Chupyra, BINP Novosibirsk, May 25-30, 2008
41
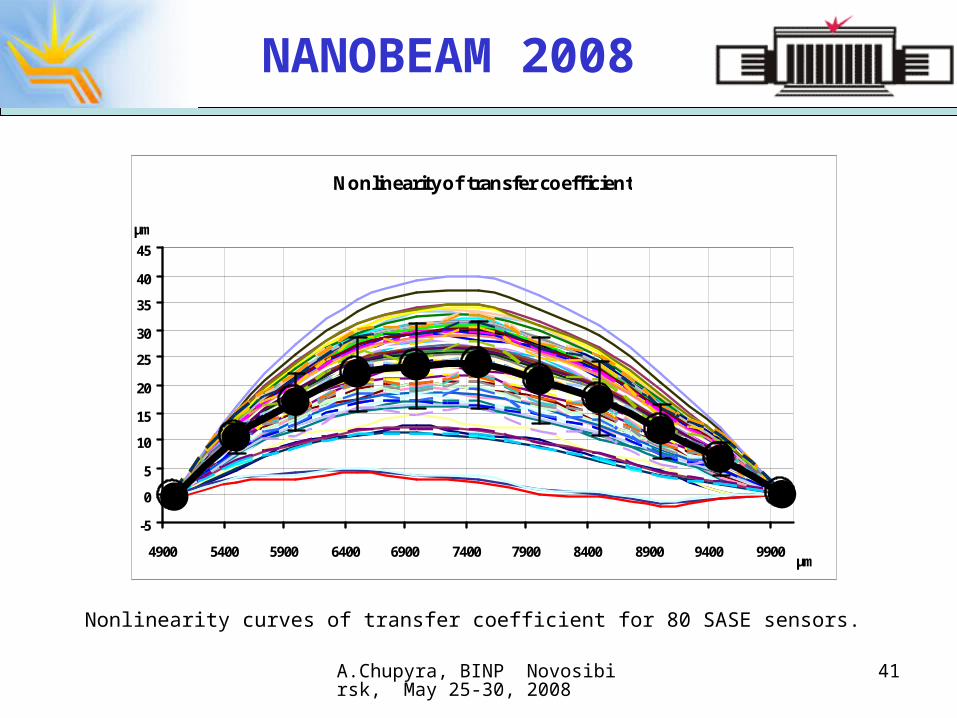
Nonlinearity curves of transfer coefficient for 80 SASE sensors.
Nonlinearity of transfer coefficient
-5
0
5
10
15
20
25
30
35
40
45
4900 5400 5900 6400 6900 7400 7900 8400 8900 9400 9900µm
µm
NANOBEAM 2008

A.Chupyra, BINP Novosibirsk, May 25-30, 2008
42
Nonlinearity curves of transfer coefficient after interpolation by the 3rd order polynomial for the SASE sensors.
Nonlinearity of transfer coefficient after interpolation
-2,5
-2,0-1,5
-1,0
-0,5
0,00,5
1,0
1,52,0
2,5
4900 5400 5900 6400 6900 7400 7900 8400 8900 9400 9900µm
µm
NANOBEAM 2008
A.Chupyra, BINP Novosibirsk, May 25-30, 2008
43
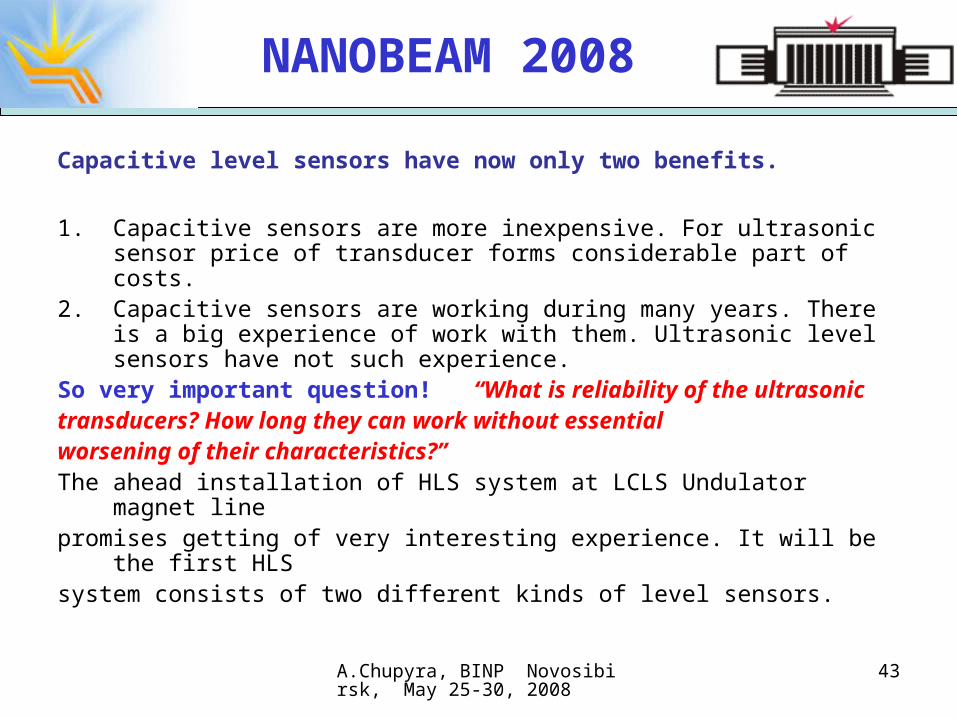
Capacitive level sensors have now only two benefits.
1. Capacitive sensors are more inexpensive. For ultrasonic sensor price of transducer forms considerable part of costs.
2. Capacitive sensors are working during many years. There is a big experience of work with them. Ultrasonic level sensors have not such experience.
So very important question! “What is reliability of the ultrasonic transducers? How long they can work without essential worsening of their characteristics?” The ahead installation of HLS system at LCLS Undulator magnet linepromises getting of very interesting experience. It will be the first HLS system consists of two different kinds of level sensors.
NANOBEAM 2008

A.Chupyra, BINP Novosibirsk, May 25-30, 2008
44
6. REFERENCES
[1] Ferry N. Toth and Gerard C.M. Meijer “A Low-Cost, Smart Capacitive Position Sensor”, / http://ieeexplore.ieee.org/iel1/19/5183/00199446.pdf ./
[2] A. Chupyra, M. Kondaurov, A. Medvedko, S. Singatulin, E. Shubin “SAS family of hydrostatic level and tilt sensors for slow ground motion stadies and precise alignment” Proceeding of 8th IWAA04, Geneve, 2004.
[3] http://www.lantronix.com/device-networking/embedded-device-servers/xport.html
[4] M. Shlösser, A. Herty, “High precision accelerator alignment of large linear colliders – vertical alignment”. Proceedings of the 7th IWAA, Spring-8, 2002.
[5] A. Chupyra, G. Gusev, M. Kondaurov, A. Medvedko, Sh. Singatulin “The ultrasonic level sensors for precise alignment of particle accelerators and storage rings” Proceeding of 9th IWAA06, SLAC, 2006.
[6] http://zone.ni.com/devzone/cda/tut/p/id/3346.
NANOBEAM 2008

A.Chupyra, BINP Novosibirsk, May 25-30, 2008
45
Thank you for attention!
NANOBEAM 2008

A.Chupyra, BINP Novosibirsk, May 25-30, 2008
46
Test of the ULS sensitivity (water drops test). Level steps => 0.5µm
0.5μm
NANOBEAM 2008

A.Chupyra, BINP Novosibirsk, May 25-30, 2008
47
Checking of the accuracy (water flew in)
Absolute level increases More then
5mm
Level difference Less than
4µm
NANOBEAM 2008

A.Chupyra, BINP Novosibirsk, May 25-30, 2008
48
The sequence of operations of the electronics of the ULSE• After power “ON” the Microcontroller begin fulfillment of program, placed in its
internal memory. The microcontroller makes measurement cycle once on 10 ms. • It forms start pulses for the Transmitter and TDC. • The Transmitter generates electrical pulse for Transducer. • The Receiver takes the reflected signals and sends them to the Comparator. • The Comparator transforms analogous signals into digital pulses. • TDC measures time intervals between the start pulse and the pulses coming from
the Comparator. • The Microcontroller gets digital codes from TDC and prepares them for the next
transmission to PC computer. • Number of cycles and clock frequency of PC is determined by system and size of
the ULSE memory. • The Microcontroller also can measure temperature of ULSE vessel and
accordingly temperature of water inside the vessel with help of temperature probe and inboard ADC. Temperature measurement resolution is about 0.1 C.
NANOBEAM 2008

A.Chupyra, BINP Novosibirsk, May 25-30, 2008
49
Each ULSE vessel is equipped with:• the piezoelectric transducer of Krautkramer H10KB3 type;
• the temperature sensor ;• electronics box.
The electronics has:• fast and precise Time-to-Digital converter (TDC)• microcontroller • built-in PoE interface• DC/DC converter
There are two types of ULS prototypes:
ULS-PR => with Panametric Transducer and RS-485 Interface
ULS-KE => with Krautkramer Transducer and PoE (Power – over – Ethernet) interface
NANOBEAM 2008

A.Chupyra, BINP Novosibirsk, May 25-30, 2008
50
Near zone => Far zone• The ultrasonic beam is more uniform in the far field zone
• The transition between these zones occurs at a distance
N "natural focus" of a flat (or unfocused) transducer.
• This near/far distance N is very significant: This area just beyond the near field where the sound wave have maximum strength.
• Optimal measurement results will be obtained when reflective surfaces are close to N area:
• N < d < 2N
• This requirement determines the minimal distance from transducer to target surfaces.
NANOBEAM 2008

A.Chupyra, BINP Novosibirsk, May 25-30, 2008
51
Some explanations about Comparator and it’s function
Comparator converts analogous signal of reflected oscillations into the digital “ON/OFF” form.
To avoid the dependence of time measurements from reflected pulse amplitude we had applied the “zero level” comparator.
In Comparator the reflected analogous signal, looking like a short bunch of oscillations, enters to the gate.
Gate has predicted time position and pulse duration. It has raw comparator. Main Comparator has zero reference level and sufficiently high gain.
Goal is to fix the “first positive pulse after first negative pulse with
sufficiently large amplitude”.
NANOBEAM 2008

A.Chupyra, BINP Novosibirsk, May 25-30, 2008
52
VARIANTS OF MECHANICAL DESIGN
NANOBEAM 2008

A.Chupyra, BINP Novosibirsk, May 25-30, 2008
53
Time interval measurements
• The transducers with as high as possible value of operating frequency. We choose 5MHz and 10MHz;
• One clock of “Start” for all (three) time intervals to be measured
• “Zero level” comparator to fix the arrival time of the reflected pulse;
• TDC-GP1 type of the Time-to-Digit Converter with highly precision measurement function.
• Microprocessor based electronics for each Sensor to make necessary individual calibrations and processing with signals: storing of measurement results, calculation and averaging them.
NANOBEAM 2008

A.Chupyra, BINP Novosibirsk, May 25-30, 2008
54
Parameter \ Transducer Type Units V310-RU Panametric
H10 KB 3 Krautkraemer
Central frequency MHz 5.0 10.0
Bandwidth % >70 <40
Transducer diameter mm 6.35 5.0
Beam spread angle α/2 Degree
(rad)
1.365
(0.0243 )
0.884
(0.0154)
near/far distance N mm 33.6 41.7
Unfocused immersion transducer parameters Table 1
NANOBEAM 2008

A.Chupyra, BINP Novosibirsk, May 25-30, 2008
55
A simplified view of a sound beam for flat transducer
)/(514.0)2/( fDVSin
.
(The coefficient corresponds to - 6dB intensity decreasing)
NANOBEAM 2008

A.Chupyra, BINP Novosibirsk, May 25-30, 2008
56
TDC-GP1 of ACAM Corp. Time-To-Digital Converter -- central chip of the ULS electronics.
The main features of TDC-GP1:• 2 measuring channels with up to four independent “Stops” per channel• Typical resolution of 250ps;• Typical resolution of 125ps for mode with one channel; • Nonius method in one channel mode. The result is the sum of different
finecount and coarsecount counters; • 4-fold multi-hit capability per channel, double pulse resolution typ. 15ns• retriggerable;• 2 measurement ranges => a: 2 ns -7.6 µs => b: 60 ns-200 ms;• The 8 events of the two channels can arbitrarily be measured against one
another;• Variable edge sensitivity of the measuring inputs;• Internal ALU for the calibration of the measurement result. • Extremely low power consumption.
NANOBEAM 2008

A.Chupyra, BINP Novosibirsk, May 25-30, 2008
57
Nonius Mode of TDC-GP1
The mode of TDC operation “Measurement Range 2” :
Only 1 channel is available with :
4 possible STOPs in normal resolution (250 ps)
3 possible STOPs in high resolution (125 ps)
In our case we have to measure three time intervals
(three Stops against one Start).
NANOBEAM 2008

A.Chupyra, BINP Novosibirsk, May 25-30, 2008
58
Since 2001 year BINP took part in development and fabrication of Hydrostatic Level Sensors in the network of team-work with FNAL and SLAC. At the beginning BINP developed capacitive HLS sensors and then in 2005 ultrasonic HLS sensors.
During last 7 years more then 200 sensors of both type were fabricated and delivered to FNAL and SLAC.
NANOBEAM 2008
A.Chupyra, BINP Novosibirsk, May 25-30, 2008
59
BINP HLS Sensors installed at SLAC (August 2006)
Installed on site at SPEAR3 (5 Sensors, 1 Year)
and Babar (1st Generation, 6 Sensors, 3-4 Years),
Sector 10 (4 “first article” sensors, 2 months)
NANOBEAM 2008