Achieving Quality and Compliance Excellence in Pharmaceuticals
42
-
Upload
alicia-tebar -
Category
Healthcare
-
view
1.123 -
download
3
Transcript of Achieving Quality and Compliance Excellence in Pharmaceuticals


Achieving Quality and Compliance Excellence in
Pharmaceuticals
A Master Class GMP Guide
Edited by
Madhu Raju Saghee Corporate Quality
Gland Pharma Limited &
Director – Indian Region Pharmaceutical and Healthcare Sciences Society (PHSS)
Sample Chapter for Promotion© Business Horizons. All Rights Reserved.

ii Achieving Quality and Compliance Excellence in Pharmaceuticals
Published by - BUSINESS HORIZONS
G – 59, Masjid Moth, GK – 2 New Delhi – 110 048, INDIA www.businesshorizons.com [email protected] First Edition - 2012 © 2012 by BUSINESS HORIZONS All rights reserved. No part of this publication may be reproduced, stored in a retrieval system, or transmitted, in any form or by any means, without prior written permission from the publisher. ISBN 978-81-906467-8-9 Printed by - Artz and Printz, New Delhi ([email protected])
Sample Chapter for Promotion© Business Horizons. All Rights Reserved.

Achieving Quality and Compliance Excellence in Pharmaceuticals iii
DEDICATION
To P.V.N Raju An eminent entrepreneur, industrialist and chairman of Gland Pharma with 50 years experience in Pharmaceutical Industry who held various positions in various professional bodies and whose vision, dynamism and leadership about the health care business are inspirational to younger professionals like me.
&
To Dr. Tim Sandle
An illustrious microbiologist and the force behind my success in professional life.
Sample Chapter for Promotion© Business Horizons. All Rights Reserved.

iv Achieving Quality and Compliance Excellence in Pharmaceuticals
ABOUT THE EDITOR Madhu Raju Saghee is working in corporate quality department at Gland Pharma, a producer of small volume parenterals located in Hyderabad, India. In this position, he is responsible for implementing a robust quality system, ensuring regulatory compliance and involved in qualification and validation of sterile and aseptic manufacture for parenterals. His areas of expertise include all aspects of quality and compliance for systems, processes, facilities and operations for drug products, particularly for sterile products. Madhu is also a volunteer for Pharmaceutical and Healthcare Sciences Society (PHSS) and acts as Director for Indian region. Madhu has written many articles pertaining to regulatory compliance, quality assurance, quality risk management, cleanroom contamination control and microbiology. Madhu is the co-editor of the books “Microbiology and Sterility Assurance in Pharmaceuticals and Medical Devices” and “Cleanroom Management in Pharmaceuticals and Healthcare.” Madhu has a Master of Science in Microbiology from Andhra University. He is an active member of various industry associations, including PDA, PHSS and ISPE. Madhu runs an online compliance blog http://cgmpcompliance.blogspot.in and he can be reached at [email protected]
Sample Chapter for Promotion© Business Horizons. All Rights Reserved.

Achieving Quality and Compliance Excellence in Pharmaceuticals v
ABOUT THE AUTHORS Ajit Basrur Ajit Basrur is an experienced quality professional in Pharmaceutical and Medical Devices with sound knowledge on FDA, European regulations, ISO 9001, ISO 13485, ISO 14971 and other related guidelines. His core strengths are Audit and Compliance, Root Cause Analysis using Problem solving tools, Training and managing customer and supplier relationships. He has a rich Asian working experience across India, China and Singapore - currently at Nypro Healthcare as the Global Director – Quality & Regulatory Affairs (Asia) based in China, he has worked with Schering Plough, Singapore in the past for nearly 5 years. In his current role at Nypro Healthcare, he is responsible for the quality and regulatory affairs function for medical devices across 3 plants in China and 1 in India for the last 6 years. He is also globally responsible for Drug Master Files for Nypro. In addition, he has also worked with leading Pharmaceutical organizations like Fulford India, Sanofi and Dr Reddy’s in India for over 15 years. Ajit is passionately involved with Elsmar Cove, a website to provide responses to questions raised on quality systems, where he specifically focuses on Pharmaceuticals and Medical Devices. Ajit can be reached at [email protected] Alicia Tébar Alicia Tébar is the Managing Partner of Development Team Consulting dTC and provides consulting services and training to pharmaceutical companies. Alicia has over 20 years experience in pharmaceutical industry as quality control and analytical development manager. She is qualified as a Six Sigma Black Belt and lead projects on process improvement in manufacturing areas. She is a strong believer of Quality by Design paradigm and since 2004 she has been involved in implementation projects as an external support to train manufacturing and development staff in QbD/PAT tools like risk analysis, design of experiments and statistics. Since 2006 she has been blogging on Quality by Design http://www.qbd-dtc.com/ in Spanish. She is a habitual lecturer and trainer and has also published some technical articles on specialized magazines. She is a member of the Board of Directors of ISPEs Spanish Chapter. Alicia holds a B.S. Chemistry at the University of Barcelona and a postgraduate in environmental engineering. She can be reached at [email protected] Alok Ghosh Alok Ghosh is the President – Technical Operations of Lupin Limited, Mumbai, India. Alok has a Masters in Pharmacy from Javavpur University, Kolkata and has more than three decades of experience in R&D, Quality Management, Technology Transfer, Projects and Manufacturing.
Sample Chapter for Promotion© Business Horizons. All Rights Reserved.

vi Achieving Quality and Compliance Excellence in Pharmaceuticals
Alok has worked with leading Pharmaceutical Companies, both in India and abroad. In his present capacity, he is responsible for Lupin’s Global Manufacturing, Quality Management, Technology Transfer and new Project implementation. Alok is a member of board of studies in Applied Pharmaceutical Sciences with Narsee Monjee Institute of Management Studies (NMIMS), Mumbai, India and in the committee of TB care and control in India constituted by SEARPharm Forum, India. Areta Kupchyk Areta L. Kupchyk is a partner with Nixon Peabody LLP who provides counsel to clients on the U.S. Food and Drug Administration (FDA) regulation of drug, medical device, biotechnology, and biologic products. Formerly an Associate Chief Counsel for Drugs and Biologics and Assistant General Counsel for Litigation at the FDA, Ms. Kupchyk advises clients on post-approval compliance and enforcement matters such as adverse event reporting, initiating and managing recalls, responses to 483s and warning letters, cGMP inspections, import/export requirements, and other issues. Additionally, she assists clients with internal investigations and developing corrective measures in response to suspected wrongful conduct, and supports litigation with the FDA involving the Administrative Procedure Act (APA), corporate matters and transactions, regulatory due diligence, and product liability actions. Ms. Kupchyk also specializes in the FDA regulation of advertising and promotional activities, including FDA’s restrictions on off-label use. In addition, Ms. Kupchyk is a regular presenter at FDA in their CDER new employee training programs. Ms. Kupchyk has received numerous awards for her work, and has been listed as a leading lawyer in biotechnology law by The Best Lawyers in America since 2008. During her time at the FDA, she was a three-time recipient of the FDA Commissioner’s Special Citation for Outstanding Achievement, and was recognized for her role in developing a regulatory framework for human cellular and tissue-based products, and FDA guidance on pharmaceuticals produced with bioengineered plants. Atul Shirgaonkar Atul shirgaonkar is the CEO of Insight Systems Inc. an 18 years old, value based GMP resource firm in India. Insight Systems is pioneer and engaged in GMP training, audits and documentation. Atul also works as course director with Insights Professional Management Academy firm engaged in offering distant learning courses in GMP. He is a visiting faculty member for several pharmacy colleges and management institutes. Atul completed Masters in Pharmacy from Haffkine Institute Mumbai in Regulatory toxicology supported with Diploma in Business and Marketing Management from IITC, Mumbai. Also completed Diploma in Training and Development from ISTD, Delhi and carries a rich experience of working in the Pharma industry in various disciplines and capacities for nineteen years. Atul
Sample Chapter for Promotion© Business Horizons. All Rights Reserved.

Achieving Quality and Compliance Excellence in Pharmaceuticals vii
has conducted more than one thousand seven hundred fifty (1750+) training programmes till date in functional, technical and behavioural aspects of management and more than 100 GMP audits. A popular trainer and has traveled all over the country and overseas to train more than 40,000 participants (from nineteen countries as well ) as on date. Presented views on pharmaceutical quality aspects at different national and international symposia. Also, a meticulous and in-depth auditor, documentation and GMP resource to various leading multinational firms in India and overseas. Atul can be reached at [email protected] and URL - www.insightcgmp.com. A.V. Prabhu Dr. Ananth Prabhu is a graduate of the then Bombay University. After graduation he proceeded to Kansas University, Kansas, USA for his doctoral degree and then did his post doctoral research for 2 years at Georgia Institute of Technology, Atlanta, Georgia. On his return back to India, he briefly worked in the development laboratories of Colgate Palmolive India Ltd, before he moved to the pharmaceutical Industry and worked for 25 years, both in the primary and secondary manufacturing. He worked for Glaxo-Wellcome, Boots.Knoll and Abbott and retired from Arch Pharma Labs. After his retirement in 2007, he became a GMP Consultant to several pharmaceutical companies. He carried out pre approval regulatory (MHRA, US FDA, and EMA) audits for several companies and helped them rectify deficiencies observed during these audits. Subsequently these companies were successful in the regulatory inspection that followed. He also conducted several training programmes for companies as per their requirements. He also taught synthesis of drugs, for several years, for the M.Pharm degree students at Bombay College of Pharmacy, Kalina.He was an examiner both at graduate and under graduate examinations in Pharmacy conducted by SNDT.Manipal College of Pharmacy, and Mumbai University. He co-authored a book on” Synthesis of Drugs—A Synthon Approach” which was very well received by the Indian pharmacy teaching fraternity He was a member of the Indian Pharmacopoeia 1986 and also has contributed substantially, along with other experts from the Indian Pharma Industry, in developing the new Schedule M of the Indian Drugs Act. Currently he is a visiting faculty at the NMIMS College for the management degree in pharma marketing and M.Pharm degree in QA & Regulatory at Manipal College of Pharmacy and a consultant to 2 US pharmaceutical companies for their operations in India., besides to 2 other Indian Companies Brian Szukala Brian Szukala is the Managing Director of Transfer Knowledge Partners. Brian has over 20 years experience in the pharmaceutical industry, several as UK Head of Training for two of the world’s most successful pharmaceutical companies (Pfizer and Abbott Laboratories). He has been actively involved in the implementation of cultural change programmes, incorporating
Sample Chapter for Promotion© Business Horizons. All Rights Reserved.

viii Achieving Quality and Compliance Excellence in Pharmaceuticals
competency based performance management, values based leadership through to performance improvement initiatives (e.g. Lean Six Sigma, Class A MRPII, behavioural safety). Brian has designed and delivered courses in leadership, performance improvement, health and safety and other compliance topics. Brian also has global experience of developing company training standards and has been involved with several UK public service bodies (eg Sector Skills Councils, NVQ Awarding Bodies, Skills Academies) in helping to identify workforce development needs and supporting initiative implementation across industry. Presented at numerous seminars across the globe on a variety of performance improvement subjects, logistics topics and pharmaceutical compliance issues. Designed, developed and delivered numerous training courses and the originator of the concept of behavioural Good Manufacturing Practice (bGMP®) and behavioural Good Pharmaceutical Practices (bGxP®). Brian can be reached at [email protected] David Markovitz David Markovitz is the Founder and President of GMP Training Systems, Inc., (www.GMPTrainingSystems.com) a top tier provider of GMP training products and services. David can be reached at [email protected] David Stephon David M. Stephon has more than 25 years of experience in the pharmaceutical industry with in depth experience in regulatory compliance and quality management systems. His experience includes senior management positions in quality assurance at several pharmaceutical companies where he has been responsible for design and implementation of GxP training programs, design and implementation of GxP vendor/CRO assessment programs, six sigma and modern quality management system design, review and assessment of global regulatory filings and coordination of preparation activities for GCP and GMP pre-approval FDA field inspections. His most recent position in industry was Senior Vice President, Quality Management at Onconova Therapeutiucs Inc. where he was responsible for GCP, GLP and GMP quality management operations. Prior to that, Dave served as the Vice President of Quality Management for Adolor Corporation. In 2010, Dave started his own pharmaceutical quality management consulting company, David M. Stephon Consulting, LLC, www.fdagxpconsultant.com. Dave has served as an Editorial Advisory Board member for the Journal of GxP Compliance, Institute for Validation Technology, as well as serving currently as an EAB member for the FDA Compliance Digest and has published numerous articles on a wide variety of quality assurance and regulatory compliance topics and maintains memberships in PDA, ISPE, AAPS, ASQ and SQA. He has presented numerous seminars on a wide variety of GxP topics to the pharmaceutical industry across North America, Europe and the Middle East. In 2002, Dave received an Industry Recognition Award from the Institute of Validation Technology.
Sample Chapter for Promotion© Business Horizons. All Rights Reserved.

Achieving Quality and Compliance Excellence in Pharmaceuticals ix
Janet Gough Janet Gough assists companies in designing and implementing document management systems for compliance with 21 CFR Part 11 and the predicate rules. She helps prepare documentation, including standard operating procedures, research and development reports, regulatory submissions, and journal articles. She trains staff in English as a second language and technical and medical writing. She has been a director of technical communications for a biotechnical company, and has taught English in university graduate and undergraduate programs. She has authored over 35 journal articles and the following books: Managing the Document Maze, Answers to Questions You Didn’t Even Know to Ask; Write It Down: Guidance for Preparing Effective and Compliant Documentation, editions 1 and 2; Electronic Record Keeping: Achieving and Maintaining Compliance with 21 CFR Part 11 and 45 CFR Parts 160, 162, and 164; Risk-Based Software Validation: Ten Easy Steps, editions 1 and 2; Hosting A Compliance Inspection; The Internal Quality Audit; and The External Quality Audit. She is a contributing author to the Clinical Trial Manual from Euromed Publications. You can reach her at [email protected] Jerry Lanese Dr. Jerry Lanese is president of The Lanese Group, an international pharmaceutical industry consultant who has a Ph.D. in Analytical Chemistry from the University of Michigan. He began his career teaching Analytical Chemistry at college level. He moved to industry where he has gained more than 30 years of quality control, quality assurance and analytical research experience in the pharmaceutical industry. He has worked in large and small pharmaceutical firms managing Analytical Research & Development and QA & QC functions. Dr. Lanese was the quality representative on the team that started manufacturing operations in Puerto Rico for a major pharmaceutical firm. For the past 17 years, he has been a consultant in the drug and medical device industries focusing on laboratory activities, performing quality assessments and helping both small and large firms to achieve a higher level of compliance. Dr. Lanese has been part of several teams working with firms under consent decree. Dr. Lanese is a member of the ASQ and the Editorial Advisory Board of Journal of GXP compliance. John E. Lincoln John E. Lincoln, president and principal consultant of J. E. Lincoln and Associates LLC, which is a management consulting company specializing in regulatory affairs and quality issues pertaining to medical devices, pharmaceuticals / drugs, and nutraceuticals. He has over 30 years’ experience serving U.S. FDA-regulated industries, 16 of which as president of his own consulting company. John has worked with companies from start-up to Fortune 100 in the U.S., Mexico, Canada, France, Germany, China, and Taiwan. He specializes in client culture/systems change, in product to market, defect and cycle time reduction, software documentation / validation, quality/regulatory management, product clearance / 510(k)s, and regulatory issues remediation and resolution.
Sample Chapter for Promotion© Business Horizons. All Rights Reserved.
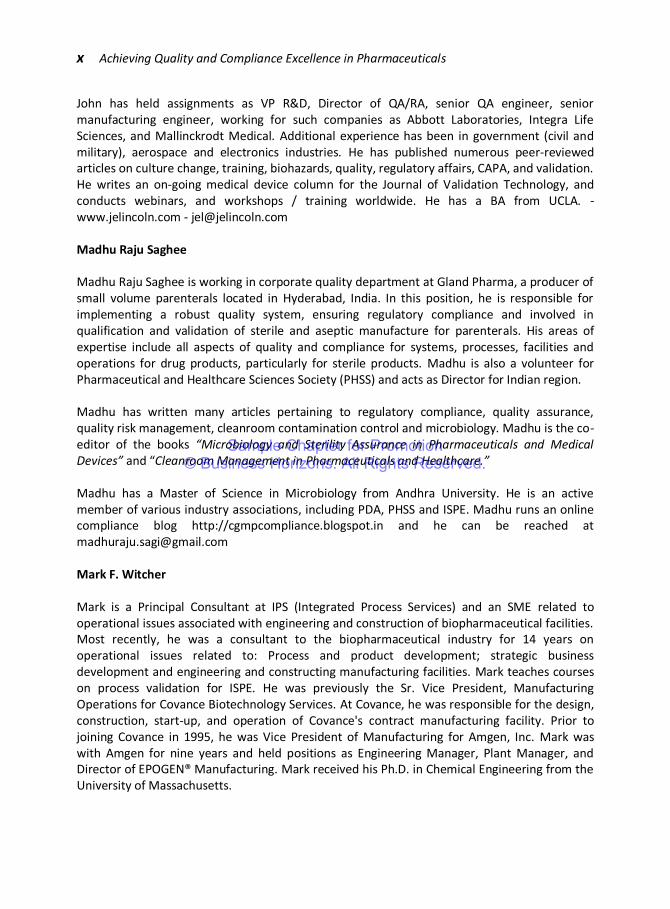
x Achieving Quality and Compliance Excellence in Pharmaceuticals
John has held assignments as VP R&D, Director of QA/RA, senior QA engineer, senior manufacturing engineer, working for such companies as Abbott Laboratories, Integra Life Sciences, and Mallinckrodt Medical. Additional experience has been in government (civil and military), aerospace and electronics industries. He has published numerous peer-reviewed articles on culture change, training, biohazards, quality, regulatory affairs, CAPA, and validation. He writes an on-going medical device column for the Journal of Validation Technology, and conducts webinars, and workshops / training worldwide. He has a BA from UCLA. - www.jelincoln.com - [email protected] Madhu Raju Saghee Madhu Raju Saghee is working in corporate quality department at Gland Pharma, a producer of small volume parenterals located in Hyderabad, India. In this position, he is responsible for implementing a robust quality system, ensuring regulatory compliance and involved in qualification and validation of sterile and aseptic manufacture for parenterals. His areas of expertise include all aspects of quality and compliance for systems, processes, facilities and operations for drug products, particularly for sterile products. Madhu is also a volunteer for Pharmaceutical and Healthcare Sciences Society (PHSS) and acts as Director for Indian region. Madhu has written many articles pertaining to regulatory compliance, quality assurance, quality risk management, cleanroom contamination control and microbiology. Madhu is the co-editor of the books “Microbiology and Sterility Assurance in Pharmaceuticals and Medical Devices” and “Cleanroom Management in Pharmaceuticals and Healthcare.” Madhu has a Master of Science in Microbiology from Andhra University. He is an active member of various industry associations, including PDA, PHSS and ISPE. Madhu runs an online compliance blog http://cgmpcompliance.blogspot.in and he can be reached at [email protected] Mark F. Witcher Mark is a Principal Consultant at IPS (Integrated Process Services) and an SME related to operational issues associated with engineering and construction of biopharmaceutical facilities. Most recently, he was a consultant to the biopharmaceutical industry for 14 years on operational issues related to: Process and product development; strategic business development and engineering and constructing manufacturing facilities. Mark teaches courses on process validation for ISPE. He was previously the Sr. Vice President, Manufacturing Operations for Covance Biotechnology Services. At Covance, he was responsible for the design, construction, start-up, and operation of Covance's contract manufacturing facility. Prior to joining Covance in 1995, he was Vice President of Manufacturing for Amgen, Inc. Mark was with Amgen for nine years and held positions as Engineering Manager, Plant Manager, and Director of EPOGEN® Manufacturing. Mark received his Ph.D. in Chemical Engineering from the University of Massachusetts.
Sample Chapter for Promotion© Business Horizons. All Rights Reserved.

Achieving Quality and Compliance Excellence in Pharmaceuticals xi
Michael Hopper Michael is the managing Director of GxPpro Ltd who are based in the UK but provide consultancy and training across the globe. Having worked for Pfizer for over 30 years, prior to starting GxPpro, Michael has a wealth of experience of operating within both API and Drug product facilities. Initially having spent several years in Quality Control and Quality Assurance, Michael gained valuable experience in senior roles in both Human Resources and business Development, working on many local and global projects. Leading GMP learning and Development for Pfizer in the UK was the last role undertaken, where a 5 year plan was developed and delivered which incorporated knowledge and skills as well as behaviours. Passionate about people and developing systems and teams has enabled a pragmatic approach to be taken when working with client organisations, culminating in value added outcomes for all stakeholders. As well as managing his own consultancy, Michael works with a specialist Awarding Organisation in the UK and has written technical certificates for inclusion in the UK apprenticeship framework for Laboratory Analysts as well as conducting regular audits of NVQ centres throughout the UK and Ireland. For further information please visit: www.gxppro.co.uk or contact Michael directly via email: [email protected] Mitch Manning Mitchell W. Manning, Sr. is the Chief Priorities Officer, Priorities Limited. Mitch is a Glaxo-Wellcome retiree (now GlaxoSmithKline). Positions held during his career are: Lead Chemical Processor, Senior Validation Specialist, Section Head of Employee Involvement (Project Teams), and Section Head of Regulatory and Technical Training. He helped develop the criteria for the Malcolm Baldridge National Quality Award and served two times as an Examiner for the award. He also served two times as an Examiner for the President's Quality Prototype Award. Additional information is available on LinkedIn. Nandkumar Chodankar Nandkumar is currently “Group CEO- Pharma Business” of Excel Group of Industries (Mumbai) assisting Excel group of companies to design and install pharmaceutical manufacturing plant and develop Pharmaceutical business. He is the Ex CEO & MD and shareholder of Sekhsaria Chemicals Ltd (which was later acquired by Watson Pharmaceuticals USA). He served as President of the API division, which included responsibility for the Watson API plants in India, China and Taiwan. He was appointed as a Chair Person for New Product Selection Global Committee. He serves on the Board of IFPRESS India, Sastra University, ASolution Pvt. Ltd. and has been cited in the WHO’s WHO, won several prestigious awards, published number of patents and
Sample Chapter for Promotion© Business Horizons. All Rights Reserved.

xii Achieving Quality and Compliance Excellence in Pharmaceuticals
scientific articles and continues to conduct management training programs and participates in several National as well International Conferences as a speaker, moderator and Chair person. Nandkumar supports his better half, Dr. Laxmi as a partner in Exmore Chemicals and as a Director at ASolution Pharmaceutical Pvt. Ltd. that is currently involved in Research and Development and pilot scale manufacturing of Drug products, APIs and specialty products. Nandkumar has been a volunteer of Drug Information Association (DIA) since in 1995 and he and his wife Laxmi Chodankar (Ph D) worked together and organized first DIA conference in India at Mumbai, participated in number of Annual DIA Conferences in the US, as a speaker and as a session chair in three Annual US Conferences and many conferences in India. He served as a DIA Global Board Member and Chair of Advisory Council of India (ACI) since 2008-11 and continues as an immediate past chair and member of ACI of DIA. He is involved in many Associations in India and abroad like ISPE, IDMA, IPA, etc. He continues as an Examiner and Reviewer of M Sc and Ph D Tech Thesis of Chemical Technology and Pharmaceutical Sciences students. Nandkumar has Doctorate (Ph D) in Chemical Technology from University Department of Chemical Technology (UDCT now ICT) Mumbai. Nilanjana Basu Nilanjana Basu is the Deputy General Manager in Corporate Quality Assurance of Lupin Limited, Mumbai, India. Nilanjana is heading the Technical Training Vertical for all the eight manufacturing plants of Lupin in India. Nilanjana has a Masters in Pharmacy from Jadavpur University, Kolkata and she also is an MBA from Calcutta University, Kolkata. Nilanjana has over 15 years of experience in Quality Assurance function and has worked in different capacities at various leading Pharmaceutical companies in India. At her present capacity, Nilanjana has been instrumental in setting up the Technical Training vertical in Lupin Limited and also has led the successful deployment of electronic Learning Management System in the organization. R. Raghunandanan R. Raghunandanan holds a Masters Degree in Organic Chemistry. He worked with GlaxoSmithKline Pharmaceuticals Limited, for more than 32 years and retired in November 2007 as Vice President – Quality (South Asia). During his tenure he held several responsible positions with increasing responsibilities at the various manufacturing Quality units as well as the Corporate Quality function of GlaxoSmithKline in India and the South Asia region. He actively participated in several international training workshops organized by GlaxoSmithKline in the areas of Aseptic Processing, Quality Audits, Process Validation, Microbiology, Total Quality Management, Lean Sigma, Leadership Edge, etc. He represented the region in GSK’s Global Quality Committee for several years, the then apex body for formulating GMP and Quality standards. He is currently a Director on the Board of International Society for Pharmaceutical Engineering, (ISPE) India Affiliate and the founder member of the Steering Committee for the ISPE
Sample Chapter for Promotion© Business Horizons. All Rights Reserved.
Achieving Quality and Compliance Excellence in Pharmaceuticals xiii
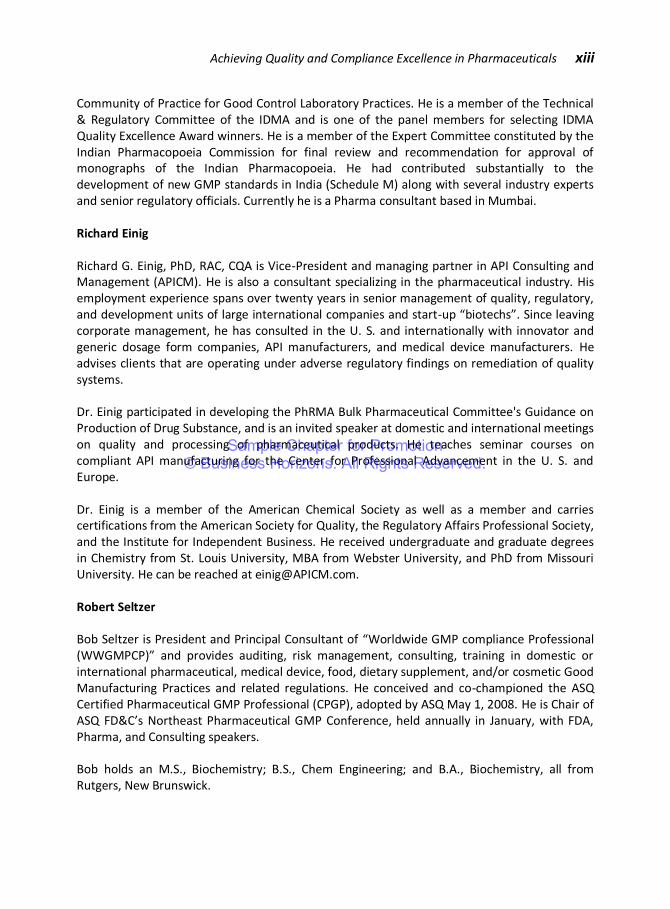
Community of Practice for Good Control Laboratory Practices. He is a member of the Technical & Regulatory Committee of the IDMA and is one of the panel members for selecting IDMA Quality Excellence Award winners. He is a member of the Expert Committee constituted by the Indian Pharmacopoeia Commission for final review and recommendation for approval of monographs of the Indian Pharmacopoeia. He had contributed substantially to the development of new GMP standards in India (Schedule M) along with several industry experts and senior regulatory officials. Currently he is a Pharma consultant based in Mumbai. Richard Einig Richard G. Einig, PhD, RAC, CQA is Vice-President and managing partner in API Consulting and Management (APICM). He is also a consultant specializing in the pharmaceutical industry. His employment experience spans over twenty years in senior management of quality, regulatory, and development units of large international companies and start-up “biotechs”. Since leaving corporate management, he has consulted in the U. S. and internationally with innovator and generic dosage form companies, API manufacturers, and medical device manufacturers. He advises clients that are operating under adverse regulatory findings on remediation of quality systems. Dr. Einig participated in developing the PhRMA Bulk Pharmaceutical Committee's Guidance on Production of Drug Substance, and is an invited speaker at domestic and international meetings on quality and processing of pharmaceutical products. He teaches seminar courses on compliant API manufacturing for the Center for Professional Advancement in the U. S. and Europe. Dr. Einig is a member of the American Chemical Society as well as a member and carries certifications from the American Society for Quality, the Regulatory Affairs Professional Society, and the Institute for Independent Business. He received undergraduate and graduate degrees in Chemistry from St. Louis University, MBA from Webster University, and PhD from Missouri University. He can be reached at [email protected]. Robert Seltzer Bob Seltzer is President and Principal Consultant of “Worldwide GMP compliance Professional (WWGMPCP)” and provides auditing, risk management, consulting, training in domestic or international pharmaceutical, medical device, food, dietary supplement, and/or cosmetic Good Manufacturing Practices and related regulations. He conceived and co-championed the ASQ Certified Pharmaceutical GMP Professional (CPGP), adopted by ASQ May 1, 2008. He is Chair of ASQ FD&C’s Northeast Pharmaceutical GMP Conference, held annually in January, with FDA, Pharma, and Consulting speakers. Bob holds an M.S., Biochemistry; B.S., Chem Engineering; and B.A., Biochemistry, all from Rutgers, New Brunswick.
Sample Chapter for Promotion© Business Horizons. All Rights Reserved.

xiv Achieving Quality and Compliance Excellence in Pharmaceuticals
Roger Janczak Roger Janczak is Director, Continuous Improvement, at Abbott. Abbott is a diverse pharmaceutical and medical device corporation. In his role in the global Quality and Regulatory group he is responsible for the Management Controls, CAPA and Complaints and Quality Systems. Currently, he manages programs including Executive Management Reviews, leading edge CAPA system, quality internal business data intelligence, scorecard reporting, and others. Janczak developed a ten-year strategic plan for global R&D facilities including pharmaceutical discovery, dosage form development and pre-clinical animal studies. He has held a variety of management roles over the last 25 years at Abbott in both the US and abroad for both pharmaceutical, medical products in quality, operations and R&D. He earned a bachelor’s degree in mechanical engineering and master’s degree in business administration. Sanjit Singh Lamba Sanjit Singh Lamba is the Managing Director of Eisai Knowledge Centre, India, a 100% subsidiary of Eisai Co., Ltd, Japan. With more than 23 years of pharmaceutical industry experience, he has proven adaptability with multi-cultural corporate environments while working with multinational pharmaceutical companies including Pfizer, Merck Sharp and Dohme, Lupin and Ranbaxy in various disciplines including Global Manufacturing, Projects, Drug Regulatory Affairs, Global procurement and Supply Chain Management etc. He possesses a Master’s degree in Pharmaceutical Technology and is currently pursuing his PhD. He has undergone a successful leadership program at Kellogg School of Management, Northwestern University, USA. He is a member of the Parenterals Expert Committee constituted by the Indian Pharmacopoeia commission for final review and recommendation for approval of monographs of the Indian Pharmacopoeia. He is associated with professional bodies like Indian Pharmaceutical Association and Parental Drug Association. He is currently a Director on the Board of International Society for Pharmaceutical Engineering, India Affiliate. He can be reached at [email protected] Tim Sandle Dr. Tim Sandle is the Head of Microbiology at the UK Bio Products Laboratory. His role involves overseeing a range of microbiological tests, batch review, microbiological investigation and policy development. In addition, Tim is an honorary consultant with the School of Pharmacy and Pharmaceutical Sciences, University of Manchester and is a tutor for the university’s pharmaceutical microbiology MSc course. Tim is a chartered biologist and holds a first class honors degree in Applied Biology; a Masters degree in education; and a PhD in the safety testing of blood products. Tim serves on several national and international committees relating to pharmaceutical microbiology and cleanroom contamination control (including the ISO cleanroom standards), and he has acted as a spokesperson for several microbiological societies. He is a committee
Sample Chapter for Promotion© Business Horizons. All Rights Reserved.

Achieving Quality and Compliance Excellence in Pharmaceuticals xv
member of the UK and Irish microbiology society Pharmig and editor of its newsletter. Tim has written over one hundred and fifty book chapters, peer reviewed papers and technical articles relating to microbiology, this includes co-editor of the books “Microbiology and Sterility Assurance in Pharmaceuticals and Medical Devices” and “Cleanroom Management in Pharmaceuticals and Healthcare”. In addition, Tim runs an on-line microbiology blog (http://www.pharmig.blogspot.com)
Sample Chapter for Promotion© Business Horizons. All Rights Reserved.

xvi Achieving Quality and Compliance Excellence in Pharmaceuticals
CONTENTS 1 Fundamentals of Global GMP Requirements
by Atul Shirgaonkar 1
2 Effective CAPA Management for Optimal Compliance
by Michael Hopper 39
3 Laboratory Compliance and Handling Out-of-Specification (OOS) Results in the
Laboratory by John Lanese and A.V. Prabhu
67
4 Effectively Incorporating Quality Risk Management into Quality Systems
by Tim Sandle and Sanjit Singh Lamba 89
5 Monitoring and Controlling Process Drift for Enhancing Quality
by Nandkumar Chodankar 129
6 Qualification and Validation
by Tim Sandle 169
7 Process Validation
by Mark F. Witcher 207
8 Documents, Records, and Part 11 Compliance
by Janet Gough 251
9 Change Control and Management
by R. Raghunandanan 287
10 Deviation Management
by Alicia Tébar Pérez 295
11 Internal Quality Assessments/Self-Audits
by R. Raghunandanan 317
12 Designing an Effective GMP Training Program
by David Markovitz 325
13 Behavioural GMPS (bGxP®): A New Paradigm in Compliance Management
by Brian Szukala 349
Sample Chapter for Promotion© Business Horizons. All Rights Reserved.

Achieving Quality and Compliance Excellence in Pharmaceuticals xvii
14 Supplier Quality Management
by Ajit Basrur and David Stephon 381
15 Understanding the United States Pharmacopeia (USP)
by Robert D. Seltzer 417
16 Spotting Overall Weak GMP Compliance Systems
by Robert D. Seltzer 431
17 Meaningful Performance Metrics for Compliance
by Roger Janczak 459
18 Implementing ICH Q 10: A Pragmatic Approach
by Alok Ghosh and Nilanjana Basu 479
19 Compliance Aspects of APIs Manufacturing
by Richard Einig 497
20 Compliance Aspects of Sterile Manufacturing
by Tim Sandle and Madhu Raju Saghee 517
21 Domestic and International U.S. Food and Drug Administration (FDA)
Inspections by Robert D. Seltzer
561
22 Avoiding FDA Enforcement Actions: An Optimal and Sustainable Compliance
Program by Areta Kupchyk
567
23 Developing a Master QMS Plan
by John E. Lincoln 581
24 Trends in cGMP Compliance
by Mitch Manning 629
Index 641
Sample Chapter for Promotion© Business Horizons. All Rights Reserved.
xviii Achieving Quality and Compliance Excellence in Pharmaceuticals
FOREWORD The publication of this comprehensive guide comes at a most opportune time. The pharmaceutical industry has long been perceived as being split between Western and Eastern hemispheres, i.e. into advanced, high-value and into more basic low-cost regions. This picture is no longer accurate, as many companies outside the USA and European Union have established industry best practices and leading edge technology. Thus, a variety of countries in Asia, the Middle East and Central/South America have become providers of innovative, research-based pharmaceutical products that compete with the best in the world. The changing regulatory environment encourages a risk-based and performance-governed compliance approach based on an agile quality framework. Such an approach is fundamental to maintaining competitiveness, irrespective of location and cost base. This book not only encourages and details the application of these modern quality paradigms in a single guide, it is also an aide and an encouragement for those in industry who wish to learn from the best, continually improve, embrace advancement of science and benchmark themselves. The high calibre of the authors and the diligence of the editor assure comprehensive, current and exceedingly high quality of the contents. I am certain that this publication will be read with great interest and pleasure, and put to good use by many in the industry.
Siegfried Schmitt, PhD
PARAXEL, UK
Sample Chapter for Promotion© Business Horizons. All Rights Reserved.

Achieving Quality and Compliance Excellence in Pharmaceuticals xix
PREFACE Compliance and pharmaceuticals have a long association, although the development of each of these has been at a different pace. Pharmaceuticals and other health care products came first and whilst there was a concern with both the safety of the patient and proving the efficacy of the medicine, this was erratic, in varying from drug-to-drug and from country-to-country, and was not codified. In the wake of some appalling incidents which resulted in the deaths of many patients, which were discussed and debated in the mid-part of the twentieth century, two pioneering acts in the USA and the UK, both in the 1960s, led to the formation of what is now known as ‘Good Manufacturing Practices’ (GMP). The collective body of GMP evolved through the 1970s to the 1990s, drawing in aspects of operations management, extending out to drug distribution, and improving upon cleanroom design and operations, to name but a few. Whilst compliance aspects of pharmaceutical drug development and manufacture have been enshrined most notably in the FDA Code of Federal Regulations and with the European Union GMPs, there has always been the dimension of ‘c’ GMP (current Good Manufacturing Practices), a space within which Quality Assurance personnel are required to occupy in order to understand and develop new technologies and ways of working which will enhance the quality of medicinal products. A series of developments in the twenty-first century has pushed this philosophy further and this has been captured within a raft of critical documents, reflecting a new philosophy. These are the FDA’s 21st century initiative and the ICH guidelines focused on quality risk management (ICH Q8, 9, 10 and 11). It is not an over exaggeration to say that these documents, and their philosophical underpinnings, represent a paradigm shift in relation to the quality and compliance of pharmaceuticals, medical devices and healthcare. What underpins these documents is the importance of science based decisions and risk evaluation as the centerpiece of compliance policy and execution. So that quality personnel are better informed as to these changes and are able to place them within the context of the pharmaceutical organization, this book was developed. The idea was to put together something which would be of value to both the experience practitioner and those new to the pharmaceutical sector. For this task a number of leading international experts were approached and all accepted the task of shaping the understanding of twenty-first century compliance and applying it to modern pharma and healthcare. To this end a book has been produced which provides a comprehensive account of all facets of quality and compliance issues in Pharma. One of the key editorial requirements was that each chapter must balance the theoretical with the practical, and thus provide pragmatic advice for the industry.
Sample Chapter for Promotion© Business Horizons. All Rights Reserved.

xx Achieving Quality and Compliance Excellence in Pharmaceuticals
The editor is pleased to note that this task was achieved and he wishes to express his thanks to each of the contributors for taking the time and trouble, and drawing upon many years of experience, to produce unique and detailed chapters. In putting the book together, the editor has not lost sight of the fact that book must, foremost, be of use to the reader. Thus the book provides detail on global GMP, of the key dimensions of quality and quality systems, of training and auditing, and applies these across different sectors, from APIs to steriles. This has led to the creation of a truly global book which will be of use to all working within, or who have an interest in, the world of Pharma.
Madhu Raju Saghee Hyderabad, India
June, 2012
ACKNOWLEDGMENTS I would like to express my deep gratitude to the authors and contributors who have cooperated in preparation of this book amidst their busy work commitments. I am indebted and grateful to Siegfried Schmitt, R. Raghunandanan, Antony Raj Gomes and T. Rajesh for their insights in shaping this book into a master class guide. I would like to thank JPS Kohli for his patience and diligence in the production of this work.
Sample Chapter for Promotion© Business Horizons. All Rights Reserved.

Meaningful Performance Metrics for Compliance 459
17 Meaningful Performance Metrics for Compliance
Roger Janczak, Abbott, USA 17.1 OVERVIEW OF PERFORMANCE METRICS
“Measurement is the first step that leads to control and eventually to improvement. If you can't measure something, you can't understand it. If you can't understand it, you can't control it. If you can't control it, you can't improve it.”
H. James Harrington
Performance metrics are an essential element of the management review process. A well designed set of metrics enables managers to evaluate the performance of their business processes, make decisions based on the evaluation and take action. Quality metrics may include elements such as customer satisfaction, supplier performance, manufacturing defects, complaints, cycle times and many other internal or external processes. This chapter provides a framework for establishing the right quality indicators/metrics for evaluating the performance of the quality system. The primary objective of this chapter is to help the reader in designing appropriate tools that can assess the health of the quality system and to find the problems, ideally before they mature into a quality defect and fix them. An effective leadership team must develop, collect and analyze information that provides current performance feedback, anticipates future needs and enables actions. There are typically, vast amounts of data available in any organization. However, not all of the data has the same value. It must be accurate, timely, appropriate, and correctly analyzed. Data may pose a risk if the wrong things are measured or incorrectly analyzed. The effort needed to measure, collect data, analyze and report must provide business value. Successfully executing a strategic plan requires the development of an appropriate set of metrics. According to Juran1, the development of any measurement system should take into account the following factors:
Sample Chapter for Promotion© Business Horizons. All Rights Reserved.

460 Achieving Quality and Compliance Excellence in Pharmaceuticals
There should be a standardized meaning of the measurement
The data should help the decision making process
It should provide worthwhile information
It should be easy to install
It can be benchmarked or used elsewhere The challenge is selecting metrics that take into account each of these factors appropriately. Sometimes the easy metrics to collect offer little, if any, value while more worthwhile information requires effort to establish a measurement process. For emerging organizations, it is often best to start with a relatively simple set of metrics that can be closely aligned to organizational objectives. These measure the performance of a core set of compliance objectives that can be piloted quickly and iterated rapidly. Performance metrics can be described as the central nervous system of an organization. It is important to understand the intended and unintended consequences of a metrics system on an organization. Dean Spitzer described several key functions of performance measurement2. Accountability – Metrics indicate how well an operation or project is performing against commitments. People can be held accountable to deliver results. An ideal organization uses accountability in a positive manner by focusing on the opportunity to improve. When accountability becomes negative it can drive behaviors associated with avoiding punishment. Alignment – A core objective for a strategy focused organization is to align the entire team on a common set of strategic objectives. Metrics provide the common bond. They can also help avoid self-interest by elevating the objectives to the organizational level. Attention – Metrics incorporated into management review provide a defined set of expectations of senior management and are reviewed regularly. This elevates the importance to meet performance objectives to the entire organization. What gets measured gets done. Behavior – According to Eliyahu Goldratt, author of The Goal, all behavior can be predicted by what is being measured: “tell me how you measure me, and I will tell you how I will behave. Setting the right metrics drives the right behavior. Expectations – Metrics allow an entire organization a common understanding of what outcomes are most valued by leadership. This clarity enables people to stay focused on long term objectives on a daily basis. Feedback – Metrics provide short and long term feedback on the effectiveness of projects and activities. This supports fine tuning implementation plans and supports continuous improvement. Metrics provide the feedback that enables faster responses to changing or emerging issues.
Sample Chapter for Promotion© Business Horizons. All Rights Reserved.

Meaningful Performance Metrics for Compliance 461
Motivation – People like knowing their efforts are worthwhile. Metrics provide short and long term measurement of progress. They provide an orient point as people navigate continuous improvement. Reaching those interim milestones can be highly motivating. Objectivity – Metrics form the basis for a fact-based organization. This objectivity promotes a positive environment within an organization. It demonstrates their achievements and highlights the contributions made toward long-term business objectives. Problem Solving – Metrics enable management to uncover problems earlier. They provide early warning indicators to avoid a crisis situation. There can be increased visibility of small changes in performance that if unchecked grow into much bigger problems. Visibility – A common set of metrics used throughout an organization creates transparency. It enables senior management better insight to the inner workings of their business processes. 17.2 PRINCIPLES OF ESTABLISHING PERFORMANCE METRICS FOR COMPLIANCE
“You measure your organizational capability by asking the right questions” 3 Larry Bossidy and Ram Charan
When creating a performance measurement system, it can be helpful to begin with the end in mind. Think about the entire process from acting on the metric backwards to the data itself. Make sure there is an understanding of
The reason for collecting the metric. How will it be used? By whom? How will the results be communicated the information gained from the metrics to all stakeholders?
Analysis needed to transform the data into useful information. What data transformations are needed? Who will perform them? What tools (software) are needed? What are the validation requirements?
The process to collect the data. How will data be collected? By whom? Where will the records be stored (paper and electronic)?
What is the data that you need? To fully characterize a quality system, hundreds of metrics are possible. Establishing a large number of metrics in the hope of finding some that work wastes resources and distracts leaders. Implementation of too many metrics may not result in a compliant quality system and may actually impede quality progress. Metrics must be carefully chosen to ensure they align with strategy. Many organizations have implemented strategy frameworks such as the Balanced Scorecard described in the The Strategy Focused Organization
4. In a high performing
organization, what gets measured gets done. Having too many or the wrong metrics does not allow an organization to focus. An excessive number of metrics can be referred to as the trivial many. Jack Welch, the former CEO of General Electric, referred to unfocused organizations as “measuring everything and understanding nothing”. Instead it is important to determine the crucial few metrics. Other considerations in selecting metrics include the difficulty to measure or collect the data, data reliability and the cost to collect, analyze and report.
Sample Chapter for Promotion© Business Horizons. All Rights Reserved.

462 Achieving Quality and Compliance Excellence in Pharmaceuticals
Quality Process
Input x1
Input x2
A good metrics system is built with a combination of leading and lagging indicators. Lagging indicators measure the outcomes of what already happened. Leading indicators provide information that may be able to predict future outcomes. More mature organizations will typically have a greater ratio of leading to lagging metrics. Measuring the percentage of CAPAs closed within 60 days may predict the number that will be completed past due. Most compliance metrics are inherently lagging indicators and are typically easier to define. Establishing predictive leading indicators can improve a quality system. For example, a typical CAPA organization has a fixed number of resources to investigate and implement resolutions. If there is a spike in the number of CAPAs initiated in a particular month (say 25% percent increase compared to the typical run rate) then it would be expected that there might be an increase in the number of days to complete the investigation. An organization that has an internal goal for investigation completion timeliness, they could find their metric has trended adversely. However, if they had responded to the leading indicator (CAPA Initiations) and rebalance investigation resources, it might have been possible to avoid a performance decline. As metrics are developed for an organization, it is often possible to begin developing metrics with lagging indicators and then ask what actions or conditions cause this outcome to brainstorm leading indicators. It is necessary to understand the cause and effect relationships. In business excellence terminology, this is notated as Y = f(x) where Y is the outcome and x1, x2, etc are the causative agents, the inputs. This can be illustrated using a process diagram (below). The expected quality outcomes (the Y’s) are the outputs. Leading indicators x1, x2, etc can be inputs into the process or interim measurements of the process. By understanding the cause and effect relationships, it is possible to focus on impacting drivers which will ultimately change the outcomes. Figure 17.1: Cause and effect relationships In addition to looking at leading and lagging metrics, it is also important to consider whether the metric measures time, quality or quantity/cost. Time-based metrics are used to measure the duration of a process. Metrics such as the percentage of CAPAs completed on-time is an
Output(s): Y
Sample Chapter for Promotion© Business Horizons. All Rights Reserved.

Meaningful Performance Metrics for Compliance 463
example. Quantity/cost metrics track the frequency or productivity of the process. In a balanced scorecard these could include the cost of the process. Some regulators do not look favorably on compliance decisions based on cost and using financial metrics for compliance is not recommended. For this reason, Cost of Quality metrics have not been included in the Compliance Metrics section. Compliance metrics should focus on effectiveness and measure that the right things are being done correctly. Too often the focus of metrics is on efficiency which often is measured in financial terms. An emphasis on effectiveness first will drive an organization to eliminate the waste which in-turn will improve efficiency. Quality-based metrics are typically more difficult to establish for a compliance process. However, they can provide excellent insight into the health of the quality system. Measuring the frequency that a CAPA investigation reaches root cause can be an indicator of the quality performance of the CAPA system. Some metrics are easy to define but establishing a data collection process can be a significant hurdle. In the interest of understanding the how well batch records are documented, metrics could be established to measure “right first time” accuracy for batch history records. A metric might be defined as the number of documentation errors made per batch. Since detecting such errors is a manual process, collecting documentation errors will require the reviewer to record the nature and details of each error. The record keeping requires additional steps in process including data recording, data verification steps and analysis. The records will need to be maintained under a record retention process. This could be a perfectly value added metric in an operation where there has been a significant issue with recording keeping. It may also apply to a mature business looking to further enhance their effectiveness. However, if the record documentation has not been a problem, then level of effort needed to establish and maintain the process may not have sufficient benefit. It could also distract management from other more pressing compliance issues. These types of issues can often be addressed through feedback loops between the reviewers and the operators who prepare the batch records without a formal elevation process. As the system is being developed, include representatives from each step in the process to make sure the data system is designed successfully.
Selecting the right metrics
Defining metrics
Setting targets/goals
Roll-up of metrics
Maintaining metrics 17.2.1 Selecting the Right Metrics Performance measurements should flow from and be aligned to strategy. Quality objectives will support one or more elements of a strategic plan. Identification of metrics should be done with individuals from each level of the organization. There should be dialog between levels and across organizations to establish metrics. This dialog provides the opportunity to increase alignment, focus the organization and develop the buy-on necessary in order to implement.
Sample Chapter for Promotion© Business Horizons. All Rights Reserved.

464 Achieving Quality and Compliance Excellence in Pharmaceuticals
Hoshin Kanri is an implementation system that can be used to deploy metrics from strategy through implementation. The system includes planning, implementation and reviewing and establishes a closed loop feedback system5. Using the strategic objectives as a starting point, a cross functional team should discuss actions that should be taken to achieve the strategic plan. Once the actions are defined, each of those actions should be reviewed to determine how could the outcomes of that action be measured. They should also consider the drivers that influence the outcomes. A list of draft metrics supporting each strategic objective is developed. 17.2.2 Defining Metrics Metrics definitions should be documented. The table below can be used as a guide to building a complete definition. A well-documented metric provides a solid foundation to collect consistent metrics across departments and over time.
Definition:
One full sentence with verb (avoid using only of three or four words as that can open to interpretation) explaining the Metric. Example: Percentage of supplier CAPAs (Corrective and Preventive Actions) that were completed no later than the planned completion date.
Expected Benefit:
Be specific about the benefit. What quality objective do we wish to achieve, what question is to be answered?. Example: Are quality-related issues detected in audits resolved in a timely manner?
Formula:
Be specific about the formula that is used to calculate the metric. Example: Identify the number of CAPAs planned to close during a certain period. Sum the CAPAs whose actual closure dates are earlier or equal to the planned closure dates, and divide it by the sum of the total CAPAs that were planned to be closed during this period; convert the result into percentage. This is not an accumulative number so each CAPA (including the CAPAs that are open across multiple time periods) is only counted once.
Example:
Give a detailed example for the calculation. Example: Between the week of March 20, 2012 and March 24, 2012 there are 10 CAPAs planned to be closed (these CAPAs may be associated with multiple audits). There are 4 CAPAs closed in January; 3 CAPAs closed on the planned dates: 1 CAPA closed on March 22 versus the planned date of March 20 and 2 CAPAs remain open. The value for this week will be (4+3)/10*100%=70%
Breakdown of Metric Formula:
For complicated calculations sometimes it is necessary to have detailed explanation on the components of the formula. It is not necessary to fill out every time
Unit of Measure: %, #, etc. Example: %
Target: The achievable and desirable goal. Example 90%
Sample Chapter for Promotion© Business Horizons. All Rights Reserved.

Meaningful Performance Metrics for Compliance 465
Baseline: The level of performance over an agreed-upon time frame. Example: 2011 actual results
Frequency: The frequency to report. Example: Weekly and Monthly
Status Indicator Rules:
Use the colors (Red, Yellow, and Green) to indicate the levels of metric performance, some of which may call for action. Example: Red </= 79%, Yellow 80 to 89%, Green >/= 90%
Data Sources (s): Where data is currently collected. Example: CAPA IT system Report #1
Capture Process: The detailed process of the report generation. In the CAPA system, run Report #1 using the most recent Monday and select the department(s) to be reported
Capture Frequency:
The frequency at which the data are accumulated. Example: Weekly
Metric next level up:
The parent level metric that this one feeds into. Example: Overall Audit Effectiveness (for suppliers, subcontractors, and internal)
Metric drill down:
The metric that is the next level down that feeds into this one. Example: none (in this case)
RACI:
Responsible: person(s) influencing the metric performance; Accountable: person(s) ultimately responsible for the metric performance, usually a senior figure but sometimes may be the same as the Responsible person; Consulted: person(s) with knowledge in improving the metric performance, two-way communication; Informed: person(s) likely to benefit from the updates on the metric performance, one-way communication. Example: Responsible: auditors; Accountable: Senior Audit Manager, Consulted: none; Informed Quality council, Quality Director.
Person Responsible for Metric Data Source:
Person filling out KPI scorecard and person(s) providing the data source: Example: Person filling out KPI scorecard: Senior Audit Manager, persons providing the data source: auditors.
Reports Utilizing Metric:
Describe where the data will be reported or used. Example: Audit Department Quality report (the parent metric "Overall Audit Effectiveness" will be in the Management Review report).
Additional Information:
Any helpful information in explaining this metric.
Benefit (H,M,L): Rank benefit of collecting this metric
Effort (H,M,L): Rank effort of collecting this metric
Table 17.1: Defining metrics
Sample Chapter for Promotion© Business Horizons. All Rights Reserved.

466 Achieving Quality and Compliance Excellence in Pharmaceuticals
17.2.3 Setting Targets and Goals Targets and goals should be set in alignment with strategy, but also based on realistic expectations. After metrics are defined and data collection activities are in place, baseline data should be collected for several reporting periods to ensure the data can be collected and calculated as expected. The baseline data establishes either the past or current level of performance. This can be a starting point and improvement targets can be established. Performance improvement can be measured against the baseline. When setting targets consider using “SMART-A” targets: Specific, Measureable, Attainable, Realistic, Time-bound and Aligned. 17.2.4 Rolling Up Metrics Metrics are rolled-up into a hierarchy as defined in their definitions. For example, CAPA timeliness for a company is the sum of the performance of each department’s results. In cases where two or more different metrics roll-up into a single index value on the higher level scorecard, it is possible to use a weighted average. A weighting is assigned to each metric based on its contribution to the index. Each metric result is multiplied by its weighting. The index value is the sum of the weighted values for each metric. Weighted calculations methodology should be defined using a definition form similar to the metric. 17.2.5 Maintaining Metrics Once metrics are defined, piloted and placed into operation it is important that the individual(s) assigned the roles as Responsible and Accountable monitor the metric collection process and the results to ensure the metric is performing as intended. Often the person assigned as Responsible is the process owner for the quality system being monitored, such as the CAPA manager. Adjustments to the metric definition should be done with caution, as some changes may invalidate older measurements. The need to collect a metric may change over time. If the metric is no longer adding value, it should be removed and free up the resources it takes to collect and report.
17.3 COMPLIANCE METRICS
“If you can’t describe what you are doing as a process, you don’t know what you are doing.”
W. Edwards Deming
At the business level, metrics often include sales, profitability, market share, etc. Manufacturing metrics often include manufacturing schedule adherence, cost variances, delivery time accuracy, etc. Quality and compliance metrics are a subset of the total performance metrics in a typical company. Quality performance metrics should be established based on linkages to organizational objectives. The quality function in organization should support strategic issues. However, this chapter focuses on factors that have a more traditional
Sample Chapter for Promotion© Business Horizons. All Rights Reserved.

Meaningful Performance Metrics for Compliance 467
Audit & Inspection
Process
Quality Records (CAPA, batch records etc.
Quality documents(Quality manual, procedures etc)
Qualified Personnel
quality base. These can be linked to product or service performance, quality costs, quality improvement and customer satisfaction. Quality goals should be shared and be applicable across the organization. While Quality metrics may be collected and reported by the quality function, ownership of the issue belongs to operating function. It has been stated that the Pareto principle applies to quality problems6. By this guideline 80% of the quality problems in an organization are outside the control of the quality function, while 20% may be internal. Examples of organization wide problems could include supplier quality requirements, R&D product designs, and distribution system problems. Internal quality problems may include lab test issues, auditing procedures and sampling procedures. The Quality and Compliance metrics described below represent some of those commonly implemented in pharmaceutical operations. There are many variations and extensions to these metrics in the industry. The metrics described are not an exhaustive list, but provide a starting point for each organization. 17.3.1 Audits and Inspections A basic indicator of compliance is performance against regulatory agency inspections and inspection authority audits. The audit process is a periodic snapshot of performance by an independent inspector. Successful regulatory inspections are required for commercialization of products and for manufacturing authorization. Internal audits provide on-going feedback on the health of the quality system. They provide an important indicator, but not an assurance of health of the quality system. Feedback from all sources of quality data and review by management is needed to fully evaluate the system. Favorable outcomes from these inspections and audits help confirm compliance and conformance. Unfavorable outcomes can result in significant business interruptions including loss of license to market products or manufacture products. They can also impact public perceptions and decrease the value of a company’s brand and image. Performance metrics against external inspections are very reactive metrics. These inspections are conducted infrequently and can’t be relied on as a single indicator. Internal audits should be conducted more regularly and enable a proactive response to avoid an external finding. Functional area self-audits offer an excellent opportunity for most proactive measurement. Figure 17.2: Audit and inspection process
Audit Reports and Findings
Sample Chapter for Promotion© Business Horizons. All Rights Reserved.

468 Achieving Quality and Compliance Excellence in Pharmaceuticals
Outcomes Metrics Statistic Method Other Considerations
Percentage of inspections/audits that result in no adverse findings
Trend Evaluate whether there are relative differences between inspecting authorities or between external and internal performance (comparative analysis) Evaluate whether there are relative differences between sites or functions (comparative analysis)
Frequency and severity of findings
Trend
Process Metrics
Timeliness of internal audits against schedule
Trend Evaluate whether there are relative differences between departments or auditors (comparative analysis)
Indicators that audits covered all quality systems, sites and functions
Trend
Number/percent of open inspection and audit actions
Trend Evaluate whether there are relative differences between departments or auditors (comparative analysis)
Timeliness of closure of inspection and audit actions
Trend Evaluate whether there are relative differences between departments or auditors (comparative analysis)
Number/percent of effectiveness checks that pass
Trend Evaluate whether there are relative differences between departments or auditors (comparative analysis)
Table 17.2: Audits and inspections metrics 17.3.1.1 Additional Considerations Further insight into the quality system can be gained by analyzing the findings according their nature and details. This is frequently done according to regulation citation number being violated. This enables development of a pareto of finding by citations. The highest frequencies of findings should be the focus of global improvement efforts. Another benefit of this type of analysis enables a comparison or perhaps a calibration of an internal audit group to external authorities. If internal audits do not identify similar trends in findings as external inspections there may be an opportunity to refine the audit program. An additional benefit of a pareto analysis by citation is for external benchmarking. There are frequent studies showing pareto analysis of finding by agencies such as the FDA. An organization can compare their findings to the benchmark and react accordingly. Carefully examine trends of external findings frequency. This may indicate increased emphasis on emerging issues or heightened inspection focus on key quality system topics, sometimes referred to as “hot topics”. The internal audit plan can be
Sample Chapter for Promotion© Business Horizons. All Rights Reserved.

Meaningful Performance Metrics for Compliance 469
Non-conforming events(defects, test failures, audit findings, complaints confirmed as deficiencies etc)
Potentially non-conforming events
(adverse trends etc)
adjusted to include covering “hot topics”. In addition, internal groups can prepare for external and internal audits by preparations for the frequent inspection areas and hot topics. 17.3.2 Non-conformance and CAPA Systems The CAPA and Complaints quality systems are two of the most important windows to compliance and the health of the quality system. They are frequently a focus area for external inspectors. It is crucial to develop appropriate metrics. Inspectors look at CAPA data to understand whether CAPAs are addressed thoroughly and promptly. Investigations that are incompletely performed or open for an extended period of time are a red flag for a possible significant unresolved problem or an unresponsive management team. The primary objective of the CAPA system is to take actions to avoid reoccurrence, yet many organizations fail to measure performance of reoccurrence. Establishing a process to measure reoccurrence can provide an outstanding method to demonstrate the health of the CAPA process. Other proactive measures include understanding whether an investigation successfully determines the true cause of the nonconformance and whether the planned verifications of effectiveness were successful. Two of the most common metrics are the number/rate of non-conformances and CAPA timeliness. A high level of non-conformances or an increasing trend should be monitored. This is also true for potential non-conformances and planned deviations. Figure 17.3: Non-conformance and CAPA process
CAPA Investigations Correction Actions Implemented Preventive Actions Implemented
Exception Report Records
Sample Chapter for Promotion© Business Horizons. All Rights Reserved.

470 Achieving Quality and Compliance Excellence in Pharmaceuticals
Outcomes Metrics Statistic Method
Other Considerations
Frequency of investigations which reach root cause
Trend Confirm the level of reoccurrences, root cause and effectiveness and that there are not any adverse trends or patterns (current value against target, trending). Consider whether there are any products, processes or departments with a disproportionate number of issues.
Frequency of effectiveness checks that pass
Frequency of nonconformance reoccurrence
Trend
Process Metrics
Investigation timeliness Trend
Evaluate the percentage of investigations are completed in a fixed period of time, such as 60 or 90 days Evaluate any investigations that are open for extended periods of time
Completion of action timeliness Trend
Evaluate the percentage of actions are completed overdue in a fixed period of time, such as 60 or 90 days ) Evaluate any plans that are overdue for extended periods of time
Frequency of non-conformances (process input)
Trend Evaluate the location of the event, cause, product, process step
Frequency of potential non-conformances (process input)
Trend Evaluate the location of the event, cause, product, process step
Frequency of planned deviations (process input)
Trend Evaluate the location of the event, cause, product, process step
Table 17.3: Non-performance and CAPA metrics 17.3.2.1 Additional Considerations Further insight into the quality system can be gained by analyzing additional CAPA system information. This could include categorization of the nature and details of the nonconformities. For example, categorization by product family, part number, type of process, equipment used, etc. In addition, insight can be gained by understanding the cause and resolution of problems. For example, categorization by equipment failure, human error, supplier, etc. A red flag can be when a high frequency of problems are attributed to human error and the corrective action is to re-train because it indicates a potential failure to identify the true root cause therefore an effective action has not been taken. It is also useful to monitor those non-conformances and CAPA that have been determined to have a higher level based on the risk evaluation. The high risk events should be given priority for completion (and therefore timeliness) and confirmation
Sample Chapter for Promotion© Business Horizons. All Rights Reserved.

Meaningful Performance Metrics for Compliance 471
Complaint intake from field
Adverse event intake from field
Non-conformances leading to a recall
of the adequacy of the investigation and corrective actions. The appropriateness of corrections made to address a nonconformance can be monitored. Management needs visibility to the frequency and level of review taken when decisions are made to disposition nonconforming product as “accept as is” without correction. Corrective actions related to product actions, such as recalls, and complaints should be given a heightened level of priority for completion and elevated review/approval. 17.3.3 Complaints and Product Actions The effectiveness of the Complaints and Product Actions systems are closely evaluated by regulators because of their criticality to the product safety and the patient. Complaints must be evaluated, investigated, resolved and reported, as appropriate, in an effective and timely manner. Complaint and Product Action process measures determine the timeliness of key process steps. Investigators will look for complaints open for extended time periods as a flag that the complaint was difficult to resolve and this may be an indicator of a significant issue. They may also indicate a lack of focus or resources. Adverse events have defined reporting timeframe expectations. Figure 17.4: Complaint and product action
Complaint records Adverse Event records Recalls Regulatory Notifications Customer Notifications
Sample Chapter for Promotion© Business Horizons. All Rights Reserved.
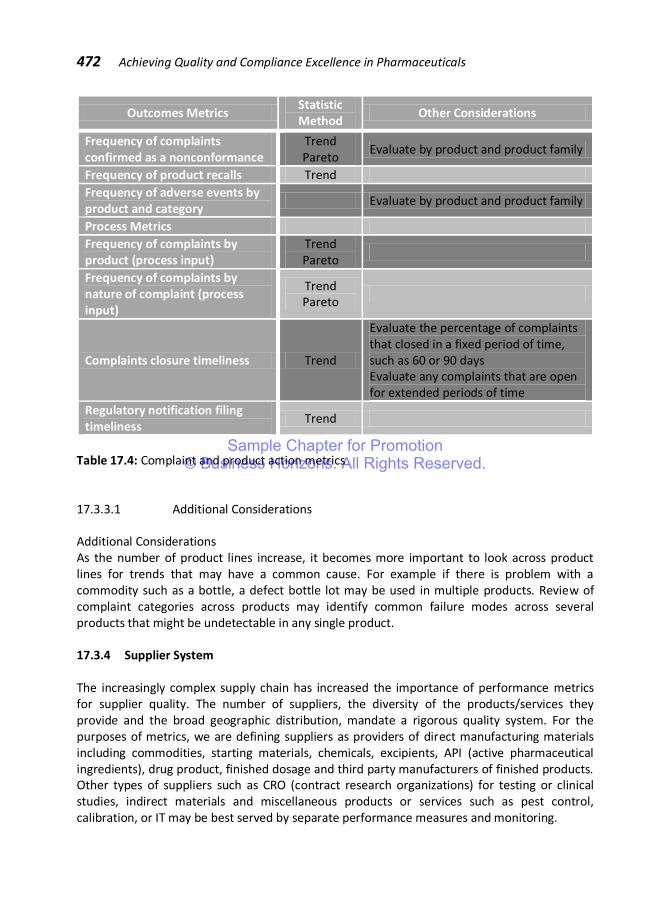
472 Achieving Quality and Compliance Excellence in Pharmaceuticals
Outcomes Metrics Statistic Method
Other Considerations
Frequency of complaints confirmed as a nonconformance
Trend Pareto
Evaluate by product and product family
Frequency of product recalls Trend
Frequency of adverse events by product and category
Evaluate by product and product family
Process Metrics
Frequency of complaints by product (process input)
Trend Pareto
Frequency of complaints by nature of complaint (process input)
Trend Pareto
Complaints closure timeliness Trend
Evaluate the percentage of complaints that closed in a fixed period of time, such as 60 or 90 days Evaluate any complaints that are open for extended periods of time
Regulatory notification filing timeliness
Trend
Table 17.4: Complaint and product action metrics 17.3.3.1 Additional Considerations Additional Considerations As the number of product lines increase, it becomes more important to look across product lines for trends that may have a common cause. For example if there is problem with a commodity such as a bottle, a defect bottle lot may be used in multiple products. Review of complaint categories across products may identify common failure modes across several products that might be undetectable in any single product. 17.3.4 Supplier System The increasingly complex supply chain has increased the importance of performance metrics for supplier quality. The number of suppliers, the diversity of the products/services they provide and the broad geographic distribution, mandate a rigorous quality system. For the purposes of metrics, we are defining suppliers as providers of direct manufacturing materials including commodities, starting materials, chemicals, excipients, API (active pharmaceutical ingredients), drug product, finished dosage and third party manufacturers of finished products. Other types of suppliers such as CRO (contract research organizations) for testing or clinical studies, indirect materials and miscellaneous products or services such as pest control, calibration, or IT may be best served by separate performance measures and monitoring.
Sample Chapter for Promotion© Business Horizons. All Rights Reserved.

Meaningful Performance Metrics for Compliance 473
Supplier System
Supplier nonconformances
Supplier metrics for scorecard
Quality Agreements
Suppliers are both a part of a company’s quality system and act within their own quality system. Both perspectives should be monitored with performance metrics. Internal and external non-conformance are examples of supplier driven issues. In addition, it is important to look at a supplier as a whole quality system. A scorecard should be developed for each supplier. This scorecard could include metrics such as audit outcomes, lot failure rates, delivery performance and responsiveness. Performance against such a scorecard should result in a composite metric for each supplier. The cumulative metric for all suppliers would be the summary of the composite metric from all supplier scorecards The supplier process metric evaluates how well we are managing the supplier network. Today, there are no regulatory requirements to have quality agreements or conduct on-site audits of the entire supplier base. Typically, manufacturers take a risk based approach to establishing these. Metrics can be established to set targets for a sub-set of suppliers. For example, a target might be to have a quality agreement in place for all critical suppliers. Figure 17.4: Supplier System
Outcomes Metrics Statistic Method Other Considerations
Frequency of non-conformances due to supplier
Trend Pareto Evaluate overall and by supplier
Incoming testing failures Trend Pareto Evaluate overall and by supplier
In-process failures due to supplier Trend Pareto Evaluate overall and by supplier
Performance against scorecards Trend Pareto
Process Metrics
Frequency of Quality Agreements established
Trend
Timeliness of internal supplier audits against schedule
Trend
Table 17.5: Supplier system metrics
Supplier Audits Supplier Scorecard
Performance Recalls due to supplier
Sample Chapter for Promotion© Business Horizons. All Rights Reserved.

474 Achieving Quality and Compliance Excellence in Pharmaceuticals
17.3.4.1 Additional Considerations Supplier metrics can be reported as part of other quality systems. For example, non-conformances/CAPA events will be reported in both the CAPA and Supplier metrics. It is important to consider the implications of reporting two supplier metrics; as a supplier metric and as a nonconformance. When tracking, systems might make it more difficult to separate and report both supplier and other non-conformances, the effort to report the name in two ways might not be worth the effort to report separately. Another example is related to timeliness for suppliers to investigate non-conformances or close-out audit items. Data might be skewed if that data was included in the internal data. In all such cases, the effort/benefit analysis can guide appropriate reporting. 17.3.5 Other Metrics Compliance performance metrics can be established for additional aspects of the quality systems. The following are examples of typical metrics. This is not an exhaustive list, but provides points to consider. Analytical Lab metrics
• Frequency of OOS (out of specification) Calibration metrics
• Frequency of calibration OOS (out of specification) • Calibration schedule conformance
Cleanroom metrics
• Frequency of cleanroom OOS (out of specification) Customer Satisfaction metrics
• % Customer Satisfaction (survey) • Frequency of non-product related complaints
Environmental metrics
• Frequency of microbiological failures Equipment metrics
• On-time performance of preventative maintenance • Available/downtime
Information Technology
• Frequency/severity of IT system issues Management Review metrics
• Frequency of meetings held • Action item closure on-time
Sample Chapter for Promotion© Business Horizons. All Rights Reserved.

Meaningful Performance Metrics for Compliance 475
Product Conformity
• In-process rejects • Frequency of customer returns • Frequency of “accept as” concessions
Sterilization metrics
• Frequency of sterilization nonconformances Scrap
• Yield Training metrics
• Frequency of jobs with defined certification requirements • Frequency training that is completed on time
Validation
• % coverage of validation plans for systems • % validation master plans completed on-time • % validation protocols completed RFT (right first time)
17.4 REVIEWS, SCORECARDS AND DASHBOARDS 17.4.1 Management Review Process Metrics are an important element of the management review process. There should be a defined set of metrics that are reviewed by senior management at regularly scheduled management reviews. Management review is a process. A detailed list of metrics should be reviewed on a routine basis in the functional area(s) involved. For metrics closely connected to production, there may be daily or weekly reviews held, for example for nonconformances. Other metrics are reviewed less frequently, such as audit results. Metrics are accumulated, or also said to roll-up, into area or company level metric. The frequency the roll-ups are done should be set according to the business. When possible these roll-ups should be done more frequently than the formal management reviews to provide interim checks on performance and avoid surprises at management review. 17.4.2 Scorecards, Reports, and Dashboards In many small to mid-sized companies, as well as in some multinationals, metrics are not reported out of IT systems in a ready to use format. Many metrics need to be collected, calculated and reported out manually. The data collection process can be time intensive. Well designed scorecards, reports and dashboards help turn a large amount of data into a graphical picture that enables managers to quickly recognize changes and patterns in the data. Scorecard reports are typically graphical reports that summarize key metrics. Whenever possible, these
Sample Chapter for Promotion© Business Horizons. All Rights Reserved.
476 Achieving Quality and Compliance Excellence in Pharmaceuticals
reports should be on display in appropriate, visible locations in the operation. This creates employee ownership of performance results and increases the commitment to achieve the goals set forth. As data rolls up from production line to department to company, a multi-layered hierarchy is used. At each level of the report metrics are accumulated from lower levels. These reports can be a collation of all the lower level reports or just a summarization of accumulated results. However, as data is accumulated there is the risk that problems may be masked due to dilution of the data. For example if the complaints metrics tracks twenty five products, a spike in the complaint level on a small volume product can be invisible when rolled up into accumulated numbers consisting of much larger volumes. To avoid this problem, information in rolled-up reports should include both the accumulated data and reporting on sub-groups that have tripped a signal. At the executive level in the management review process, the content of the metrics varies according to the size of the organization. In smaller companies, all of the metrics may be reviewed directly by plant management. As the organizational size increases in complexity it may be appropriate for functional areas to begin the process with a detailed review of scorecards for the function. Based on that review they would elevate issues, but not the entire report to executive management. Often an executive dashboard is used. In a dashboard, only the most strategically important metrics are presented. In a dashboard, an index can be created to summarize a set of metrics. For example, a CAPA index could be created consisting of three - five CAPA metrics. An index value is calculated by taking a weighted value for each metric and summarized into the index. Actions should be taken at each level in the organization, when appropriate. Actions taken as part of management review need to be documented and tracked to closure.
Using metrics
Taking action on metrics:
Do nothing.
Gather more data.
Try measuring something differently.
Try a pilot corrective action and measure the results.
Have a formal risk analysis performed.
Take market action such as a field correction, recall, or suspension of marketing.
Try some combination of the above.
How metrics and data gathering affect some people
Focus on Red vs Green 17.5 OTHER CONSIDERATIONS
“In God we trust, all others bring data.” W. Edwards Deming
Sample Chapter for Promotion© Business Horizons. All Rights Reserved.
Meaningful Performance Metrics for Compliance 477
17.5.1 Typical Problems There are a number of problems associated with implementing a metrics system. People can manipulate the metrics to “stay in the green”. Some of the more common pitfalls include:
Changing reporting periods: At the end of a month, there can be a rush to meet the numbers by pulling in activities from the next month. Conversely, if a metric meets its objective, work can be delayed into the next reporting period. Easy targets: Targets might set at a level that is easy to reach, instead of stretch goals that drive improvement. This is especially true when incentive (compensation) is based on goal performance. Filtering data: Unless the definitions are precise, sometimes people work to justify exclusions for certain situations and not report some of the data. Reporting: Effective reporting simplifies the task of understanding the data, the analysis and proposed actions. However, it is also possible to change the scale or use the wrong scale in graphs and dashboards. Misalignment: There is a disconnect between what people are asked to perform and what they are being recognized (and measured) for. The connection isn’t clear between the metric and what is expected from the employee doing the work.
17.5.2 IT Systems An important consideration is the choice of an IT system. Today, there are numerous QMS (Quality Management System) IT solutions that provide the raw data needed and many provide good reporting tools. CAPA, Complaints, Documentation and Audit are some of the most common modules within these systems. In addition, there are a number of systems that manage quality from a product lifecycle management (PLM) approach. In addition to the modules in a QMS, these complete systems including regulatory modules and linkages to materials management/production bill of materials systems. This enables better information management and richer quality system information. Both QMS and PLM come at considerable cost and level of effort to implement. When such systems are being developments, it is important for design requirements to be established early for metrics calculation and reporting. Significant time and expense can be avoided by developing the compliance metrics management system in parallel with system development. 17.5.3 Data Verification and Validation Data integrity is crucial to the consumers of the reports, but often a regulatory expectation. As the metrics system is being developed, the systems and tools need to be designed with verification and validation in mind. In 2011, the EMEA updated the EU Annex 11 standard for computerized system validation. FDA 21CFR 820 and 21CFR 211 have similar requirements.
Sample Chapter for Promotion© Business Horizons. All Rights Reserved.

478 Achieving Quality and Compliance Excellence in Pharmaceuticals
These regulations apply to both electronic and paper records. Data integrity can be improved by capturing data only once, capturing data electronically when possible, eliminating unnecessary intermediaries, holding the data generators accountable for accuracy, and with training7. 17.5.4 Continuous Improvement Implementing Compliance Metrics is only the beginning of the journey. They need to regularly be evaluated and kept current. Change may be driven by new strategic direction. As improvement is seen on key metrics, new areas of future focus may come into view. It may be also necessary to refine the metrics or the point in the process being measured to drive measuring earlier in the process to become more proactive. All these can drive the need for periodic change. Avoid changing the metrics too often. Time and effort are needed to implement metrics and too frequent changes to them can frustrate the organization. 17.5.5 All Sources of Quality Data It is expected that management should take a holistic view of the entire system. It is important to connect the dots between quality systems and the performance measurements. There are situations where an issue is identified in a quality system, but the signal isn’t strong enough to require action. However, that issue can manifest itself in many places. Management is expected to have the tools to look across all quality data sources and identify the problem. To illustrate this, think of an excipient material. In the supplier audit, there are findings showing potential for lack of controls. The supplier promises to correct and there is no decision taken to restrict the supplier. For the same material, there is an uptick in the failure rate during incoming inspection, but again no cause to restrict supply. During in-process batch testing occasional failure might be attributable to the excipient, but the investigation was not able to determine cause. Finally, over the past six months there has been an noticeable increase in complaint rate for odor in several products that use the same excipient. However, each of the product complaint rates remained below action limits. It is expected that the quality performance management system has sensitivity to detect a common cause between the odor on several products, in-process testing failures, incoming quality acceptance failures and supplier audits. 17.6 REFERENCES 1. Juran 1993 QCI p. III-48 2. Transforming Performance Measurement p. 15 3. Bossidy and Charan in Execution: The discipline of getting things done 4. The Strategy Focused Organization by Robert S. Kaplan and David P Norton 5. Beyone Strategy Vision: Effective Corporate Action with Hoshin Planning, Michael Cowley,
Ellen Domb 6. CMQ Primer III-51 7. Managing for Quality and Performance Excellence James R Evans and William M. Lindsay
Sample Chapter for Promotion© Business Horizons. All Rights Reserved.

To buy this book
Visit our website
www.businesshorizons.com
Visa, MasterCard and Amex accepted