Achieving Process Energy Efficiency Via Innovation
23
© 2010 Honeywell. All rights reserved. Achieving Process Energy Efficiency via Innovation
Transcript of Achieving Process Energy Efficiency Via Innovation

© 2010 Honeywell. All rights reserved.
Achieving Process Energy Efficiency via Innovation

Agenda
�Why focus on Refining/Petrochemical for reducing CO ?
CO2 Summit: Technology & Opportunity – June 9th, 2010 Achieving Process Energy Efficiency via Innovation
�Why focus on Refining/Petrochemical for reducing CO 2?
�How can innovation help to reduce energy/CO 2?
�Real Life Examples of Energy improvement

Sulfur Plant
GasRecovery
Reformer
Sulfur
LPG
Naphtha HT/Spl
Isomerization
Gasoline
Low S
H2 PlantNat Gas to HT
60,000
42,000 30,000
14,000
Jet
Typical USA Refinery with FCC
CO2 Summit: Technology & Opportunity – June 9th, 2010 Achieving Process Energy Efficiency via Innovation
Crude Column
Delayed Coker
FCC
Distillate Hydrotreater
VGO Ht
Coke
HFAlkylation
Low S Diesel
150,000
Slurry Oil
Flowrates in bbl/day
32,000
38,000
60,000
Vacuum Unit
45,000
6,000
3 UOP - CONFIDENTIAL UOP 5090

Energy & CO 2 in a Refinery
� In the US, refining contributes to ~4% of CO2 emissions
� 8-11% of crude is consumed as energy to drive the processes
� Energy costs 50% to 60% of total variable operating costs (excluding feedstocks)
� $80 to $100 million/year on energy &
Refining Unit
% of Energy
Consumed
CDU/VDU 17
Fluid Catalytic Cracking (FCC) Unit
20
Reformer 14
Hydrocracking 10
CO2 Summit: Technology & Opportunity – June 9th, 2010 Achieving Process Energy Efficiency via Innovation
� $80 to $100 million/year on energy & 1.2 to 1.5 million metric tons/year of CO 2
� CO2 emissions increase with heavier feedstock, cleaner fuels, conversion and complexity
Alkylation and Hydrotreating
15
Coker 4
Utilities 15
Offsite 5
Basis: for a 100,000 BPSD refinery; natural gas cost @ $6/MMbtu

Solutions for Energy and CO2 Reduction
Improve Monitoring& OperationOperate More
Efficiently Online Control & Optimization
UseEnergyMore
EfficientlyIn Process
ReduceEmissions
Reduce Energy
Utilize NewProcess
Technology
Advanced Process Technology, Equipment
& Catalysts
Improve Heat IntegrationRecoverMore Heat
Reduce Waste/Leaks
Managing H2/Fuel
Minimize H 2 to FuelBetter Manage H2 Manage H2 Partial
CO2 Summit: Technology & Opportunity – June 9th, 2010 Achieving Process Energy Efficiency via Innovation
GetEnergy
Cheaper
Improve Resource Allocation
Balance Supply & Demand
Boiler/Turbine Performance
EnergyCosts and Emissions
H2/FuelSystems
Efficiently
Manage H2 PartialPressure
Maximize Recover ofValuable Components
Minimize FuelGas Flare
Better Manage Fuel
Gas System
UseCarbonCredits GHG Capture
& Storage
Renewable Energy Source

Opportunities for Energy Savings
Area of Savings Actions Energy Improvement
Energy Savings
CO2Reduction
Improved operation and
control
� Improve online operation, optimization and control
2 to 4% $1.5M to 3M/year
24,000 to 48,000 metric tons/year
Improved heat recovery
� Increase heat recovery within and across process units.
5 to 10% $4M to 7.5M/year
60,000 to 120,000 metric tons/year
Advanced �Employ new process technology, $3M to 36,000 to 96,000
CO2 Summit: Technology & Opportunity – June 9th, 2010 Achieving Process Energy Efficiency via Innovation
Basis: for a 100,000 BPSD refinery; natural gas cost @ $6/MMbtu
Advanced Process
Technology
�Employ new process technology, design and equipment
3 to 8% $3M to 6M/year
36,000 to 96,000 metric tons/year
Steam and Power Optimization
� Energy supply optimization for driver selection, equipment loading and utility buy/sell.
2 to 3% $1.5M to 2.3M/year
24,000 to 36,000 metric tons/year
Total 12 to 25% $10M to20M/year
144,000 to 300,000metric
tons/year
Agenda
�Why focus on Refining/Petrochemical for reducing CO ?
CO2 Summit: Technology & Opportunity – June 9th, 2010 Achieving Process Energy Efficiency via Innovation
�Why focus on Refining/Petrochemical for reducing CO 2?
�How can innovation help to reduce Energy/CO 2?
�Real Life Examples of Energy Savings

�Apply new technology, equipment, and catalysts– High selectivity/activity catalyst
– High efficiency reactor internals
– High capacity fractionator internals
– Enhanced heat exchangers
– Modern power recovery turbines
Innovations to Save Energy & Reduce CO2
CO2 Summit: Technology & Opportunity – June 9th, 2010 Achieving Process Energy Efficiency via Innovation
B
A
ABC
C
– Modern power recovery turbines
– Novel process design

New Distillate Catalysts in UOP Unicracking
Wash Water Recycle Compressor
Makeup Hydrogen
CO2 Summit: Technology & Opportunity – June 9th, 2010 Achieving Process Energy Efficiency via Innovation
Fresh FeedRecycle Oil from Fractionator
Hot Separator
ToFractionator
Sour WaterTo Fractionator
Flash DrumFlash Gas
Cold Separator
Load new distillate catalyst in Unicracking Unit

New Distillate Catalysts in UOP Unicracking
Wash Water
Cold Separator
Recycle Compressor
Makeup Hydrogen
123
4
Energy Impact from Higher Distillate Selectivity
CO2 Summit: Technology & Opportunity – June 9th, 2010 Achieving Process Energy Efficiency via Innovation
Fresh FeedRecycle Oil from Fractionator
Hot Separator
ToFractionator
Sour WaterTo Fractionator
Flash DrumFlash Gas
Cold Separator
Benefits of Catalyst Change
1. Lower chemical H2 consumption reduces natural gas consumed at H2 Plant2. Lower chemical H2 consumption reduces makeup gas compression energy3. Higher distillate selectivity reduces heat release in the new distillate
catalyst; less quench is required4. Lower quench requirement reduces the recycle gas compressor utilities

What makes a refinery more efficient?-- Equipment selection optimization
� Helical baffle exchanger for fouling services?� High-con tubes for column overhead condensers?� Dividing wall column for fractionators/separators?
CO2 Summit: Technology & Opportunity – June 9th, 2010 Achieving Process Energy Efficiency via Innovation
Thermal Efficiency In Dividing Wall Column
A
ABC
B
C
Col
umn
Tray
Top
BottomComponent B mole fraction
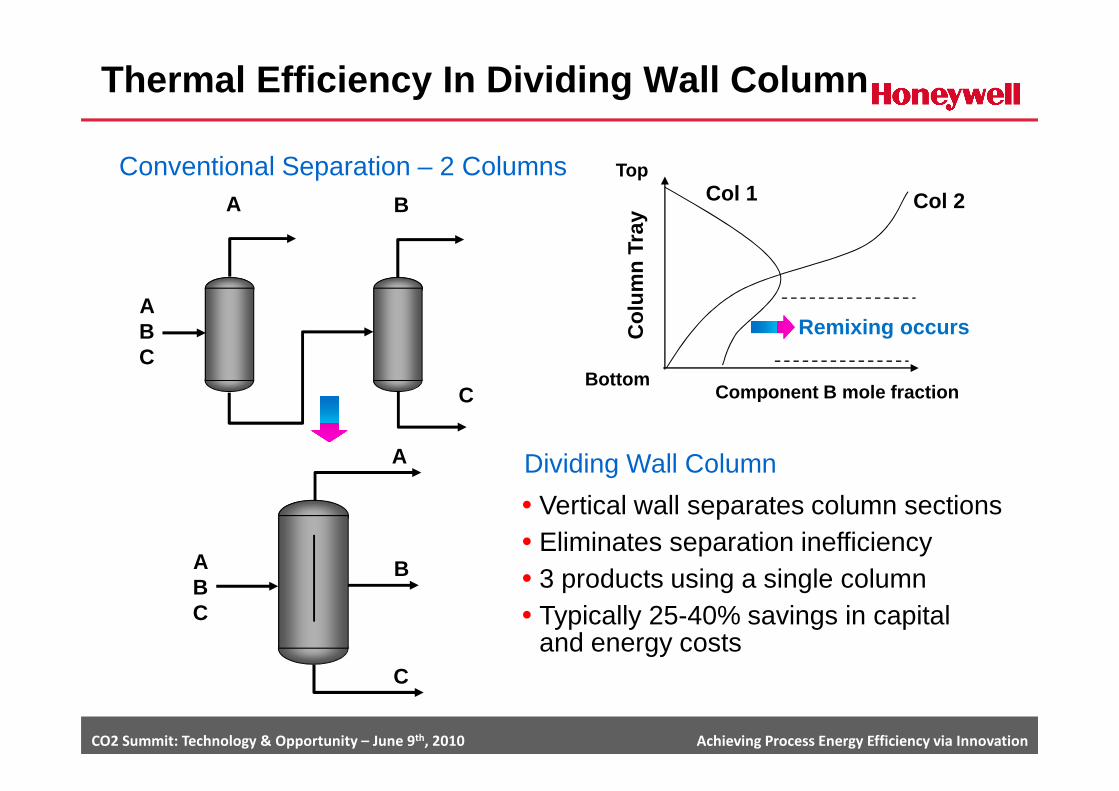
Col 1 Col 2
Remixing occurs
Conventional Separation – 2 Columns
CO2 Summit: Technology & Opportunity – June 9th, 2010 Achieving Process Energy Efficiency via Innovation
C Component B mole fraction
A
ABC
B
C
� Vertical wall separates column sections� Eliminates separation inefficiency � 3 products using a single column� Typically 25-40% savings in capital
and energy costs
Dividing Wall Column

Integration of Separation Processes
FEED
Col
umn
1
Condenser
Col
umn
2
Condenser
CondenserProduct 1
Product 2
CO2 Summit: Technology & Opportunity – June 9th, 2010 Achieving Process Energy Efficiency via Innovation
Col
umn
1
Reboiler
Col
umn
2Reboiler
Col
umn
3
Reboiler
Product 4
Product 3
UOP 4706E-10

Conventional Design – Pinch Representation -Requires High Utility Demand for Reboiling
300 MMBtu/hSteam & Fuel
Process-ProcessHeat Recovery230 MMBtu/h
600
500
400
300
Tem
pera
ture
(°F
)
Composite Curves
CO2 Summit: Technology & Opportunity – June 9th, 2010 Achieving Process Energy Efficiency via Innovation
300
200
100
0
Enthalpy (MM Btu/hr)
Tem
pera
ture
(
0 100 200 300 400 500 600 700 800 900900
320 MMBtu/hCooling Utility
UOP 4706E-11

Optimized Design – Pinch Representation- Minimizes Utility Needs for Reboiling
200 MMBtu/hSteam & Fuel
Process-ProcessHeat Recovery
600
500
400
300
Tem
pera
ture
(°F
)
330 MMBtu/h
Composite Curves
CO2 Summit: Technology & Opportunity – June 9th, 2010 Achieving Process Energy Efficiency via InnovationUOP 4706E-12
300
200
100
0
Enthalpy (MM Btu/hr)
Tem
pera
ture
(
0 100 200 300 400 500 600 700 800
220 MMBtu/hCooling Utility

� Porous metal coating applied to boiling side
– Maximizes boiling coefficient
– Extends boiling to very low LMTD’s
� Overall coefficient 2 to 4 times that of bare tube
� Conventionally used to reduce
Enhanced Heat Transfer Tubing - Boiling
CO2 Summit: Technology & Opportunity – June 9th, 2010 Achieving Process Energy Efficiency via Innovation
� Conventionally used to reduce equipment size and installation cost
� Can be leveraged to enable better heat integration between process operations for significant energy savings

Agenda
�Why focus on Refining/Petrochemical for reducing CO ?
CO2 Summit: Technology & Opportunity – June 9th, 2010 Achieving Process Energy Efficiency via Innovation
�Why focus on Refining/Petrochemical for reducing CO 2?
�How can innovation help to reduce energy/CO 2?
�Real Life Examples of Energy improvement

� Energy study identified energy savings potential of $61.3 million/yr at capital cost of $75.5 million .
� Refinery selected 31 projects out of 73, with overa ll benefit of $33 million/yr at the capital cost of $30 million for the next six years
� Main units where savings were identified were Hydro treaters,
Example: Refinery Wide Energy Study
CO2 Summit: Technology & Opportunity – June 9th, 2010 Achieving Process Energy Efficiency via Innovation
� Main units where savings were identified were Hydro treaters, Crude & Vacuum Fractionation, Delayed Coker and Nap htha Reforming
� Basis: Large refinery
UOP 4706E-17

Example: Refinery Energy Retrofit
� 19 projects identified at refinery with throughput of 110,000 barrels per day
� Units include CDU, HCU, DHT, Platforming, Steam and Power system
� Total energy saving: 330 MMBtu/h (17%)
� Total energy cost saving: $27 million/yr
CO2 Summit: Technology & Opportunity – June 9th, 2010 Achieving Process Energy Efficiency via Innovation
� Overall simple payback less than two years
� Total CO 2 reduction: 230,000 metric tons/yr (19%)
� The refinery decided to move many of these energy projects forward into implementation
IndustryAverage
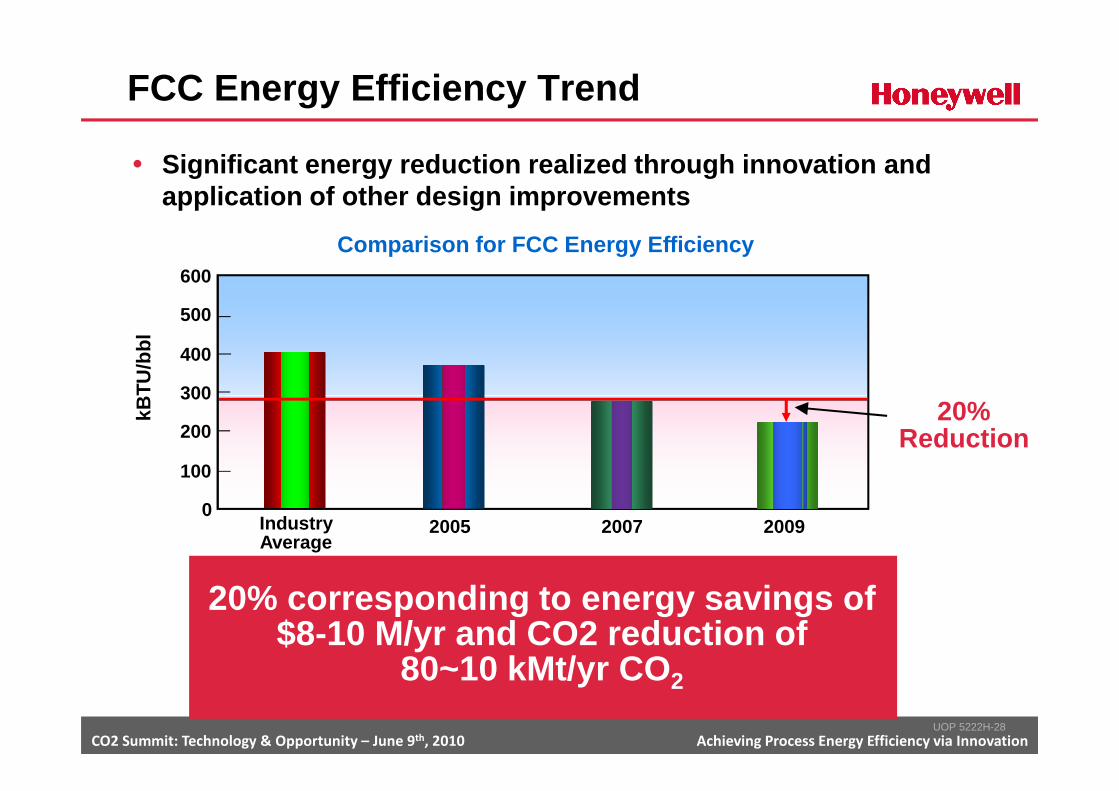
Comparison for FCC Energy Efficiency
300
400
500
600
kBTU
/bbl
FCC Energy Efficiency Trend
� Significant energy reduction realized through innov ation and application of other design improvements
CO2 Summit: Technology & Opportunity – June 9th, 2010 Achieving Process Energy Efficiency via Innovation
20%Reduction
Average
0
100
200
300
kBTU
/bbl
IndustryAverage
2005 2007 2009
UOP 5222H-28
20% corresponding to energy savings of $8-10 M/yr and CO2 reduction of
80~10 kMt/yr CO 2

Aromatics Complex Energy Reduction
� Current technology employs significant heat integra tion
� Recent energy reduction program undertaken to ident ify potential for further improvement
Result –> Energy Savings >30%� Application of innovative equipment/strategies enab les
change to heat integration for a reduction in low l evel heat rejected
CO2 Summit: Technology & Opportunity – June 9th, 2010 Achieving Process Energy Efficiency via Innovation
Basis: Current world scale aromatics complex and natural gas cost @ $6/MMbtu
rejected
� Energy saving : 400 MMBtu/h
� Cost saving: $20 million/yr
� Simple payback: < 2 years
� Total CO 2 reduction: 200 kMt/yr
“Big Picture” Perspective -- 25% energy saving for refining
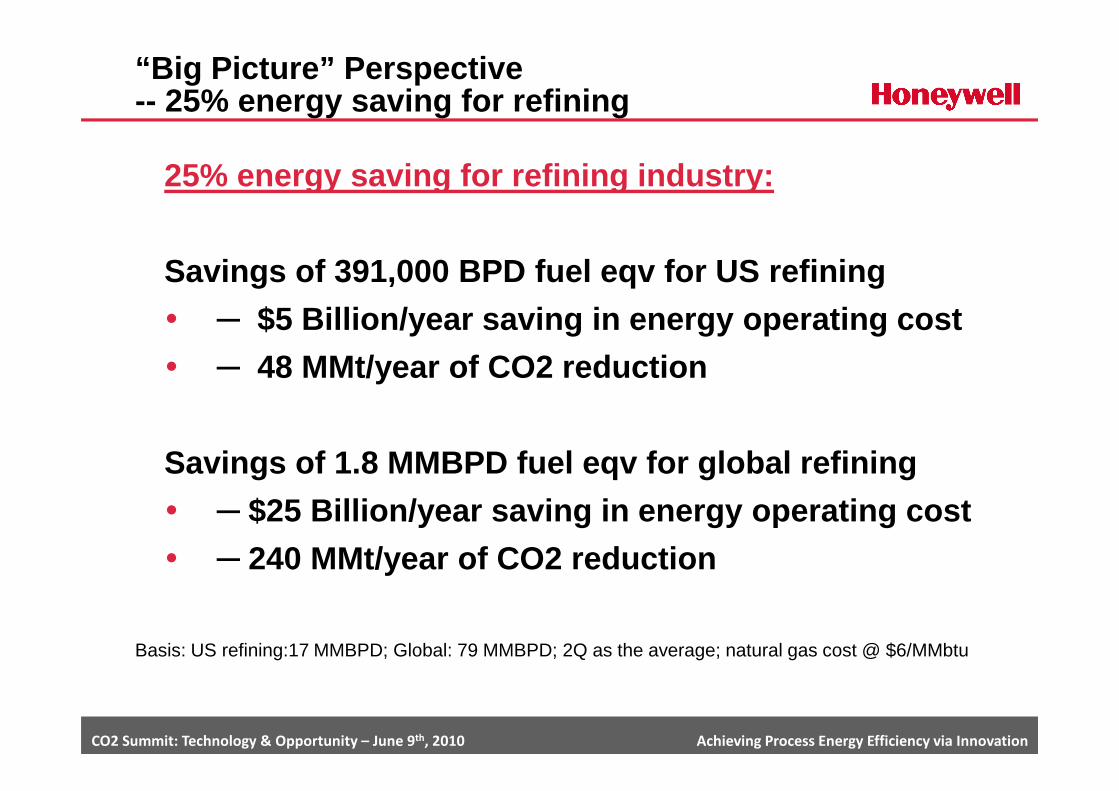
25% energy saving for refining industry:
Savings of 391,000 BPD fuel eqv for US refining
� ─ $5 Billion/year saving in energy operating cost
� ─ 48 MMt/year of CO2 reduction
CO2 Summit: Technology & Opportunity – June 9th, 2010 Achieving Process Energy Efficiency via Innovation
Savings of 1.8 MMBPD fuel eqv for global refining
� ─ $25 Billion/year saving in energy operating cost
� ─ 240 MMt/year of CO2 reduction
Basis: US refining:17 MMBPD; Global: 79 MMBPD; 2Q as the average; natural gas cost @ $6/MMbtu

Thank You!
Q & A
CO2 Summit: Technology & Opportunity – June 9th, 2010 Achieving Process Energy Efficiency via Innovation
Q & A