Achieving exceptionally high luminescence quantum ... · 1 Achieving exceptionally high...
18
1 Achieving exceptionally high luminescence quantum efficiency by immobilizing an AIE molecular chromophore into a metal- organic framework Zhichao Hu, a Guangxi Huang, b William P. Lustig, a Fangming Wang, a,c Hao Wang, a Simon J. Teat, d Debasis Banerjee, a Deqing Zhang, b and Jing Li* ,a a Department of Chemistry and Chemical Biology, Rutgers University, 610 Taylor Road, Piscataway NJ 08854, USA b Beijing National Laboratory for Molecular Sciences, CAS Key Laboratory of Organic Solids, Institute of Chemistry, Chinese Academy of Sciences, Beijing 100190, China c School of Environmental and Chemical Engineering, Jiangsu University of Science and Technology, Zhenjiang, Jiangsu 212003, China d Advanced Light Source, Lawrence Berkeley National Laboratory, Berkeley CA 94720, USA Supporting Information Electronic Supplementary Material (ESI) for Chemical Communications. This journal is © The Royal Society of Chemistry 2014
Transcript of Achieving exceptionally high luminescence quantum ... · 1 Achieving exceptionally high...
1
Achieving exceptionally high luminescence quantum efficiency by immobilizing an AIE molecular chromophore into a metal-organic framework
Zhichao Hu,a Guangxi Huang,b William P. Lustig,a Fangming Wang,a,c Hao Wang, a Simon J. Teat,d Debasis Banerjee,a Deqing Zhang,b and Jing Li*,a
a Department of Chemistry and Chemical Biology, Rutgers University, 610 Taylor Road, Piscataway NJ 08854, USA b Beijing National Laboratory for Molecular Sciences, CAS Key Laboratory of Organic Solids, Institute of Chemistry, Chinese Academy of Sciences, Beijing 100190, China c School of Environmental and Chemical Engineering, Jiangsu University of Science and Technology, Zhenjiang, Jiangsu 212003, China d Advanced Light Source, Lawrence Berkeley National Laboratory, Berkeley CA 94720, USA
Supporting Information
Electronic Supplementary Material (ESI) for Chemical Communications.This journal is © The Royal Society of Chemistry 2014
2
Table of Contents S1. A Computational Screening of Molecular Chromophores ...................................................... 3
S2. The Synthesis of H4tcbpe....................................................................................................... 4
S3. The synthesis of Zn2(tcbpe)·xDMA (LMOF-231) ...................................................................... 7
S4. Power X-ray Diffraction (PXRD) and Thermogravimetric Analysis (TGA) .................................. 7
S5. Single Crystal X-ray Diffraction Analysis ................................................................................. 7
S6. Pore Charaterization ........................................................................................................... 12
S7. Optical Absorption and Fluorescence Spectroscopy ............................................................ 13
S8. Quantum Yield and Luminous Efficacy................................................................................. 16
S9. References .......................................................................................................................... 18
3
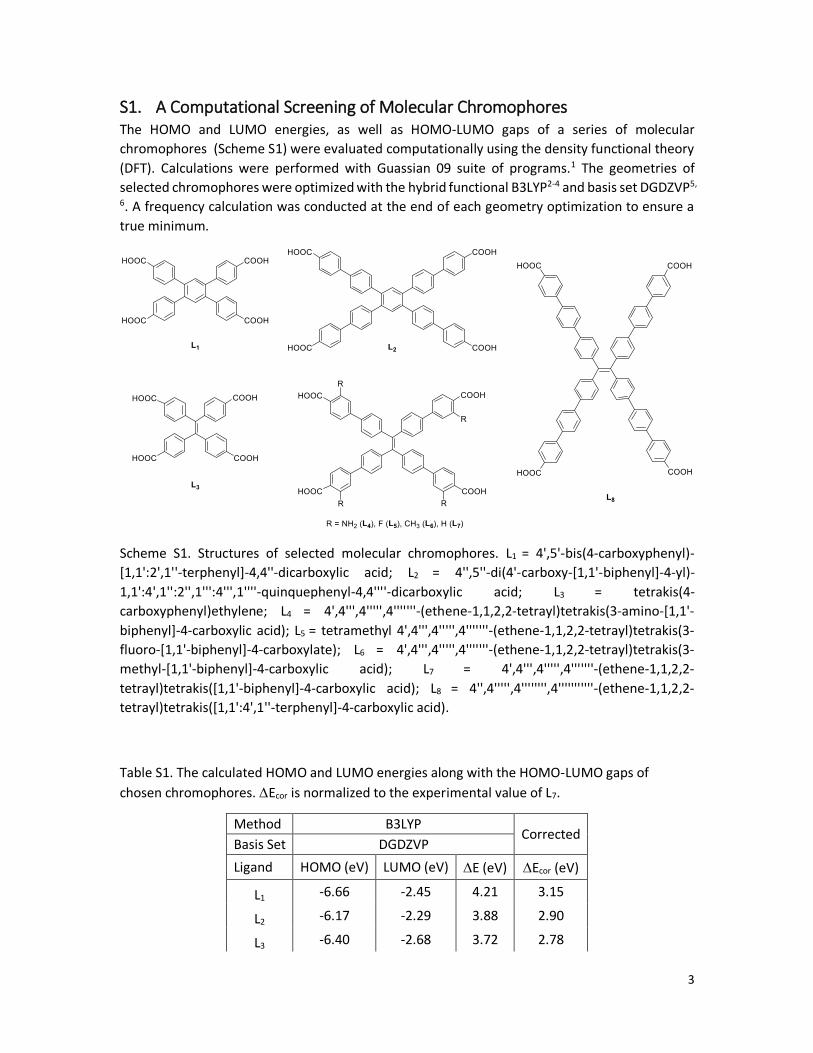
S1. A Computational Screening of Molecular Chromophores The HOMO and LUMO energies, as well as HOMO-LUMO gaps of a series of molecular
chromophores (Scheme S1) were evaluated computationally using the density functional theory
(DFT). Calculations were performed with Guassian 09 suite of programs.1 The geometries of
selected chromophores were optimized with the hybrid functional B3LYP2-4 and basis set DGDZVP5,
6. A frequency calculation was conducted at the end of each geometry optimization to ensure a
true minimum.
Scheme S1. Structures of selected molecular chromophores. L1 = 4',5'-bis(4-carboxyphenyl)-
[1,1':2',1''-terphenyl]-4,4''-dicarboxylic acid; L2 = 4'',5''-di(4'-carboxy-[1,1'-biphenyl]-4-yl)-
1,1':4',1'':2'',1''':4''',1''''-quinquephenyl-4,4''''-dicarboxylic acid; L3 = tetrakis(4-
carboxyphenyl)ethylene; L4 = 4',4''',4''''',4'''''''-(ethene-1,1,2,2-tetrayl)tetrakis(3-amino-[1,1'-
biphenyl]-4-carboxylic acid); L5 = tetramethyl 4',4''',4''''',4'''''''-(ethene-1,1,2,2-tetrayl)tetrakis(3-
fluoro-[1,1'-biphenyl]-4-carboxylate); L6 = 4',4''',4''''',4'''''''-(ethene-1,1,2,2-tetrayl)tetrakis(3-
methyl-[1,1'-biphenyl]-4-carboxylic acid); L7 = 4',4''',4''''',4'''''''-(ethene-1,1,2,2-
tetrayl)tetrakis([1,1'-biphenyl]-4-carboxylic acid); L8 = 4'',4''''',4'''''''',4'''''''''''-(ethene-1,1,2,2-
tetrayl)tetrakis([1,1':4',1''-terphenyl]-4-carboxylic acid).
Table S1. The calculated HOMO and LUMO energies along with the HOMO-LUMO gaps of
chosen chromophores. Ecor is normalized to the experimental value of L7.
Method B3LYP Corrected
Basis Set DGDZVP
Ligand HOMO (eV) LUMO (eV) E (eV) Ecor (eV)
L1 -6.66 -2.45 4.21 3.15
L2 -6.17 -2.29 3.88 2.90
L3 -6.40 -2.68 3.72 2.78
4
L4 -5.70 -2.25 3.46 2.58
L5 -6.10 -2.68 3.42 2.56
L6 -5.80 -2.39 3.41 2.55
L7 -5.87 -2.46 3.41 2.55
L8 -5.65 -2.31 3.34 2.50
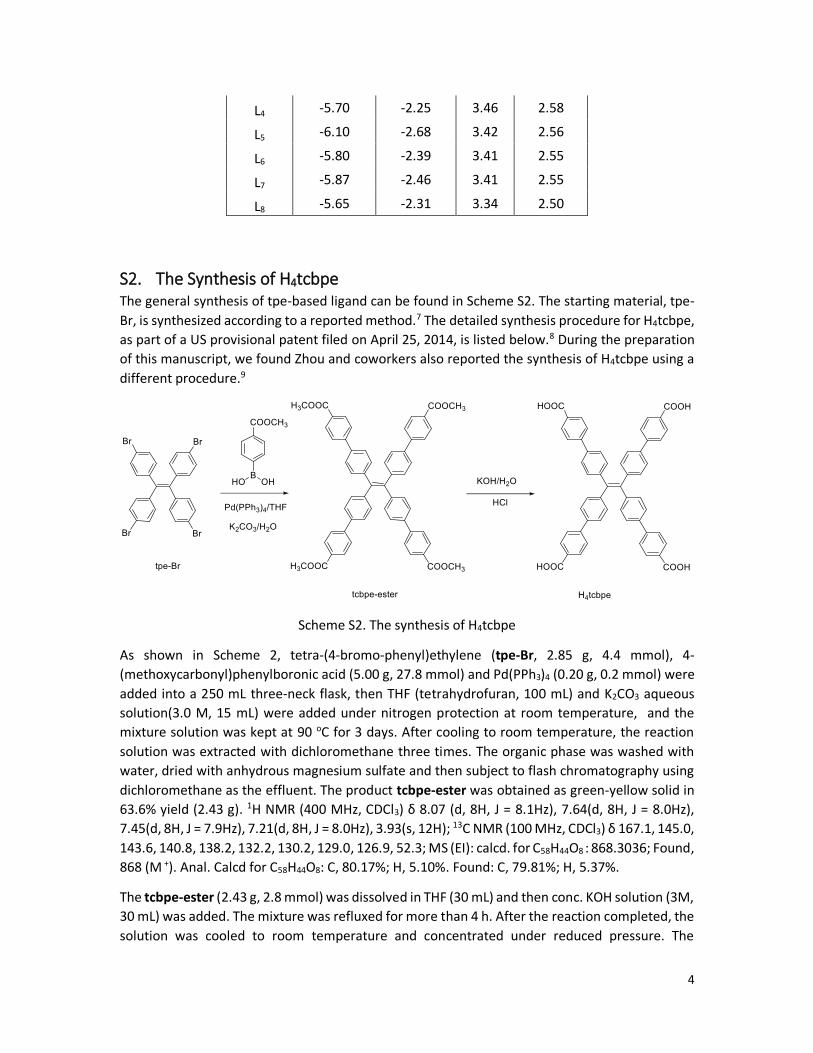
S2. The Synthesis of H4tcbpe The general synthesis of tpe-based ligand can be found in Scheme S2. The starting material, tpe-
Br, is synthesized according to a reported method.7 The detailed synthesis procedure for H4tcbpe,
as part of a US provisional patent filed on April 25, 2014, is listed below.8 During the preparation
of this manuscript, we found Zhou and coworkers also reported the synthesis of H4tcbpe using a
different procedure.9
Scheme S2. The synthesis of H4tcbpe
As shown in Scheme 2, tetra-(4-bromo-phenyl)ethylene (tpe-Br, 2.85 g, 4.4 mmol), 4-
(methoxycarbonyl)phenylboronic acid (5.00 g, 27.8 mmol) and Pd(PPh3)4 (0.20 g, 0.2 mmol) were
added into a 250 mL three-neck flask, then THF (tetrahydrofuran, 100 mL) and K2CO3 aqueous
solution(3.0 M, 15 mL) were added under nitrogen protection at room temperature, and the
mixture solution was kept at 90 oC for 3 days. After cooling to room temperature, the reaction
solution was extracted with dichloromethane three times. The organic phase was washed with
water, dried with anhydrous magnesium sulfate and then subject to flash chromatography using
dichloromethane as the effluent. The product tcbpe-ester was obtained as green-yellow solid in
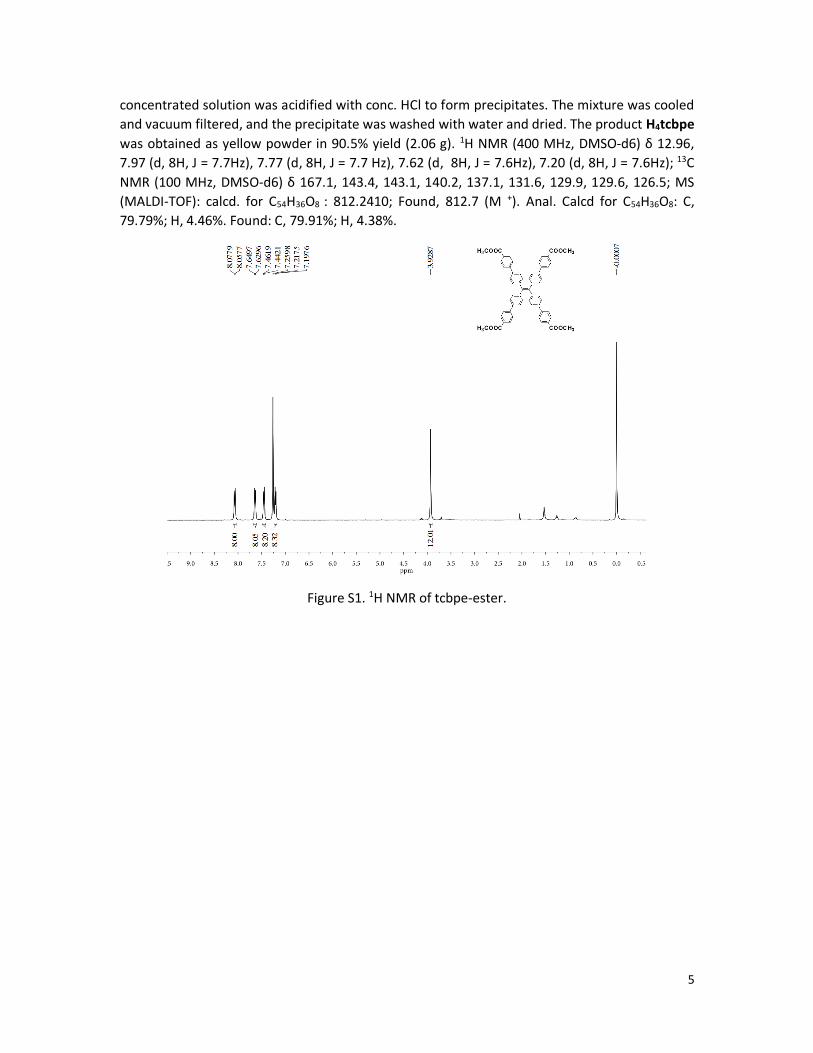
63.6% yield (2.43 g). 1H NMR (400 MHz, CDCl3) δ 8.07 (d, 8H, J = 8.1Hz), 7.64(d, 8H, J = 8.0Hz),
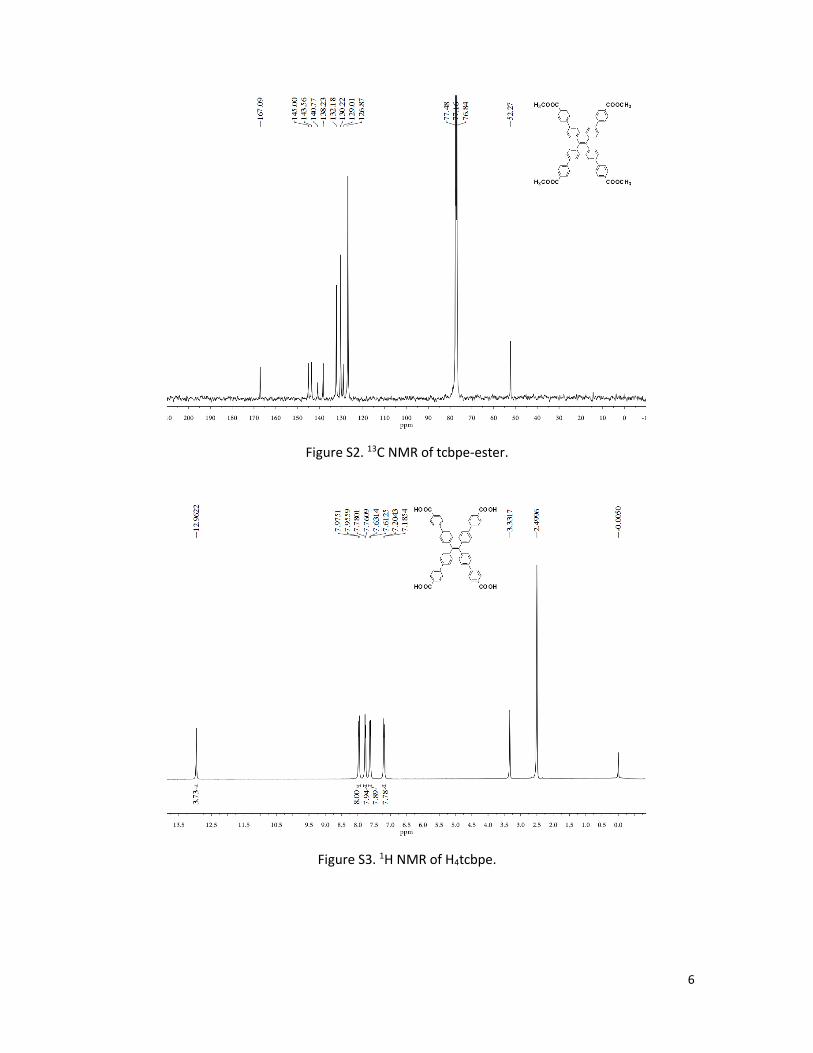
7.45(d, 8H, J = 7.9Hz), 7.21(d, 8H, J = 8.0Hz), 3.93(s, 12H); 13C NMR (100 MHz, CDCl3) δ 167.1, 145.0,
143.6, 140.8, 138.2, 132.2, 130.2, 129.0, 126.9, 52.3; MS (EI): calcd. for C58H44O8 : 868.3036; Found,
868 (M +). Anal. Calcd for C58H44O8: C, 80.17%; H, 5.10%. Found: C, 79.81%; H, 5.37%.
The tcbpe-ester (2.43 g, 2.8 mmol) was dissolved in THF (30 mL) and then conc. KOH solution (3M,
30 mL) was added. The mixture was refluxed for more than 4 h. After the reaction completed, the
solution was cooled to room temperature and concentrated under reduced pressure. The
5
concentrated solution was acidified with conc. HCl to form precipitates. The mixture was cooled
and vacuum filtered, and the precipitate was washed with water and dried. The product H4tcbpe
was obtained as yellow powder in 90.5% yield (2.06 g). 1H NMR (400 MHz, DMSO-d6) δ 12.96,
7.97 (d, 8H, J = 7.7Hz), 7.77 (d, 8H, J = 7.7 Hz), 7.62 (d, 8H, J = 7.6Hz), 7.20 (d, 8H, J = 7.6Hz); 13C
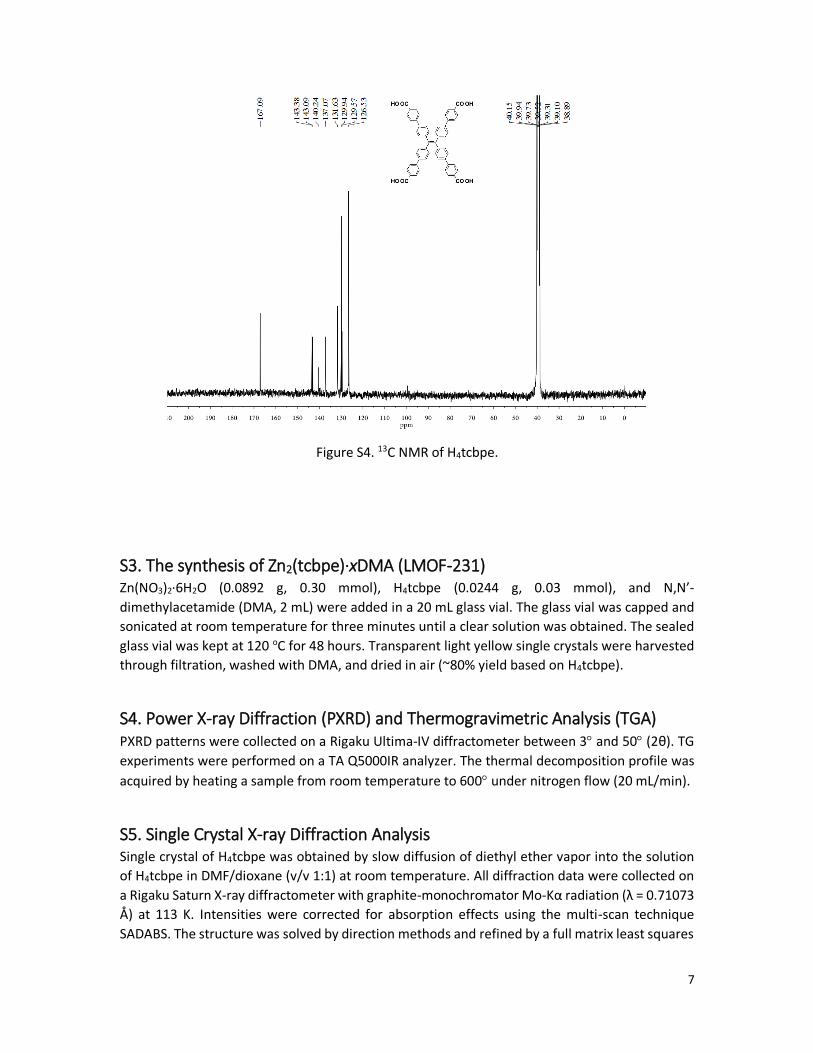
NMR (100 MHz, DMSO-d6) δ 167.1, 143.4, 143.1, 140.2, 137.1, 131.6, 129.9, 129.6, 126.5; MS
(MALDI-TOF): calcd. for C54H36O8 : 812.2410; Found, 812.7 (M +). Anal. Calcd for C54H36O8: C,
79.79%; H, 4.46%. Found: C, 79.91%; H, 4.38%.
Figure S1. 1H NMR of tcbpe-ester.
6
Figure S2. 13C NMR of tcbpe-ester.
Figure S3. 1H NMR of H4tcbpe.
7
Figure S4. 13C NMR of H4tcbpe.
S3. The synthesis of Zn2(tcbpe)·xDMA (LMOF-231) Zn(NO3)2·6H2O (0.0892 g, 0.30 mmol), H4tcbpe (0.0244 g, 0.03 mmol), and N,N’-
dimethylacetamide (DMA, 2 mL) were added in a 20 mL glass vial. The glass vial was capped and
sonicated at room temperature for three minutes until a clear solution was obtained. The sealed
glass vial was kept at 120 oC for 48 hours. Transparent light yellow single crystals were harvested
through filtration, washed with DMA, and dried in air (~80% yield based on H4tcbpe).
S4. Power X-ray Diffraction (PXRD) and Thermogravimetric Analysis (TGA) PXRD patterns were collected on a Rigaku Ultima-IV diffractometer between 3 and 50 (2θ). TG
experiments were performed on a TA Q5000IR analyzer. The thermal decomposition profile was
acquired by heating a sample from room temperature to 600 under nitrogen flow (20 mL/min).
S5. Single Crystal X-ray Diffraction Analysis Single crystal of H4tcbpe was obtained by slow diffusion of diethyl ether vapor into the solution
of H4tcbpe in DMF/dioxane (v/v 1:1) at room temperature. All diffraction data were collected on
a Rigaku Saturn X-ray diffractometer with graphite-monochromator Mo-Kα radiation (λ = 0.71073
Å) at 113 K. Intensities were corrected for absorption effects using the multi-scan technique
SADABS. The structure was solved by direction methods and refined by a full matrix least squares
8
technique based on F2 using SHELXL 97 program10. The SQUEEZE routine within the
crystallographic program PLATON11 was employed in the treatment of the disordered solvent
molecules of the crystal.
Synchrotron X-ray sources at the Advanced Light Source 11.3.1 Chemical Crystallography beam
line were used to collect low temperature (100 K) single crystal diffraction data for LMOF-231.
Reflection data for compound 1 were collected using a three-circle Bruker D8 diffractometer
equipped with an APEXII detector (λ = 0.77490 Å) with 180 ω scans, at 0.3 steps, with settings of
ϕ = 0, 120, and 240. The crystals were twinned. Using Cell_now12, two orientation matrices were
determined; the relationship between these components was determined to be 180 degrees
about real axis [100]. The data were integrated using the two matrices in SAINT.13 TWINABS14 was
used to produce a merged HKLF4 file for structure solution and initial refinement, and HKLF5 file
for final structure refinement. The HKLF5 file contained the merged reflections first component
and those that overlapped with this component, which were split into 2 reflections. TWINABS
indicated the twin faction to be 53:47. The structure was solved using the HKLF4 file, but the best
refinement was given by the HKLF5 file. All atoms were refined anisotropically. Hydrogens were
placed in calculated position and refined using a riding model. The solvent was disordered and so
the SQUEEZE routine in PLATON11 was used to generate and solvent mask. The solvent molecules
were not added to the chemical formula.
Table S2. Single crystal data for H4tcbpe at 113 K
Compound H4tcbpe·2DMF
Formula C60H50N2O10
M 959.02
Crystal system Orthorhombic
Space group Fdd2
a/Å 20.642(12)
b/Å 78.16(5)
c/Å 8.624(5)
α/o 90.00
β/o 90.00
γ/o 90.00
V, Å3 13914(14)
Z 8
Temperature (K) 113(2)
(radiation wavelength) Å 0.71075
D, g/cm3 0.916
Reflections collected 7394
9
R1a [I > 2σ(I)] 0.0971
wR2b [I > 2σ(I)] 0.2908
Goodness-of-fit 1.067
CCDC No. 908787 (submitted November 1, 2012)
a R1= ∑│Fo- Fc│/ ∑│Fo│ bwR2= ∑[w(Fo
2- Fc2 )2] / w(Fo
2)2]1/2
Table S3. Single crystal data for LMOF-231 at 100 K
Compound Zn2(tcbpe)·xDMA (LMOF-231)
Formula C54H32O8Zn2
M 939.53
Crystal system Monoclinic
Space group C 2/c
a/Å 36.929(5)
b/Å 31.080(4)
c/Å 11.8533(17)
α/o 90.00
β/o 99.228(2)
γ/o 90.00
V, Å3 13429(3)
Z 8
Temperature (K) 100(2)
(radiation wavelength) Å 0.7749
D, g/cm3 0.929
Reflections collected 76786
R1a [I > 2σ(I)] 0.0898
wR2b [I > 2σ(I)] 0.2803
Goodness-of-fit 1.058
CCDC No. 1004908
a R1= ∑│Fo- Fc│/ ∑│Fo│ bwR2= ∑[w(Fo
2- Fc2 )2] / w(Fo
2)2]1/2
10
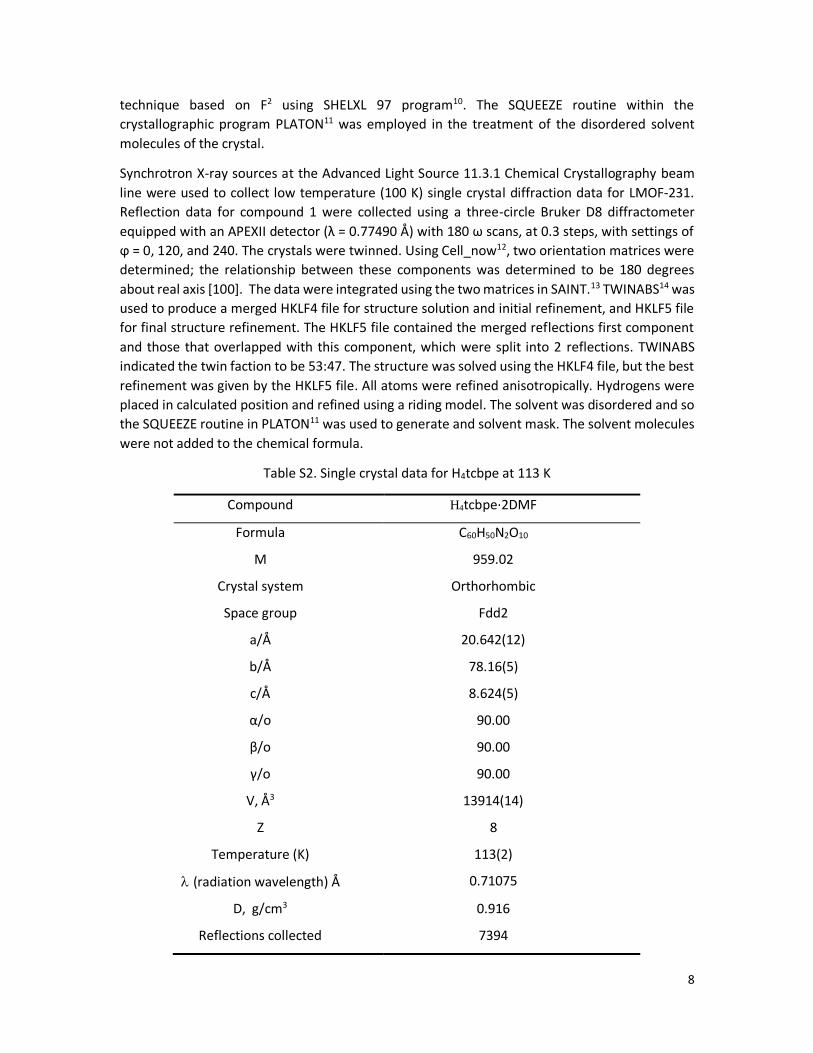
Figure S5. The ORTEP diagram of H4tcbpe (thermal ellipsoids drawn in 50% probability).
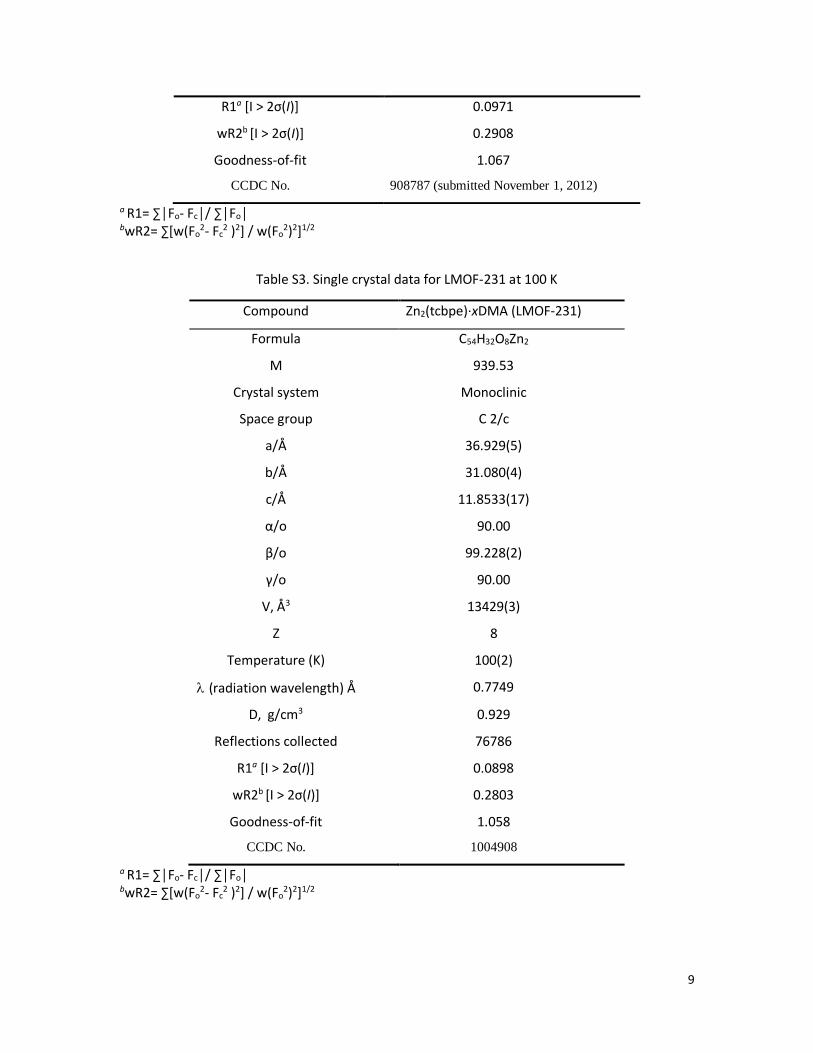
Figure S6. Crystals of LMOF-231 under a microscope.
11
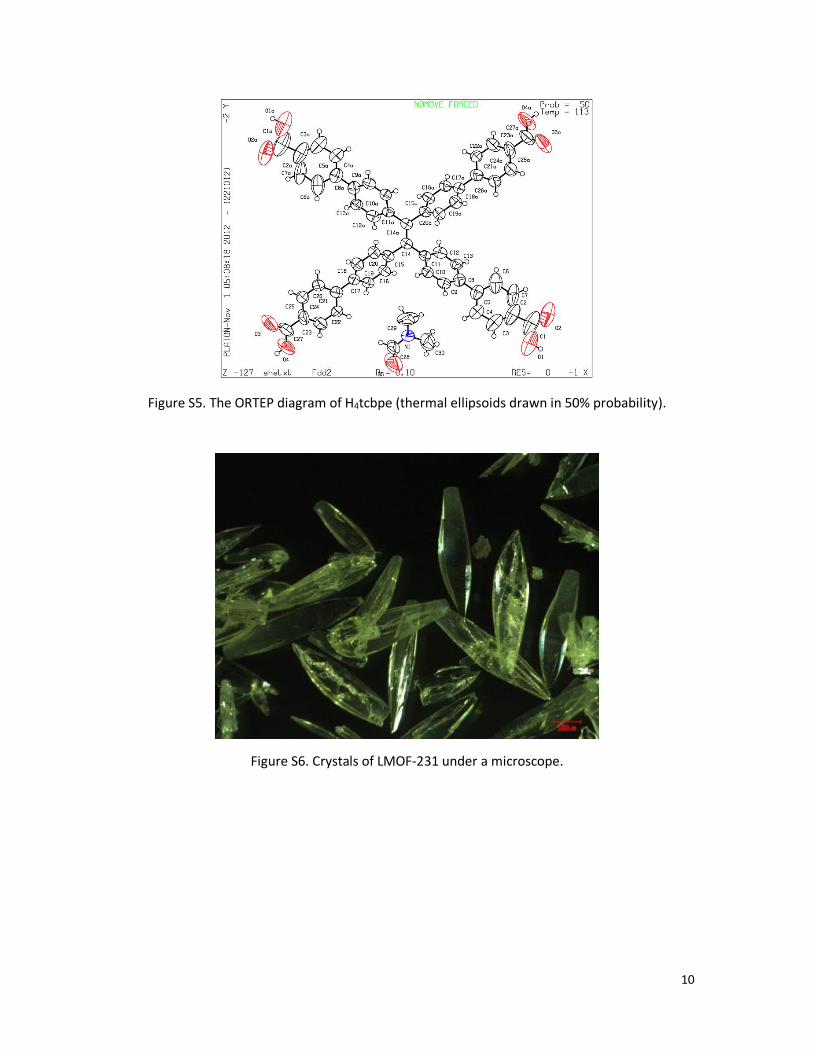
Figure S7. The overall 3D structure of LMOF-231 represented by a ball-and-stick model (left, H is
omitted for clarity, C in grey, O in red, Zn in aqua) and a space-filling model (right, H in white, C in
orange, O in red, Zn in aqua).
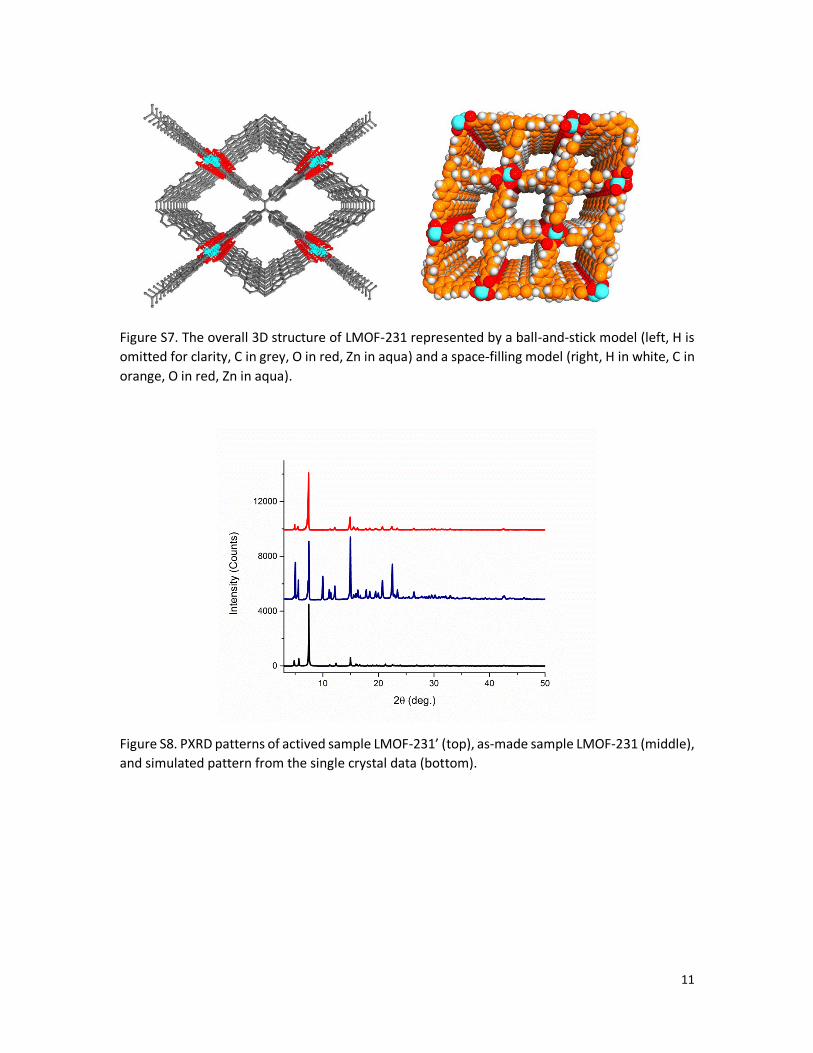
Figure S8. PXRD patterns of actived sample LMOF-231’ (top), as-made sample LMOF-231 (middle),
and simulated pattern from the single crystal data (bottom).
12
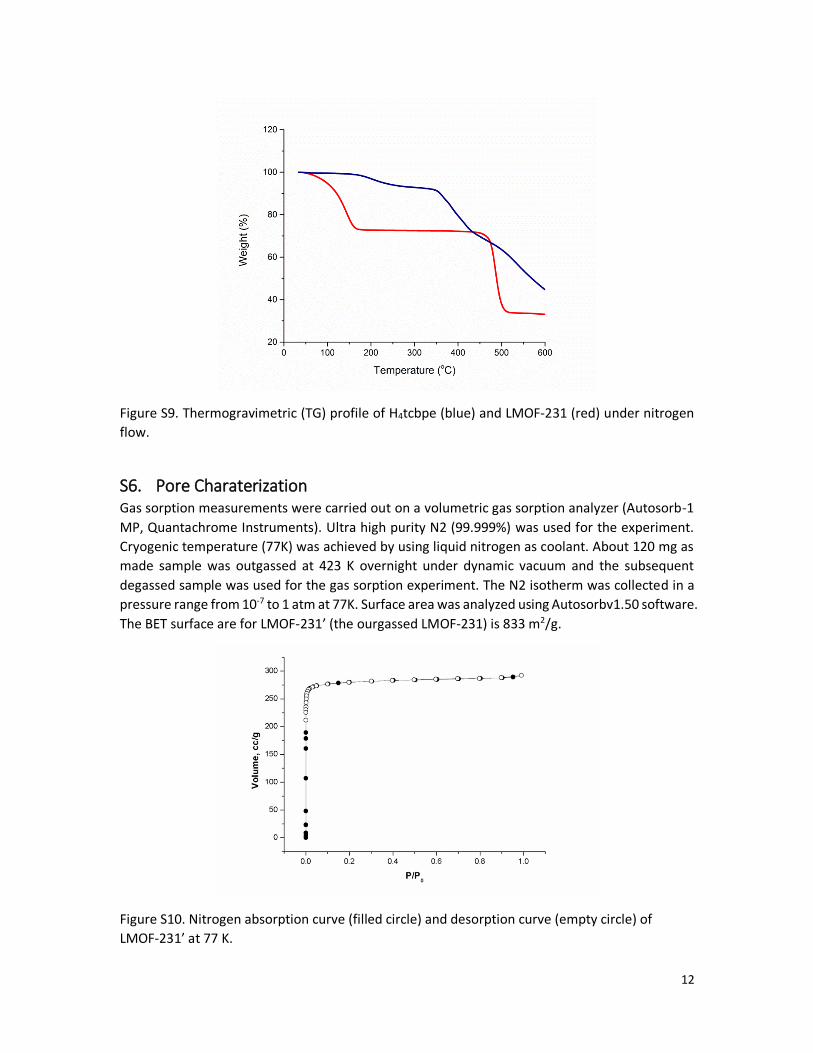
Figure S9. Thermogravimetric (TG) profile of H4tcbpe (blue) and LMOF-231 (red) under nitrogen
flow.
S6. Pore Charaterization Gas sorption measurements were carried out on a volumetric gas sorption analyzer (Autosorb-1
MP, Quantachrome Instruments). Ultra high purity N2 (99.999%) was used for the experiment.
Cryogenic temperature (77K) was achieved by using liquid nitrogen as coolant. About 120 mg as
made sample was outgassed at 423 K overnight under dynamic vacuum and the subsequent
degassed sample was used for the gas sorption experiment. The N2 isotherm was collected in a
pressure range from 10-7 to 1 atm at 77K. Surface area was analyzed using Autosorbv1.50 software.
The BET surface are for LMOF-231’ (the ourgassed LMOF-231) is 833 m2/g.
Figure S10. Nitrogen absorption curve (filled circle) and desorption curve (empty circle) of
LMOF-231’ at 77 K.
13
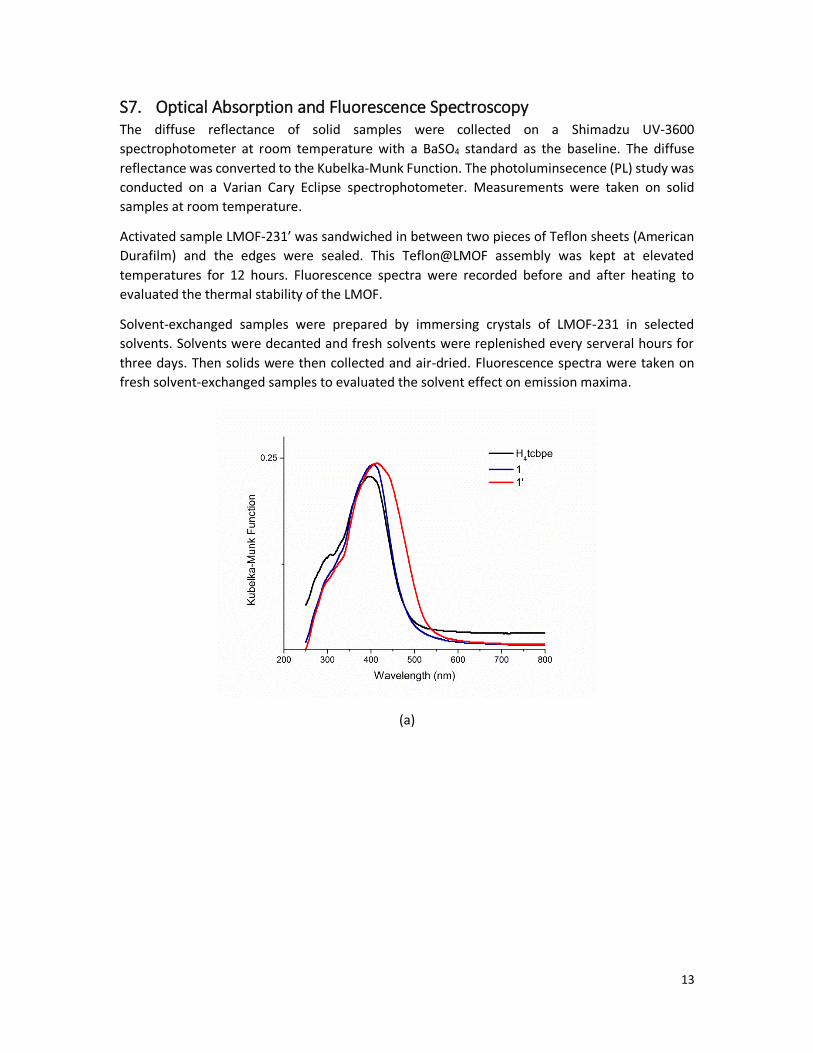
S7. Optical Absorption and Fluorescence Spectroscopy The diffuse reflectance of solid samples were collected on a Shimadzu UV-3600
spectrophotometer at room temperature with a BaSO4 standard as the baseline. The diffuse
reflectance was converted to the Kubelka-Munk Function. The photoluminsecence (PL) study was
conducted on a Varian Cary Eclipse spectrophotometer. Measurements were taken on solid
samples at room temperature.
Activated sample LMOF-231’ was sandwiched in between two pieces of Teflon sheets (American
Durafilm) and the edges were sealed. This Teflon@LMOF assembly was kept at elevated
temperatures for 12 hours. Fluorescence spectra were recorded before and after heating to
evaluated the thermal stability of the LMOF.
Solvent-exchanged samples were prepared by immersing crystals of LMOF-231 in selected
solvents. Solvents were decanted and fresh solvents were replenished every serveral hours for
three days. Then solids were then collected and air-dried. Fluorescence spectra were taken on
fresh solvent-exchanged samples to evaluated the solvent effect on emission maxima.
(a)
14
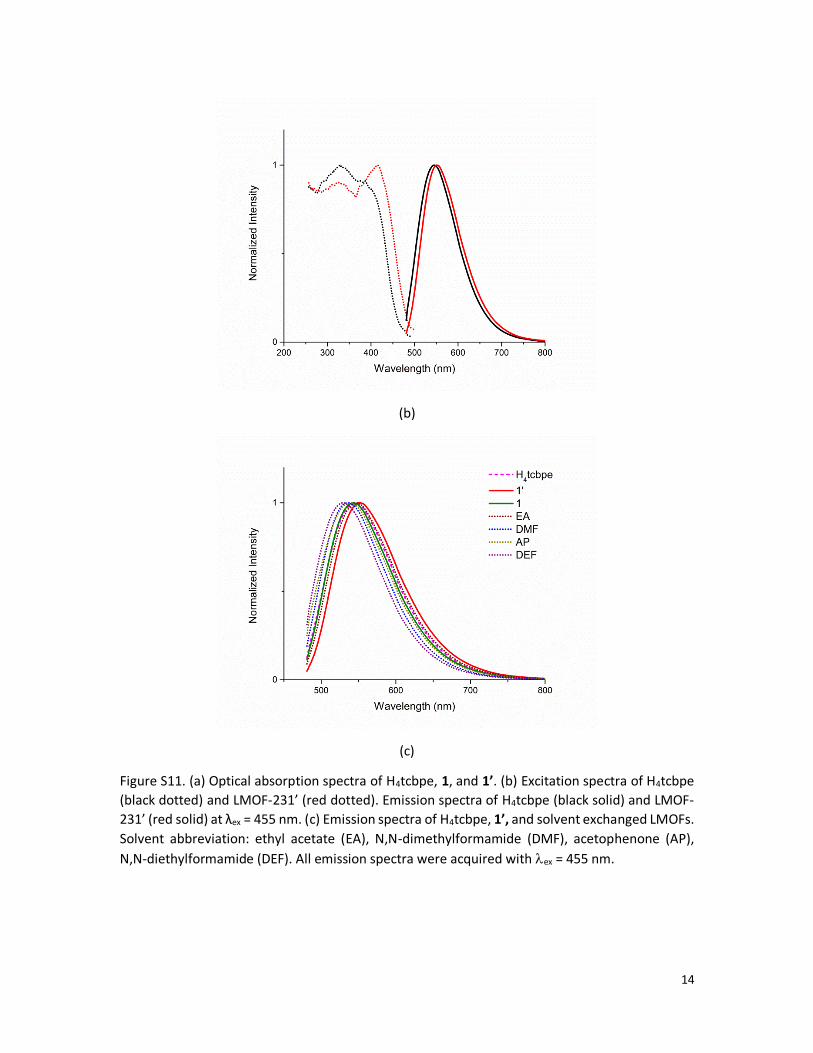
(b)
(c)
Figure S11. (a) Optical absorption spectra of H4tcbpe, 1, and 1’. (b) Excitation spectra of H4tcbpe
(black dotted) and LMOF-231’ (red dotted). Emission spectra of H4tcbpe (black solid) and LMOF-
231’ (red solid) at λex = 455 nm. (c) Emission spectra of H4tcbpe, 1’, and solvent exchanged LMOFs.
Solvent abbreviation: ethyl acetate (EA), N,N-dimethylformamide (DMF), acetophenone (AP),
N,N-diethylformamide (DEF). All emission spectra were acquired with ex = 455 nm.
15
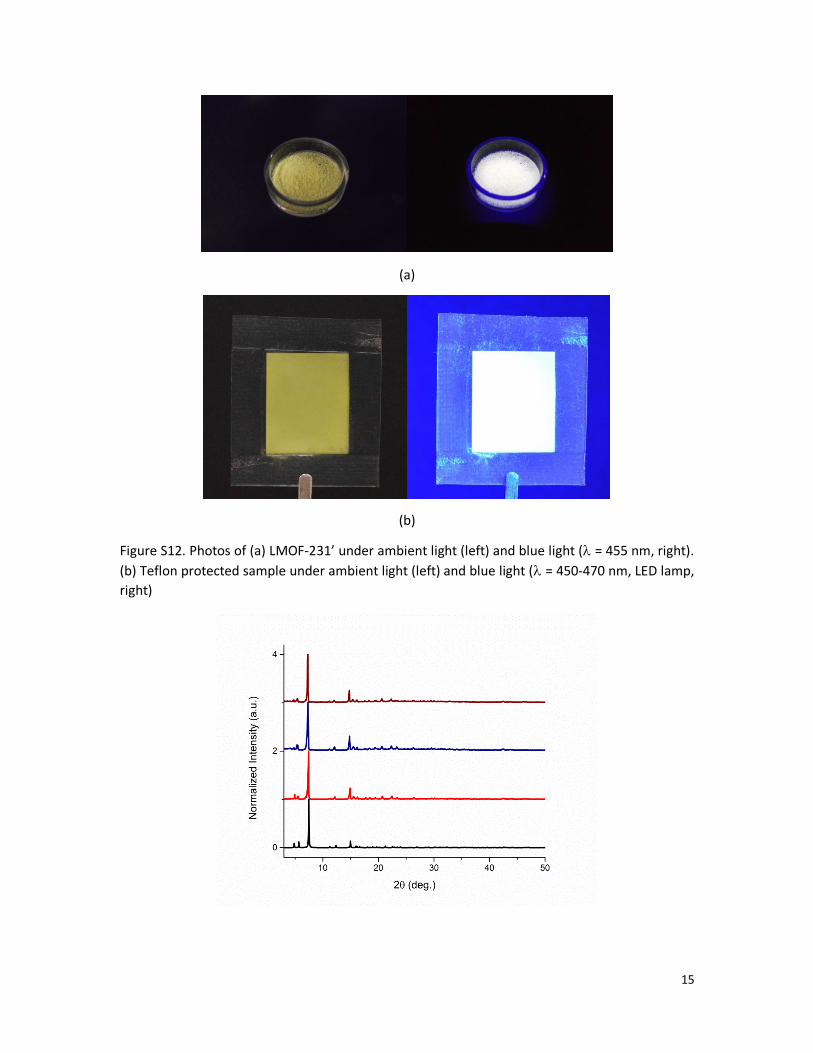
(a)
(b)
Figure S12. Photos of (a) LMOF-231’ under ambient light (left) and blue light ( = 455 nm, right).
(b) Teflon protected sample under ambient light (left) and blue light ( = 450-470 nm, LED lamp,
right)
16
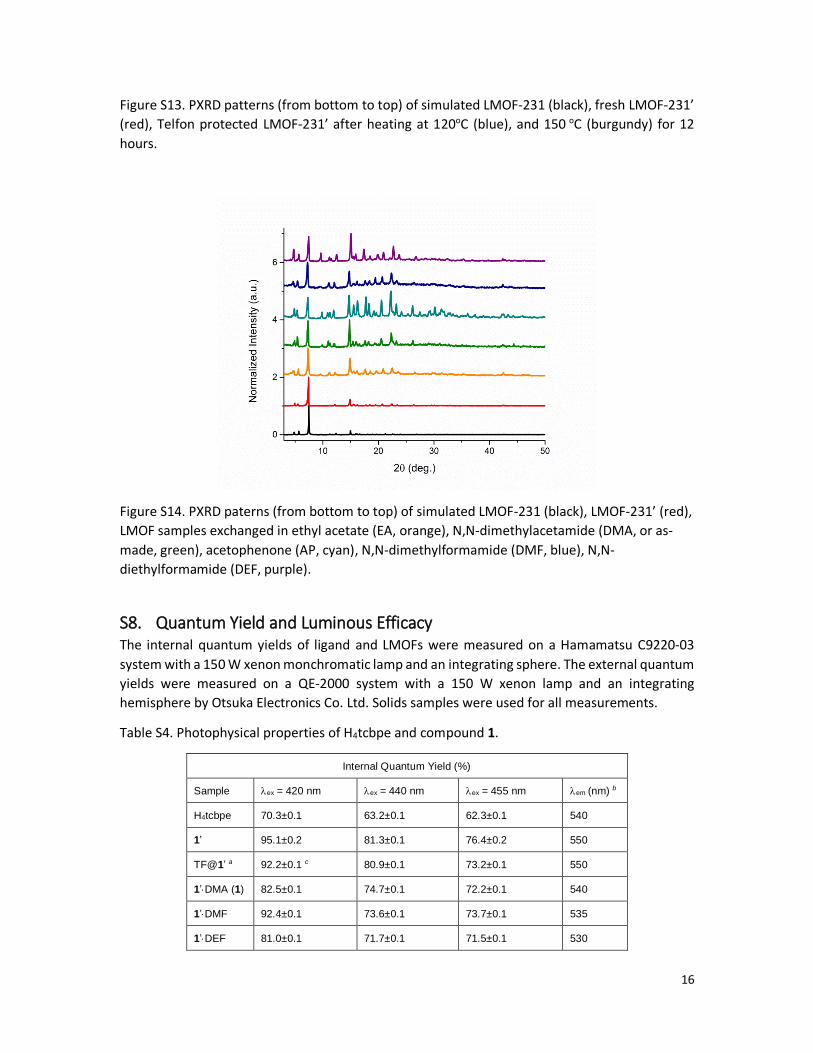
Figure S13. PXRD patterns (from bottom to top) of simulated LMOF-231 (black), fresh LMOF-231’
(red), Telfon protected LMOF-231’ after heating at 120oC (blue), and 150 oC (burgundy) for 12
hours.
Figure S14. PXRD paterns (from bottom to top) of simulated LMOF-231 (black), LMOF-231’ (red),
LMOF samples exchanged in ethyl acetate (EA, orange), N,N-dimethylacetamide (DMA, or as-
made, green), acetophenone (AP, cyan), N,N-dimethylformamide (DMF, blue), N,N-
diethylformamide (DEF, purple).
S8. Quantum Yield and Luminous Efficacy The internal quantum yields of ligand and LMOFs were measured on a Hamamatsu C9220-03
system with a 150 W xenon monchromatic lamp and an integrating sphere. The external quantum
yields were measured on a QE-2000 system with a 150 W xenon lamp and an integrating
hemisphere by Otsuka Electronics Co. Ltd. Solids samples were used for all measurements.
Table S4. Photophysical properties of H4tcbpe and compound 1.
Internal Quantum Yield (%)
Sample ex = 420 nm ex = 440 nm ex = 455 nm em (nm) b
H4tcbpe 70.3±0.1 63.2±0.1 62.3±0.1 540
1’ 95.1±0.2 81.3±0.1 76.4±0.2 550
TF@1’ a 92.2±0.1 c 80.9±0.1 73.2±0.1 550
1’DMA (1) 82.5±0.1 74.7±0.1 72.2±0.1 540
1’DMF 92.4±0.1 73.6±0.1 73.7±0.1 535
1’DEF 81.0±0.1 71.7±0.1 71.5±0.1 530
17
1’EA 93.9±0.1 81.1±0.6 76.3±0.1 545
1’AP 72.1±0.1 68.0±0.1 60.3±0.1 540
External Quantum Yield (expressed as % of Internal Quantum Yield)
Sample ex = 400 nm ex = 415 nm ex = 440 nm ex = 455 nm em (nm) b
1 96.0 94.2 80.6 64.6 540
1’ 96.5 96.0 93.3 88.7 550
Thermal stability d (Decrease in Percent Intensity, ±2%)
Sample 100 C 120 C 150 C 160 C em (nm) b
TF@1’ 1 2 10 15 550
a Teflon protected sample in 120 C oven for 12 h. b ex = 455 nm. em has a ±2nm deviation. c ex
= 415 nm d Sample under different temperatures for 12 h, ex = 455 nm.
Fine powder of LMOF-231’ was dispersed in ethyl acetate under ultrasonication for 1 hour. A LED
bulb was then dipped in this suspension and air dried. This process was repeated a few times until
a uniform phosphor layer was deposited. Alternatively, this phosphor can be coated by spraying
the suspension onto the targeted surface.
The lunimous efficacy of a PC-WLED assembly (a 5 mm, 20 mA, 3 V, 455-460 nm LED bulb coated
with LMOF-231’) was evaluated on a MCPD-9800(3683) P16 system with a halfmoon integrating
sphere (HM500 base-down) by Otsuka Electronics Co. Ltd. A total of 180 measurements were
performed, and the average value was reported.
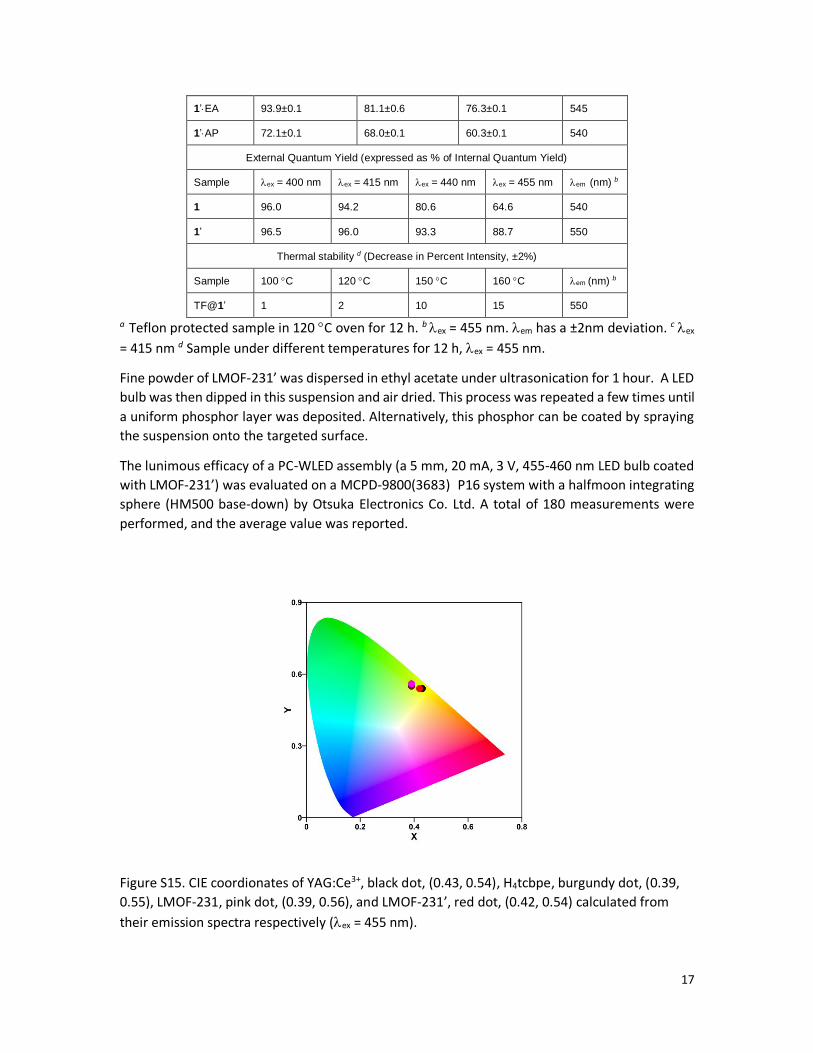
Figure S15. CIE coordionates of YAG:Ce3+, black dot, (0.43, 0.54), H4tcbpe, burgundy dot, (0.39,
0.55), LMOF-231, pink dot, (0.39, 0.56), and LMOF-231’, red dot, (0.42, 0.54) calculated from
their emission spectra respectively (ex = 455 nm).
18
S9. References 1. M. J. Frisch, G. W. Trucks, H. B. Schlegel, G. E. Scuseria, M. A. Robb, J. R. Cheeseman, G.
Scalmani, V. Barone, B. Mennucci, G. A. Petersson, H. Nakatsuji, M. Caricato, X. Li, H. P. Hratchian, A. F. Izmaylov, J. Bloino, G. Zheng, J. L. Sonnenberg, M. Hada, M. Ehara, K. Toyota, R. Fukuda, J. Hasegawa, M. Ishida, T. Nakajima, Y. Honda, O. Kitao, H. Nakai, T. Vreven, J. J. A. Montgomery, J. E. Peralta, F. Ogliaro, M. Bearpark, J. J. Heyd, E. Brothers, K. N. Kudin, V. N. Staroverov, T. Keith, R. Kobayashi, J. Normand, K. Raghavachari, A. Rendell, J. C. Burant, S. S. Iyengar, J. Tomasi, M. Cossi, N. Rega, J. M. Millam, M. Klene, J. E. Knox, J. B. Cross, V. Bakken, C. Adamo, J. Jaramillo, R. Gomperts, R. E. Stratmann, O. Yazyev, A. J. Austin, R. Cammi, C. Pomelli, J. W. Ochterski, R. L. Martin, K. Morokuma, V. G. Zakrzewski, G. A. Voth, P. Salvador, J. J. Dannenberg, S. Dapprich, A. D. Daniels, O. Farkas, J. B. Foresman, J. V. Ortiz, J. Cioslowski and D. J. Fox, Gaussian 09, Revision C.01, Gaussian, Inc., Wallingford CT, 2010.
2. A. D. Becke, Phys. Rev. A, 1988, 38, 3098-3100. 3. C. Lee, W. Yang and R. G. Parr, Phys. Rev. B, 1988, 37, 785-789. 4. A. D. Becke, J. Chem. Phys., 1993, 98, 5648-5652. 5. N. Godbout, D. R. Salahub, J. Andzelm and E. Wimmer, Can. J. Chem., 1992, 70, 560-571. 6. C. Sosa, J. Andzelm, B. C. Elkin, E. Wimmer, K. D. Dobbs and D. A. Dixon, J. Phys. Chem.,
1992, 96, 6630-6636. 7. V. S. Vyas, M. Banerjee and R. Rathore, Tetrahedron Lett., 2009, 50, 6159-6162. 8. J. Li, Z. Hu and Q. Gong, 4/25/2014, US Provisional 61984154. 9. Z. Wei, Z.-Y. Gu, R. K. Arvapally, Y.-P. Chen, R. N. McDougald, J. F. Ivy, A. A. Yakovenko,
D. Feng, M. A. Omary and H.-C. Zhou, J. Am. Chem. Soc., 2014, 136, 8269-8276. 10. G. M. Sheldrick, SHELX-97, Program for Structure Refinement, University of Göettingen,
Germany, 1997. 11. A. L. Spek, PLATON, A multipurpose crystallographic tool ; Utrecht University: Utrecht,
The Netherlands, 2001. 12. G. M. Sheldrick, CELL_NOW, V. 2008/2. Bruker AXS, Inc., Madison, Wisconsin, USA, 2008. 13. APEX II, V. 2009.3-0, Bruker AXS, Inc., Madison, Wisconsin, USA, 2009. 14. G. M. Sheldrick, TWINABS, V. 2012/1, Bruker AXS Inc., Madison, Wisconsin, USA, 2012.