Achievements & Challenges Contra Costa County Transportation Town Hall May 25,2006 Bay Area...
20
Achievements & Challenges Contra Costa County Transportation Town Hall May 25,2006 Bay Area Transportation:
-
Upload
jordan-webster -
Category
Documents
-
view
214 -
download
1
Transcript of Achievements & Challenges Contra Costa County Transportation Town Hall May 25,2006 Bay Area...

Achievements & ChallengesAchievements & Challenges
Contra Costa CountyTransportation Town Hall
May 25,2006
Bay Area Transportation:

Bay Bridge UpdateBay Bridge Update
$5.5 Billion project to replace East Span moving full speed ahead
Solid Financing Plan approved by the legislature in 2005 preserves equitable state/local split
Tolls rise to $4 in January 2007
$1.4 billion SAS awarded April 2006 to Joint Venture American Bridge/Fluor Enterprises
Skyway portion now 88% complete
New bridge targeted to open for traffic in 2013

California has a Transportation CrisisCalifornia has a Transportation Crisis
Imperiling our economy
Degrading our quality Of life
Threatening our Environment
Jeopardizing our future

The Crumbling of An EmpireThe Crumbling of An Empire
Once the envy of the world, California’s roads and highways are now the worst in the nation
Caltrans estimates the value of our
state highway system at $300 billion
We must take immediate action to
preserve this enormous asset
Caltrans estimates the value of our
state highway system at $300 billion
We must take immediate action to
preserve this enormous asset

Declining Pavement MaintenanceDeclining Pavement Maintenance
Source: Legislative Analyst Office, February 2004
Caltrans’ road
maintenance
division
estimates a
$587 million
backlog in
deferred
maintenance
on state
highway
system
Caltrans’ road
maintenance
division
estimates a
$587 million
backlog in
deferred
maintenance
on state
highway
system

Growing Pressure on State HighwaysGrowing Pressure on State Highways
Miles Traveled Source: Legislative Analyst Office, February 2004 Lane Miles Added, Source: Federal Highway Administration

Congestion Costs California BillionsCongestion Costs California Billions Three of the 5 most congested U.S. urban
areas — and 6 of the top 15 — are in California
1. Los Angeles
2. San Francisco/Oakland
5. San Diego
15. San JoseSacramentoBakersfield
Cost of congestion = extra fuel + wasted time + lost productivity
Total cost for California: $20.7 billion every year
Cost of congestion = extra fuel + wasted time + lost productivity
Total cost for California: $20.7 billion every year

State of the System:
Top 10 Worst Highway BottlenecksTop 10 Worst Highway Bottlenecks

State Gas Tax Hasn’t Kept PaceState Gas Tax Hasn’t Kept Pace
The state’s gas tax has lost one-third of its value since 1964, adjusted for inflation.The state’s gas tax has lost one-third of its value since 1964, adjusted for inflation.

Feds to the Rescue? Not LikelyFeds to the Rescue? Not Likely
Purchasing power of federal gas tax has also eroded due to inflation

Growth Trends: 2000–2030Growth Trends: 2000–2030 California’s population to grow 41%
Bay Area’s population to grow 29%

Projected Revenues Transit Capital & Operations
Local Streets & Roads MaintenanceState Highway Maintenance
Regional Operations Programs
How we will meet the ChallengeHow we will meet the Challenge
Transportation 2030 Plan based on 3 main themes:
Adequate Maintenance
System Efficiency
Strategic Expansion
Financially Constrained Element
Vision Element
Projected Revenues$118 billion
Shortfall
$18 billion

Where Is All the Money Going?Where Is All the Money Going?

Would $20 billion Infrastructure Bond Make a Difference? Would $20 billion Infrastructure Bond Make a Difference? Estimated $4/5 billion to
Bay Area over next 10 years
Significant down payment, but no silver bullet
$1.3 billion for Bay Area Transit
$375 million for Local Streets and Roads
$225 million for State Transportation Improvement Program
Estimated $2 billion-plus for Corridor Mobility, Trade Corridors, Transit Security and State-local Partnership
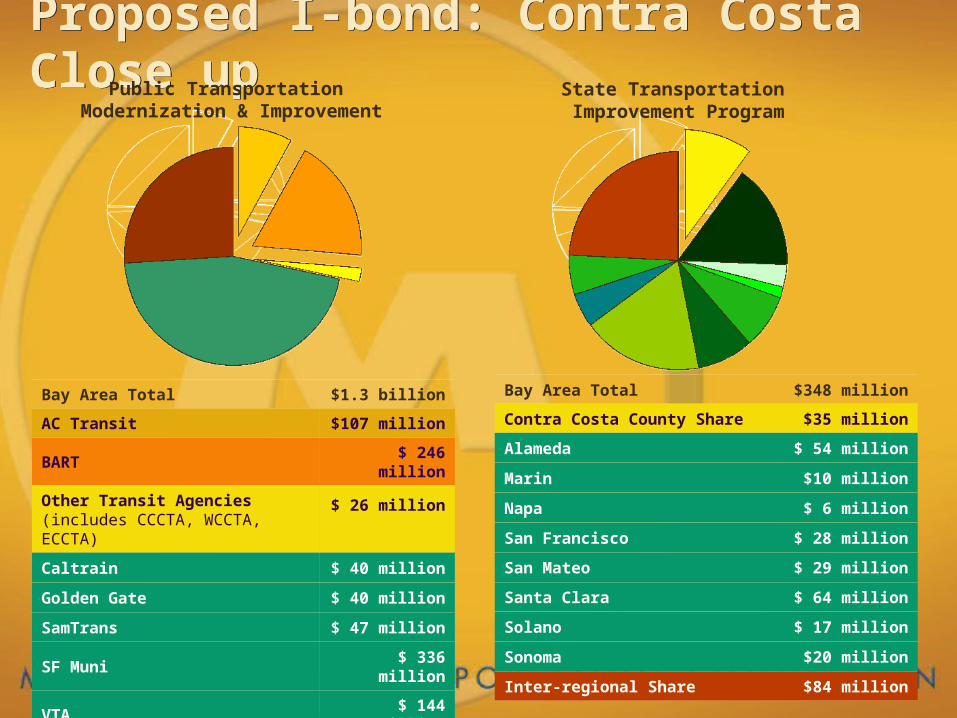
Proposed I-bond: Contra Costa Close upProposed I-bond: Contra Costa Close upPublic Transportation
Modernization & Improvement
Bay Area Total $1.3 billion
AC Transit $107 million
BART $ 246 million
Other Transit Agencies (includes CCCTA, WCCTA, ECCTA)
$ 26 million
Caltrain $ 40 million
Golden Gate $ 40 million
SamTrans $ 47 million
SF Muni $ 336 million
VTA $ 144 million
Population Share (MTC) $347 million
State Transportation Improvement Program
Bay Area Total $348 million
Contra Costa County Share $35 million
Alameda $ 54 million
Marin $10 million
Napa $ 6 million
San Francisco $ 28 million
San Mateo $ 29 million
Santa Clara $ 64 million
Solano $ 17 million
Sonoma $20 million
Inter-regional Share $84 million

Contra Costa County $25,000,000
ANTIOCH $3,207,143
BRENTWOOD $1,458,044
CLAYTON 400,000
CONCORD 3,953,481
DANVILLE 1,367,814
EL CERRITO 745,702
HERCULES 757,235
LAFAYETTE 768,577
MARTINEZ 1,162,254
MORAGA $ 519,078
OAKLEY 923,716
ORINDA 562,128
PINOLE 618,426
PITTSBURG 2,000,918
PLEASANT HILL 1,063,128
RICHMOND 3,287,302
SAN PABLO 991,770
SAN RAMON 1,688,226
WALNUT CREEK 2,100,426
(Continued)
Contra Costa County Total $52 million
Proposed I-bond: Contra Costa CloseupProposed I-bond: Contra Costa CloseupLocal Streets And Roads

Other I-Bond Funding Sources Could Boost Contra Costa Projects
Other I-Bond Funding Sources Could Boost Contra Costa Projects• Corridor Mobility
Program• Trade Corridors• State-Local Partnership• Transit Security
Decisions to be made by CTC
Eligible Projects could include:
Caldecott Tunnel 4th bore e-BART Highway 4 widening

More Work to Be DoneMore Work to Be Done
I-Bond an important step in the right direction
Respects local decision-making instead of specific earmarks
Leaves $12–15 billion hole that still must be filled

Other Potential Revenue SourcesOther Potential Revenue Sources
Steep hill to climb
To make wise investment choices, MTC supports performance-based approach
MTC will need help from local partners, state legislators

For More Information or to Download this Presentation Go to:
For More Information or to Download this Presentation Go to:
www.mtc.ca.govwww.mtc.ca.gov