
Accurate detection of subclonal single nucleotide variants in whole
12
http://www.diva-portal.org This is the published version of a paper published in BMC Genomics. Citation for the original published paper (version of record): Berglund, E., Lindqvist, C., Hayat, S., Övernäs, E., Henriksson, N. et al. (2013) Accurate detection of subclonal single nucleotide variants in whole genome amplified and pooled cancer samples using HaloPlex target enrichment. BMC Genomics, 14: 856 http://dx.doi.org/10.1186/1471-2164-14-856 Access to the published version may require subscription. N.B. When citing this work, cite the original published paper. Permanent link to this version: http://urn.kb.se/resolve?urn=urn:nbn:se:umu:diva-84777
Transcript of Accurate detection of subclonal single nucleotide variants in whole
http://www.diva-portal.org
This is the published version of a paper published in BMC Genomics.
Citation for the original published paper (version of record):
Berglund, E., Lindqvist, C., Hayat, S., Övernäs, E., Henriksson, N. et al. (2013)
Accurate detection of subclonal single nucleotide variants in whole genome amplified and
pooled cancer samples using HaloPlex target enrichment.
BMC Genomics, 14: 856
http://dx.doi.org/10.1186/1471-2164-14-856
Access to the published version may require subscription.
N.B. When citing this work, cite the original published paper.
Permanent link to this version:http://urn.kb.se/resolve?urn=urn:nbn:se:umu:diva-84777
Berglund et al. BMC Genomics 2013, 14:856http://www.biomedcentral.com/1471-2164/14/856
METHODOLOGY ARTICLE Open Access
Accurate detection of subclonal single nucleotidevariants in whole genome amplified and pooledcancer samples using HaloPlex target enrichmentEva C Berglund1*†, Carl Mårten Lindqvist1†, Shahina Hayat1, Elin Övernäs1, Niklas Henriksson1, Jessica Nordlund1,Per Wahlberg1, Erik Forestier2,4, Gudmar Lönnerholm3,4 and Ann-Christine Syvänen1
Abstract
Background: Target enrichment and resequencing is a widely used approach for identification of cancer genes andgenetic variants associated with diseases. Although cost effective compared to whole genome sequencing, analysis ofmany samples constitutes a significant cost, which could be reduced by pooling samples before capture. Anotherlimitation to the number of cancer samples that can be analyzed is often the amount of available tumor DNA. Weevaluated the performance of whole genome amplified DNA and the power to detect subclonal somatic singlenucleotide variants in non-indexed pools of cancer samples using the HaloPlex technology for target enrichment andnext generation sequencing.
Results: We captured a set of 1528 putative somatic single nucleotide variants and germline SNPs, which wereidentified by whole genome sequencing, with the HaloPlex technology and sequenced to a depth of 792–1752. Wefound that the allele fractions of the analyzed variants are well preserved during whole genome amplification and thatcapture specificity or variant calling is not affected. We detected a large majority of the known single nucleotidevariants present uniquely in one sample with allele fractions as low as 0.1 in non-indexed pools of up to ten samples.We also identified and experimentally validated six novel variants in the samples included in the pools.
Conclusion: Our work demonstrates that whole genome amplified DNA can be used for target enrichment equallywell as genomic DNA and that accurate variant detection is possible in non-indexed pools of cancer samples. Thesefindings show that analysis of a large number of samples is feasible at low cost, even when only small amounts of DNAis available, and thereby significantly increases the chances of indentifying recurrent mutations in cancer samples.
Keywords: Target enrichment, HaloPlex, Non-indexed pooling, Whole genome amplification, Single nucleotide variant,Deep sequencing
BackgroundDuring the past decade, next generation sequencing(NGS) technologies have revolutionized the field ofhuman genetics. Since the first draft of the humangenome was published in 2001 [1,2], a multitude ofpersonal genomes have been sequenced [3]. Large-scaleefforts of whole genome sequencing (WGS) of humansamples have mainly focused on population-based stu-dies [4] and cancer genomes [5,6]. For most research
* Correspondence: [email protected]†Equal contributors1Department of Medical Sciences, Molecular Medicine and Science for LifeLaboratory, Uppsala University, Uppsala, SwedenFull list of author information is available at the end of the article
© 2013 Berglund et al.; licensee BioMed CentrCommons Attribution License (http://creativecreproduction in any medium, provided the or
groups, WGS of many samples remains a costly en-deavor, and targeted capture followed by sequencing ofselected genomic regions of interest provides an attract-ive, cost-effective alternative. Target capture of customdesigned regions and exome sequencing has allowedidentification of causal variants in several Mendeliandisorders [7], variants associated with complex diseases[8], and recurrently mutated cancer genes [9].Target capture technologies can be categorized into
methods based on PCR amplification, hybrid capture, orselective circularization [10]. The HaloPlex technology isa selective circularization-based method which is a fur-ther development of the principle of selector probes
al Ltd. This is an open access article distributed under the terms of the Creativeommons.org/licenses/by/2.0), which permits unrestricted use, distribution, andiginal work is properly cited.
Berglund et al. BMC Genomics 2013, 14:856 Page 2 of 11http://www.biomedcentral.com/1471-2164/14/856
[11-13]. In the HaloPlex technology, genomic DNA isfragmented by restriction enzyme digestion and circu-larized by hybridization to probes whose ends are com-plementary to the target fragments. Compared to hybridcapture methods, the HaloPlex system requires smalleramounts of starting DNA, has higher specificity (fractionof sequence reads in the region of interest), and providesmore even genome coverage [10]. The sample pre-paration is less laborious because incorporation ofsequencing adapters during capture obviates the needfor a separate library preparation step. However, amaximum of 5 Mb of custom designed regions can beenriched with current protocols, which is little comparedto for example 24 Mb for SureSelect hybrid capture.To further decrease costs, samples can be pooled prior
to capture. Indexing of samples before pooling allowsposterior identification of the sample where a variantoccurred, and results in more accurate estimation of al-lele frequencies. However, the presence of an additionalindex tag may complicate experimental procedures,decrease capture specificity, and result in a substantialproportion of reads with an inappropriate index tag[14,15]. Indexed pooling is feasible in hybrid capturemethods, where the sequencing library is preparedbefore capture, but not for the current HaloPlex proto-col, where the capture is performed on genomic DNA.Pooling without indexing can be done at the level ofgenomic DNA, and is thus an efficient approach interms of reagent costs and experimental work load.While non-indexed pooling has not yet been used withthe HaloPlex technology, several studies have evaluatedthe performance of non-indexed pools using hybridcapture. These studies have yielded conflicting results,with some observing accurate SNP calling and determin-ation of allele frequencies [15,16], while others observepoor allele frequency estimates or failure to validateSNPs with minor allele frequencies below 25% [17,18].Previous studies of non-indexed pooling aimed at
establishing methods for detecting rare variants in com-plex phenotypes, using HapMap cell lines or other non-tumor samples. To our knowledge, pooling of cancersamples for identification of somatic single nucleotidevariants (SNVs) has not been evaluated to date. In con-trast to germline SNPs, most somatic SNVs are not ex-pected to be recurrent in the population, nor in otherindividuals with the same type of cancer. Additionally,cancer samples often consist of multiple tumor sub-clones in mixtures with normal cells, and the proportionof sequence reads containing an SNV can therefore bevery low in pools of cancer samples. Another consider-ation when working with tumor samples is that DNA re-sources are often limited. Whole genome amplification(WGA) by multiple displacement amplification is astandard method to increase DNA quantity. Evaluation
of whole genome amplified DNA (wgaDNA) for geno-typing purposes has shown that the allele fractions inthe original sample are retained provided that a suffi-cient amount of genomic DNA is used [19,20]. The useof wgaDNA in WGS can result in uneven coverage andintroduce false positive inversions [21], and in hybridcapture it has been associated with accurate SNP detec-tion but a slightly decreased capture specificity [22].However, it has not been properly investigated usingNGS how well the allele fractions of somatic SNVs arepreserved during WGA.In this study, we investigated the power to detect som-
atic SNVs in non-indexed pools of up to ten cancer sam-ples and the effect of WGA on capture specificity andallele fractions using HaloPlex target enrichment. Weanalyzed 1528 candidate SNVs and SNPs identified byWGS of matched cancer and normal samples from twopatients with acute lymphoblastic leukemia (ALL).
Results and discussionDesign of HaloPlex target enrichment experimentFor evaluation of the performance of whole genomeamplified DNA (wgaDNA) and non-indexed pooling inHaloPlex target enrichment, we selected 1541 candidatesingle nucleotide variants (SNVs) detected during wholegenome sequencing (WGS) of two patients with acutelymphoblastic leukemia (ALL). Thirty of the SNVs werepreviously validated as somatic by PCR and Sanger se-quencing, and one had been shown to be a false positive.No indels were included. The candidate SNVs selectedfor evaluation of the HaloPlex target enrichment systemincluded 749 SNVs from patient 1 and 794 from patient2. Two of the SNVs overlapped between the patients.We also selected 20 germline SNPs that were heterozy-gous in both patients. For each of these 1561 variants(1541 candidate SNVs and 20 SNPs), we defined a targetregion of 3 bp, including one base upstream and onebase downstream of each variant. In addition, we se-lected the exons of 37 genes and five custom regionswith a size ranging from 33 to 263 bp. The total numberof target regions was 2431, and together they spanned147 kb. The design obtained from Agilent had a totalsize of 798 kb and covered 99.6% of the region of inter-est. A total of 1528 (97.9%) of the SNVs and SNPs werecovered by the design, including 1509 candidate SNVs(726 in patient 1 and 785 in patient 2, including the twooverlapping SNVs) and 19 of the 20 germline SNPs. Thefailure to completely cover a region of interest can be at-tributed to repeated regions in the flanking sequences,lack of restriction fragments of appropriate size, or toolarge fragments relative to the read length leading topartial sequencing of fragments.A total of twelve samples or pools were subjected to
target capture using the HaloPlex system (Table 1). First,
Berglund et al. BMC Genomics 2013, 14:856 Page 3 of 11http://www.biomedcentral.com/1471-2164/14/856
for validation of putative SNVs detected in WGS data,we included genomic DNA (gDNA) from cancer andnormal samples from the two whole genome sequencedALL patients, here called ALL1, ALL2, Normal1, andNormal2. Second, to evaluate the effect of whole gen-ome amplification, we included wgaDNA from the ALL1and ALL2 samples. Third, for evaluation of non-indexedpooling, we prepared three pools of two, five or ten ALLsamples. Each pool contained either the ALL1 or theALL2 sample, and the additional samples were presentin only one pool each. The pools were prepared in repli-cate by an independent pooling procedure.
Sequence data and allele fractionsBetween 84.5% and 93.1% of the raw sequence readsmapped to the human genome, and 42.4-73.5% of thesemapped to the target region (Table 1). The averagesequence depth ranged from 792 to 1752 in the regioncovered by the HaloPlex design, and from 1008 to 2254at the 1528 SNVs and SNPs covered by the capturedesign (Table 1). Virtually all SNVs and SNPs werecovered by at least one sequence read, and 91.6-97.4% ofthe variants were covered at a sequence depth of at least30 (Table 1). To determine the accuracy of the allelefractions in the HaloPlex sequence data we utilized the19 heterozygous germline SNPs, which are expected tohave an allele fraction of 0.5 in individual samples fromboth cancer and normal cells. The allele fractions ofthese SNPs deviated from the expected 0.5 by an averageof 0.064 in the HaloPlex data, compared to 0.135 in theWGS data, demonstrating that the increased sequencing
Table 1 Samples and sequence data statistics
Sample orpoola
Average sequence depth Cum
Designb Variantsc ≥
ALL1_gDNA 1385 1940 9
Normal1_gDNA 1280 1588 9
ALL2_gDNA 1466 1791 9
Normal2_gDNA 792 1008 9
ALL1_wgaDNA 1564 1831 9
ALL2_wgaDNA 1569 1706 9
ALL1_pool2 1752 2254 9
ALL2_pool5 1502 1710 9
ALL1_pool10 1044 1445 9
ALL1_pool2_rep 1150 1614 9
ALL2_pool5_rep 1021 1503 9
ALL1_pool10_rep 1386 1837 9a Pools are named with the whole genome sequenced ALL sample included and tha Average sequence depth in the complete region covered by the HaloPlex design.c Average sequence depth at the 1528 candidate SNVs and SNPs covered by the Had Percentage of sequence reads that map to the human genome.e Percentage of the sequence reads mapping to the genome that map to the regio
depth in the HaloPlex data is associated with increasedprecision of allele fractions (Additional file 1: Figure S1).
Somatic SNVsAccurate identification of somatic SNVs in WGS data ischallenging. Different SNV callers often yield differentresults and large numbers of false positive calls [23], andexperimental validation is often required. Target captureand deep sequencing is a well established method forvalidation of large numbers of putative SNVs detected inWGS data [24-26]. Here, we used the HaloPlex deep-sequencing data to classify our candidate SNVs as som-atic or “non-validated”. At the sites where a putativeSNV was detected in the WGS data, we determined theallele fractions in the HaloPlex data, and classified anSNV as somatic if it had an allele fraction ≥0.1 in thegDNA ALL sample and <0.01 in the matched normalsample. We also required a sequence depth ≥30 in bothsamples in the sequencing data from HaloPlex enrich-ment. This resulted in 227 and 305 SNVs classified assomatic in ALL1 and ALL2, respectively, correspondingto approximately one third of the candidate SNVs calledfrom WGS data (Figure 1). As a measure of confidence,all of the 30 previously validated somatic SNVs wereclassified as somatic in the HaloPlex sequence data. Thecandidate SNV that had previously been shown to be afalse positive by Sanger sequencing had no supportingreads in the HaloPlex data.The candidate SNVs that were not somatic displayed
three distinctive patterns. First, many candidate SNVs
ulative depth at variants (%) Mappedreads(%)d
Mappedon target
(%)e1x ≥30x
9.4 96.5 92.4 67.1
9.6 96.2 91.4 60.8
9.4 95.7 92.2 64.7
9.2 95.2 91.8 64.0
9.2 94.2 92.6 73.5
9.1 94.0 92.5 73.0
9.7 97.4 91.8 67.7
9.4 96.9 93.1 68.8
9.6 96.8 89.4 63.0
9.4 95.9 84.5 42.4
9.3 91.6 85.5 49.9
9.5 96.3 85.9 58.5
e total number of samples in the pool.
loPlex design.
ns covered by the HaloPlex design.
0.0
0.2
0.4
0.6
0.8
1.0
Alle
le fr
actio
n A
LL1
0.0 0.2 0.4 0.6 0.8 1.0
Allele fraction normal1
Patient 1
0.0
0.2
0.4
0.6
0.8
1.0
Alle
le fr
actio
n A
LL2
0.0 0.2 0.4 0.6 0.8 1.0
Allele fraction normal2
Patient 2
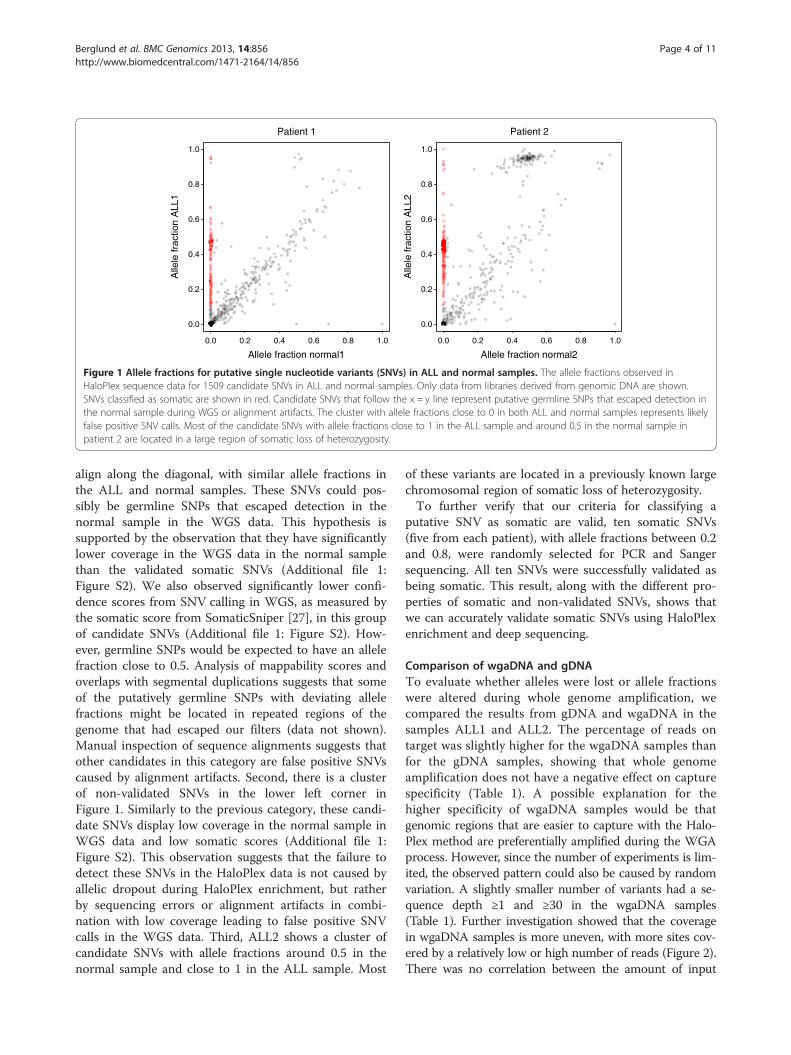
Figure 1 Allele fractions for putative single nucleotide variants (SNVs) in ALL and normal samples. The allele fractions observed inHaloPlex sequence data for 1509 candidate SNVs in ALL and normal samples. Only data from libraries derived from genomic DNA are shown.SNVs classified as somatic are shown in red. Candidate SNVs that follow the x = y line represent putative germline SNPs that escaped detection inthe normal sample during WGS or alignment artifacts. The cluster with allele fractions close to 0 in both ALL and normal samples represents likelyfalse positive SNV calls. Most of the candidate SNVs with allele fractions close to 1 in the ALL sample and around 0.5 in the normal sample inpatient 2 are located in a large region of somatic loss of heterozygosity.
Berglund et al. BMC Genomics 2013, 14:856 Page 4 of 11http://www.biomedcentral.com/1471-2164/14/856
align along the diagonal, with similar allele fractions inthe ALL and normal samples. These SNVs could pos-sibly be germline SNPs that escaped detection in thenormal sample in the WGS data. This hypothesis issupported by the observation that they have significantlylower coverage in the WGS data in the normal samplethan the validated somatic SNVs (Additional file 1:Figure S2). We also observed significantly lower confi-dence scores from SNV calling in WGS, as measured bythe somatic score from SomaticSniper [27], in this groupof candidate SNVs (Additional file 1: Figure S2). How-ever, germline SNPs would be expected to have an allelefraction close to 0.5. Analysis of mappability scores andoverlaps with segmental duplications suggests that someof the putatively germline SNPs with deviating allelefractions might be located in repeated regions of thegenome that had escaped our filters (data not shown).Manual inspection of sequence alignments suggests thatother candidates in this category are false positive SNVscaused by alignment artifacts. Second, there is a clusterof non-validated SNVs in the lower left corner inFigure 1. Similarly to the previous category, these candi-date SNVs display low coverage in the normal sample inWGS data and low somatic scores (Additional file 1:Figure S2). This observation suggests that the failure todetect these SNVs in the HaloPlex data is not caused byallelic dropout during HaloPlex enrichment, but ratherby sequencing errors or alignment artifacts in combi-nation with low coverage leading to false positive SNVcalls in the WGS data. Third, ALL2 shows a cluster ofcandidate SNVs with allele fractions around 0.5 in thenormal sample and close to 1 in the ALL sample. Most
of these variants are located in a previously known largechromosomal region of somatic loss of heterozygosity.To further verify that our criteria for classifying a
putative SNV as somatic are valid, ten somatic SNVs(five from each patient), with allele fractions between 0.2and 0.8, were randomly selected for PCR and Sangersequencing. All ten SNVs were successfully validated asbeing somatic. This result, along with the different pro-perties of somatic and non-validated SNVs, shows thatwe can accurately validate somatic SNVs using HaloPlexenrichment and deep sequencing.
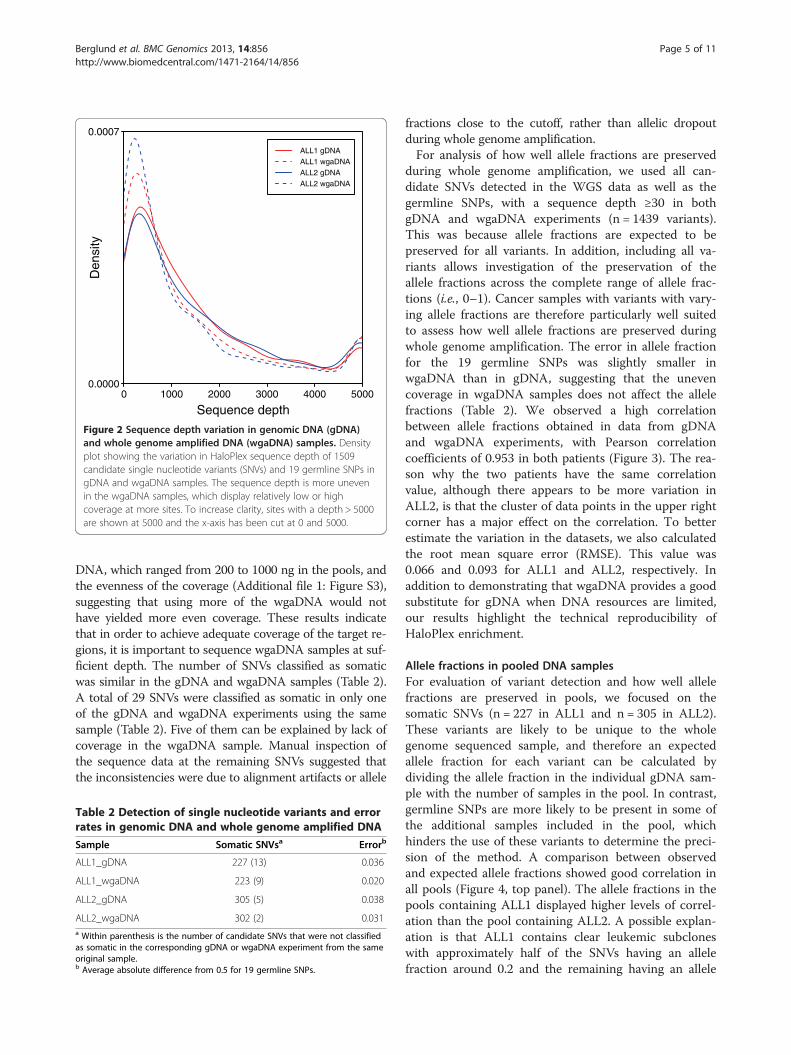
Comparison of wgaDNA and gDNATo evaluate whether alleles were lost or allele fractionswere altered during whole genome amplification, wecompared the results from gDNA and wgaDNA in thesamples ALL1 and ALL2. The percentage of reads ontarget was slightly higher for the wgaDNA samples thanfor the gDNA samples, showing that whole genomeamplification does not have a negative effect on capturespecificity (Table 1). A possible explanation for thehigher specificity of wgaDNA samples would be thatgenomic regions that are easier to capture with the Halo-Plex method are preferentially amplified during the WGAprocess. However, since the number of experiments is lim-ited, the observed pattern could also be caused by randomvariation. A slightly smaller number of variants had a se-quence depth ≥1 and ≥30 in the wgaDNA samples(Table 1). Further investigation showed that the coveragein wgaDNA samples is more uneven, with more sites cov-ered by a relatively low or high number of reads (Figure 2).There was no correlation between the amount of input
0.0000
0.0007
Den
sity
0 1000 2000 3000 4000 5000
Sequence depth
ALL1 gDNAALL1 wgaDNAALL2 gDNAALL2 wgaDNA
Figure 2 Sequence depth variation in genomic DNA (gDNA)and whole genome amplified DNA (wgaDNA) samples. Densityplot showing the variation in HaloPlex sequence depth of 1509candidate single nucleotide variants (SNVs) and 19 germline SNPs ingDNA and wgaDNA samples. The sequence depth is more unevenin the wgaDNA samples, which display relatively low or highcoverage at more sites. To increase clarity, sites with a depth > 5000are shown at 5000 and the x-axis has been cut at 0 and 5000.
Berglund et al. BMC Genomics 2013, 14:856 Page 5 of 11http://www.biomedcentral.com/1471-2164/14/856
DNA, which ranged from 200 to 1000 ng in the pools, andthe evenness of the coverage (Additional file 1: Figure S3),suggesting that using more of the wgaDNA would nothave yielded more even coverage. These results indicatethat in order to achieve adequate coverage of the target re-gions, it is important to sequence wgaDNA samples at suf-ficient depth. The number of SNVs classified as somaticwas similar in the gDNA and wgaDNA samples (Table 2).A total of 29 SNVs were classified as somatic in only oneof the gDNA and wgaDNA experiments using the samesample (Table 2). Five of them can be explained by lack ofcoverage in the wgaDNA sample. Manual inspection ofthe sequence data at the remaining SNVs suggested thatthe inconsistencies were due to alignment artifacts or allele
Table 2 Detection of single nucleotide variants and errorrates in genomic DNA and whole genome amplified DNA
Sample Somatic SNVsa Errorb
ALL1_gDNA 227 (13) 0.036
ALL1_wgaDNA 223 (9) 0.020
ALL2_gDNA 305 (5) 0.038
ALL2_wgaDNA 302 (2) 0.031a Within parenthesis is the number of candidate SNVs that were not classifiedas somatic in the corresponding gDNA or wgaDNA experiment from the sameoriginal sample.b Average absolute difference from 0.5 for 19 germline SNPs.
fractions close to the cutoff, rather than allelic dropoutduring whole genome amplification.For analysis of how well allele fractions are preserved
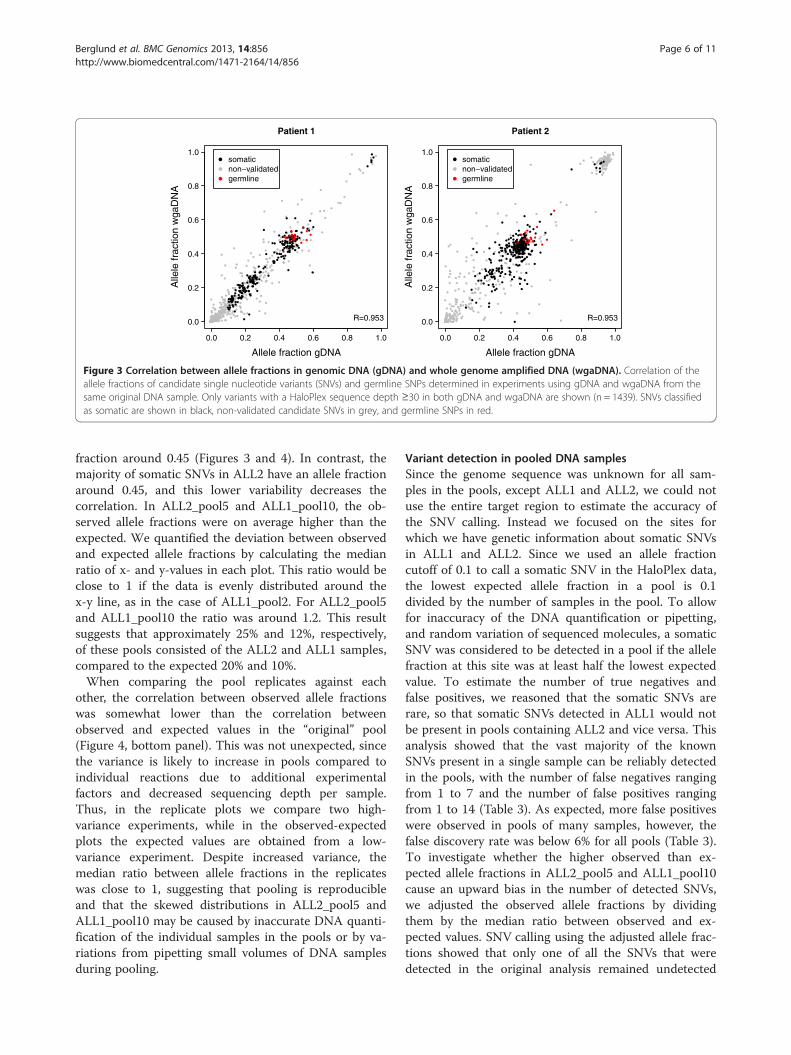
during whole genome amplification, we used all can-didate SNVs detected in the WGS data as well as thegermline SNPs, with a sequence depth ≥30 in bothgDNA and wgaDNA experiments (n = 1439 variants).This was because allele fractions are expected to bepreserved for all variants. In addition, including all va-riants allows investigation of the preservation of theallele fractions across the complete range of allele frac-tions (i.e., 0–1). Cancer samples with variants with vary-ing allele fractions are therefore particularly well suitedto assess how well allele fractions are preserved duringwhole genome amplification. The error in allele fractionfor the 19 germline SNPs was slightly smaller inwgaDNA than in gDNA, suggesting that the unevencoverage in wgaDNA samples does not affect the allelefractions (Table 2). We observed a high correlationbetween allele fractions obtained in data from gDNAand wgaDNA experiments, with Pearson correlationcoefficients of 0.953 in both patients (Figure 3). The rea-son why the two patients have the same correlationvalue, although there appears to be more variation inALL2, is that the cluster of data points in the upper rightcorner has a major effect on the correlation. To betterestimate the variation in the datasets, we also calculatedthe root mean square error (RMSE). This value was0.066 and 0.093 for ALL1 and ALL2, respectively. Inaddition to demonstrating that wgaDNA provides a goodsubstitute for gDNA when DNA resources are limited,our results highlight the technical reproducibility ofHaloPlex enrichment.
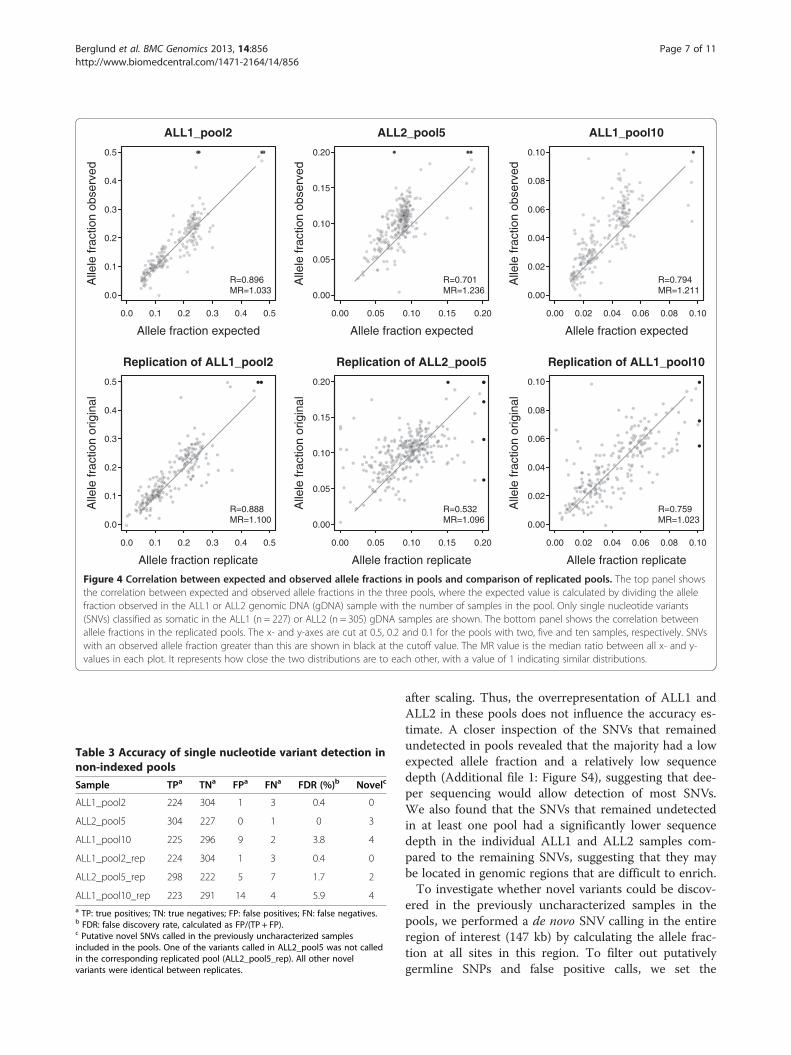
Allele fractions in pooled DNA samplesFor evaluation of variant detection and how well allelefractions are preserved in pools, we focused on thesomatic SNVs (n = 227 in ALL1 and n = 305 in ALL2).These variants are likely to be unique to the wholegenome sequenced sample, and therefore an expectedallele fraction for each variant can be calculated bydividing the allele fraction in the individual gDNA sam-ple with the number of samples in the pool. In contrast,germline SNPs are more likely to be present in some ofthe additional samples included in the pool, whichhinders the use of these variants to determine the preci-sion of the method. A comparison between observedand expected allele fractions showed good correlation inall pools (Figure 4, top panel). The allele fractions in thepools containing ALL1 displayed higher levels of correl-ation than the pool containing ALL2. A possible explan-ation is that ALL1 contains clear leukemic subcloneswith approximately half of the SNVs having an allelefraction around 0.2 and the remaining having an allele
0.0 0.2 0.4 0.6 0.8 1.0
0.0
0.2
0.4
0.6
0.8
1.0
Patient 1
Allele fraction gDNA
Alle
le fr
actio
n w
gaD
NA
R=0.953
somaticnon−validatedgermline
0.0 0.2 0.4 0.6 0.8 1.0
0.0
0.2
0.4
0.6
0.8
1.0
Patient 2
Allele fraction gDNA
Alle
le fr
actio
n w
gaD
NA
R=0.953
somaticnon−validatedgermline
Figure 3 Correlation between allele fractions in genomic DNA (gDNA) and whole genome amplified DNA (wgaDNA). Correlation of theallele fractions of candidate single nucleotide variants (SNVs) and germline SNPs determined in experiments using gDNA and wgaDNA from thesame original DNA sample. Only variants with a HaloPlex sequence depth ≥30 in both gDNA and wgaDNA are shown (n = 1439). SNVs classifiedas somatic are shown in black, non-validated candidate SNVs in grey, and germline SNPs in red.
Berglund et al. BMC Genomics 2013, 14:856 Page 6 of 11http://www.biomedcentral.com/1471-2164/14/856
fraction around 0.45 (Figures 3 and 4). In contrast, themajority of somatic SNVs in ALL2 have an allele fractionaround 0.45, and this lower variability decreases thecorrelation. In ALL2_pool5 and ALL1_pool10, the ob-served allele fractions were on average higher than theexpected. We quantified the deviation between observedand expected allele fractions by calculating the medianratio of x- and y-values in each plot. This ratio would beclose to 1 if the data is evenly distributed around thex-y line, as in the case of ALL1_pool2. For ALL2_pool5and ALL1_pool10 the ratio was around 1.2. This resultsuggests that approximately 25% and 12%, respectively,of these pools consisted of the ALL2 and ALL1 samples,compared to the expected 20% and 10%.When comparing the pool replicates against each
other, the correlation between observed allele fractionswas somewhat lower than the correlation betweenobserved and expected values in the “original” pool(Figure 4, bottom panel). This was not unexpected, sincethe variance is likely to increase in pools compared toindividual reactions due to additional experimentalfactors and decreased sequencing depth per sample.Thus, in the replicate plots we compare two high-variance experiments, while in the observed-expectedplots the expected values are obtained from a low-variance experiment. Despite increased variance, themedian ratio between allele fractions in the replicateswas close to 1, suggesting that pooling is reproducibleand that the skewed distributions in ALL2_pool5 andALL1_pool10 may be caused by inaccurate DNA quanti-fication of the individual samples in the pools or by va-riations from pipetting small volumes of DNA samplesduring pooling.
Variant detection in pooled DNA samplesSince the genome sequence was unknown for all sam-ples in the pools, except ALL1 and ALL2, we could notuse the entire target region to estimate the accuracy ofthe SNV calling. Instead we focused on the sites forwhich we have genetic information about somatic SNVsin ALL1 and ALL2. Since we used an allele fractioncutoff of 0.1 to call a somatic SNV in the HaloPlex data,the lowest expected allele fraction in a pool is 0.1divided by the number of samples in the pool. To allowfor inaccuracy of the DNA quantification or pipetting,and random variation of sequenced molecules, a somaticSNV was considered to be detected in a pool if the allelefraction at this site was at least half the lowest expectedvalue. To estimate the number of true negatives andfalse positives, we reasoned that the somatic SNVs arerare, so that somatic SNVs detected in ALL1 would notbe present in pools containing ALL2 and vice versa. Thisanalysis showed that the vast majority of the knownSNVs present in a single sample can be reliably detectedin the pools, with the number of false negatives rangingfrom 1 to 7 and the number of false positives rangingfrom 1 to 14 (Table 3). As expected, more false positiveswere observed in pools of many samples, however, thefalse discovery rate was below 6% for all pools (Table 3).To investigate whether the higher observed than ex-pected allele fractions in ALL2_pool5 and ALL1_pool10cause an upward bias in the number of detected SNVs,we adjusted the observed allele fractions by dividingthem by the median ratio between observed and ex-pected values. SNV calling using the adjusted allele frac-tions showed that only one of all the SNVs that weredetected in the original analysis remained undetected
0.0 0.1 0.2 0.3 0.4 0.5
0.0
0.1
0.2
0.3
0.4
0.5
ALL1_pool2
Allele fraction expected
Alle
le fr
actio
n ob
serv
ed
R=0.896MR=1.033
0.00 0.05 0.10 0.15 0.20
0.00
0.05
0.10
0.15
0.20
ALL2_pool5
Allele fraction expected
Alle
le fr
actio
n ob
serv
ed
R=0.701MR=1.236
0.00 0.02 0.04 0.06 0.08 0.10
0.00
0.02
0.04
0.06
0.08
0.10
ALL1_pool10
Allele fraction expected
Alle
le fr
actio
n ob
serv
ed
R=0.794MR=1.211
0.0 0.1 0.2 0.3 0.4 0.5
0.0
0.1
0.2
0.3
0.4
0.5
Replication of ALL1_pool2
Allele fraction replicate
Alle
le fr
actio
n or
igin
al
R=0.888MR=1.100
0.00 0.05 0.10 0.15 0.20
0.00
0.05
0.10
0.15
0.20
Replication of ALL2_pool5
Allele fraction replicate
Alle
le fr
actio
n or
igin
al
R=0.532MR=1.096
0.00 0.02 0.04 0.06 0.08 0.10
0.00
0.02
0.04
0.06
0.08
0.10
Replication of ALL1_pool10
Allele fraction replicate
Alle
le fr
actio
n or
igin
alR=0.759MR=1.023
Figure 4 Correlation between expected and observed allele fractions in pools and comparison of replicated pools. The top panel showsthe correlation between expected and observed allele fractions in the three pools, where the expected value is calculated by dividing the allelefraction observed in the ALL1 or ALL2 genomic DNA (gDNA) sample with the number of samples in the pool. Only single nucleotide variants(SNVs) classified as somatic in the ALL1 (n = 227) or ALL2 (n = 305) gDNA samples are shown. The bottom panel shows the correlation betweenallele fractions in the replicated pools. The x- and y-axes are cut at 0.5, 0.2 and 0.1 for the pools with two, five and ten samples, respectively. SNVswith an observed allele fraction greater than this are shown in black at the cutoff value. The MR value is the median ratio between all x- and y-values in each plot. It represents how close the two distributions are to each other, with a value of 1 indicating similar distributions.
Table 3 Accuracy of single nucleotide variant detection innon-indexed pools
Sample TPa TNa FPa FNa FDR (%)b Novelc
ALL1_pool2 224 304 1 3 0.4 0
ALL2_pool5 304 227 0 1 0 3
ALL1_pool10 225 296 9 2 3.8 4
ALL1_pool2_rep 224 304 1 3 0.4 0
ALL2_pool5_rep 298 222 5 7 1.7 2
ALL1_pool10_rep 223 291 14 4 5.9 4a TP: true positives; TN: true negatives; FP: false positives; FN: false negatives.b FDR: false discovery rate, calculated as FP/(TP + FP).c Putative novel SNVs called in the previously uncharacterized samplesincluded in the pools. One of the variants called in ALL2_pool5 was not calledin the corresponding replicated pool (ALL2_pool5_rep). All other novelvariants were identical between replicates.
Berglund et al. BMC Genomics 2013, 14:856 Page 7 of 11http://www.biomedcentral.com/1471-2164/14/856
after scaling. Thus, the overrepresentation of ALL1 andALL2 in these pools does not influence the accuracy es-timate. A closer inspection of the SNVs that remainedundetected in pools revealed that the majority had a lowexpected allele fraction and a relatively low sequencedepth (Additional file 1: Figure S4), suggesting that dee-per sequencing would allow detection of most SNVs.We also found that the SNVs that remained undetectedin at least one pool had a significantly lower sequencedepth in the individual ALL1 and ALL2 samples com-pared to the remaining SNVs, suggesting that they maybe located in genomic regions that are difficult to enrich.To investigate whether novel variants could be discov-
ered in the previously uncharacterized samples in thepools, we performed a de novo SNV calling in the entireregion of interest (147 kb) by calculating the allele frac-tion at all sites in this region. To filter out putativelygermline SNPs and false positive calls, we set the
Berglund et al. BMC Genomics 2013, 14:856 Page 8 of 11http://www.biomedcentral.com/1471-2164/14/856
expected allele fraction for a somatic SNV present in asingle sample in a pool to 0.5 divided by the number ofsamples included in the pool and we selected only vari-ants with an allele fraction between half and twice theexpected value. We also filtered against dbSNP and theother experiments included in the study (see Methodsfor details). After applying these filters, we identified sixhigh-confidence candidate somatic SNVs that werecalled in both replicates of the same pool (Table 3). Oneadditional SNV was called in pool ALL2_pool5 but notin the replicate of this pool (Table 3). Manual inspectionof this variant suggested that it was a false positive callcaused by alignment artifacts. We performed PCR andSanger sequencing of each of the samples included inthe pools where the six high-confidence SNVs wereidentified. In each case, we were able to show that it wasa true variant and in which DNA sample it was present.Pooling of DNA samples before capture thus allows ac-curate SNV detection in many samples at low reagentcost, but at the expense of losing the information of inwhich sample novel variants are detected, unless experi-mental validation is performed. If the variants are ex-pected to be so rare that they occur in only one sample,this limitation can potentially be circumvented by usinga pool design where each sample is present in two differ-ent pools and no other sample is present in both pools[28]. In most studies, cancer samples are compared tomatched normal controls. Non-indexed pooling could beparticularly useful for the controls, since variants presentin the normal population are not believed to be cancermutations, even if the presence of the variant in amatched normal sample has not been confirmed.
ConclusionsIn this work, we analyzed 1528 putative somatic SNVsand germline SNPs with the HaloPlex target enrichmenttechnology and NGS to evaluate the performance ofwhole genome amplified DNA and the accuracy of SNVdetection in non-indexed pools of cancer samples. Weselected the HaloPlex technology since it is a novel, fast,and specific method suitable for targeted sequencing ofrelatively small regions in many samples. We found thatthe allele fractions of the analyzed variants are well pre-served during whole genome amplification, with correl-ation coefficients of 0.953 between gDNA and wgaDNAsamples, and that WGA does not negatively affect cap-ture specificity or variant calling. The possibility of usingwgaDNA is particularly important in cancer research,since the amount of available DNA is often a major limi-tation when working with primary human cancer sam-ples. Furthermore, we show that using a sequence depthof 792–1752, SNVs present in a single sample with allelefractions as low as 0.1 can be reliably detected in non-indexed pools of up to ten samples. We also identified
and experimentally validated six novel variants in thesamples that were included in these pools. Our resultsare important, since they show that analysis of a largenumber of samples, including samples where limitedamounts of DNA have previously been prohibitive, ispossible at low cost. Since analysis of many samplessignificantly increases the chances of finding recurrentcancer genes, our results have great potential to be bene-ficial for cancer research.
MethodsSamplesSixteen bone marrow samples collected at diagnosisfrom patients with childhood acute lymphoblasticleukemia (ALL) were analyzed in this study (Additionalfile 1: Table S1). All patients were treated at Swedishcenters according to the Nordic Society for PediatricHaematology and Oncology (NOPHO) 1992 and 2000ALL protocols [29]. The study was approved by the Re-gional Ethical Review Board in Uppsala, Sweden. Thestudy was conducted according to the guidelines of theDeclaration of Helsinki, and all patients and/or guard-ians provided written or oral informed consent.We have previously performed whole genome sequen-
cing of two of the ALL samples included in the study(ALL1 and ALL2), along with matched normal samplesfrom the same patients (Lindqvist et al., manuscript inpreparation). Both patients responded well to therapy,and at examination after cessation of therapy 2-2½ yearsafter diagnosis they were found to be in first continuouscomplete remission (CCR 1), with <0.01% blast cells inthe bone marrow according to PCR. The normal bloodsamples were collected 2½-3 years later, when the pa-tients were still in CCR 1 with normal hematologicalparameters. The patients are today clinically well in CCR1 another 2½-3 years later. Thus, there is good evidencethat the normal blood samples did not contain anyleukemic cells. The proportion of leukemic cells in thecancer samples was estimated to be >90% by light mi-croscopy in May-Grünwald-Giemsa-stained cytocentri-fuge preparations.For whole genome sequencing, on average 138 Gb
paired-end sequence data was generated for each sampleusing the HiSeq2000 or GAIIx instruments (Illumina). Se-quence reads were trimmed from the 3’ end and alignedto the human reference genome (version hg19) usingBWA version 0.5.9 [30] with default parameters. Read re-alignment and base quality recalibration was performedusing GATK version 1.0.5909 [31]. Read realignmentwas performed around candidate indels identified dur-ing the run and indels previously called in the data usingVarScan [32]. During base quality recalibration, dbSNP132and the BAQ option was used. PCR duplicates and readpairs where at least one read fulfilled any of the following
Berglund et al. BMC Genomics 2013, 14:856 Page 9 of 11http://www.biomedcentral.com/1471-2164/14/856
criteria were excluded: trimmed to <25 bp, >3 mismatchesor MAPQ <30. Somatic SNVs were predicted with MuTectversion 1.0.27200 [33] and SomaticSniper version 1.0.0 [27]with default parameters. MuTect SNVs labeled REJECTand SomaticSniper SNVs with somatic score <40 werediscarded. In addition, SNVs with an allele fraction <0.2,SNVs present in dbSNP135, and SNVs overlapping a re-peated region present in the tracks “rmsk” or “simpleRe-peats” from the UCSC table browser were excluded fromfurther analysis.
Target capture and sequencingCapture of the target regions was performed with re-agents from a custom design HaloPlex Target Enrich-ment kit 1-500 kb (Agilent, USA), according to theHaloPlex Target Enrichment System-Fast Protocol Ver-sion B. Briefly, the protocol consists of the followingfour steps: 1) Digestion of genomic DNA in eight differ-ent restriction reactions. 2) Hybridization of restrictedfragments to probes whose ends are complementary tothe target fragments. During hybridization, fragmentsare circularized and sequencing motifs including indexsequences are incorporated. 3) Capture of target DNAusing streptavidin beads and ligation of circularized frag-ments. 4) PCR amplification of captured target libraries.Recent revisions of the protocol are listed in Additionalfile 2.Whole genome amplification was performed using
50 ng of genomic DNA with reagents from the Repli-gmidi kit (Qiagen), according to the manufacturer’s in-structions. 200 ng of DNA was used for capture reac-tions containing a single sample. 100 ng of DNA fromeach sample was used for pooling and all pooled DNAwas used in the capture reaction. Thus, the amount ofinput DNA ranged from 200–1000 ng in the capture ex-periments. Prior to pooling, DNA was quantified using aQubit Fluorometer (Invitrogen). Paired-end sequencing(100 bp reads) of all samples was performed in a singlelane on a HiSeq2000 instrument (Illumina, USA). AHiSeq Paired End Cluster Generation Kit was used togenerate the clusters and a TruSeq SBS Kit v3 was usedfor sequencing. Image analysis and base calling was per-formed using the Illumina RTA software version 1.13.48.
Data analysisSequence reads were trimmed to remove Illuminaadapter sequences with CutAdapt version 1.1 [34] andaligned to the human reference genome (version hg19)with MOSAIK version 2.1.33 with default parameters.Realignment and recalibration of base quality scoresusing dbSNP137 was performed with GATK version1.0.5909 [31]. Read realignment was performed aroundcandidate indels identified during the run, and SNPs andindels in dbSNP137 that were located in the regions
covered by the HaloPlex design. Reads with MAPQ = 0were discarded.Allele fractions at sites with candidate SNVs detected
in WGS data and germline SNPs were calculated with acustom Python script (publicly available at https://github.com/Molmed/Berglund-Lindqvist-2013). Variantcalling was based on these allele fractions. In individualsamples, a candidate SNV was classified as somatic iffulfilling the following criteria: allele fraction ≥0.1 in thegDNA ALL sample, allele fraction <0.01 in the matchednormal sample, and HaloPlex sequence depth ≥30 inboth samples. In pools, we considered a validated som-atic SNV to be detected if the allele fraction was ≥0.05divided by the number of samples in the pool.For de novo SNV calling in pools, we investigated the
allele fractions at every site in the 147 kb target regionthat had a sequence depth ≥30 per sample included inthe pool. We only searched for variants in the unknown(i.e., not whole genome sequenced) samples. We appliedseveral criteria to filter out putative germline SNPs andfalse positive calls. First, we assumed that variants thatare present in more than one of the samples in a poolare likely to be germline, and we focused on finding vari-ants with an allele fraction suggesting that they arepresent in only one sample. We set the expected allelefraction for such variants to 0.5 divided by the numberof samples in the pool. We excluded variants with anallele fraction less than half or more than twice theexpected value. Second, we filtered out all variantspresent in dbSNP137. Third, we excluded variants thathad an allele fraction >1% in any of the other experi-ments included in the study except the replicate experi-ment. This was to filter out germline variants that arenot in dbSNP and putative false positive calls caused byalignment artifacts. Validation of putative novel SNVswas done by PCR amplification and Sanger sequencingof each of the samples included in the pools individually.Figures were generated using R version 3.0.1.
PCR and Sanger sequencingPCR primers were designed using Primer3Plus [35].PCR was performed using a Smart Taq Hot Thermo-stable DNA Polymerase Set (Naxo, Estonia) for 35 cycles.Sanger sequencing was performed with an ABI3730XLinstrument at the Genome Center in Uppsala, Sweden.The sequence traces were analyzed with the Sequenchersoftware (Applied Biosystems).
Additional files
Additional file 1: Figure S1. The allele fractions and sequencing depthsof 19 heterozygous germline SNPs in HaloPlex and whole genomesequencing data. Figure S2. Comparison of somatic and non-validatedsingle nucleotide variants (SNVs) in terms of sequence depth for the normal
Berglund et al. BMC Genomics 2013, 14:856 Page 10 of 11http://www.biomedcentral.com/1471-2164/14/856
sample in whole genome sequencing data and confidence scorefrom SNV calling as measured by the somatic score from SomaticSniper.Figure S3. Comparison of the evenness of coverage, as estimated by thecoefficient of variation (CV) and the Gini index, between experimentswith different amounts of input DNA. Figure S4. The sequence depthand expected allele fraction of somatic SNVs that remained undetectedin pools. Table S1. Clinical characteristics of ALL samples used in thestudy.
Additional file 2: List of revisions of the HaloPlex target captureprotocol between our experiment and the newest version of theprotocol.
AbbreviationsSNP: Single nucleotide polymorphism; SNV: Single nucleotide variant;WGS: Whole genome sequencing; WGA: Whole genome amplification;wgaDNA: Whole genome amplified DNA; gDNA: Genomic DNA; NGS: Nextgeneration sequencing.
Competing interestsThe authors declare that they have no competing interests.
Authors’ contributionsECB, CML, JN, PW and A-CS conceived and designed the study. EÖ preparedsequencing libraries. CML and SH developed bioinformatics pipelines. ECBand CML analyzed data. NH performed Sanger sequencing. GL and EF pro-vided samples and clinical information. ECB and A-CS wrote the manuscript.All authors read and approved the final manuscript.
AcknowledgementsSequencing of HaloPlex libraries was performed at the SNP&SEQ platform inUppsala with assistance from Karin Sollander, Marie Lindersson and HelenaFällmar. This work was supported by grants from the Swedish Cancer Society(CAN2010/592), the Swedish Childhood Cancer Foundation (11098), theEuropean Union FP7 programme (grant agreement no 262055), the SwedishFoundation for Strategic Research (RBc08-008), and the Swedish ResearchCouncil for Science and Technology (90559401).
Author details1Department of Medical Sciences, Molecular Medicine and Science for LifeLaboratory, Uppsala University, Uppsala, Sweden. 2Department of MedicalBiosciences, University of Umeå, Umeå, Sweden. 3Department of Women’sand Children’s Health, Pediatric Oncology, Uppsala University, Uppsala,Sweden. 4For the Nordic Society of Pediatric Hematology and Oncology(NOPHO).
Received: 8 May 2013 Accepted: 25 November 2013Published: 5 December 2013
References1. Lander ES, Linton LM, Birren B, Nusbaum C, Zody MC, Baldwin J, Devon K,
Dewar K, Doyle M, FitzHugh W, et al: Initial sequencing and analysis of thehuman genome. Nature 2001, 409:860–921.
2. Venter JC, Adams MD, Myers EW, Li PW, Mural RJ, Sutton GG, Smith HO,Yandell M, Evans CA, Holt RA, et al: The sequence of the human genome.Science 2001, 291:1304–1351.
3. Snyder M, Du J, Gerstein M: Personal genome sequencing: currentapproaches and challenges. Genes Dev 2010, 24:423–431.
4. Abecasis GR, Auton A, Brooks LD, DePristo MA, Durbin RM, Handsaker RE,Kang HM, Marth GT, McVean GA: An integrated map of genetic variationfrom 1,092 human genomes. Nature 2012, 491:56–65.
5. Hudson TJ, Anderson W, Artez A, Barker AD, Bell C, Bernabe RR, Bhan MK,Calvo F, Eerola I, Gerhard DS, et al: International network of cancergenome projects. Nature 2010, 464:993–998.
6. Downing JR, Wilson RK, Zhang J, Mardis ER, Pui CH, Ding L, Ley TJ, EvansWE: The Pediatric Cancer Genome Project. Nat Genet 2012, 44:619–622.
7. Gilissen C, Hoischen A, Brunner HG, Veltman JA: Unlocking Mendeliandisease using exome sequencing. Genome Biol 2011, 12:228.
8. Do R, Kathiresan S, Abecasis GR: Exome sequencing and complex disease:practical aspects of rare variant association studies. Hum Mol Genet 2012,21:R1–9.
9. Myllykangas S, Ji HP: Targeted deep resequencing of the human cancergenome using next-generation technologies. Biotechnol Genet Eng Rev2010, 27:135–158.
10. Mertes F, Elsharawy A, Sauer S, van Helvoort JM, van der Zaag PJ, Franke A,Nilsson M, Lehrach H, Brookes AJ: Targeted enrichment of genomic DNAregions for next-generation sequencing. Brief Funct Genomics 2011,10:374–386.
11. Johansson H, Isaksson M, Sorqvist EF, Roos F, Stenberg J, Sjoblom T, BotlingJ, Micke P, Edlund K, Fredriksson S, et al: Targeted resequencing ofcandidate genes using selector probes. Nucleic Acids Res 2011, 39:e8.
12. Dahl F, Gullberg M, Stenberg J, Landegren U, Nilsson M: Multiplexamplification enabled by selective circularization of large sets ofgenomic DNA fragments. Nucleic Acids Res 2005, 33:e71.
13. Dahl F, Stenberg J, Fredriksson S, Welch K, Zhang M, Nilsson M, Bicknell D,Bodmer WF, Davis RW, Ji H: Multigene amplification and massivelyparallel sequencing for cancer mutation discovery. Proc Natl Acad Sci USA2007, 104:9387–9392.
14. Nijman IJ, Mokry M, van Boxtel R, Toonen P, de Bruijn E, Cuppen E:Mutation discovery by targeted genomic enrichment of multiplexedbarcoded samples. Nat Methods 2010, 7:913–915.
15. Ramos E, Levinson BT, Chasnoff S, Hughes A, Young AL, Thornton K, Li A,Vallania FL, Province M, Druley TE: Population-based rare variant detectionvia pooled exome or custom hybridization capture with or withoutindividual indexing. BMC Genomics 2012, 13:683.
16. Bansal V, Tewhey R, Leproust EM, Schork NJ: Efficient and cost effectivepopulation resequencing by pooling and in-solution hybridization.PLoS One 2011, 6:e18353.
17. Day-Williams AG, McLay K, Drury E, Edkins S, Coffey AJ, Palotie A, Zeggini E:An evaluation of different target enrichment methods in pooledsequencing designs for complex disease association studies. PLoS One2011, 6:e26279.
18. Harakalova M, Nijman IJ, Medic J, Mokry M, Renkens I, Blankensteijn JD,Kloosterman W, Baas AF, Cuppen E: Genomic DNA pooling strategy fornext-generation sequencing-based rare variant discovery in abdominalaortic aneurysm regions of interest-challenges and limitations.J Cardiovasc Transl Res 2011, 4:271–280.
19. Lovmar L, Fredriksson M, Liljedahl U, Sigurdsson S, Syvanen AC:Quantitative evaluation by minisequencing and microarrays revealsaccurate multiplexed SNP genotyping of whole genome amplified DNA.Nucleic Acids Res 2003, 31:e129.
20. Lovmar L, Syvanen AC: Multiple displacement amplification to create along-lasting source of DNA for genetic studies. Hum Mutat 2006,27:603–614.
21. Jiao X, Rosenlund M, Hooper SD, Tellgren-Roth C, He L, Fu Y, Mangion J,Sjoblom T: Structural alterations from multiple displacement amplifica-tion of a human genome revealed by mate-pair sequencing. PLoS One2011, 6:e22250.
22. ElSharawy A, Warner J, Olson J, Forster M, Schilhabel MB, Link DR, Rose-JohnS, Schreiber S, Rosenstiel P, Brayer J, Franke A: Accurate variant detectionacross non-amplified and whole genome amplified DNA using targetednext generation sequencing. BMC Genomics 2012, 13:500.
23. Roberts ND, Kortschak RD, Parker WT, Schreiber AW, Branford S, Scott HS,Glonek G, Adelson DL: A comparative analysis of algorithms for somaticSNV detection in cancer. Bioinformatics 2013, 29:2223–2230.
24. Welch JS, Ley TJ, Link DC, Miller CA, Larson DE, Koboldt DC, Wartman LD,Lamprecht TL, Liu F, Xia J, et al: The origin and evolution of mutations inacute myeloid leukemia. Cell 2012, 150:264–278.
25. The Cancer Genome Atlas Research Network: Genomic and epigenomiclandscapes of adult de novo acute myeloid leukemia. N Engl J Med 2013,368:2059–2074.
26. Ding L, Ley TJ, Larson DE, Miller CA, Koboldt DC, Welch JS, Ritchey JK,Young MA, Lamprecht T, McLellan MD, et al: Clonal evolution in relapsedacute myeloid leukaemia revealed by whole-genome sequencing. Nature2012, 481:506–510.
27. Larson DE, Harris CC, Chen K, Koboldt DC, Abbott TE, Dooling DJ, Ley TJ,Mardis ER, Wilson RK, Ding L: SomaticSniper: identification of somaticpoint mutations in whole genome sequencing data. Bioinformatics 2012,28:311–317.
28. Wang W, Yin X, Soo Pyon Y, Hayes M, Li J: Rare variant discovery andcalling by sequencing pooled samples with overlaps. Bioinformatics 2013,29:29–38.
Berglund et al. BMC Genomics 2013, 14:856 Page 11 of 11http://www.biomedcentral.com/1471-2164/14/856
29. Schmiegelow K, Forestier E, Hellebostad M, Heyman M, Kristinsson J,Soderhall S, Taskinen M: Long-term results of NOPHO ALL-92 and ALL-2000 studies of childhood acute lymphoblastic leukemia. Leukemia 2010,24:345–354.
30. Li H, Durbin R: Fast and accurate short read alignment with Burrows-Wheeler transform. Bioinformatics 2009, 25:1754–1760.
31. DePristo MA, Banks E, Poplin R, Garimella KV, Maguire JR, Hartl C, PhilippakisAA, del Angel G, Rivas MA, Hanna M, et al: A framework for variationdiscovery and genotyping using next-generation DNA sequencing data.Nat Genet 2011, 43:491–498.
32. Koboldt DC, Chen K, Wylie T, Larson DE, McLellan MD, Mardis ER, WeinstockGM, Wilson RK, Ding L: VarScan: variant detection in massively parallelsequencing of individual and pooled samples. Bioinformatics 2009,25:2283–2285.
33. Cibulskis K, Lawrence MS, Carter SL, Sivachenko A, Jaffe D, Sougnez C,Gabriel S, Meyerson M, Lander ES, Getz G: Sensitive detection of somaticpoint mutations in impure and heterogeneous cancer samples.Nat Biotechnol 2013, 31:213–219.
34. Martin M: Cutadapt removes adapter sequences from high-throughputsequencing. EMBnetjournal 2011, 17:10–12.
35. Untergasser A, Nijveen H, Rao X, Bisseling T, Geurts R, Leunissen JA:Primer3Plus, an enhanced web interface to Primer3. Nucleic Acids Res2007, 35:W71–74.
doi:10.1186/1471-2164-14-856Cite this article as: Berglund et al.: Accurate detection of subclonalsingle nucleotide variants in whole genome amplified and pooledcancer samples using HaloPlex target enrichment. BMC Genomics2013 14:856.
Submit your next manuscript to BioMed Centraland take full advantage of:
• Convenient online submission
• Thorough peer review
• No space constraints or color figure charges
• Immediate publication on acceptance
• Inclusion in PubMed, CAS, Scopus and Google Scholar
• Research which is freely available for redistribution
Submit your manuscript at www.biomedcentral.com/submit


![Research Paper Thyroid transcription factor FOXE1 interacts ... 85949 ncotarget with non-medullary thyroid cancer risk including single nucleotide variants rs965513[A] (56 kb upstream](https://static.fdocuments.net/doc/165x107/613a50760051793c8c00f8ce/research-paper-thyroid-transcription-factor-foxe1-interacts-85949-ncotarget.jpg)