
Effect of the Accuracy of Target Range Measurement on the Accuracy of Fire
Upload
jordan-teeCategory
view
28download
5description

AttArJtrKl (x' EAcrm AFmcryc rm AocxlRAtr oil' EAnLyC{)ST ESIMfrATE IN CI}NSTRUCTK}!{ PROMCTS
IxlnrA$ilArfl I)lvoYolvARsrlo
UNMnSilt TEKII$OI{)GI ilfiAI.AYSIA

PSZ 19:16(Pind l/07)
UNTVER,SIII IEKNOM}GI MALAYSIA
Notes : * if the thesis is COIIFIDENTIAL and RESTRICTED, please attach with theletter from the organization with period and reasons for confidentiality orrestriction
Author"s full name
Date ofbirttr
Title
Academic Session: 2010 l20Ll
I declare that this thesis is classified as:
RESTRICTEI)
DECI-A,RATION OF TT{ESIS ANID COPYRIGIIT
: DODI ARDIANTO
: o6ftDEcEwER 1978
: ANALYSIS OF FACTORS AFFECTING THE ACCI]RACYOF EARLY COST ESTIMATE IN CONSTRUCTIONPROJECTS
COI\TFIDENTIAL (Contains confidential information under the Official SecretAct 1972)*
(Contains restricted information as specified by theorganization where research was done)*
OPEN ACCESS I agree that my thesis to be published as online open access(tull text)
I acknowledged that Universiti Teknologi lvlalaysia reserves the rights as follows:
1. The thesis is the property of Universiti Teknologi Malaysia.
2. The Library of Unive,niti Teknologi Malaysia has the rightto make copies for thepurpose of research only.
3. Ttr Library has tlrc right to make copia tresis for academic exchange.
No KP/IC: 201071VI1fi t61
D#19lry2011
"I he,reby declue thatI have readthisthesis and inmy
opinion this thesis is sufficient in terms of scope and quality for the award
the degre oftdaster ofConsfnrction Contract I\danage, ent
Sigrrdtr€Nmrc of SupervisorDate
SigndrcName of Second R€aderDate
ffi: PROF. A}il,IAD ROSDAN RAZAK
' I ql'.tt bo/f
JI.JLY 2011

AI{ALY$S OF FACTOR,S AFFECfiNG TTIE ACCI.'RACY OF EARLY COST
ESTIT{ATE IN CONSTRUCTION PROIECTS
DODIARDIANTO
A thesis submitted in ftlfihent of the
requimens for thE award offte &gree ofI\daster of Soienoe (Cmshrctim Cmnact Adamg€m€nQ
Facnilty of Built EnvirmeffiUnivereiti Teknolqgi Ldslaysia
JTJLY 2011

DECLARATION
I declarc that this thesis entitled "Atulysis Of Faetors Affecting ITu Accuracy A Early
Cost Ectlmate In Constructl.sn Projects" is the reult of my onm research except as cited
in the re&nences. The thesis has not bm accepted fr any degr€es and is nd concumetrly
submitted in candidffirc of any otrfr dep.
SigrtfircNameIhte
tu: 19 JL]LY2011

DEDICATION
o'To my beloved wife, brother, sister, mother, and late father

lv
ACKNOWLEDGMENT
Many thanks to my supervisor, Assoc. Prof. DR. Razali bin Abdul Hami{ for his kind and
helpful comments in the preparation of this thesis. Without that, this thesis would not have
been the same as presented here. I am also thanks to Prof. Ahmad Rosdan Razak for
correction this thesis in order to become more with quality.
I am also indebted to Ministry of Public Works Indonesia for funding my master study.
Credit should be given to all respondent for tlreir contributing in admission filling
questionnaire. My fellow postgraduate students should also be recognized for their support.
My sincere appreciation also extends to all my colleagues and others who have provided
assistance at various occasions. Their views and tips are useful indeed.
Finalty, tlnnk you to my beloved parents, brother, sister, my beloved one and whole family
who always support me.

v
ABSTRACT
Quality early cost estimate can be measured from its level of accuracy. Early
cost estimates prepared at the early stage of project inceptions, therefore early cost
estimates have an important function as a starting point and a benchmark for project
planning and controling in the future project stages. Early cost estimates are prepared
based on limited information and supporting data, it couses in early cost estimates
has the lowest level of accuracy than any other types of cost estimates.
From the perspective of the important function of an early cost estimate, in
contrary the low level of accuracy that is produced is a condition of stark contrast.
This condition is often encountered during the preparation of early cost estimates of
construction projects that why this topic became the basis of this research. This
research aims to make an analysis of the relationship factors that affect the accuracy
of the early cost estimate. Research data obtained from surveys of construction
projects that have been completed in the period 2006-2011. Survey data were
analyzed quantitatively to obtain significant variables and formulate a regression
model of factors affecting the accuracy of early cost estimates.
Quality of cost estimates associated with the accuracy and completeness of
the supporting elements depends on: nature of the project, the level of data and
information available, techniques and methods used, ability of estimator, and other
factor considered while preparing the estimate. The the factors were developed into
54 variables as the basic elements of the preparation of early cost estimates. From the
results of multiple linear regression analysis obtained significant factors (<0.05)
which affects the level of accuracy of the early cost estimates, as follows.:
Geographical location / Site location, Quality level of the estimator / Estimator
Expertise; Availability project information / Documents used in Preparing the
estimate; the availability of scope of the project; the availability of project documents
(preliminary and Size of Project / Scope of the project.

v
ABSTRAK
Kualiti anggaran kos pendahuluan boleh diukur dari tingkat ketepatan yang dihasilkan. Anggaran kos pendahuluan disusun pada peringkat awal projek bermula, sehingga anggaran kos pendahuluan mempunyai fungsi penting sebagai titik tolak dan tolak ukur perancangan dan pengurusan projek pada tahap-tahap berikutnya. Anggaran kos pendahuluan umumnya disusun mengikut maklumat dan data pendukung yang masih terbatas, hal tersebut menyebabkan anggaran kos pendahuluan mempunyai tahap ketepatan yang terendah berbanding jenis anggaran kos lain.
Dilihat dari fungsi penting suatu anggaran kos pendahuluan di satu sisi, dan di sisi lain rendahnya tahap ketepatan yang dihasilkan merupakan suatu keadaan yang sangat kontras bertolakbelakang. Keadaan tersebut sering dijumpai pada saat penyusunan anggaran kos pendahuluan projek pembinaan sehingga menjadi dasar dilakukannya kajian ini. Kajian ini bertujuan untuk membuat analisis mengenai hubungan faktor-faktor yang mempengaruhi ketepatan anggaran kos pendahuluan terhadap ketepatan yang dihasilkan. Data penelitian didapati daripada kajian terhadap projek-projek pembinaan bangunan yang telah selesai pada kurun waktu tahun 2006-2011. Data hasil kajian dianalisis secara kuantitatif untuk mendapatkan variabel signifikan dan merumuskan model regresi terhadap faktor-faktor yang mempengaruhi ketepatan anggaran kos pendahuluan.
Kualiti anggaran kos yang berkaitan dengan ketepatan dan kelengkapan unsur-unsur pendukungnya bergantung pada: sifat projek, ketersediaan data dan maklumat, teknik dan kaedah yang digunakan, kualiti dan pengalaman estimator, serta faktor lain yang dipertimbangkan saat menyiapkan anggaran kos. Dari faktor-faktor tersebut dikembangkan menjadi 54 variabel sebagai unsur-unsur dasar penyusunan anggaran kos pendahuluan. Dari hasil analisis regresi linier berganda didapati 4 faktor bermakna (<0.05) yang berpengaruh terhadap ketepatan anggaran kos pendahuluan, iaitu: lokasi projek, kualiti / pengalaman penganggar, ketersediaan data dan maklumat projek, dan lingkup projek.

vi
TABLE OF CONTENTS
CHAPTER TITLE PAGE
DECLARATION ii
DEDICATION iii
ACKNOWLEDGMENT iv
ABSTRACT v
TABLE OF CONTENTS vi
LIST OF FIGURE ix
LIST OF TABLE x
LIST OF APPENDIX xi
1 INTRODUCTION 1
1.1 Background Of The Study 1
1.2 Problem Statement 3
1.3 Objectives Of The Research 4
1.4 Scope Of The Research 4
1.5 Important Of The Research 4
1.6 Organization Of Thesis 5
2 LITERATURE REVIEW 7

vii
2.1 Construction Project 7
2.2 Project Cost Estimate 8
2.3 Cost Estimate Classification System and Accuracy Ranges 9
2.4 Accuracy Of Early Cost Estimate 15
2.5 Early Cost Estimate 16
2.6 Factor Affecting Quality of Cost Estimate 19
3 RESEARCH METHODOLOGY 24
3.1 Method of Research 24
3.3 Research Variables 27
3.4 Collection Of Data 28
3.4.1 Questionnaire Research 29
3.5 Data Analysis 30
3.5.1 Type Of Data 31
3.5.2 Analysis Correlation 31
3.5.3 Regression Analysis 32
3.5.4 F Test 35
3.5.5 t Test 35
3.5.6 Auto Test Correlation (Durbin Watson Test) 36
3.5.7 Multicolinearity test 36
4 ANALYSIS AND DISCUSSION 37
4.1 Preparation Research 37
4.2 Data Analysis Questionnaires 40
4.2.1 Analysis Correlation 41
4.2.2 Regression Analysis 47
4.2.3 Model Test 54

viii
4.2.3.1 Linearity Test ( F Test ) 54
4.2.3.2 t Test 55
4.2.3.3 Autocorrelation Test (Durbin Watson Test) 55
4.2.3.4 Multicollinearity Test 56
4.3 Result of Research 56
5 CONCLUSION AND RECOMMENDATIONS 57
5.1 Introduction 57
5.2 Conclusion 57
5.3 Limitation of the research 58
5.4 Recommendation for future research 59
REFERENCES 60

ix
LIST OF FIGURE
FIGURE NO TITLE PAGE
1.1 Typical life cycle profile (Risk Versus Amount At Stake) 3
2.1 Project Cost Estimate Process (Oberlander, 2001) 9
2.2 The Stages of Project Estimated Cost (Oberlander, 2000) 9
2.3 AACE Classification System 15
2.4 Design Process 17
2.5 Effect of skill and experience of the estimator of the The
accuracy of the estimated project costs (Oberlander, 2001) 20
3.1 Research Methodology 24
3.2 Correlation Analysis Diagram 32
3.3 Regression Analysis Diagram 34
4.1 Scatter plot - Regression Standardized Predicted Value 50
4.2 Scatter plot - Regression Standardized Predicted Value (end) 53

x
LIST OF TABLE
TABLE NO. TITLE PAGE
2.1 Cost Estimate Overview Chart 14
2.2 General concept stages of cost estimate process 16
2.3 Factor Affecting Accuracy of Early Cost Estimate 23
3.1 Likert scale level of accuracy early cost estimate 30
4.1 Factor affecting the accuracy of early cost estimate
after interview with expert 40
4.2 Profile of respondents 41
4.3 Coeficient Correlation and significant levels of variables 45
4.4 Factors that have a significant correlation of early cost
estimate accuracy 46
4.5 Model Summary 47
4.6 Diagnostic collinearity 47
4.7 Coefficient 48
4.8 Model Summary 1 48
4.9 Diagnostic collinearity 1 49
4.10 Coefficients 1 50
4.11 Model Summary 2 51
4.12 Diagnostic collinearity 2 51
4.13 Coefficients 2 51
4.14 Model Summary (End) 52
4.15 Coefficients (End) 52
4.16 ANOVA 54

xi
LIST OF APPENDIX
FIGURE NO TITLE PAGE
A Expert Interview 63
B Questionnaire 70
C Table of F Statistical and t Table 76
D Data Questionnaire 78
E Summary Respondent 82
1
CHAPTER 1
INTRODUCTION
1.1 Background of the studies
Nowadays the construction sector in Indonesia is experiencing rapid growth.
The development of these construction projects marked by numerous large-scale
construction projects built by government or private parties.
A project has essentially been born from a decision to invest. The decision to
make an investment involves a number of funds in hopes to get the benefits that often
will have a major impact for the survival of a company. One of the decisions that
must be taken to initiate an investment project is to determine what will be built and
how much does it cost to build the project. Physical development costs and other
expenses are fixed capital for building construction projects.
Cost estimate according to the National Estimating Society-USA is the art of
estimating (the art of approximating) the possibility of total costs required for an
activity of which is based on information available at that time. Based on the
function and its relationship to the level of accuracy, there are several types of cost
estimates in each stage of the project. For example in the early stages of project
concept development, note the estimated how much it cost to build a project,
therefore, developed a preliminary cost estimate. Preliminary cost estimate is one
important factor that should be considered in decisions to invest in development
projects because of the value that result from a process of preparing the preliminary
cost estimate is the approximate amount of initial capital needed for the project
owner.

2
Evaluation of the feasibility of building projects, and decisions on design and
construction issues are usually based on a series of approximate estimates (pre-bid
forecasts) that are considered against initial plans and budgets (Betts and Gunner,
1993). Approximate estimates are also required for funding decisions and cost
control. Over-estimation or over-provision of funds for one project means lesser
funds are available for other business opportunities. In difficult times, estimations of
profit margins are likely to be conservative and construction costs are over-
estimated, otherwise viable projects may be shelved. Estimates form the basis for
tender comparison or negotiation, and under-estimation may lead to difficulty in
award decisions, or in some cases unrealistic negotiation targets. Projects may be
delayed whilst more funding is arranged or even shelved if additional funds are not
available. To proceed with insufficient funds will likely lead to payment problems
and hefty finance costs for overdrafts or emergency loans during construction. It is
therefore necessary for quantity surveyors (QS) to improve the accuracy of their
estimates to ensure that clients are satisfied with their services.
Accurate, early cost estimates for engineering and construction projects are
extremely important to the sponsoring organization and the project team. For the
sponsoring organization, early cost estimates are vital for business unit decisions that
include strategies for asset development, potential project screening, and resource
commitment for further project development. Inaccurate early estimates can lead to
lost opportunities, wasted development effort, and lower than expected returns.
For the project team, performance and overall project success are often
measured by how well the actual cost compares to the early cost estimate. Initial cost
estimates are the basis on which all future estimates are compared. Future estimates
are often expected to agree with (i.e., be equal to or less than) the initial estimates.
However, final cost often exceeds the initial estimate.
Estimated project cost is generally a systematic steps and through the same
process between one project and previous projects of its kind. Various literatures
provide guidance on the process in calculating the project cost estimates using
various methods and approaches used. The availability of data and information, time
limit, techniques and methods used, skills and abilities an estimator is a factor that
determine the quality of the project cost estimate.
3
(Source : Budi Manan, 2007)
Another factor affecting the quality of the project cost estimate is uncertainty
which is one of the unique characteristics of a construction project. Limitations of
data and information in the development stage preliminary cost estimate is one
source of uncertainty containing the risk that causes low levels of accuracy. Risk is
an unavoidable problem of every construction project. Therefore it is necessary to
planning and managing the risk integratedly in every stage of the project, including
in the development stage preliminary cost estimate project.
1.2 Problem statement
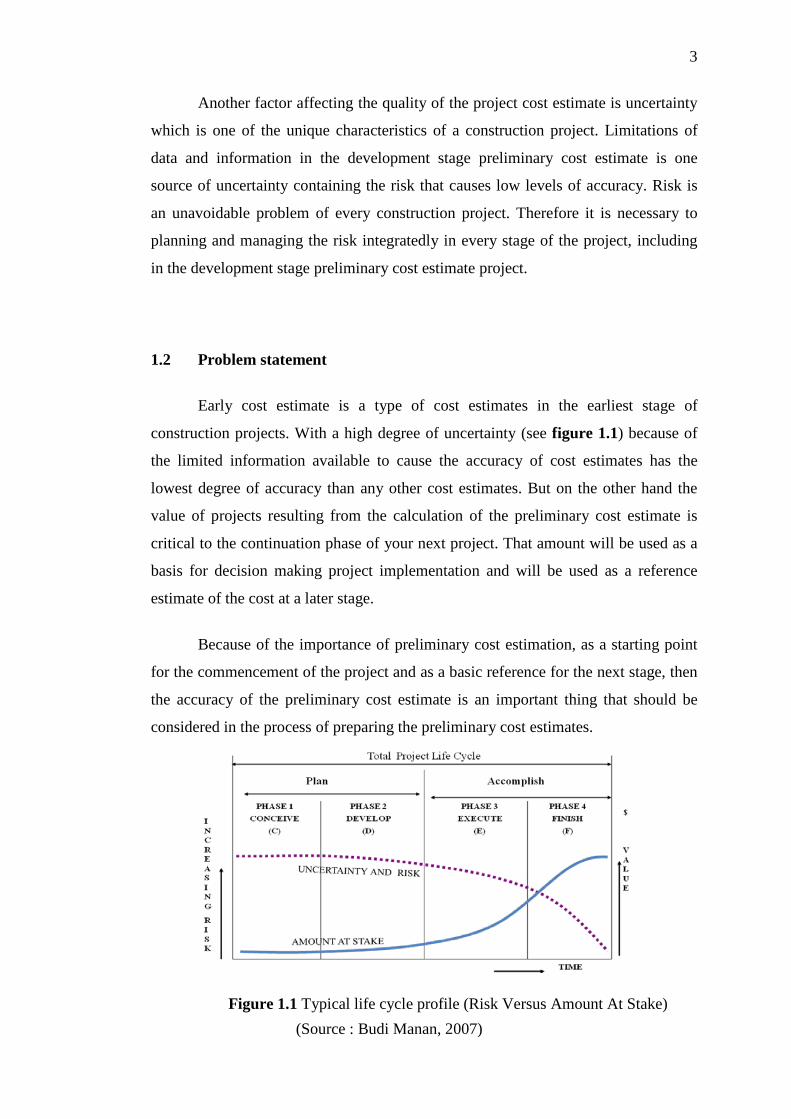
Early cost estimate is a type of cost estimates in the earliest stage of
construction projects. With a high degree of uncertainty (see figure 1.1) because of
the limited information available to cause the accuracy of cost estimates has the
lowest degree of accuracy than any other cost estimates. But on the other hand the
value of projects resulting from the calculation of the preliminary cost estimate is
critical to the continuation phase of your next project. That amount will be used as a
basis for decision making project implementation and will be used as a reference
estimate of the cost at a later stage.
Because of the importance of preliminary cost estimation, as a starting point
for the commencement of the project and as a basic reference for the next stage, then
the accuracy of the preliminary cost estimate is an important thing that should be
considered in the process of preparing the preliminary cost estimates.
Figure 1.1 Typical life cycle profile (Risk Versus Amount At Stake)

4
1.3 Objective of the research
The objectives to be achieved in this study are:
a. Identifying factors that affect the accuracy of early cost estimates of
construction projects.
b. Identifying relationship between the factor and the accuracy of early cost
estimates.
1.4 Scope of the research
Scope of the research are:
a. Early cost estimates that has been mention in this research is initial cost
estimates on construction projects in Jakarta, Indonesia.
b. Types of projects to be taken as a sample are building construction
project
c. The process of preparing the preliminary cost estimates made during the
feasibility study lasted until just before the detailed design is completed.
1.5 Important of the research
In general, the author hopes this research can contribute to the development
of construction industry in Indonesia, especially in the sector of Construction
Management. The important of the research are:
a. Providing an explanation of how the availability of data and information,
methods and systems used and the experience and skills related to the
process estimator estimates the cost could affect the accuracy of
preliminary cost estimates.
b. Provide input in the application process preliminary cost estimates
associated with the things that need to be prepared, techniques and

5
methods used, the necessary procedures and other matters involved in the
process preliminary cost estimate in order to produce a preliminary cost
estimate is accurate.
1.6 Organization of Thesis
This thesis consists of five chapters, among others:
Chapter I Introduction
In this chapter explained the background of this study, formulation of
problem statement , objective of the research, scope of the research,
importance of the research, research methodology and organization of thesis.
Chapter II Literature Review
In This section described the basic theory associated with the overall project
cost estimates and preliminary cost estimates in particular. Sources literature
drawn from several references in the form of books or journals that have
published research.
Chapter III Research Methodology
This section describes the methods and procedures used in this research.
Systematic research is illustrated by the flow chart that explains each step that
passed from this research. The basis of the steps in quantitative research and
data collection system described in this section.

6
Chapter IV Analysis and Discussion
Analysis of data obtained and the discussion until drawn a conclusion
described in this section. Every step analysis used and the discussion related
to the findings generated are described to obtain a clear picture of the results
obtained from this research.
Chapter V Conclusion and Suggestion
This section contains the conclusions that can be drawn from the results of
research undertaken. The suggestions that if can be used and further
recommendations can be used in the development of subsequent research
provided in this section.

7
CHAPTER 2
LITERATURE REVIEW
2.1. Construction Projects
Projects can be defined as a series of activities that must be implemented with
a limited period, with an allocation of specific funds, and are intended to produce a
product or deliverable the quality criteria outlined clearly. Project implementation
involves many parties including the owner /owner, Consultants (planners, inspectors,
construction management, quantity surveyor), Contractors, subcontractors, suppliers,
etc.. With attachment and certain forms of cooperation of each party is working for
the implementation of the project. Construction project is one type of project that
aims to build a physical building of residential buildings, commercial buildings,
industrial buildings.
The project has unique characteristics, is always different in terms of
complexity, size, and resources necessary. The intensity of the dynamic nature of
project activities, the dynamics is characterized by ups and downs of resource
requirements throughout the project cycle. Because of the complexity and dynamics
of the intensity of the project, the project is divided into several stages. There is no
standard that is used in the division of stages in a project cycle, this staging is
generally based on the type of activities that take place during these stages. PMI
(Project Management Institute) Divide the project into phases: Conceptual Stage,
Stage Development Planning (PP / Definition), Implementation and Termination.
The purpose of the division of stages in one cycle of this project is to facilitate in
identifying and tracking changes in the activities so that project management system
can be effectively done.
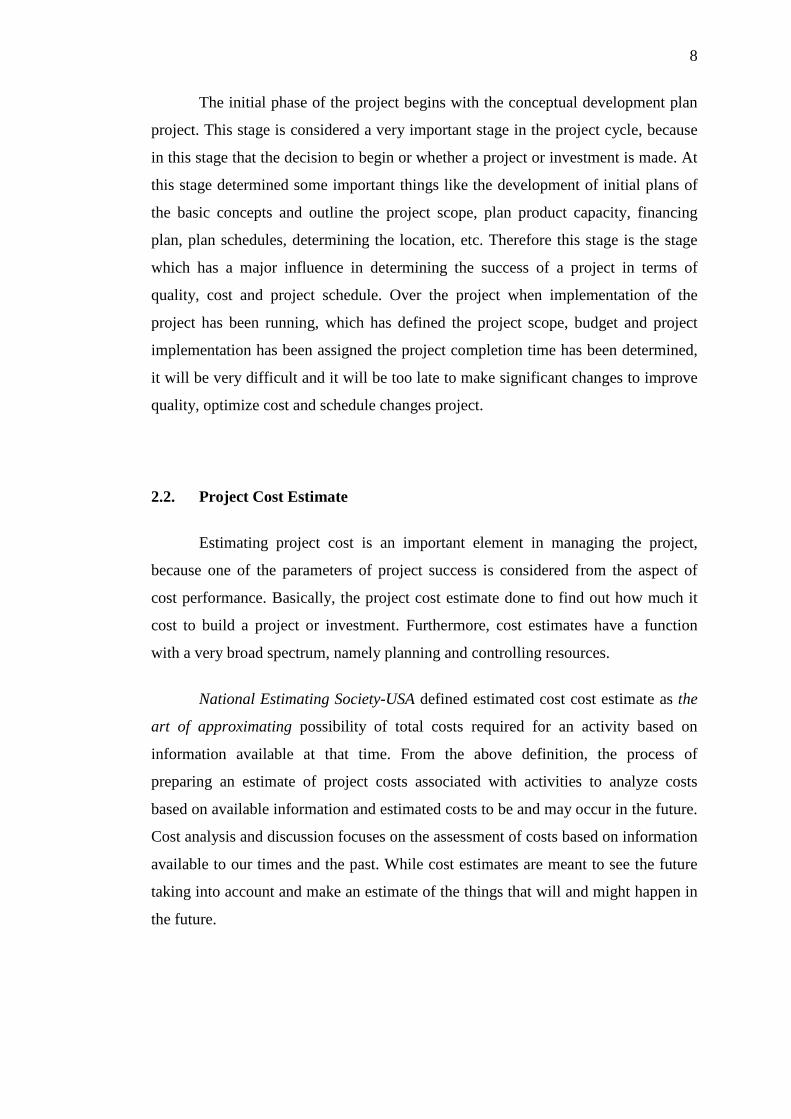
8
The initial phase of the project begins with the conceptual development plan
project. This stage is considered a very important stage in the project cycle, because
in this stage that the decision to begin or whether a project or investment is made. At
this stage determined some important things like the development of initial plans of
the basic concepts and outline the project scope, plan product capacity, financing
plan, plan schedules, determining the location, etc. Therefore this stage is the stage
which has a major influence in determining the success of a project in terms of
quality, cost and project schedule. Over the project when implementation of the
project has been running, which has defined the project scope, budget and project
implementation has been assigned the project completion time has been determined,
it will be very difficult and it will be too late to make significant changes to improve
quality, optimize cost and schedule changes project.
2.2. Project Cost Estimate
Estimating project cost is an important element in managing the project,
because one of the parameters of project success is considered from the aspect of
cost performance. Basically, the project cost estimate done to find out how much it
cost to build a project or investment. Furthermore, cost estimates have a function
with a very broad spectrum, namely planning and controlling resources.
National Estimating Society-USA defined estimated cost cost estimate as the
art of approximating possibility of total costs required for an activity based on
information available at that time. From the above definition, the process of
preparing an estimate of project costs associated with activities to analyze costs
based on available information and estimated costs to be and may occur in the future.
Cost analysis and discussion focuses on the assessment of costs based on information
available to our times and the past. While cost estimates are meant to see the future
taking into account and make an estimate of the things that will and might happen in
the future.

9
Estimating project cost is generally a step-by-step through the process of
systematic and relatively the same between one project and previous projects of its
kind. Project cost estimate process depicted in Figure 2.1 below:
Figure 2.1 Project Cost Estimate Process Source : (Oberlander, 2001)
2.3. Cost Estimate Classification System and Accuracy Ranges
The process of cost estimates made during the project cycle, some types of
cost estimates are developed based on the stage in a project cycle (Figure 2.2),
beginning with preliminary cost estimates at this early stage conceptual continued to
expand in the next stage until all the stages of construction in progress (Oberlander,
2000)
Figure 2.2 The Stages of Project Estimated Cost Source : (Oberlander, 2000)

10
A variety of terms used by some literature to classify and define the type of
project cost estimates. Based on its function and the stages through which as well as
supporting elements, Barrie (1992) classify the types of cost estimates as follows:
a) Preliminary Cost Estimates / Conceptual and Preliminary Estimate.
Preliminary cost estimate are cost estimates prepared in the early stages
of planning the project before the completion of engineering design is
made.
b) Estimated Cost Details / Detailed Estimate
Detailed cost estimates are prepared cost estimates based on planning
documents and technical specifications of engineering that has been
made.
c) Definitive Cost Estimates / Definitive Estimate
The estimated cost is definitive cost estimates used to predict the cost of
the project (The project cost forecasting) Based on constraints derived
from the estimated cost of which was made earlier.
The American National Standards Institute (ANSI, 1991) defines three
types of estimates: order-of-magnitude, budget, and definitive.
a. Order-of-magnitude estimates have an expected accuracy between +50%
and -30%. They are generally based on cost-capacity curves and cost-
capacity ratios and do not require any preliminary design work.
b. Budget estimates are based on flowsheets, layouts, and preliminary
equipment descriptions and specifications and have an accuracy range
of +30% to -15%. Design generally must be 5 to 20% complete to
permit such an estimate to be performed.
c. Definitive estimates require defined engineering data, such as site
data, specifications, basic drawings, detailed sketches, and equipment
quotations. Design is generally 20 to 100% complete, and estimate
accuracy should be within +15% to -5%.
Definitions of these estimate types were developed by AACE International.
AACE International has proposed an expansion of the ANSI estimate

11
classifications to five types with expected accuracy levels based upon the amount
of project definition available when the estimate is prepared (AACE, 1997). The
accuracy of each class of estimate depends on the technological complexity of the
project, appropriate reference information, and inclusion of an appropriate
contingency determination. In all cases, accuracy ranges could exceed the ranges
indicated below in unusual circumstances.
The revised classifications are:
a. Class 5 estimates: These estimates are generally based on very
limited information. They may be prepared within a very limited
amount of time and with little effort expended—sometimes less than
one hour. Often little more is known than the proposed plant type,
location, and capacity. This class of estimate falls into the ANSI
order-of-magnitude classification. The required level of project
definition is 2% or less and the expected accuracy is -20% to -50%
on the low side and +30% to +100% on the high side.
b. Class 4 estimates: Class 4 estimates also are generally prepared based
upon limited information and also have fairly wide accuracy
ranges. They are typically used for project screening, feasibility
determinations, concept evaluation, and preliminary budget approval.
Engineering is only 1% to 5% complete and comprises, at a minimum,
plant capacity, block schematics, indicated plant layout, process flow
diagrams (PFDs) for the main process systems, and preliminary lists
of engineered process and utility equipment. Typical accuracy ranges
for this class of estimate are -15% to -30% on the low side, and
+20% to +50% on the high side. This class of estimate falls into the
ANSI budget estimate classification.
c. Class 3 estimates: These are estimates which form the basis for budget
authorization, appropriation, and/or funding. These estimates
typically form the initial control estimate against which all actual
costs and resources will be monitored. The required level of
project definition (i.e., completed engineering) is 10% to 40% and

12
includes at a minimum: process flow diagrams, utility flow
diagrams, preliminary piping and instrument diagrams, plot plans,
developed layout drawings, and essentially complete engineering
process and utility equipment lists. Accuracy ranges for this class
of estimate are -10% to -20% on the low side, and +10% to +30%
on the high side. This class of estimate also falls into the ANSI budget
estimate classification.
d. Class 2 estimates: This class of estimate falls into the ANSI definitive
estimate category. Class 2 estimates are generally prepared to form
detailed control baselines against which all project work is monitored
in terms of cost and progress control. For contractors, this class of
estimate is often used as the “bid” estimate. Typically engineering
is 30% to 70% complete and comprises, at a minimum: process flow
diagrams, utility flow diagrams, piping and instrument diagrams
(P&IDs), heat and material balances, final plot plans, final layout
drawings, complete lists of engineered process and utility equipment,
single line electrical diagrams, electrical equipment and motor
schedules, vendor quotations, detailed project execution plans,
resourcing and work force plans, etc. Accuracy ranges are much
improved over the prior classes of estimates. On the low side they are -
5% to -15%. On the high side, the ranges are +5% to +20%.
e. Class 1 estimates: Also included in the ANSI definitive estimate category,
this is the most accurate classification of estimates. Class 1 estimates
are generally prepared for discrete parts or sections of the total
project rather than for the entire project. The parts of the project
estimated at this level of detail are typically used by subcontractors
for bids, or by owners for check estimates. The updated estimate is
often referred to as the current control estimate and becomes the new
baseline for cost/schedule control of the project. This type of estimate is
often made to evaluate and/or dispute claims. Typically engineering is
50% to 100% complete and comprises virtually all engineering and
design documentation of the projects, and complete project

13
execution and commissioning plans. Typical accuracy ranges are -
3% to -10% on the low side and +3% to +15% on the high side.
Another associated cost estimating reporting and formatting reference
document is the ASTM E2516 – Standard Classification for Cost Estimate
Classification System for Building Projects, General Construction Projects, and
Infrastructure Projects. In general, this system is intended to be used for projects
where the main purpose of the project pertains to a building or facility. This shall
also include general site construction and infrastructure projects, where a
building or infrastructure project is the majority of the overall scope of the
project.
Table 2-1 below is an overview chart that combines tables from AACE
18R-97 and ASTM E2516 – Cost Estimating Classification System (see
recommended practices for more information):

14
Table 2-1 Cost Estimate Overview Chart Primary Characteristic Secondary Characteristic
EXPECTED ACCURACY RANGE [a] LEVEL OF PROJECT
DEFINIITION END USAGE METHODOLOGY PREPARATION
EFFORT [b]
Estimate Class
Expressed as % of Complete Definition
Typical Purpose of Estimate
Typical Estimating Method
Typical degree of effort relative to least cost
index of 1 [b] Process Industry (AACE 18R-97)
Building and General Construction Industry
(ASTM E2516)
Class 5 0% to 2% Concept Screening
or Feasibility
Capacity Factoring, Parametric Models,
Judgment, or Analogy 1 Low: -20% to -50%
High: +30% to 100% Low: -20% to - 30% High: +30% to +50%
Class 4 1% to 15% Concept Study or
Feasibility
Equipment Factored, Parametric Models, ,
Assembly Drive Models 2 to 4
Low: -15% to -30% High: +20% to 50%
Low -10% to -20% High: +20% to +30%
Class 3 10% to 40%
Budget, Authorization or
Control
Semi-Detailed Unit Costs with Assembly
Level Line Items 3 to 10 Low: -10% to 20% High: +10% to 30%
Low: -5% to -15% High: +10% to +20%
Class 2 30% to 70% Control or Bid/Tender
Detailed Unit Cost with Forced Detailed Take-
off 4 to 20 Low: -5% to -15% High: +5% to +20%
Low: -5% to -10% High: +5% to +15%
Class 1 Up to 100% Check Estimate or
Bid/Tender Detailed Unit Cost with
Detailed Take-off 5 to 100 Low: -3% to -10% High: +3% to +15%
Low: -3% to -5% High: +3% to +10%
Notes: [a] The state of proecess technogy and availibility of applicable reference cost data affect the range markedly.
The +/- value reprsents typical percentage variation of actual cost from the cost estimate after application of the contingency (typically at a 50% level of confidence) for given scope.
[b] If the range index value of '1' repesents 0.005% of project costs, then an index value of 100 represents .05%. Estimate preparation effort is highly dependent upon the size of the project and the quality of estimating data and tools.
Sources: 1. AACE International Recommended Practice 18R-97 Cost Estimate Classification System - As Applied in Engineering, Procurement, and
Construction For The Process Industry, Morganton, VA, 1997 2. ASTM, Standard Classification For Cost Estimate Classification System, E2516-06, West Conshohocken, PA, 2006

15
Figure 2.3., shows the various ranges of the AACE 18R-97 Recommended Practice
– Cost Estimate Classification System – As Applied In Engineering, Procurement,
and Construction For The Process Industries:
Source : AACE International Recommended Practice
2.4. Accuracy Of Early Cost Estimate
Early stage cost estimation is the forecasting of the cost of a project during
the planning and design stage (Serpell, 2005). Skitmore (1991) describes the
accuracy of early stage estimation as comprising two aspects, namely, bias and
consistency of the estimate when compared with the contract or accepted tender
price. Bias is concerned with ‘the average of differences between actual tender price
and estimate’ while consistency of estimates is concerned with ‘the degree of
variation around the average’. Aibunu and Pasco (2008) describes bias (inaccuracies)
in the estimate of a project may arise from two sources, namely, bias associated with
the project itself (will be the same regardless of the estimator) and bias associated
with the estimating technique used and the environment (which would change
depending on the estimator).

16
2.5. Early Cost Estimate
Estimated project cost is a dynamic activity conducted throughout the project
cycle stages, starting from the beginning of the project and ends when the projects
are handed over to the project owner (Gould, 2009). Viewed from the process in the
project cycle, early cost estimates are cost estimates prepared during the feasibility
study phase until just before detail design has been completed (Oberlander, 2000). So
basically the cost estimates are preliminary cost estimates are compiled based on data
and information from an initial concept in the form of an outline of the scope of a
project. Various terms of some of the literature used to explain the preliminary cost
estimates, such as: early cost estimate (Oberlander, 2000), Conceptual estimate
(CMAA, 2001), Preliminary estimate, parametric estimate (Hegazy 2002),
Feasibility estimate, an order of magnitude estimate (Kerzner, 2005), screening
estimate (Ritz, 1994), pre-tender estimate (Ashworth) etc..
Preliminary Estimates are employed in the early planning phases of a
proposed project to match an owner's needs (see table 2.2 ), expressed as written
requirements, with budget constraints in order to establish its overall scope (size) and
quality expectations. (Rosdan, 2010)
Table 2.2 General concept stages of cost estimate process
Source : (Rosdan, 2010)
17
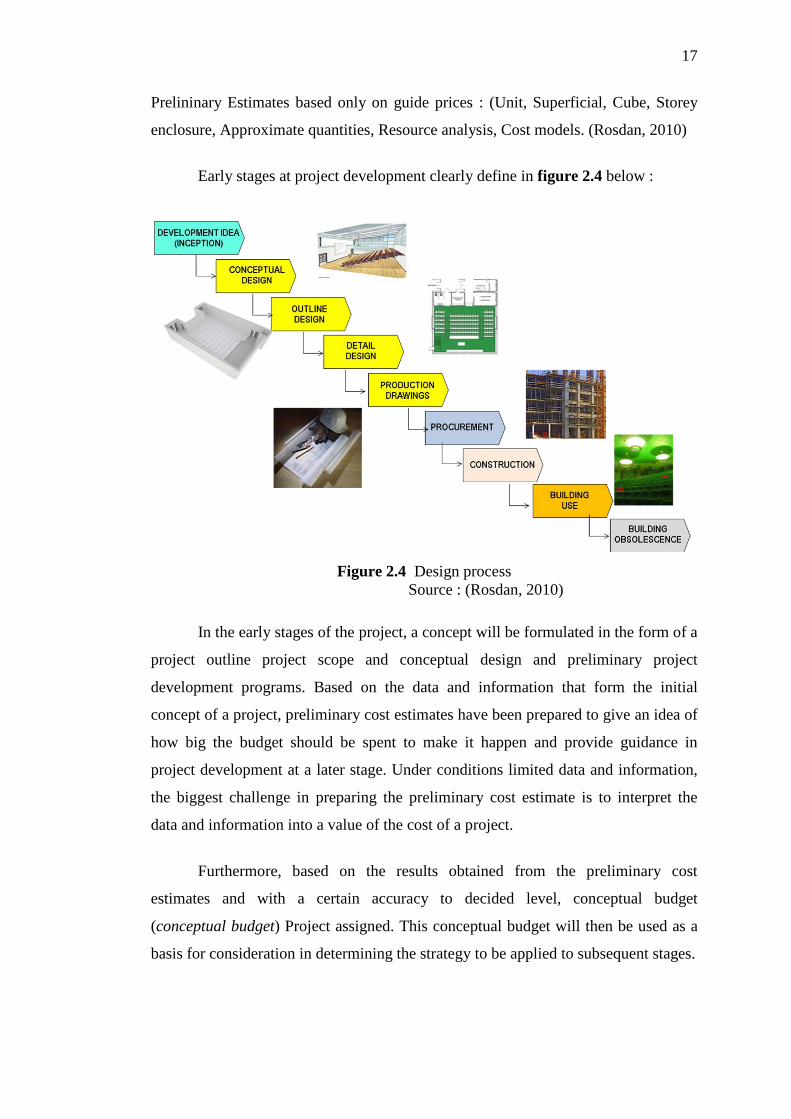
Prelininary Estimates based only on guide prices : (Unit, Superficial, Cube, Storey
enclosure, Approximate quantities, Resource analysis, Cost models. (Rosdan, 2010)
Early stages at project development clearly define in figure 2.4 below :
Figure 2.4 Design process
Source : (Rosdan, 2010)
In the early stages of the project, a concept will be formulated in the form of a
project outline project scope and conceptual design and preliminary project
development programs. Based on the data and information that form the initial
concept of a project, preliminary cost estimates have been prepared to give an idea of
how big the budget should be spent to make it happen and provide guidance in
project development at a later stage. Under conditions limited data and information,
the biggest challenge in preparing the preliminary cost estimate is to interpret the
data and information into a value of the cost of a project.
Furthermore, based on the results obtained from the preliminary cost
estimates and with a certain accuracy to decided level, conceptual budget
(conceptual budget) Project assigned. This conceptual budget will then be used as a
basis for consideration in determining the strategy to be applied to subsequent stages.

18
Preliminary cost estimates is part of a project feasibility study whose results
will be used as one basis in decisions about the steps that will be done next, for
example in terms of planning and development of corporate strategy, screening of
projects wherever potential harm to the company's business continuity and
determination of policy in terms of the use of company resources.
In terms of availability of budget funds that are owned by the owner of the
project and how much budget is needed to build the project, the results obtained from
the preliminary cost estimates will be used as a reference for comparison against the
budget funds that are owned by the project owner. So the preliminary cost estimate is
kind of the first cost estimates produced in a project cycle which made reference to
check if the budget funds /budget in accordance with the cost needed to realize the
project (Barrie, 1992). When assessed the cost is too great to budget funds /budget
available (overbudget), Then the alternative concept will be developed to suit the
available resources.
At this stage of the Planning and Development (PP / Definition), preliminary
cost estimates used by the project team as one of the considerations in formulating
strategy and management of projects as the basis of stats and technical design
development projects.
Preliminary cost estimates are also used as a basis for preparing the outline of
the project schedule (Barrie, 1992). In the outline of the schedule is set to determine
when the planning phase of design and implementation procurement can be
implemented.
Usefulness of the preliminary cost estimates by Iman Soeharto (2001) is as
follows:
a. Assessing the economic and financial feasibility of the project.
b. Determining the order of priority (ranking) Of several projects.
c. Determining whether continued or not efforts further assess the
feasibility of the project.
From the above explanation can be concluded on the importance of a
preliminary cost estimate, but the limited data and information available is one of the

19
causes of type preliminary cost estimates have the lowest degree of accuracy than
any other cost estimates. The more complete information available, the better the
resulting accuracy. Therefore it needs to do the right approach in preparing the
preliminary cost estimates to generate cost estimates that have a good degree of
accuracy.
2.6. Factor Affecting Quality of Cost Estimate
Skitmore and Stradling (1990) describes five primary factors affecting quality
of cost estimating. These concern (1) the nature of the project, (2) the information
used, (3) the estimating technique used, (4) the feedback mechanism used and, (5)
the person providing the forecasts. This section provides a review of the literature
that has been examined to date on the subject.
Similar with Skitmore, Iman Soeharto (2001) describes the quality of cost
estimates depend on the following matters:
a. Availability of data and information
b. Techniques and methods used
c. Proficiency and experience of the estimator.
d. The purpose of the use of cost estimates.
The availability of information about the scope of the project is an important
factor in the quality of the resulting cost estimates. According to Oberlander (2000),
the accuracy of the estimated project cost is a function of the availability of
information (definition of project scope). The further progress of the project,
estimated cost or budget, the better prepared and sharp accuracy, because the
availability of input data and information needed (Iman Soeharto, 2001). For
example, in the early formulation of the scope of the project, because most of the
data and information is not available or can not be determined, prepared a
preliminary cost estimate with accuracy that is still rough (order of magnitude.)
Therefore, the increasing availability of data and information along with the progress
of the project are known several types of costs during the project cycle.

20
Techniques and methods used affect the quality of the resulting cost
estimates. However, the selection of techniques and methods do not stand alone, but
closely related to the purpose of the use of cost estimates and information available.
Due to the nature of work within the estimated cost of requiring various
assessment and judgment especially in the preparation of preliminary cost estimates
where data and information available is still limited, the skill and experience
compiler cost estimate (estimator) is very influential to produce quality cost estimate.
Figure 2.5 illustrates the influence of skills and experience of the estimator,
procedures and methods used to estimate the accuracy of a cost.
Figure 2.5 Effect of skill and experience of the estimator of the accuracy of
the estimated project costs
Source : (Oberlander, 2001)
In one known term project cycle cost of the project cycle (cost engineering)
which includes the cost estimates, cost budgeting, and cost control. So a person who
served in one cycle cost engineering must have experienced, because the cost aspect
is very important benchmark in the success of the project.
Besides the above factors, the quality of cost estimates is also determined by
the purpose of use. For example, preliminary cost estimates used in assessing the
feasibility of the project does not need to be prepared outlining the scope of work

21
(work breakdown structure) To detail as in the process of developing a definitive
cost estimates used in preparing the project budget control.
Based on the explanation and reviews from several literature above, the
authors make a grouping of factors that affecting the accuracy of early cost estimate
into 5 groups:
No. VARIABLES LITERATURE
I. NATURE OF THE PROJECT
1. Type of the project Skitmore (1999); Ogunlana and Thorpe (1991)
2. Size of project / scope of project Skitmore (1999; Ogunlana and Thorpe (1991)
3. Complexity of project Ogunlana and Thorpe (1991)
4. Other project characteristics Skitmore (1990)
5. Geographical location / Site location Skitmore (1990); Ogunlana and Thorpe (1991); Oberlander (2003)
6. The contract procurement system Skitmore (1990)
7. The prevailing economic climate Skitmore (1990)
II. THE LEVEL OF DATA AND INFORMATION AVAILABLE
8. Completeness of cost information Oberlander (2003)
9. Quality of information Babalola (2006)
10. Accuracy and reliability of cost information Oberlander (2003)
11. Aplicability of cost information Oberlander (2003)
12. Project information/Documents used in preparing the estimate Babalola (2006)
13. Capacities of project Oberlander (2003); Babalola (2006)
14. Time allowed for preparing the estimate Oberlander (2003)
15. Technology; Method of construction Oberlander (2003); Babalola (2006)
16. Processes project Oberlander (2003)
17. Piping & Instrumentation Diagrams Oberlander (2003)
18. Amount of special work likely production time Babalola (2006)
19. Project design criteria Oberlander (2003)
20. Complexity of design and construction Babalola (2006); Ogunlana and Thorpe (1991)
21. Utility resources and supply conditions Oberlander (2003)
22. Heat and material balances Oberlander (2003)

22
23. Mechanical equipment list Oberlander (2003)
24. Lead time for delivery of materials Babalola (2006)
25. Project Schedule Oberlander (2003); Babalola (2006)
26. The form of procurement and contractual aggrement Babalola (2006)
27. Project strategy Oberlander (2003)
28. The extent of completion of pre-contract decision Babalola (2006)
29. Frequency of construction variations Babalola (2006)
30. Client’s financial situation Babalola (2006)
31. Owner’s cost Oberlander (2003)
32. Purpose and intended use of estimate Oberlander (2003)
33. Owner’s experience level Oberlander (2003)
34. Engineer/Designer’s experience level Oberlander (2003)
35. Enviromental assesment and workforce Oberlander (2003); Babalola (2006)
36. The type of structure Babalola (2006)
III. THE ESTIMATING TECHNIQUE AND METHOD USED
37. Alligment of estimate methodology with available project information Oberlander (2003)
38. Is the estimate work process formally define and followed? Oberlander (2003)
39. Formal structure to categorized and prepare the estimate Oberlander (2003)
40. Utilization of checklist to ensure completeness and technical basis Babalola (2006)
41. Standard procedure to update cost data of project Oberlander (2003); Babalola (2006)
42. Documentation of information used in preparing the estimate Oberlander (2003)
43. Involvement of other resources in preparing the estimates Oberlander (2003)
44. Level of involvement of the project manager Oberlander (2003)
45. Level of team integration and aligment Oberlander (2003)
46. Review and acceptance of estimate by appropriate parties Oberlander (2003)
47. Attitude/culture forward changes Oberlander (2003)
48. Method used to determine contingency Oberlander (2003); Babalola (2006)
49. the conference estimate, Ashworth and Skitmore (1986)
50. comparison estimate, Ashworth and Skitmore (1986)
51. graphical relationships, Ashworth and Skitmore (1986)
52. unit techniques, Ashworth and Skitmore (1986)
53. functional approach, Ashworth and Skitmore (1986)
54. resource estimate Ashworth and Skitmore (1986)

23
55. factor estimate Ashworth and Skitmore (1986)
56 exponent estimate Ashworth and Skitmore (1986)
IV. ABILITY OF ESTIMATOR
57. Estimator expertise Iman Soeharto (2001) ; Babalola (2006)
58. Relevant experience of the estimating team Oberlander (2003); Ogunlana and Thorpe (1991)
59. Quality level of Estimator Skitmore (1990)
60. Attributes of Estimator Skitmore (1990)
61. Acquisition and application of expertise Skitmore (1990)
V. OTHER FACTOR CONSIDERED WHILE PREPARING THE ESTIMATE
62. Impact of project type Oberlander (2003)
63. Impact of contract type Oberlander (2003)
64. Impact of project schedule Oberlander (2003)
65. Impact of govermental requirements Oberlander (2003)
66. Work force Oberlander (2003)
67. Labour productivity Oberlander (2003)
68. Tax and insurence Oberlander (2003); Babalola (2006)
69. Money factors (currency, inflation, Oberlander (2003)
70. Bidding climate Oberlander (2003)
71. The nature of the competition / Bidding Competitiveness
Skitmore (1990); Babalola (2006)
72. Logistic for engineering and constructions Oberlander (2003)
Table 2.3. Factor Affecting Accuracy of Early Cost Estimate Source : (Skitmore, Ashworth, Ogunlana, Thorpe, Oberlander, Babalola, Iman Suharto)

24
CHAPTER 3
RESEARCH METHODOLOGY
3.1. Method Of Research
In general, the research methodology is a step-by-step or series of activities
starting from the beginning of the study until the final report of a study. The research
method is indispensable in providing guidelines for researchers to achieve the goals
and objectives of the study. The research method is closely related to procedures,
tools and research designs used. Research design, procedures and equipment used in
research must comply with the research method used. Based on the rules in scientific
research, following the steps used in this study (Figure 1.1).
Figure 3.1: Research Methodology
Source : (Nazir, 2005)

25
In this research method used is survey method, the research conducted to
obtain the facts from the existing symptoms and seek factual descriptions, whether of
social institutions, economics, or politics of a group or region. Survey methods to
dissect and skinning as well as recognize the problems and get the justification of the
status and practices that are in progress. (Nazir, 2005). Research conducted at the
same time against a number of individuals or units using sample.
The first step in doing research is to formulate the problem to be solved. To
remove any doubt the matter should be clearly identified, namely by defining the
extent the scope and limitations of the problem and research objectives to be
achieved. Scope / limitations of the problem and research objectives should be
consistent with the formulation and definition of the problem.
After the formulation of the problem, then proceed by searching for data
related to the topic of research. Study literature conducted to gain a deeper
understanding on the aspects studied. The data obtained from books and research
journals and the search for information via the Internet. In the field of science that
already have strong theories, it is necessary to formulate a theoretical framework or
conceptual framework which can then be derived in the form of hypotheses to be
tested.
After the data obtained in accordance with the problems to be solved, the next
step is to formulate a research hypothesis. The hypothesis is tentative conclusions
about the relationship between variables has to do anything to or phenomena in the
study. The hypothesis is a tentative conclusion that acceptable while before the test.
After the hypothesis set, the next step is to formulate ways to test the hypothesis.
Hypothesis testing based on a framework of analysis (analytical framework) which
has been set.
The hypothesis test requires data, the data can be primary data and secondary
data related to research problems. The data collected is in the form of facts that will
be used to test the hypothesis that has been formulated previously. Data collection
techniques vary depending on the problem to be solved and the research techniques

26
used. In this research a survey involving interviews of experts who are experts in cost
engineering. It is important to validate the data obtained through the study of
literature, so in accordance with the conditions of construction projects in Indonesia.
Then, based on information obtained from the literature and input from experts,
developed a questionnaire as a tool for collecting research data.
After the data collected, the data is arranged in advance to facilitate analysis.
Compilation of data can be in the form of tables and make coding which will then be
analyzed with the help of computer software. In this study, an analysis aimed at
identifying risk factors significant happens during the preparation of cost estimates
that affect the accuracy of preliminary cost estimates. A mathematical model of the
analytical results generated to reflect the relationship between phenomena that are
implicit contained in the hypothesis, which will then be tested by several statistical
techniques.
The analysis result obtained then interpreted and made generalizations based
on findings that there is, so few conclusions can be drawn. This conclusion should be
related to the research hypothesis that has been formulated previously. What is the
correct hypothesis to be accepted, or whether the hypothesis was rejected. What is
the relationship between the phenomena obtained will be applied generally or only
apply to the particular conditions only. What suggestions can be drawn from the
research and how their implications for adoption.
After the formulation of the problem, then proceed by searching for data
related to the topic of research. Study literature conducted to gain a deeper
understanding on the aspects studied. The data obtained from books, research
journals and other source that related to the topic of research.
Study literature conducted to gain a deeper understanding on the aspects
studied. In the study of theories of literature related to research topics collected. This
is done to obtain a broader orientation on the problems to be solved, and avoiding
duplication is undesirable. Aside from being a source of secondary data, literature

27
studies are also needed to know to which science-related research topics and to
develop where there are conclusions and degeralisasi ever made before.
Studies on the research literature discusses several topics related to the early
cost estimates of construction projects. The estimated cost of the project outline
discussed from the start definition, the process is done until the type and function of
the estimated project cost. In this section, early cost estimates discussed in more
depth, with respect to the functions and processes that must be passed. Explained
about some essential functions of a preliminary project cost estimates as cost
estimates were first made at an early stage where a new project starts.
3.2. Research Variables
After the research problem and research hypotheses are formulated and
carried out literature studies, further determined what variables to use in these
research. The variables that you want to use should be established, identified and
classified in accordance with the desired goals and objectives achieved (Nazir, 2005).
In this research, there are two research variable, is described as follows:
a. The independent variable or independent variable (Xi), ie the risk factors
that affect the accuracy of preliminary cost estimates, with i = 1,2,3, ...
b. Dependent variable or dependent variable (Y), namely the variable
measuring the level of accuracy of the preliminary cost estimates on
construction projects that are influenced by the variable X.
The variables of this research are the factors that affecting the accuracy of
early cost estimates. These factors were collected from various sources of literature
are used as secondary data used in evaluating the quality of early cost estimates
associated with the resulting level of accuracy. Research variables can see in chapter
2 table 2.2 Factor Affecting Accuracy of Early Cost Estimate

28
Research variables derived from a concept that needs to be clarified and
changed its shape so it can be measured and used operationally. Proper gauge for
measuring the variable or concept is very important. With the appropriate measuring
instruments, researchers can link an abstract concept to reality and to formulate and
test hypotheses without obtaining difficulty (Nazir, 2005). By using the size / scale of
the right of a concept or variable is qualitative, the concept or variable will have a
quantitative trait. In other words, the scale needed to change the attribute with the
qualitative characteristics into a quantitative variable.
3.4. Collection of Data
Data collections here mean a process of procurement of primary data and
secondary data for research purposes. Data collection is a very important step in the
scientific method, because the data collected is used to test the hypothesis that has
been formulated previously.
Variables obtained from the study of research literature to be seen again one
by one its relevance to the limits and scope of the research. Often these variables can
not be used because it does not comply with the limits that have been made
previously. Duplication of variables that mean the same should be avoided to get
good research data.
Interviews are one of the data collection techniques in the research process.
Data collected must be sufficiently valid to be used. In this study, variables derived
from prior literature study verified by experts through interviews with experts who
are competent, both from the practitioners and academicians. Interviews with experts
committed with intent to obtain or confirm a fact as well as to increase confidence
about the state of facts. Through interviews with experts, secondary data in the form
of risk variables that affect the accuracy of preliminary cost estimates obtained from
literature will be reduced or even be increasing in number. This is done to identify
the variables may not be found in the literature but significant happens in practice.
29
3.4.1 Questionnaire Research
Technique of primary data collection in this research is by distributing a list
of frequently called a questionnaire. The questionnaire contains questions based on
variables obtained through literature studies and inputs from experts who have done
previously. The questionnaire was divided into two parts, the first part contains data
on the background of the respondents and the second part is the core of the
questionnaire which contains the factors that affect the accuracy of preliminary cost
estimates.
In the survey questionnaire design, independent variables are arranged in a
list of questions about how the factors that affects the accuracy of preliminary cost
estimates that occurred in the project of the respondents. Answer the question made
in the form of options that have been prepared on a Likert scale with 5 (five) options.
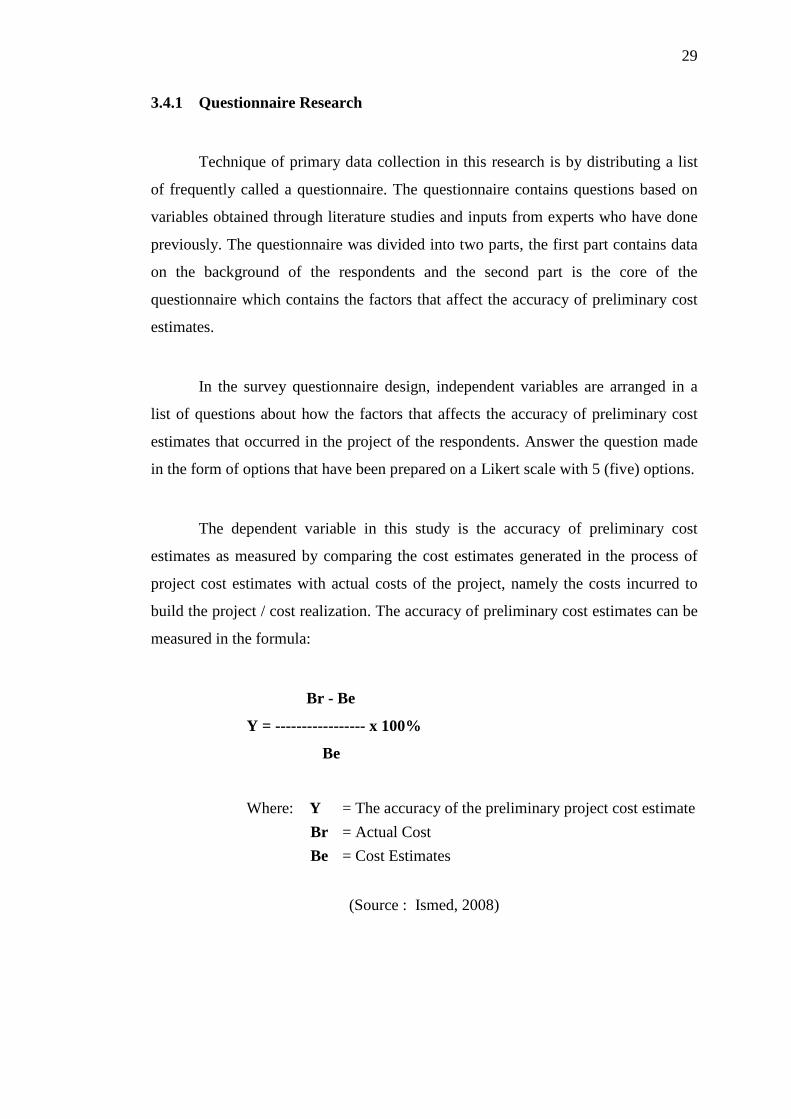
The dependent variable in this study is the accuracy of preliminary cost
estimates as measured by comparing the cost estimates generated in the process of
project cost estimates with actual costs of the project, namely the costs incurred to
build the project / cost realization. The accuracy of preliminary cost estimates can be
measured in the formula:
Br - Be
Y = ----------------- x 100%
Be
Where: Y = The accuracy of the preliminary project cost estimate Br = Actual Cost Be = Cost Estimates
(Source : Ismed, 2008)

30
Choice accuracy was measured in the early cost estimate following scale:
Scale Quantitative Assessment Level Accuracy
1 - 50% ≤ Y ≤ - 30% or + 50% ≤ Y ≤ + 100%
Inaccurate
2 - 20% ≤ Y ≤ - 10 % or
+ 20% ≤ Y ≤ + 50% Less accurate
3 -10 % ≤ Y ≤ - 5 % or +10% ≤ Y ≤ + 20%
Fairly accurate
4 -5 % ≤ Y ≤ - 3 % or +5 % ≤ Y ≤ + 10%
Accurate
5 -3 % ≤ Y ≤ + 5% Very Accurate
Table 3.1 Likert scale level of accuracy early cost estimate
(Source : Analysis Result from AACE 18R-97 and ASTM E2516)
3.5. Data Analysis
From the data obtained and collated, it is necessary to look for patterns of
data analysis these factors. The analysis used should be a proper analysis of existing
data to manage, so the results are consistent with the objectives to be achieved.
The process of further analysis is to use the software help Microsoft Exel and
Statistical Product for Service Solution (SPSS). This analysis was conducted to
process data that has been distributed questionnaires to the respondents. SPSS
software is a computer application programs which are specifically used to analyze
statistical data. This analysis is done to see how much influence the risk variables on
the accuracy of preliminary cost estimates, which in turn acquired modeled
relationship model. Then do the test model in the form of quantitative analysis:
statistical analysis, correlation analysis, regression analysis, testing
heteroscedasticity, multicollinearity test, t test and F test.

31
3.5.1 Type of Data
The data to be used in the analysis of the questionnaire is interval data.
Interval data (also sometimes called integer) is measured along a scale in which each
position is equidistant from one another. This allows for the distance between two
pairs to be equivalent in some way. This is often used in psychological experiments
that measure attributes along an arbitrary scale between two extremes. In this case,
researcher determine level of accuracy, rate from 1 to 5 as a data. (ref :
changingminds.org)
3.5.2 Analysis Correlation
Correlation analysis is a numerical relationship between two random
variables. Correlation analysis aims to identify and find the relationship between
several variables that have been established for research. In the correlation test will
test how close the relationship between free variables and the dependent variable.
Correlation does not show any relationship, but merely gives an indication of
strength of the relationship between the variables.
The relationship of two variables declared with correlation coefficient (r).
The direction of the relationship between two variables can be divided into:
a. Direct correlation (positive correlation), namely a change in one variable
followed other changes regularly with the same direction of motion.
b. Inverse correlation (negative correlation), namely a change in one variable
followed by changes in other variables on a regular basis with movements in
the opposite direction.
c. Uncorrelated (No Correlation)
(1) Positive Correlation (2) Negative Correlation (3)Uncorrelated (No Correlation)

32
The relationship between variables produce positive or negative value with
the limit value of the coefficient correlation r (Pearson Correlation Coefficient) is 1
for positive correlation and -1 for negative correlation. If the value of correlation
coefficient close to zero, meaning there is no linear relationship between variables.
Diagram step of correlation analysis is as follows:
Input all variabel include accuracy into thevariables box . Correlation Coefficients : Pearson Test of significant : Two-tailed Flag significant correlation Options: Statistics : Means and standard deviations
Cross-product deviation and covariences Missing value : Exclude cases pairwise
Figure 3.2 Correlation Analysis Diagram
3.5.3 Regression Analysis
Correlation analysis is used to determine if there is a relationship between
two or more variables, while regression analysis is useful to predict how far the
influence of one or several independent variables on the dependent variable.
Regression analysis is one very important statistical analysis and mathematical
modeling related to the problem of a pair of observation data. Regression is a
statistical technique to determine the equation of a line or curve by minimizing the
deviation between observation data and the value of the regression equation. The
purpose of regression analysis in general is:
a. Determining the equation of the regression line based on the rate constants
and the resulting regression coefficients.
b. Finding correlations jointly between free and bound variables.
c. Testing the significance of independent variables affect the dependent
variable.
Correlate Bivariate OK

33
kk XaXaXaaY ++++= ...ˆ22110
Regression model generated from this regression analysis show quantitatively
the relationship between free variables X and Y, as follows:
Y = a + bX
(Sudjana 2005: 315).
Where:
a = Constant b = Regression coefficient X = Independent variable Y = Dependent Variable
This study uses multiple regression analysis that is a linear regression
analysis consists of a dependent variable and several independent variables. Multiple
linear regression analysis indicated the relationship between the regression equation:
(Sudjana 2005: 349).
( )2i
2i
iii2
ii
XXn )YX)(X()X)(Y(
a∑−∑
∑∑−∑∑=
( )2i
2i
iiii
XXn)Y)(X(-YXn b
∑−∑∑∑∑
=
∑ ∑ ∑∑ ∑ ∑ ∑
−
−= 2
212
22
1
22112
21
)())((
))(())((
iiii
iiiiiii
XXXX
YXXXYXXa
∑ ∑ ∑∑ ∑ ∑ ∑
−
−=
221
22
21
12122
12 )())((
))(())((
iiii
iiiiiii
XXXXYXXXYXX
a
22110 XaXaYa −−=

34
Where :
X1, X2, ..., Xk = Independent variable
Y = Dependent variable
0a = Constanta
kaaa ,...,, 21 = Regression coefficient
Diagram step of regression analysis is as follows:
d
Linear Regression :
Input variabel dependent
Input variabel independents
Method : Enter
Input Statistics
Input Plots
Figure 3.3. Regression Analysis Diagram
Regression model that has been obtained from regression analysis of model
validation should be qualified as follows:
1. Value Adjusted Square (R2) To measure the relationship between
independent variable X on variable Y has a minimum value of 0.5.
2. Value multi-collinearity has a maximum value of 18.
3. Regression coefficients must all be positive
In multiple regressions analysis is expected between the free variable (X)
there is no strong correlation because if this happens then the variable should not be
put into the equation. The existence of a strong correlation can be seen from the VIF
value > 10. If VIF < 10, then there is no strong correlations (multicolinearity).
Analyze Regression Linear OK
35
In practice, multiple regressions is more widely used because of the many
variables that need to be analyzed together, and also are generally more relevant
regression is used.
3.5.4 F test
F test used to test the null hypothesis (H0) that all coefficients of independent
variables Xi of the regression model is zero, and the alternative hypothesis is (Ha) is
that the entire value of the coefficient of variable X is not equal to zero. In other
words the ratio of F used to test the null hypothesis (H0), namely that free variables
together is not affected on the dependent variable, and alternative (Ha), namely that
the independent variables affect the dependent variable tehadap.
Good research data tend to come from the cause of the smaller of the result,
so there is clarity of contribution to the impacts generated. Variance is the difference
of each data with the average.
3.5.5 t test
t test used to test the null hypothesis (H0) that each coefficient of the regression
model is zero and the alternative hypothesis (Ha) is that if each coefficient of the
model is not equal to zero. If the null hypothesis is accepted means that the resulting
model can not be used to predict Y, otherwise if the hypothesis is rejected, then the
value of the resulting model can be used to predict the value of Y.
Criteria for testing this hypothesis is as follows:
H0 is rejected if t0 count > ta (n-k1) table
H0 is accepted if t0 count < ta (n-k-1) table

36
3.5.6 Auto Test Correlation (Durbin Watson Test)
Dubin Watson test was conducted to examine there is or there is no auto correlation
between the variables studied. Test the auto correlation with the value restriction
Durbin Watson (-2 < X < +2) to determine the presence or absence of residual
correlation or auto correlation of the resulting regression model.
3.5.7 Multicolinearity test
Multicollinearity is a condition in which independent variables in regression
equations have significant correlation with the other, or in other words there is a
correlation among independent variables (variables x). Parameters that can be used
as a benchmark whether or not multicollinearity is:
(a) Look at the correlation between pairs of variables: if the correlation
coefficients are greater than 0.80 (sometimes 0.90), the variables are strongly
correlated and should not be used.
(b) Use indicators that are calculated by SPSS
• Tolerance
The percentage of variance in a variable not associated with other
variables.
Tolerance has a range from zero to one. A value of near 1 indicates
independence.
If the tolerance value is close to zero, the variables are multicollinear.
As a rule of thumb, a tolerance of less than .20 indicates a problem
with multicollinearity.
• Variance inflation factor (VIF)
VIF is the inverse of the tolerance (1/tolerance). VIF has a range 1 to
infinity.

37
CHAPTER 4
ANALYSIS AND DISCUSSION
4.1. Preparation Research.
The approach taken in this research is through the methods of quantitative
statistical analysis of the correlation and regression analysis to determine significant
factors affecting the accuracy of early cost estimates.
The research data were collected from several sources of relevant literature.
By examining the duplication of variables-variables obtained from several sources of
literature and examine their relevance to the purpose and limitations of the study, the
factors that affect the accuracy of the preliminary cost estimate can be collected as
much as 72 variables.
Furthermore, to complement and verify the research variables is done by
interviews with experts. Three experts consisting of two practitioners and one
academic has reviewed and provided critical inputs in this study. Expert interview
process is focused on getting the factors that can not be obtained from literature
sources and confirmed based on their experience whether these factors are relevant to
the purposes and limitations of research that has been determined. Through expert
interviews obtained the factors that affect the accuracy of preliminary cost estimates
as many as 54 factors.

38
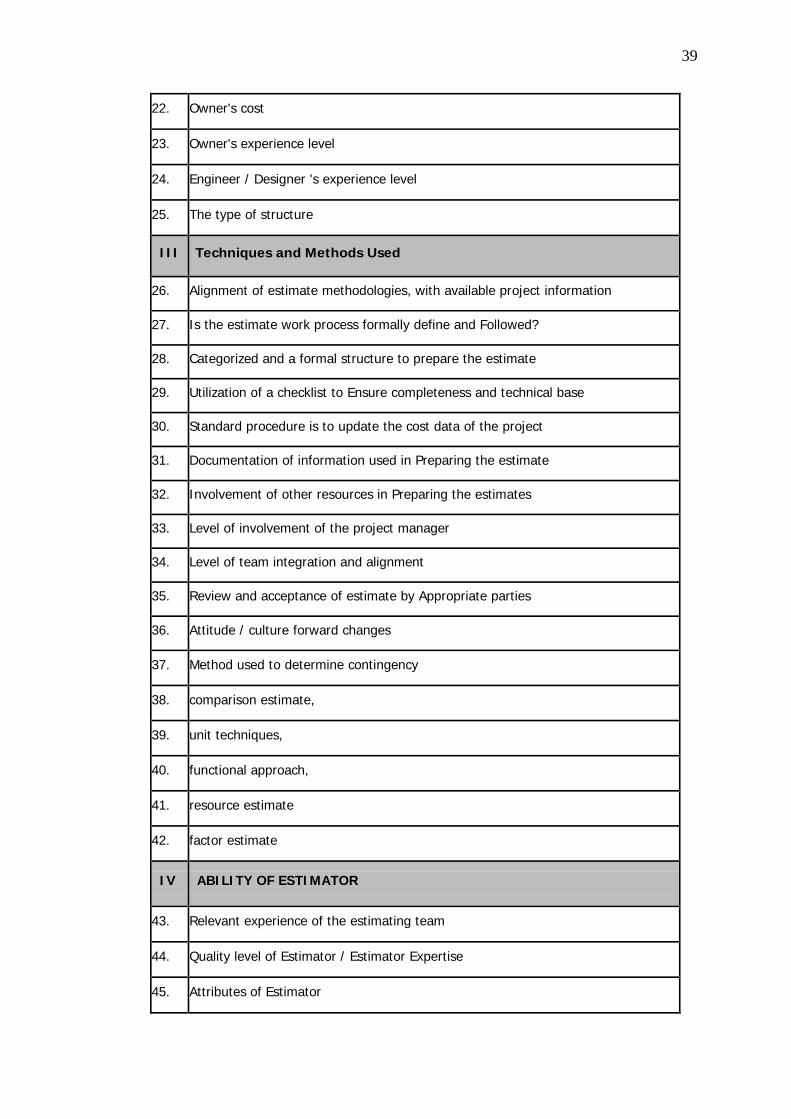
Here is a list of 54 factors that affect the accuracy of the preliminary cost
estimate after an interview with an expert who will then become the basis of
questions in the questionnaire:
I NATURE OF THE PROJECT
1. Type of the project
2. Size of Project / Scope of Project
3. Complexity of project
4. Geographical location / Site location
5. The contract procurement system
II THE LEVEL OF DATA AND INFORMATION AVAILABLE
6. Completeness of cost information
7. Accuracy and reliability of cost information
8. Applicability of cost information
9. Availability Project information / Documents used in Preparing the estimate
10. Capacities of project
11. Time allowed for Preparing the estimate
12. Technology: Method of construction
13. Project Processes
14. Project design criteria
15. Complexity of design and construction
16. Utility resources and supply conditions
17. Lead time for delivery of materials
18. Project Schedule
19. Project strategy
20. Frequency variations of construction
21. Client's financial situation
39
22. Owner's cost
23. Owner's experience level
24. Engineer / Designer 's experience level
25. The type of structure
III Techniques and Methods Used
26. Alignment of estimate methodologies, with available project information
27. Is the estimate work process formally define and Followed?
28. Categorized and a formal structure to prepare the estimate
29. Utilization of a checklist to Ensure completeness and technical base
30. Standard procedure is to update the cost data of the project
31. Documentation of information used in Preparing the estimate
32. Involvement of other resources in Preparing the estimates
33. Level of involvement of the project manager
34. Level of team integration and alignment
35. Review and acceptance of estimate by Appropriate parties
36. Attitude / culture forward changes
37. Method used to determine contingency
38. comparison estimate,
39. unit techniques,
40. functional approach,
41. resource estimate
42. factor estimate
IV ABILITY OF ESTIMATOR
43. Relevant experience of the estimating team
44. Quality level of Estimator / Estimator Expertise
45. Attributes of Estimator

40
46 Acquisition and application of expertise
V WHILE OTHER FACTOR Considered Preparing the Estimate
47. Impact of governmental requirements / regulation
48. Work force
49. Labour productivity
50. Tax and insurance
51. Money factors (currency, inflation, etc)
52. The prevailing economic climate
53. The nature of the competition / Bidding Competitiveness
54. Logistic for engineering and Constructions
Table 4.1 Factor affecting the accuracy of early cost estimate after interview
with expert.
(Source : Analysis result expert questionnaire)
Collecting research data in the form of primary data done with the survey
method. The design of the questionnaire in the form of checklists factors that affect
the accuracy of preliminary cost estimates as the independent variable (variable X)
and dependent variable (variable Y) of the accuracy of preliminary cost estimates on
projects that have been addressed. Research questionnaire distributed 70
questionnaires to the respondent’s sebayak research. Respondents who became a
target for research data collection focused to the project owner, the contractor and the
project consulting Services Company that has been experienced in the preparation of
preliminary cost estimates of construction projects.
4.2. Data Analysis Questionnaires
The questionnaire collected as many as 50 samples. Category respondent is
cost estimator, project manager, construction manager, or site manager who have
experiences at least 5 (five) years in building construction project in Jakarta. Profile
of respondents can be seen in Table 4.1. From the questionnaire, the data collected

41
and then entered into the computer made the tabulation of data in Excel format to
facilitate the analysis process. The process is treated with assisted statistical analysis
software SPSS ver.17. The first analysis is the correlation analysis to measure the
strength of the relationship between variables X with variables Y And then proceed
with regression analysis to obtain regres model of the factors that affect the accuracy
of preliminary cost estimates.
Table 4.2. Profile of respondents
4.2.1 Analysis Correlation
Correlation analysis of the data obtained is performed to find the strength of
association between two variables, namely the factors of influence and level of
accuracy of the preliminary cost estimates. Data compiled by the survey results
tabulated in Microsoft Excel and then transpose into SPSS.
From the questionnaire data have been obtained, results of correlation
analysis can be seen in Table 4.3. as follows:
Variable
symbol Factors
THE EARLY
COST Accuracy
of Estimate
X1 Type of the project Pearson Correlation 0, 048
Sig. (2-tailed) 0, 742
N 50
X2 Size of Project / Scope of Project Pearson Correlation 0.279 *
Sig. (2-tailed) 0, 050
N 50
X3 Complexity of project Pearson Correlation 0, 091
Sig. (2-tailed) 0, 531
N 50
No. Type of Company Total
1. The project owner 3 2. Consultant 28 3. Contractor 19

42
X4 Geographical location / Site location Pearson Correlation 0.769 **
Sig. (2-tailed) 0, 000
N 50
X5 The contract procurement system Pearson Correlation 0, 086
Sig. (2-tailed) 0, 554
N 50
X6 Completeness of cost information Pearson Correlation 0, 182
Sig. (2-tailed) 0, 207
N 50
X7 Accuracy and reliability of data /
information and document
Pearson Correlation 0, 105
Sig. (2-tailed) 0, 468
N 50
X8 Applicability of cost information Pearson Correlation 0, 118
Sig. (2-tailed) 0, 416
N 50
X9 Availability project information /
Documents used in Preparing the
estimate
Pearson Correlation 0.685 **
Sig. (2-tailed) 0, 000
N 50
X10 Capacities of project Pearson Correlation -0, 115
Sig. (2-tailed) 0, 427
N 50
X11 Time allowed for Preparing the estimate Pearson Correlation 0, 137
Sig. (2-tailed) 0, 341
N 50
X12 Technology: Method of construction Pearson Correlation 0, 071
Sig. (2-tailed) 0, 624
N 50
X13 Project Processes Pearson Correlation 0, 051
Sig. (2-tailed) 0, 724
N 50
X 14 Project design criteria Pearson Correlation -0, 051
Sig. (2-tailed) 0, 723
N 50
X15 Complexity of design and construction Pearson Correlation 0, 091
Sig. (2-tailed) 0, 531
N 50
X16 Utility resources and supply conditions Pearson Correlation 0, 010
Sig. (2-tailed) 0, 945
N 50

43
X17 Lead time for delivery of materials Pearson Correlation 0, 054
Sig. (2-tailed) 0, 712
N 50
X18 Project Schedule Pearson Correlation -0, 078
Sig. (2-tailed) 0, 589
N 50
X19 Project strategy Pearson Correlation 0, 056
Sig. (2-tailed) 0, 698
N 50
X20 Frequency variations of construction Pearson Correlation -0, 048
Sig. (2-tailed) 0, 738
N 50
X21 Client's financial situation Pearson Correlation 0, 069
Sig. (2-tailed) 0, 632
N 50
X22 Owner's cost Pearson Correlation 0, 225
Sig. (2-tailed) 0, 116
N 50
X23 Owner's experience level Pearson Correlation 0, 126
Sig. (2-tailed) 0, 384
N 50
X24 Engineer / Designer 's experience level Pearson Correlation 0, 106
Sig. (2-tailed) 0, 462
N 50
X25 The type of structure Pearson Correlation 0, 043
Sig. (2-tailed) 0, 765
N 50
X26 Alignment of estimate methodologies,
with available project information
Pearson Correlation 0, 063
Sig. (2-tailed) 0, 666
N 50
X27 Is the estimate work process formally
define and Followed?
Pearson Correlation 0, 239
Sig. (2-tailed) 0, 095
N 50
X28 Categorized and a formal structure to
prepare the estimate
Pearson Correlation 0, 154
Sig. (2-tailed) 0, 286
N 50
X29 Utilization of a checklist to Ensure
completeness and technical base
Pearson Correlation 0, 147
Sig. (2-tailed) 0, 309
N 50

44
X30 Standard procedure is to update the cost
data of the project
Pearson Correlation 0, 108
Sig. (2-tailed) 0, 454
N 50
X31 Documentation of information used in
Preparing the estimate
Pearson Correlation 0, 114
Sig. (2-tailed) 0, 432
N 50
X32 Involvement of other resources in
Preparing the estimates
Pearson Correlation 0, 040
Sig. (2-tailed) 0, 782
N 50
X33 Level of involvement of the project
manager
Pearson Correlation 0, 097
Sig. (2-tailed) 0, 503
N 50
X34 Level of team integration and
alignment
Pearson Correlation 0.323 *
Sig. (2-tailed) 0, 022
N 50
X35 Review and acceptance of estimate by
Appropriate parties
Pearson Correlation 0, 169
Sig. (2-tailed) 0, 240
N 50
X36 Attitude / culture forward changes Pearson Correlation 0, 086
Sig. (2-tailed) 0, 553
N 50
X37 Method used to determine contingency Pearson Correlation 0, 163
Sig. (2-tailed) 0, 259
N 50
X38 comparison estimate, Pearson Correlation 0, 130
Sig. (2-tailed) 0, 367
N 50
X39 unit techniques, Pearson Correlation 0, 010
Sig. (2-tailed) 0, 944
N 50
X40 functional approach, Pearson Correlation 0, 060
Sig. (2-tailed) 0, 680
N 50
X41 resource estimate Pearson Correlation -0, 008
Sig. (2-tailed) 0, 956
N 50
X42 factor estimate Pearson Correlation 0, 121
Sig. (2-tailed) 0, 404
N 50
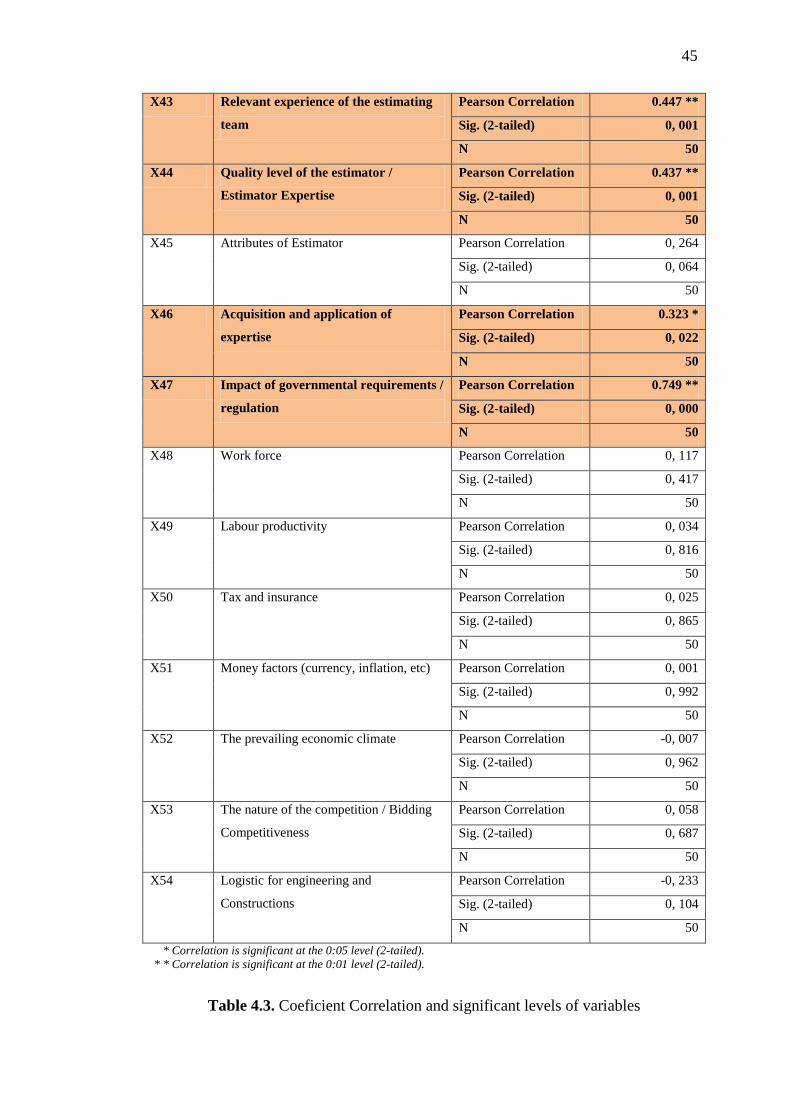
45
X43 Relevant experience of the estimating
team
Pearson Correlation 0.447 **
Sig. (2-tailed) 0, 001
N 50
X44 Quality level of the estimator /
Estimator Expertise
Pearson Correlation 0.437 **
Sig. (2-tailed) 0, 001
N 50
X45 Attributes of Estimator Pearson Correlation 0, 264
Sig. (2-tailed) 0, 064
N 50
X46 Acquisition and application of
expertise
Pearson Correlation 0.323 *
Sig. (2-tailed) 0, 022
N 50
X47 Impact of governmental requirements /
regulation
Pearson Correlation 0.749 **
Sig. (2-tailed) 0, 000
N 50
X48 Work force Pearson Correlation 0, 117
Sig. (2-tailed) 0, 417
N 50
X49 Labour productivity Pearson Correlation 0, 034
Sig. (2-tailed) 0, 816
N 50
X50 Tax and insurance Pearson Correlation 0, 025
Sig. (2-tailed) 0, 865
N 50
X51 Money factors (currency, inflation, etc) Pearson Correlation 0, 001
Sig. (2-tailed) 0, 992
N 50
X52 The prevailing economic climate Pearson Correlation -0, 007
Sig. (2-tailed) 0, 962
N 50
X53 The nature of the competition / Bidding
Competitiveness
Pearson Correlation 0, 058
Sig. (2-tailed) 0, 687
N 50
X54 Logistic for engineering and
Constructions
Pearson Correlation -0, 233
Sig. (2-tailed) 0, 104
N 50
* Correlation is significant at the 0:05 level (2-tailed). * * Correlation is significant at the 0:01 level (2-tailed).
Table 4.3. Coeficient Correlation and significant levels of variables

46
From the table 4.4. above can be seen which factors have a significant
correlation of early cost estimate accuracy indicated by the value significant level
<0.05.
The following variables-variables with correlation coefficient and a
significant degree of confidence:
Coef.
Correlation
Significant
Level
X2: Size of Project / Scope of Project 0.279 0.05
X4: Geographical location / Site location. 0.769 0.000
X9: Availability project information / Documents used
in Preparing the estimate. 0.685 0.000
X34: Level of team integration and alignment. 0.323 0.022
X43: Relevant experience of the estimating team. 0.447 0.001
X44: Quality level of the estimator / Estimator
Expertise. 0.437 0.001
X46: Acquisition and application of expertise. 0.323 0.022
X47: Impact of governmental requirements /
regulations. 0.749 0.000
Table 4.4. Factors that have a significant correlation of early cost estimate accuracy
(Source : Result of correlation analysis)
From the results of correlation analysis the correlation coefficient obtained
from the independent variable on the relationship with the dependent variable
showed a positive number (possitive / direct correlation), that is the change of
independent variable will cause a change in the dependent variable on a regular basis
and direction. So it can be concluded that if the performance of the variable X above
which are all factors that affect the accuracy of the preliminary cost estimate
increases, the accuracy of the preliminary cost estimate will increase.

47
4.2.2 Regression Analysis
Regression analysis conducted with the help of SPSS software ver. 17.
Through regression analysis can be seen how the strength of the relationship between
one or several independent variables with a dependent variable via a regression
model produced.
In this study it is assumed that the relationship between variables,
independent variables and the dependent variable is the liner, so the regression
analysis conducted in this study were linear regression analysis. In this regression
analysis, significant variables (X2, X4, X9, X34, X43, X44, X46 and X47) that have
been generated through correlation analysis of determinants included as independent
variables to generate a regression model. With regard to the value Adjusted R Square
and Coefficient Index it will produce a regression model that can express the
relationship between the independent variables significantly to the dependent
variable.
Results of initial regression analysis, can be seen in the following table:
Table 4.5: Model Summary
Table 4.6: Diagnostic collinearity

48
Table 4.7: Coefficient
On table 4.5 model summary, See figure Adjusted R Square is 0.711, it
shows the numbers Adjusted R Square good enough (near to 1).
On Table 4.6 Diagnostic collinearity, See figure Condition Index The
biggest is 37,213. Terms of model validation (test multicollinearity), Condition Index
must be ≤ 18. Therefore there are four variables that must be removed in order to
qualify validation. How to remove the variable is to look at the value Sig on Table
4.7 coefficient. Remove the 4 (four) variables have the high value Sig X46: X34:
X47, and X43. Then repeated the regression with independent variables X4, X44,
X9, and X2.
The results of the subsequent regression analysis, can be seen in the following
table:
Table 4.8 : Model Summary 1

49
Table 4.9 : Diagnostic collinearity 1
Table 4.10: Coefficients 1
On Table 4.8. Model Summary 1, See figure Adjusted R Square is 0.713, this
suggests there is an increasing number Adjusted R Square become better. On Table
4.9. Collinearity Diagnostic 1, Looks Condition Index produced the largest is 17.013,
which it has been qualified test models so that we can make it to see the regression
model coefficient in column B in Table 4.10. Coefficients 1.
The resulting regression model is as follows:
Y = 0.326 + 0.355 X4 + 0.243 X9 + 0.174 X44+ 0.054 X2
In the research, the data collected are often biased data (outliers) so it needs
to be re-examined data dissemination through Scatter plot - Regression Standardized
Predicted Value. The data is the outlier can be seen from the position data that are
beyond the threshold regression line with Confidence interval 95%. Therefore the

50
initial data (raw data) Should be re-examined and the data that acts as outlier should
be removed and then re-regression analysis was repeated so that the final regression
model can be generated.
The process of removal of outlier data and by performing repeated regression
analysis will increase the value adjusted R Square so that means that the reliability of
the resulting regression model will be better. On Charts - Y1 by * zpred scatterplot
in the regression analysis output can be seen early regression scatter diagram as
shown in figure 4.1 follows:
Figure 4.1. Scatter plot - Regression Standardized Predicted Value
In Figure 4.1 shows that the respondent no. 29 (R29) are beyond the
threshold regression, meaning that this data should be released. After the data no. 29
issued, performed the regression again to get a better regression model. The results of
the subsequent regression analysis can be seen in the following table:

51
Table 4.11 : Model Summary 2
Table 4.12 : Table Diagnostic collinearity 2
Table 4.13 : Table Coefficients 2
On Table 4.11. Model Summary 2, See figure Adjusted R Square is 0.791,
meaning there is a significant improvement from the previous model by removing
data no. 29.

52
The resulting regression model is as follows:
Y = 0.099 + 0.382 X4 + 0.245 X9 + 0.194 X44 + 0.056 X2
The process of removing data outliers and regression analysis is repeated
until all variables were obtained within the limits of regression. Outlier data that
should be eliminated in addition to data no. 29 is a data No.30, no.6, no.25, no. 24
and no. 40, so the final regression analysis performed with data as much as 44 data.
Final data obtained from the process which will then be used in the regression model.
Here are the final results of regression analysis produced:
Table 4.14: Model Summary (End)
Table 4.15: Coefficients (End)

53
Figure 4.2. Scatter plot - Regression Standardized Predicted Value (End)
On Table 4.14. Model Summary (end), Can be seen the value of Adjusted R
Square into 0.854, this shows the increased value of the Adjusted R Square initial
(0711). On Figure 4.2, the spread variable in the scatter plot shows the variables
inside the threshold of the final regression model regression so that we can produce
are as follows:
Y = 0.108 + 0.411 X4 + 0.208 X44 + 0.156 X9 + 0.096 X2
Where:
Y : Accuracy of early cost estimate. X4 : Geographical location / Site location.
X9 : Availability project information / Documents used in Preparing
the estimate. X44 : Quality level of the estimator / Estimator Expertise. X2 : Size of Project / Scope of the project.

54
4.2.3 Model Test
4.2.3.1 Linearity Test ( F Test )
F Test or Analysis of Variance (ANOVA) Aimed to test whether the resulting
regression model is linear or not. F test is done by looking at the data in table
ANOVA below that obtained from the regression analysis output.
Table 4.16 : ANOVA
Hypothesis:
H0 = not a linear regression model
H1 = linear regression model
Based on the output ANOVA obtained the Sig = 0.000 = 0% less than α (5%)
or the value of F = 63.762 more than the F table = F (4; 39; 0.05) = 2.61, then H0
rejected and H1 accepted. Thus is a linear regression model and the resulting
regression model is highly significant.

55
4.2.3.2 t Test
t-test (Student-t Distribution) Aims to determine the trust level of each
independent variable in regression equations or models used in predicting the value
of Y. usually t test is also called coeffisient test.
Hypothesis:
H0: regression coefficients not significant
H1: Significant regression coefficients
On Table 4.15. coefficient (end), can be seen the value of Sig. range is 0.000
- 0.047 or smaller than 0.05, and the value of t ranged between 2.052-8.538 more
than value t table = t (39; 0.05) = 1.686. then H0 rejected or H1 accepted. So the
regression coefficient for independent variable is significant
4.2.3.3 Autocorrelation Test (Durbin Watson Test)
Auto correlation test done to measure whether there is autocorrelation
between variables in different samples. Autocorrelation test with thresholds Durbin
Watson -2 To +2 to determine the presence or absence of residual correlation or auto
correlation of the resulting regression model. Value Durbin Watson generated
through the output of regression analysis can be seen in table. 4.14. model summary
(end), namely 1.891. The values are still within the limits of the value terms Durbin
Watson ie on the interval -2 < Durbin Watson <+2, So it can be concluded that the
resulting regression model does not occur auto correlation.

56
4.2.3.4 Multicollinearity Test
Based on the output Coefficients earned value tolerance in the between 0.646
– 0.901 is less than 1 and value of VIF in the between 1.109 - 1.549 is less than 10. It
means there is no multicollinearity.
4.3 Result of Research
Based on the results of research conducted, some variable determine accuracy
of early cost estimate (Geographical location / Site location, Availability project
information / Documents used in Preparing the estimate, Quality level of the
estimator / estimator Expertise and Size of Project / Scope of project) on the project
construction is valid, to see the results of model testing on the F test, Q test,
autocorelation test and multicollinearity tests.

57
CHAPTER 5
CONCLUSION AND RECOMMENDATION
5.1 Introduction
Early cost estimate are cost estimates prepared in the early stages of planning the
project before the completion of engineering design made, therefore early cost estimates
have an important function as a starting point and a benchmark for project planning and
controlling in the future project stages. Quality early cost estimate can be measured from
its level of accuracy. Early cost estimates are prepared based on limited information and
supporting data, it causes in early cost estimates has the lowest level of accuracy than
any other types of cost estimates.
In this research, researcher want to identifying factors that affect the accuracy of
early cost estimates of construction projects and identifying relationship between the
factors and the accuracy of early cost estimates.
5.2 Conclusion
From the literature review, researcher found 72 factor affecting the accuracy of
early cost estimate. These factors reduce to 54 factors after interview with expert,.
Expert interview process is focused on getting the factors that cannot be obtained from
literature sources and confirmed based on their experience whether these factors are
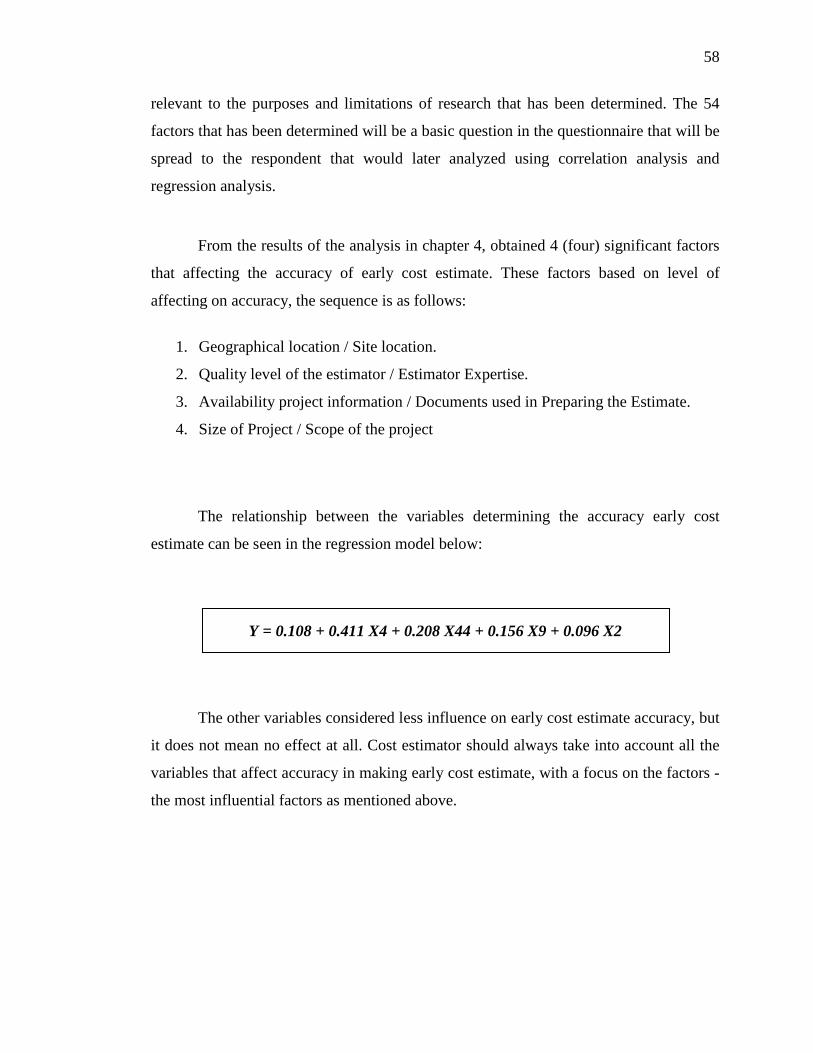
58
relevant to the purposes and limitations of research that has been determined. The 54
factors that has been determined will be a basic question in the questionnaire that will be
spread to the respondent that would later analyzed using correlation analysis and
regression analysis.
From the results of the analysis in chapter 4, obtained 4 (four) significant factors
that affecting the accuracy of early cost estimate. These factors based on level of
affecting on accuracy, the sequence is as follows:
1. Geographical location / Site location.
2. Quality level of the estimator / Estimator Expertise.
3. Availability project information / Documents used in Preparing the Estimate.
4. Size of Project / Scope of the project
The relationship between the variables determining the accuracy early cost
estimate can be seen in the regression model below:
Y = 0.108 + 0.411 X4 + 0.208 X44 + 0.156 X9 + 0.096 X2
The other variables considered less influence on early cost estimate accuracy, but
it does not mean no effect at all. Cost estimator should always take into account all the
variables that affect accuracy in making early cost estimate, with a focus on the factors -
the most influential factors as mentioned above.

59
5.3 Limitation Of Research
Result of this research valid when used to determine early cost estimate at
building-construction project or similar project in Jakarta, Indonesia.
5.4 Recommendation For Future Research
Significant factors resulting from this research can be used as reference for cost
estimator when they prepare an early cost estimate for the next project and that results
can be developed in subsequent research that is for different types of projects or for
other types of cost estimates i.e. analysis of factor affecting the accuracy of early cost
estimate in highway construction project.

59
REFERENCES
AACE International Recommended Practice No. 17R-97. (2009), Cost Estimate
Classification System. AACE Inc.,
AACE International Recommended Practice No. 34R-05. (2008), Basis of Estimate.
AACE Inc.,
AACE International Recommended Practice No. 40R-08. (2008), Contingency
Estimating – General Principles. AACE Inc.,
Aibinu, A. A., and Pasco, T., (2008), The accuracy of pre-tender building cost estimates
in Australia, Construction Management and Economics, Melbourne, Australia.
Ashworth, A and Skitmore, R. M. (1982), Accuracy in Estimating, Occasional paper no.
27, chartered Institute of Building, London
Asiyanto. (2003), Construction Project Cost Management. PT. Pradnya Paramita.
Jakarta,.
David Baccarini. (2004), Accuracy in Estimating Project Cost Construction Contingency
– A Statistical Analysis. RICS Construction and Building Research Conference.
RICS. London,
Iman Soeharto. (1999.), Manajemen Proyek (Dari Konseptual Sampai Operasional), Jilid
1. Edisi Kedua, Erlangga, Jakarta,
Iman Soeharto. (2001), Manajemen Proyek (Dari Konseptual Sampai Operasional),
Jilid 2. Edisi Kedua, Erlangga, Jakarta,.

60
Martin Brook. (2004), Estimating and Tendering for Construction Work. Third Edition,
Elsevier, Amsterdam,.
Morris, M. R. (1990). Improving the accuracy of early cost-estimates for federal
construction projects, Building Research Board, National Research Council,
Washington, D.C.
Oberlender, G. D., et al. (1998a). ‘‘Improving early estimates.’’ Research Summary 131-
1, Construction Industry Institute, Austin, Texas.
Oberlender, G. D., et al. (1998b). ‘‘Improving early estimates—Best practices guide.’’
Implementation Resource 131-2, Construction Industry Institute, Austin, Texas.
Oberlender, G. D., et al. (1998c). ‘‘Improving early estimates source document.’’
Research Rep. 131-11, Construction Industry Institute, Austin, Texas.
Oberlander, G. D., and Trost, S. M. (2001). ‘‘Predicting accuracy of early cost estimates
based on estimate quality.’’ J. Constr. Eng. Manage.
Oberlender. G. D., (2000), Project Management for Engineering and Construction. 2nd
Edition. McGraw-Hill Book Company Inc. New York,
O. Babalola and O.Aladegbaiye. (2006), Determining Appropriate Sum for Building
Projects. RICS Construction and Building Research Conference. RICS. London,
Phillip F. Ostwald. (2001), Construction Cost Analysis and Estimating. Prentice Hall,
New Jersey,.
Richard Fellows and Anita Liu. (2003), Research Methods for Construction. Second
Edition, Blackwell Science Ltd, Oxford, UK,.
Robert L. Peurifoy and Garold D. Oberlender. (2004), Estimating Construction Cost.
Fifth Edition, McGraw-Hill, Boston.

61
Roger Flanagan and George Norman. (1993), Risk Management and Construction.
Blackwell Science Ltd. London UK,.
Skitmore, Martin and Stradling, Steve and Tuohy, Alan and Mkwezalamba, Harry
(1990) “The accuracy of construction price forecasts”. Technical Report,
Department of Surveying, University of Salford.
Skitmore, R. M and Picken, D (2000), The Accuracy of Pre Tender Building Price
Forecast: An Analysis of USA Data, Australian Institute of Quantity Surveyors
refereed Journal 4
Stephen Ogunlana, Antony Thorpe (1991), “The Nature of Estimating Accuracy:
Developing Correct Associations”, Great Britain.
Steven M Trost and Garold D. Oberlander (2003), Predicting Accuracy of Early
Estimate Using Factor Analysis and Multivariate Regression. Journal of
Construction Engineering and Management. ASCE, 2003.
Tarek Hegazy. (2003), Computer-Based Construction in Project Management. Prentice
Hall, New Jersey.
Yean Y. L., and Jina, H. S. B., (2001), “Improving The Accuracy Estimates of Building
of Approximate Projects”, Building Research and Information, Singapore

APPENDIX A
Expert Interview

Research Questionnaire
Y
Accuracy
Influence Factors X
INTRODUCTION
Early cost estimates are cost estimates prepared in the early stages of the project is at feasibility study stage until just before the detailed design completed. Early cost estimates based on data and information is still limited as the initial concept of an outline of the scope of the project work. The existence of the limited available data and information is one of the preliminary cost estimate has lower accuracy compared to other types of cost estimates.
Early cost estimate for the cost estimates made in the first phase of the project cycle, so that early cost estimates are a starting point and a benchmark in determining the steps to be done next, for example in terms of planning and strategy development, determining project funding strategies, filter out projects which are the potential of its business, determines strategy project will be implemented, as a reference for the development of cost estimates and the subsequent engineering design, etc..
In the process of preparing early cost estimate, views of the importance of early estimates as a basis for decision making on the one hand, and on the other side where the accuracy of early cost estimates lower than other types of cost estimates, creating a stark contrast to conditions that are often experienced in the early stages of development conceptual project. That condition underlying author conduct this research, Thus the title of research is : ANALYSIS OF FACTORS AFFECTING THE ACCURACY OF EARLY COST ESTIMATE IN CONSTRUCTION PROJECTS
The quality of cost estimates associated with the accuracy and completeness of its elements. The accuracy of the estimated project cost depend on: nature of project, the level of data and information available, techniques and methods used, ability of the estimator, and other factor considered while preparing the estimate. Relationship accuracy of the supporting elements can be described as follows.

This study aimed to identify factors that influence the accuracy of preliminary cost estimates for construction project will then be analyzed by quantitative methods in order to find the significant factors on the accuracy of preliminary cost estimates. These factors result from the analysis are expected to provide input on matters that need to be prepared, techniques and methods used, the required procedures and other matters related to the process of preliminary cost estimates in order to produce a preliminary cost estimate is accurate.
Sincerely, Researcher: Supervisor: Dodi Ardianto, ST Assoc. Prof. DR. Razali Abdul Hamid email: [email protected]

DATA OF EXPERT
( .............................. )
1. Name :
2. Company :
3. Profession / Department :
4. Work Experience : Year
5. Project Name :
6. Project Locat ion :
7. Year Project Completed :
COMMENTS AND SUGGESTIONS
Jakarta, / / 2011

Questionnaire Instructions
1. Filling this questionnaire based on your experiences and perceptions.
2. Filling the questionnaire was done by answering the question: "Do You Agree
Variables Below Affecting Accuracy of Early Cost Estimate?"
3. Optional answers were: YES or NO
4. Filling an answer by providing the sign of [] In the column provided.
5. When there are other things that need to be added, please enter the last row in the table
"Do You Agree Variables Below Affecting Accuracy of Early Cost Estimate?"
I NATURE OF THE PROJECT
Yes No
1. Type of the project
2. Size of project / Scope of project
3. Complexity of project
4. Other project characteristics
5. Geographical location / Site location
6. The contract procurement system
7. The prevailing economic climate
Other factors that need to be added
II THE LEVEL OF DATA AND INFORMATION AVAILABLE
Yes No
8. Completeness of cost information
9. Quality of information
10. Accuracy and reliability of cost information
11. Applicability of cost information
12. Availability Project information/Documents used in preparing the estimate

13. Capacities of project
14. Time allowed for preparing the estimate
15. Technology; Method of construction
16. Processes project
17. Piping & Instrumentation Diagrams
18. Amount of special work likely production time
19. Project design criteria
20. Complexity of design and construction
21. Utility resources and supply conditions
22. Heat and material balances
23. Mechanical equipment list
24. Lead time for delivery of materials
25. Project Schedule
26. The form of procurement and contractual agreement
27. Project strategy
28. The extent of completion of pre-contract decision
29. Frequency of construction variations
30. Client’s financial situation
31. Owner’s cost
32. Purpose and intended use of estimate
33. Owner’s experience level
34. Engineer/Designer’s experience level
35. Environmental assessment and workforce
36. The type of structure
Other factors that need to be added

III Techniques and Methods Used
Yes No
37. Alignment of estimate methodology
38. Is the estimate work process formally define and followed?
39. Formal structure to categorized and prepare the estimate
40. Utilization of checklist to ensure completeness and technical basis
41. Standard procedure to update cost data of project
42. Documentation of information used in preparing the estimate
43. Involvement of other resources in preparing the estimates
44. Level of involvement of the project manager
45. Level of team integration and alignment
46. Review and acceptance of estimate by appropriate parties
47. Attitude/culture forward changes
48. Method used to determine contingency
49. the conference estimate,
50. comparison estimate,
51. graphical relationships,
52. unit techniques,
53. functional approach,
54. resource estimate
55. factor estimate
56 exponent estimate
Other factors that need to be added

IV ABILITY OF ESTIMATOR
Yes No
57. Estimator expertise
58. Relevant experience of the estimating team
59. Quality level of Estimator
60. Attributes of Estimator
61 Acquisition and application of expertise
Other factors that need to be added
V OTHER FACTOR CONSIDERED WHILE PREPARING THE ESTIMATE
Yes No
62. Impact of project type
63. Impact of contract type
64. Impact of project schedule
65. Impact of governmental requirements / regulation
66. Work force
67. Labour productivity
68. Tax and insurance
69. Money factors
70. Bidding climate
71. The nature of the competition / Bidding Competitiveness
72. Logistic for engineering and constructions
Other factors that need to be added

APPENDIX B
Questionnaire

Research Questionnaire
Y
Accuracy
Influence Factors X
INTRODUCTION
Early cost estimates are cost estimates prepared in the early stages of the project is at feasibility study stage until just before the detailed design completed. Early cost estimates based on data and information is still limited as the initial concept of an outline of the scope of the project work. The existence of the limited available data and information is one of the preliminary cost estimate has lower accuracy compared to other types of cost estimates.
Early cost estimate for the cost estimates made in the first phase of the project cycle, so that early cost estimates are a starting point and a benchmark in determining the steps to be done next, for example in terms of planning and strategy development, determining project funding strategies, filter out projects which are the potential of its business, determines strategy project will be implemented, as a reference for the development of cost estimates and the subsequent engineering design, etc..
In the process of preparing early cost estimate, views of the importance of early estimates as a basis for decision making on the one hand, and on the other side where the accuracy of early cost estimates lower than other types of cost estimates, creating a stark contrast to conditions that are often experienced in the early stages of development conceptual project. That condition underlying author conduct this research, Thus the title of research is : ANALYSIS OF FACTORS AFFECTING THE ACCURACY OF EARLY COST ESTIMATE IN CONSTRUCTION PROJECTS
The quality of cost estimates associated with the accuracy and completeness of its elements. The accuracy of the estimated project cost depend on: nature of project, the level of data and information available, techniques and methods used, ability of the estimator, and other factor considered while preparing the estimate. Relationship accuracy of the supporting elements can be described as follows.

This study aimed to identify factors that influence the accuracy of preliminary cost estimates for construction project will then be analyzed by quantitative methods in order to find the significant factors on the accuracy of preliminary cost estimates. These factors result from the analysis are expected to provide input on matters that need to be prepared, techniques and methods used, the required procedures and other matters related to the process of preliminary cost estimates in order to produce a preliminary cost estimate is accurate.
Sincerely, Researcher: Supervisor: Dodi Ardianto, ST Assoc. Prof. DR. Razali Abdul Hamid email: [email protected]

RESPONDENT DATA & REFERENCE PROJECT
( .............................. )
1. Respondent Name :
2. Company Name :
3. Profession / Department :
4. Work Experience : Years
5. Project Name :
6. Project Locat ion :
7. Year Project Completed :
COMMENTS AND SUGGESTIONS
Jakarta, / / 2011
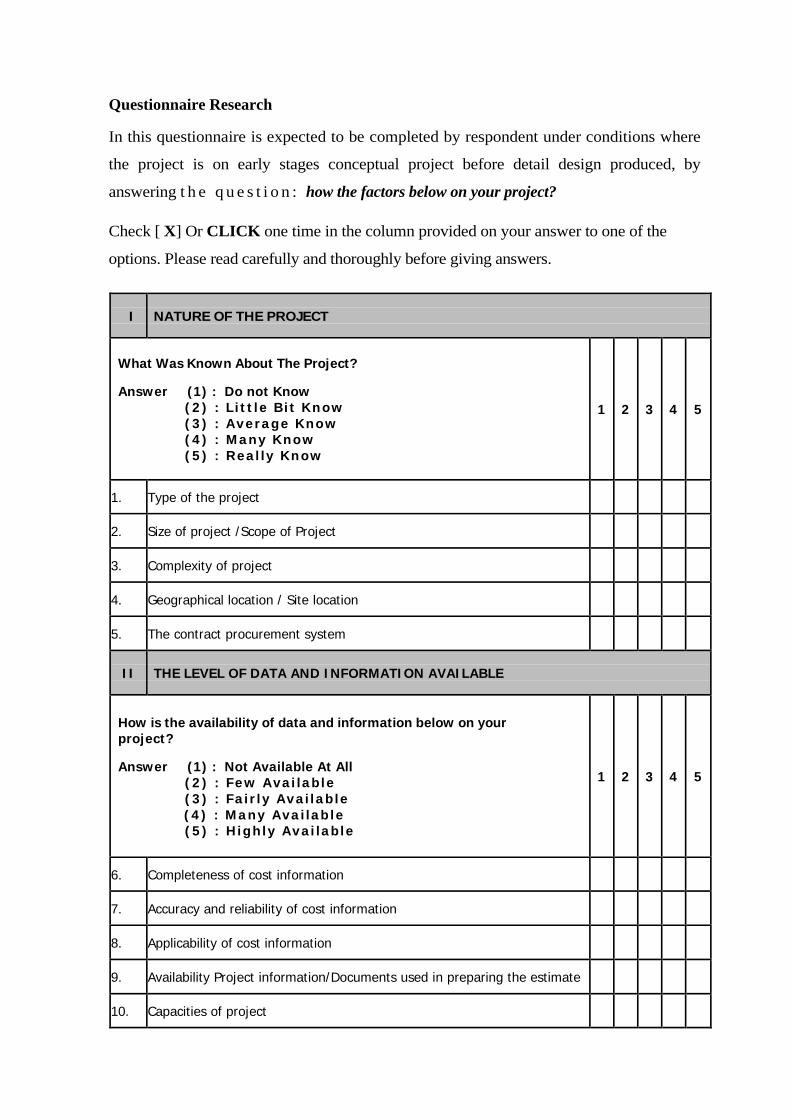
Questionnaire Research
In this questionnaire is expected to be completed by respondent under conditions where
the project is on early stages conceptual project before detail design produced, by
answering t h e q u e s t i o n : how the factors below on your project?
Check [ X] Or CLICK one time in the column provided on your answer to one of the
options. Please read carefully and thoroughly before giving answers.
I NATURE OF THE PROJECT
What Was Known About The Project?
Answer (1) : Do not Know (2) : Little Bit Know (3) : Average Know (4) : Many Know (5) : Really Know
1 2 3 4 5
1. Type of the project
2. Size of project /Scope of Project
3. Complexity of project
4. Geographical location / Site location
5. The contract procurement system
II THE LEVEL OF DATA AND INFORMATION AVAILABLE
How is the availability of data and information below on your project?
Answer (1) : Not Available At All (2) : Few Available (3) : Fairly Available
(4) : Many Available (5) : Highly Available
1 2 3 4 5
6. Completeness of cost information
7. Accuracy and reliability of cost information
8. Applicability of cost information
9. Availability Project information/Documents used in preparing the estimate
10. Capacities of project

11. Time allowed for preparing the estimate
12. Technology; Method of construction
13. Processes project
14. Project design criteria
15. Complexity of design and construction
16. Utility resources and supply conditions
17. Lead time for delivery of materials
18. Project Schedule
19. Project strategy
20. Frequency of construction variations
21. Client’s financial situation
22. Owner’s cost
23. Owner’s experience level
24. Engineer/Designer’s experience level
25. The type of structure
III Techniques and Methods Used
How the use of the techniques and methods of early cost estimates on your project?
Answer (1) : Not Used At All (2) : Sl ightly Used (3) : Used
(4) : Often Used (5) : Always Used
1 2 3 4 5
26. Alignment of estimate methodology with available project information
27. Is the estimate work process formally define and followed?
28. Formal structure to categorized and prepare the estimate
29. Utilization of checklist to ensure completeness and technical basis
30. Standard procedure to update cost data of project
31. Documentation of information used in preparing the estimate

32. Involvement of other resources in preparing the estimates
33. Level of involvement of the project manager
34. Level of team integration and alignment
35. Review and acceptance of estimate by appropriate parties
36. Attitude/culture forward changes
37. Method used to determine contingency
38. comparison estimate,
39. unit techniques,
40. functional approach,
41. resource estimate
42. factor estimate
IV ABILITY OF ESTIMATOR
How the skills and experience of estimator in your project?
Answer (1) : Very Bad (2) : Bad (3) : Average (4) : Good (5) : Very Good
1 2 3 4 5
43. Relevant experience of the estimating team
44. Quality level of Estimator / Estimator Expertise
45. Attributes of Estimator
46 Acquisition and application of expertise

V OTHER FACTOR CONSIDERED WHILE PREPARING THE ESTIMATE
How the factors below related to the preparation of cost estimates on your project?
Answer (1) : Does not affect (2) : Little bit affect (3) : Affect (4) : Much Affect (5) : Very Affect
1 2 3 4 5
47. Impact of governmental requirements / regulation
48. Work force
49. Labour productivity
50. Tax and insurance
51. Money factors (currency, inflation, etc)
52. The prevailing economic climate
53. The nature of the competition / Bidding Competitiveness
54. Logistic for engineering and constructions

Questionnaire part II:
1 2 3 4 5
VI How big is the accuracy of preliminary cost estimates generated in your project?
(Put a [X] Or CLICK one time in the column provided on one of your answer choices)
Charging indicators: 1. Criteria the accuracy of preliminary cost estimates:
Scale Quantitative Assessment Level Accuracy
1 - 50% ≤ Y ≤ - 30% or + 50% ≤ Y ≤ + 100% Inaccurate
2 - 20% ≤ Y ≤ - 10 % or + 20% ≤ Y ≤ + 50% Less accurate
3 -10 % ≤ Y ≤ - 5 % or +10% ≤ Y ≤ + 20% Fairly accurate
4 -5 % ≤ Y ≤ - 3 % or +5 % ≤ Y ≤ + 10% Accurate
5 -3 % ≤ Y ≤ + 5% Very Accurate
2. Calculating the accuracy of preliminary cost estimates can be measured by the formula:
Br - Be Y = ----------------- x 100%
Be
Where: Y = The accuracy of the preliminary project cost estimate Br = Actual Cost Be = Cost Estimates

APPENDIX C
F Table and t Table

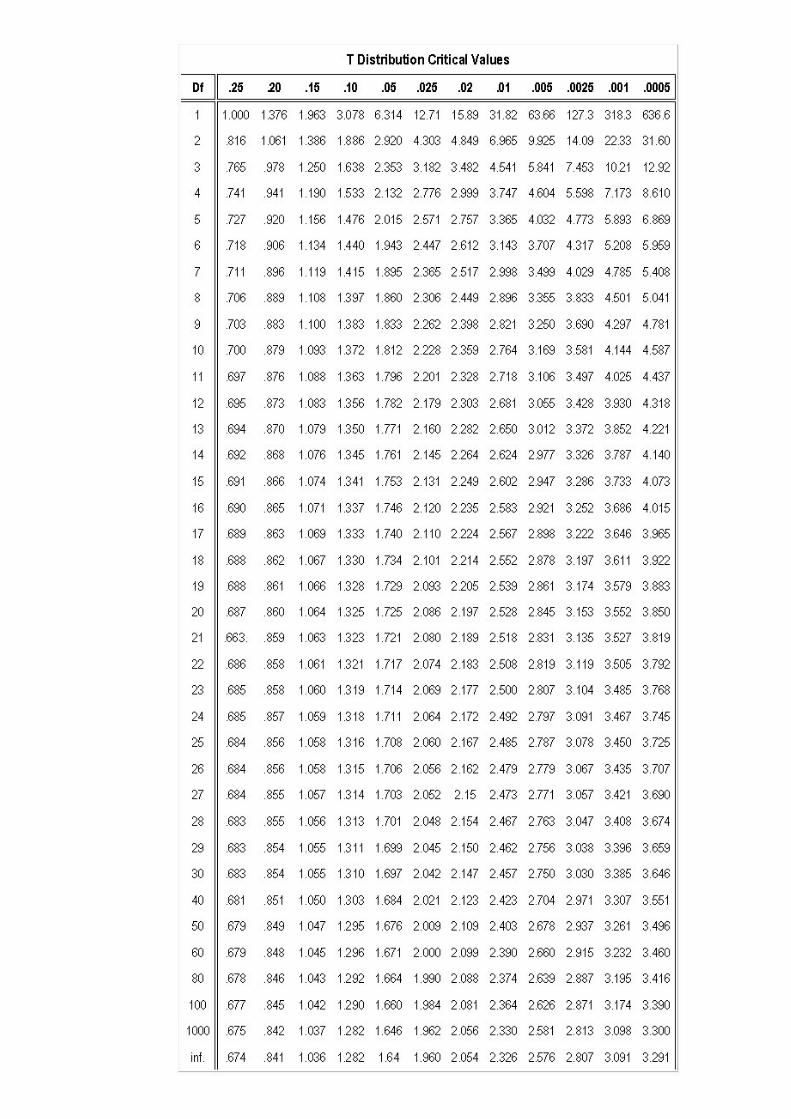

APPENDIX D
Data Questionnaire

t + t a * E t tf N 6 o rf t rt t t d f
h n d + h + * rf n tl. f 6 q
q * t N lf o d q t
6 !t t tf it * rf t tf t t $
h e a o a tt rt t * lf t q + t h b t !t q tl' \t
t rf tl + * tf tf tl !t !t !r 6 t N rt t tl-
o 6 h N 6 f 6 lf + c !t q N n q * t t t n h h
o d 6 6 rt rf n D n N t t t b f f rf t * t
* N t 6 o o e o t {' !f a d f n !f tf rf
t N * t rl tf s !i N !. t t N g
h * t + o d \t o N
6 t n tt { q b 6 lf a q * c o q h n
4 o * rf t t * t tf q o * o t lf !r
o t t n !l o !t rf tt g t t ! d o 6 o
o * C * n t tf t t n d t \t h n N + 6 tr n h 6 D
o d h 6 !r 6 h o N o rf o rf N
6 I rf 6 rt' + t d + rt 6 N h + h tl
D q + !t N tf rf !f * t q tl N
6 r rf rl f h + n !f !f tl l0. rf <l tl + rt C f if
s t + t !t !f rt t t
t t o 4 t t tf 6 6 h 6 t tl tt q 6 b g fl rf
6 ri d N * r? tf !t tl d * t t ll t q q o t q t
h d t t rt d t f N lf
rl t t N rt !f { o v q rr f rr lf
lf { tl !t !f d t $ s a rf q rf t {- rf t
x x ox ex 6x 3x x !x OI
€x x x
6x x
5x
€x x
ox
Ox
ax x
ilx
6x x
5x
Ix x
ox
EE5o8.
HpcB*.6nt
Eb
aEobE5E.q
5gso
I!Ep
.t
E,c
E
Eggd
EcoF
caEEcgbfl2{,E
cqEE!aoog5EEa
9
5E&.sttobgvv6-I
cEBIo€ocEeog
Ef
&aLa
Ec
ee;Iag3-a6
g?o
I'a
gE
$2ocGa*.sa;IiigE
€gaB
!sREs
UE'o
*g
E
c.gr
Es6
cE5
o
Ea
sobE
I
Eo
6
E
oJ
Ea
t$g3
la-!!gfl
b.3tsgv
E
oEafiTI
EfisE'
I-q{5titbco
BR6tF
ee
ficEt!c-!!
ItcF
EnJ
Io{=.t
.9e6E8.5
:E:IcE
p:JEBIa€
IEellopEsE
E
o6a€E
aE
Eb
e5
a5Eoc
5
Eegbt:3geEg
gqE
EoEEeE.E
E6$IagJt35Hi6F6
oqt
dooc/6talo

rl a tf t * N tf rl $ * o 6 6 + rf N !r
t t h o o t 6 6 t 6 b r? 6 6 o ? 6 q +
6 f !f rt o q
6 tl 6 tt tf t t * o lf t t ! q t
0 n !t t h a b 6 t f !f t t q t e q b q h t t N t
m t { t lf ? t * rf t q tl q tr t G t tf t rt
h h I f c t t tt q + rf rl * b rt I \l q h f rf
* t q 6 6 f s !t o f G N !t s rr b 6 + d !l
* !t !t ? 4 tf + rf I t tt + 6 6 6 o 6 n 6
q tf !t \t I rf !f s rf !t f + o + 6 6 o h
? ? t * t !
6 n n b n E t n tt t + c + * n c 6 t b
!t a h * t tf tf lf t * N d !t o * !r
o $ 6 * t rt rf * rl t
6 ro 6 t D rl h t 6 + b 6 h n h n N 6 n 6 h b t !'.
6 6 n * tt D t h tt lf
rf rr t lr r| rf tf rl tt q tt t t o a o rt h a h b ! h q 6 t
o * rt 6 t * t t !t rf rf
C rl + + t q ? t { + t + t t t
o o rt t rf rl N t o *6 6 I f b tt !t t q !f o t n + tl rf
q t e t s * * tf !F g q q h q N
q rf rf s t 6 t $ t t N + t rt +
6 o t q o !f t q
t D n !f t t * * * q rl 6 t a b b h
ox
6ox 6xd6x
o6x II
aox3ox 6x
E* OoIoix ax
N!IoI
IIx
ttx5ax Ix
oIxO?x
obx 5x 5x 6x Eta
g
aECE!E
ocabgc
sg!IEb66
E6doa€nIgEtag5E8h.Ect
Agags$€EtEeeb_o
-gct!
E!3€o
8.Lc
8dIfts
Es
5acesa6
€tuIE.E
E
&
PcIE
EpBc€cbn
€aaEo
aDcE
BboE8.
E
i.c
P
EiIg
J
b
E
pocaIeE
Eo
EI
a5
cefrocE{Eo
g.gg-x=
Ih
EE
gE!
P
$
gIE
fi
EggEsoIoI5E&5c-3
t€8.Ueesu_sIaaB9gg
bE6ogEE9
oe8.
o
ssdocoE
6I
IE!aFasc-sEnE
g
blE
gE
atE
.8q
EEct;ct
l,oEoG
;L
IIo:
gE.E655
=B
!tt
Ici3.EIc€6
8.
60fBP5
t
c
Ea5
Ec
I6coesq
uF
=hbIlEuoEtf
HaTF
oqt
tro6o3
cl6o

6 !t 4 ir o t c tf tl. + $ c f f * t q
n tf n c it tl N o o {' lf E o n a
a rf n t 6 !l tt t tt d m t tf o d N !t ll 6 rt
t t t b t t !t 6 t d t n rt h n 6 h a o t o rr 6 n t q o q
6 tr o 6 o !r o * q h o o !f tl d !t !l + n rf
a o 6 t d !a * o if rl o + lr N !r t +
t * b o N n * t t !t !f o N rt if
b !f t rt tf tr o rf t + t !r rl 6 o h tf + n
n * o h tt rf fr t f rt q t rf a t !r f t n $ *
* o !r $ !l rt rf rf ll t o q q ! t3 t $
tf tf n rt f t * $ + t rt ? t t o ! h q f t
b a 6 N !f lf rt !a * t tl q f ? c h b 4
6 n a o s rl h n + t rt tf q t *h tf t 6 rt * 6 d o rf h h t tl
h q n s s !f * !f + + rf t c ? * c b tf rt t G b
t N h a 6 e n rf o ? o tt rl n o t rf
6 $ 6 + f * !t t rl ? o q 6 n + v a h 6 o
6 if n n !t t if o t d 6 rt + b b 6 t o
6 t 6 6 6 It tf rf t rt + t + * n h *6 d tt f !t c tf d n * 6 rl t t t *q o rt q n d t 6 it 6 !f 6 b h rf E *
lf 6 d !f + tf {- t h t
rt t n 6 t !} !t o t rt h 6 t n t 6 t t
a b N n t 6 N t b N 6 e 6 D 6 rf !f h h 4 t b
t b n h !f N 6 { q * n N !t' 6 * N 6 + t t N f
x Rx I ax hx 3x x Ox Oxox x x
ox
ex
5x
ax x
ox
Ox
oflx xd
xtx
Ix
-x Ix x
Gx
aE€o8.>
sats
bsa
tEts
6
5cbbEE
-6
.Eg6
6
Iteea.1
Ecs
I{5tdto
E
co6Es
Etspcafi
oEe;oogtiE
Bp
IeEC
goI6II
gEs5oCGs.g.
.C
n3acs3f;Baee.Ete
D
E
lJ*bB
&A
.cE
E6EagoeEte6€
tEgEbEtE
';B
3
$ab,
s
E
Ic.gItItP
c.eE
6
E-Eba5
.q
EE8
Et
5Pop
g
l2!cetbE
ee3Eal
!r5B.lltp
EEgE
oE3
EItIts
F
.g
E
EE
c
d6gP,e
nI!!Io
I,l
noE8.a
{.rtIE6c
gaIttbLbF
EEE€Epo5g
6E
aE€EceBo
Ec
Btoe€c*E
EeoE
IceI
gE
so6eaI
oaEsscEtE.o
od
o6ocv6tGIa
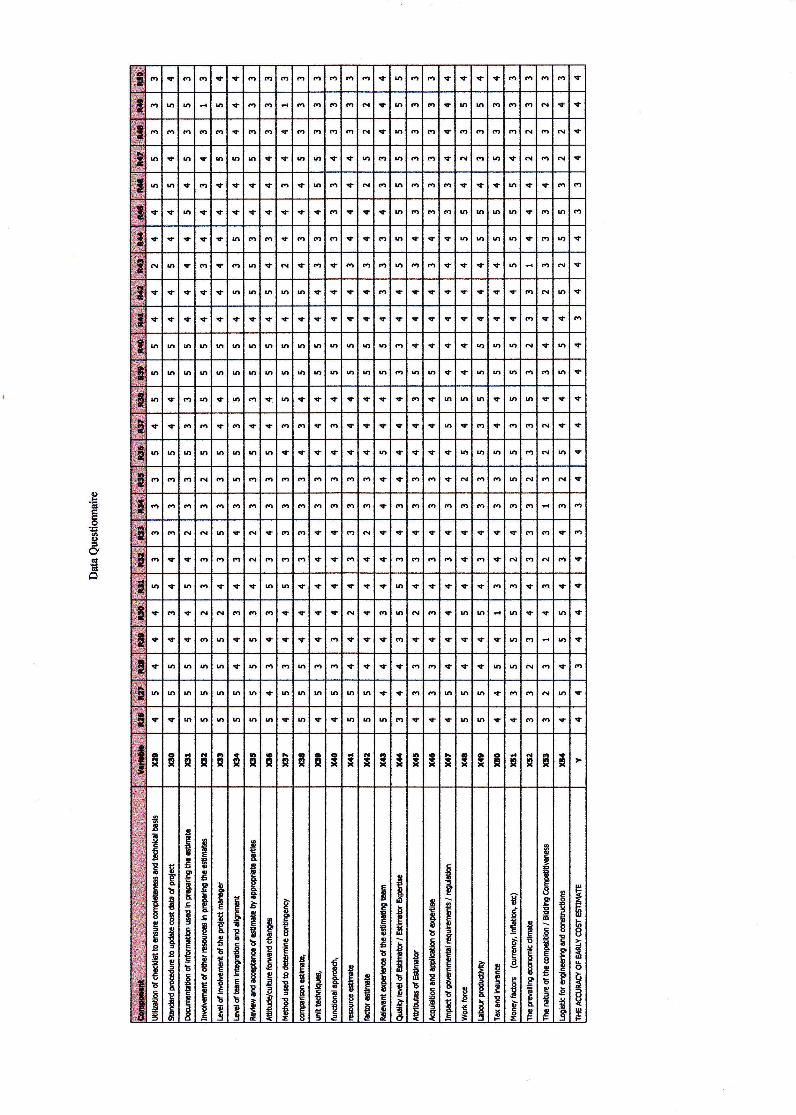
* rt + o g 6 o tf lf rl rr. m t
h h h + o o o t 6 c 6 6 d t f
o 0 q !f !t 6 ? o N s
6 f 6 t a 6 h t t 6 6 t t 6 6 o * o b t 3
n h rt rl tf !t tf t 6 ll N o o !r !t t h t !f
rt t b tf * t !f tt !t rf t ? * rl n o o n 6 h n $ n
!t $ $ !t !l 6 t t t h tf tr rt h 6 o b c o 6
6 rt rF h !f t I 6 ! I rr !f 6 t
rc t rt !? t h h h 6 t t * + s + t t s t ! * n *
g t t l' !r tt il + ? rt t q t t t| t s rf q * t * * t ra
6 o a 6 h 6 n n 6 h b 6 I rt ll rt @ h rt h tt
6 n 6 6 6 n b a 6 n b 0 6 6 rf + 6 b ti
h rl 6 f t rr rt t + tt rf rf rt e h h t n 4 v tt t
q t !l * lr t i + !t c t 6 rl !t t t
h 6 6 n n n c ? t rt t 6 ? rt t * h o h n h t
o n rt rf rt o @ o N t
a o o o o t o o o o o
N 6 rf d + o t * o * t f !f t * t + e rt
!l $ F o rf tr t + rf * N rl
h t 6 * * t 6 n tf rl !t lf t + n r3 rf rf tF t t t t
if o !t o rt rf + { * 6 tt a h n rr tf a t
+ t lf h * a rt tt * tt rt + rf tt t tf rt !l * 6 D +
+ h 6 6 6 t h 6 o 6 6 t + + t rt t tl a 6 t'
n o b h 6 h b tf 6 b a b n f t o 6 b o * b t
t I h h 6 D * !' t 6 h !t t lts h rf t + !f
Ox
oox 0xdox 6I ax
t0x36x ax tx OI o
x Ix(x
oex Ix DIxaIx x
Gaxa!x
osx -x (5x
oDx Ex
I.8icEEsa
TgE.
be
5s
s6tse
s
g6b.tsa€aIBtag
8tEtA
E3o5
f,po.E
EtEE
€bE.g
c!
!EBoo5
$oc
Iil?
€o
Ec9c
ctgE5b
Ec6c
=o
t
Ec
gc
FcEgbt
I€eAl9
F
b.cE
soacItIIc
aE
gcgPteg35b33
b5PEoJ
t3co
EJ
Et
.ceao
E*.F
1'scE
t.
tE5coE
cEEoPt
$
EEb
E!azsJ
goooE&5
B
€8.u
EsaEEaubc.cE;c
b
fiubI5EI
e€8.6o
Es
Ec
tE5I
E
raEsc5gE
EE
3oEIJaE
se*=
bEEad
=.8il
ge5.gc
p
Ic
dea
pd
EIo
EEIEctgBh.o!F
5
3.EIc6E
*.EIo5bsto€
9E€o€c
fgEoegfiE
uF
5Eu
bU-tfiIoda-oouE
o6l
o6ooslslo

APPENDIX E
Summary Respondent

ooo'F{
otrooq)
oo<A()
onUa
AM(\tri
h()(l)u0(D
&o
EGI0gDql
'.o
dE
6aqt-0,rlql6lo
fAc6l
o(l)
oM(t)
cozo0
€!l)o
Aaaoclo
J.ll)(nbl)trE(D(,I
X(tkad=cttrGIF9cghc)-torSElsg€SE*E11)vAM
o
Gle(Dn
oa('l\o
orloF
GGI
(DJ4|l)Frg(t(D
(D
EoM(l)
(D
zb0
€(D(,GItro0
G!sEoa.
GI(A|t)
o€
cl()
(D
O
v,.och
z
.E'clo&ot*JGi
o
s6lll)boclF€tro('to'; .o
E.EaFc.v.eEC)tr?EAg8o rl)L)d
&prnb!
rllll)()art
Jll)eoMclo,0,c^ql
c.l.hll)()ll)€ac)dc()EGI(,qlcqlc)
€lD
ottr€ozov
€{)
'tr
oA&Aoo{Db0alad
oc)
U)
oc)
€GIF
GI6!oanal
vgt{
6l
cl.54d
(Dcotro
'oFI
GI
GI
clon)trll,L)
Ulo
ti
Frr7Iri
MrL
odo.oclFl6irtclGI
cla€oahclAg€F4L. l&g€&.<bo :/€A(I)d()ri
aFa
Ao{ot
€oo
o|l)'a
ll)ooEall.}&ctq,b0q)
cl
{)M
o(D'dA(D
Eaoo(l)A4)o
anEc)a
6l
oo
6
b0
cl.otr|l)
A.
J'(D
vhoat)trGI
dBcl
(D3dGI
tri(l
b0
GI,.o
oO.
GI
CdJ4Gt
vocltr
*tsotrtC).tt!d
dodo.{.)a(l
cl \o € lat o o\ c.l o rr.) rn 6 ralCI o\ o o ct\ ra') r- rtr { c.t(\l ra € (a
L)
L.ocl
IatI] U
*.(l)btstrcl
()
a tr{ U O{ Or A O
oclEorqtt)ot)
toql
TA
EIttoU
*.oGIts
(h14(aoO
l.oGIc6FI
CAo()
obT(n
GI
zo
(n Oi
oGl
aht1ao() O{
LoGI
(t)rd
od
CA
rqz a()
oGI
a14ct)ofJ
o6ltra
14IAo
f_)
A{AFei
uFtr{
M
t-P{
p{Atpi
14
F-A
)4zot-O{
9rAt-Ai
M
t-A
vFFr
M
l*Fi
€GI
t4G'
€zF.Fr
M
FA
14
FFr
qlEfrMdbl
Fo.
o{trd
tDFAo.o5oFO{
tr{tr{Fo{
AAFO{
AAFA
Atrr
F-O{
Ao.3O{
AP{
F-rOi
14
FOr
M
FA
M
FOr
th(\!
dlint*A
€
clGI
ECA
(l*.
Eo5oCIo(r)o
-v6lraqt
ooEalA>r(l
oGt
€slt
lt)
>r"octo€cl
c(0
a
GI
GIclcl
rt,
Motr
O{
oo
'E'cltra
cl(n
v)(!aD
u)
6lpa(itql
Eo
oBo.o
oo
u(lE(lN*{aho
B(D
Adc,tro
14
ql&
CAlDtrclArq&
cl
oz.Bc&
aclo66d
g3o&t
G'
clcl&dta"ooa
(!Eat
rn
M
€cl'if{
trrE
(g
dN
o(rt
u)trGI
o
€-0)
ra(q
ct
E
GI
.o,.o
da
dd
cla,tqltr
6t co !+ lrl \0 r- oa o\ o ol tl \f rat \o cr € o\ (>6l GT
GIc\I
c.)c{ $(\l
rc.l
go)€goA.ao)&q-.okc(l
a

o
'ot-o
.Ydq
clt€aF.I,o3cl€qlocl6l<ia
(l)v,tro.$(D
Fot)
io(D
o
GI
.54ct&6lqlE
{l)FrcclL
trc)
(D
Mb0g'rtoo
z;)gclL
o)
C)
Mb0cEq)()
(ttG
qltr
FA
qt(D
Ao0g€lDo
c)
trlll)Uoe€aoclo
(Atslt)Bortl('GI
frisl
6lg6l
o.trItooaFtuo()
!Eoso6lL
FA
o[gE
CItr5
b0
14
qt
GI
ocl.v(Doaortr{o
trh0u)|l'Aa0
*rlDll,
a0
F]€(D
oI
othch!t)traoL)c)ttooE
a0
€tqE
bo
F]
ooaaliGIEoolDaoc
qioottIoC)C)h
ac)o'atA
oBoFb{GI
BGI
C)
u0clEo)islGI€(AdIt)
J'6)
trr
dGI
-t(l)F{cql'octGI-vb0tr(l)
OrJ'c)
o*.o-
clBqt
'ct(t)clb0Lct5(l)
vclb0a0
F-
G!
&
oo'5'AatrlU14(.)
&vtrc
Ja
o tn d, ra.t a/t € r 6 in o g\ rat \o t\ r 6t \o t-. oo o\ oc.t t- c{
No\
Or
oGI
.A{l)
ao()
ocltraoaoU tr{
oqt
tAr46oU
oGt
CA
F].AoU
o(lEaF].AoL)
o(l
.Et)
rJ1
.AoO gr
o(tc.A
rr1
aoU
l.o6I
t)14 U tri
*{oqtts6r{
oGIE(hrrl
oGI
trC6
rqaho(J
ocltraD
rd
oclgcn
rll
oalE(rtr4
=AU a"
tr(l)r36(D
F]
q!(,tr
A Pr
A
,yo
A o{
pq
octGIgEGt
C)
o.vo"trt"o(l)Eql
F-l
Fp{
o()13dtr{l-tr{
oo.(,GIAFO.
cl"Elt)ooqlCI
tr'l
o(D
A
ttr{
a|Dcl
M
t-Fr
M
i-A{
aa6t
6
FA
t-p{
G'b((l
MGI
E
FOr
6thGI
MalL€
F"A
GI
hclgGIli'tttrt-Pi
GI
GIvclcl
(l
dvql
GI
o
C)(uF
cl
G'MGI
d:=
F.A
qctat
qtc)oGIaFor
Ict(t)&GI
Jd
FO.
clt,GI
MalJ6ltn:F{or
€s€Eu4t(D€o\\o
o().q()
GI
$
€t{g{
al
GIM
E
hA
rqFI*A
\4
FO{F
F-A
5t-Oi
ctvt
-!d
(l)2
cluto&Cg
GI
c)aa
o(.)
vEGIg
cl&
G,(A{)
Atr
A.
cGI0
oIA
hl
b{(d
Ho(5
.6
oEG!trGI/,
oct
c)
o
oJ!cl
a'r3
Fo
&c)
dat
a
ahCI
lDlr"u
hlD:d
p{rdotu
o
oad
brg
ch
b0
63(A
crlJGI
P{
Ell)A
oFo5GI
oE'(trq
Eql
tr
z
EctN&
&
oFo
5
It)
4
oEc);ll}oaos!o
oou)o(Dd,
6t
.E6l
m
o(hoJctLFt*iFGI€rd
ocl
a(no
oll)ao€Pro(l)a
\oot
r-(\l €t\ o6l
otft afi
olcq
tltq $
aarr1af]
\oao
t-cn
€ca
o\crl
or<f .+ (\l* ctl:f
.rf:f inr+ \o
=f,f-t oo$ o\
$or
gc)€sloO.d)(l)&t4-aohdtrtr!
a