Accuracy and Security in Voting Systems - princeton.edu · Accuracy and Security in Voting ... They...
43
Accuracy and Security in Voting Systems Henry E. Brady Professor of Political Science and Public Policy Iris Hui Department of Political Science University of California, Berkeley May 1, 2008 Note: This paper will appear in the forthcoming volume, Mobilizing Democracy: A Comparative Perspective on Institutional Barriers and Political Obstacles, James Johnson, Jack Knight, Margaret Levi and Susan Stokes (editors), Russell Sage Publications, New York. Disclosure and Acknowledgements: The senior author was involved as a consultant in several court cases mentioned in this paper, and he also so testified before the Carter-Baker Commission on these issues. Our thanks to James Dickson, Jim Johnson, Jan Leighley, Margaret Levi, Deborah Markowitz, Ted Selker, Regina Smyth, Daniel Tokaji, David Wagner, and the participants in “Practicing Democracy” on April 27, 2007 at the Ash Institute at Harvard University, and two anonymous referees for very helpful comments.
Transcript of Accuracy and Security in Voting Systems - princeton.edu · Accuracy and Security in Voting ... They...
Accuracy and Security in Voting Systems
Henry E. Brady
Professor of Political Science and Public Policy
Iris Hui
Department of Political Science
University of California, Berkeley
May 1, 2008
Note: This paper will appear in the forthcoming volume, Mobilizing Democracy: A Comparative Perspective on Institutional Barriers and Political Obstacles, James Johnson, Jack Knight, Margaret Levi and Susan Stokes (editors), Russell Sage Publications, New York. Disclosure and Acknowledgements: The senior author was involved as a consultant in several court cases mentioned in this paper, and he also so testified before the Carter-Baker Commission on these issues. Our thanks to James Dickson, Jim Johnson, Jan Leighley, Margaret Levi, Deborah Markowitz, Ted Selker, Regina Smyth, Daniel Tokaji, David Wagner, and the participants in “Practicing Democracy” on April 27, 2007 at the Ash Institute at Harvard University, and two anonymous referees for very helpful comments.
I. Introduction
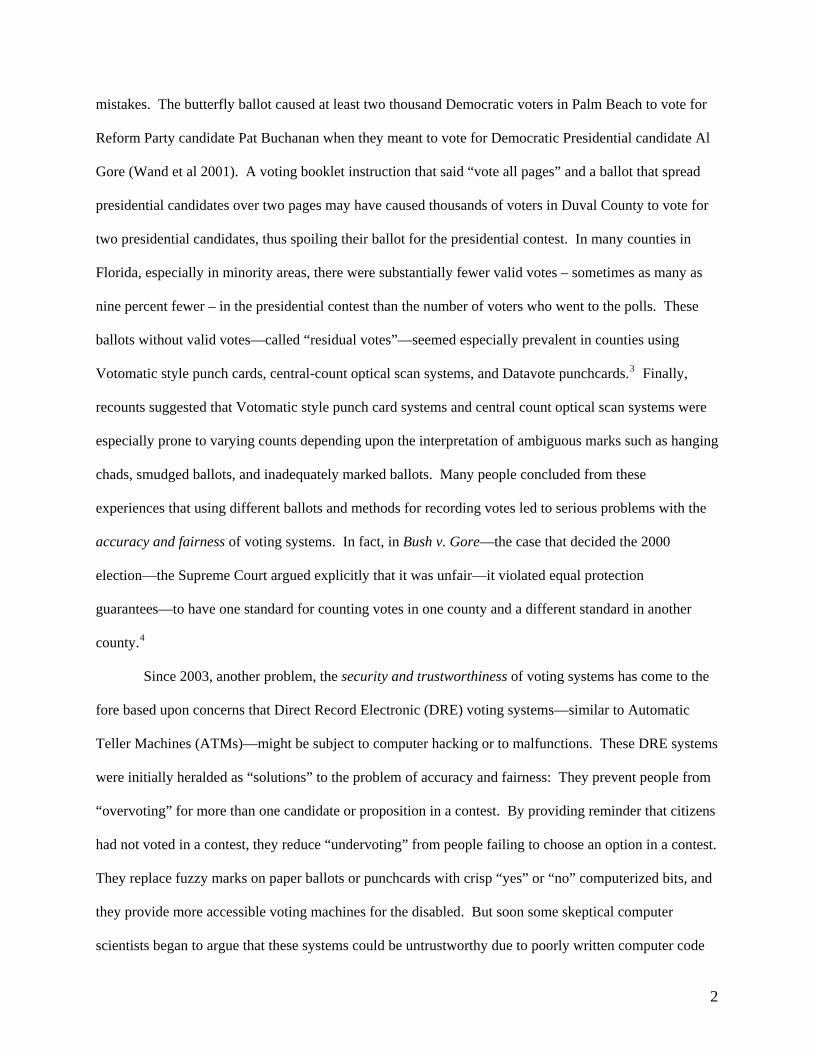
“Trust in Paper” proclaims the May 5 2007 editorial in the New York Times congratulating Florida for
getting rid of electronic voting machines which last year “somehow lost 18,000 votes” in Sarasota
County. “The new law will eliminate touch-screen voting in favor of the more trustworthy optical-
scanning system. Unlike touch screens, optical-scanning machines are based on paper.” So “by next
summer Floridians should be a lot more confident that whenever they vote, their votes will finally be
counted correctly.” (New York Times, May 5, 2007, page A26).
Reality is more complicated than this rhetoric suggests. Many of the 18,000 votes that were lost
in Sarasota Florida were probably lost because of poor ballot design (Frisina et al 2007; Mebane & Dill
2007) – a problem that could have (and has) occurred with paper ballots—most famously with the
“butterfly ballot” in Palm Beach County Florida—as well as with electronic systems. And while paper
ballots may help with recounts when there are fears that computers could be programmed poorly or
maliciously, paper trails do nothing to protect voters from systems that confuse them or fail to record
votes in the first place.
There are two basic challenges for voting machines: accurately recording people’s votes and
keeping them secure once they have been cast by the voter. Both are equally important, but attention has
shifted since 2000 from accuracy to security, with the result that at least half the problem is being papered
over with simplistic rhetoric. Moreover efforts to improve voting systems have been stymied by
inadequate legislation, the limitations of legal action, and the sclerosis of American federalism. We
describe the sad course of voting reform1, and we provide evidence showing that accuracy must be taken
at least as seriously as security. The next chapter in this book by Charles Stewart provides a
comprehensive overview of how we might do better.
Accuracy and Punch Cards, Security and Electronic Voting – The extraordinarily close
election in Florida in 2000 exposed numerous problems with America’s machinery of democracy,2 but
voting systems—the methods for recording and counting votes—performed especially poorly. Confusing
ballot forms in Palm Beach County and Duval County led to thousands, if not tens of thousands, of
1
mistakes. The butterfly ballot caused at least two thousand Democratic voters in Palm Beach to vote for
Reform Party candidate Pat Buchanan when they meant to vote for Democratic Presidential candidate Al
Gore (Wand et al 2001). A voting booklet instruction that said “vote all pages” and a ballot that spread
presidential candidates over two pages may have caused thousands of voters in Duval County to vote for
two presidential candidates, thus spoiling their ballot for the presidential contest. In many counties in
Florida, especially in minority areas, there were substantially fewer valid votes – sometimes as many as
nine percent fewer – in the presidential contest than the number of voters who went to the polls. These
ballots without valid votes—called “residual votes”—seemed especially prevalent in counties using
Votomatic style punch cards, central-count optical scan systems, and Datavote punchcards.3 Finally,
recounts suggested that Votomatic style punch card systems and central count optical scan systems were
especially prone to varying counts depending upon the interpretation of ambiguous marks such as hanging
chads, smudged ballots, and inadequately marked ballots. Many people concluded from these
experiences that using different ballots and methods for recording votes led to serious problems with the
accuracy and fairness of voting systems. In fact, in Bush v. Gore—the case that decided the 2000
election—the Supreme Court argued explicitly that it was unfair—it violated equal protection
guarantees—to have one standard for counting votes in one county and a different standard in another
county.4
Since 2003, another problem, the security and trustworthiness of voting systems has come to the
fore based upon concerns that Direct Record Electronic (DRE) voting systems—similar to Automatic
Teller Machines (ATMs)—might be subject to computer hacking or to malfunctions. These DRE systems
were initially heralded as “solutions” to the problem of accuracy and fairness: They prevent people from
“overvoting” for more than one candidate or proposition in a contest. By providing reminder that citizens
had not voted in a contest, they reduce “undervoting” from people failing to choose an option in a contest.
They replace fuzzy marks on paper ballots or punchcards with crisp “yes” or “no” computerized bits, and
they provide more accessible voting machines for the disabled. But soon some skeptical computer
scientists began to argue that these systems could be untrustworthy due to poorly written computer code
2
or insecure due to computer hacking or illicit code. Consequently, these experts argued that they should
be supplemented by a “voter verified paper audit trail” (VVPAT) which would allow votes to be checked
by both the voter at the time of the vote and election officials after the voting was finished, thus producing
a trustworthy system.
The change in the public debate from 2001 to 2004 is striking. A search of New York Times
articles in 2001 and 2004 reveals 77 stories on “voting machines” in 2001 and 147 in 2004 (see Table 1).
In 2001, over one-third of these stories discussed accuracy and fairness alone, and only one-twentieth
mentioned security and trustworthiness alone. But by 2004, a majority discussed security and
trustworthiness alone, but only ten percent mentioned accuracy and fairness.5
<Table 1 here>
Another way to characterize the changes in the public debates about voting systems is to consider
mentions of the phrases “punch card voting” or “touch screen voting” in newspaper articles. Figure 1
does this for the New York Times. An average of fifteen punch card voting articles appeared each year
between 2000 and 2003, but the number fell to about one per year in 2004-2006. Moreover, the upsurge
in 2003 was entirely due to coverage of litigation on the 2003 California recall election. Stories on touch
screen voting followed just the opposite pattern. An average of seven touch screen voting articles
appeared each year between 2000 and 2002, but there were forty-four in 2004 and eighteen in 2006—an
average of twenty-three per year from 2004 to 2006. Moreover, the early articles about touch-screen
voting were largely laudatory—speaking to the promise of touch-screen voting, but later articles, as we
shall see, became highly critical.
<Figure 1 here>
It is not unusual for the definitions of a policy problem to change (consider the Iraq War or the
energy crisis), but such transformations suggest that something interesting is going on. Why the
redefinition? Is it the right one?
Consider first the redefinition. How did politics lead to a change in emphasis from accuracy and
fairness to security and trustworthiness, and, in turn, how did this change in emphasis affect public
3
policy? We argue that the presidential election events in Florida in 2000 brought to the fore questions
about accuracy and fairness, largely, but not exclusively, related to punch card voting. The events also
heightened partisan fears about voting systems, and led to a spate of law suits regarding punch card
systems. In subsequent years, a new definition of the “voting systems problem” developed as a result of
several converging trends. The effort to get rid of punch cards through court cases and legislation helped
clear the field of concerns about punch card systems, but it did so without leaving a legacy of case law or
legislation devoted to improving accuracy and securing equal protection by setting standards for reducing
residual vote levels. The availability of Help America Vote Act (HAVA) funds after 2002 made it
possible for localities to consider buying electronic machines which had become cheaper and somewhat
better as a result of the continuing advances in chip-making and electronics. But partisan fears about
stolen elections and growing fears over the role of computers in American life (perhaps further fueled by
the horrific events of 9/11) led to a concern with electronic voting. Finally, a social movement started on
the Internet in 2003 by skeptical computer scientists and others crystallized these concerns and offered a
seemingly simple solution to the problem of security—the use of voter verified paper trails with
electronic voting. Although the solution has proved harder to implement than many initially thought,
advances in technology and worries about computer security—not to mention the populist logic of the
voter verified paper trail idea—may be leading to national standards for paper trails.
Is this redefinition of the problem the right one? Is the emphasis on security and trustworthiness
instead of accuracy and fairness correct, and how far have we gone towards achieving either set of goals?
None of the strategies pursued to improve voting systems – including court cases, federal legislation, and
the verified voting social movement – has solved the system’s problems although some progress has been
made. Part of the problem is a failure to take seriously the need for tough performance standards, and
another part of the problem is the failure to have a balanced approach that considers accuracy and fairness
at least as much as security and trustworthiness.6
4
II. Accuracy and Security Risks
Risk, Threats, and Vulnerabilities – One reason for the paper-trail movement’s success is its
singular focus on the vulnerabilities of electronic systems and its contention that paper trails would
dramatically diminish these vulnerabilities. There is certainly some truth to this notion, but the focus on
machine vulnerabilities looks at only one-half of the risk equation—it ignores threats, and it looks at only
one-half of the vulnerabilities in the American voting system – it ignores vulnerable populations whose
votes are threatened by some voting systems. We summarize this argument in Table 2 and we explicate it
in the next few paragraphs.
<Table 2 here>
Reflections on the “riskiness” of a voting systems should start with the following equation:
Risk = Threats X Vulnerabilities
An unlocked house, for example, is vulnerable, but it may not be threatened if it is in a gated community.
Hence, the owner may face no security risks. Similarly, electronic voting machines may have the
equivalent of unlocked doors, but they may be protected by bureaucratic procedures and other checks. In
short, it is important to consider realistic scenarios as to how someone could actually rob a house or rig an
election,7 and it is sensible to think about how these threats might be controlled in other, perhaps simpler
and cheaper, ways than with a paper trail.8 Except for cryptographic and computer science approaches
that are controversial (Adida 2006; Smith 2005), there has been very little discussion of these
possibilities, perhaps because many computer scientists feel much more comfortable talking about
vulnerabilities which involve the computer software and hardware that they know so well than about
threats involving the actions of people and organizations about which they know very little.9 Social
scientists, on the other hand, may err by focusing on threats which they understand while ignoring
vulnerabilities which they do not. Each group ignores half the risk equation listed in the bottom panel of
Table 2.
But even more than that has been ignored in the past few years. There are different kinds of risk.
Security risks are one kind that leads to doubts about the trustworthiness of a system. Another kind is
5
accuracy risks which stem from human factors problems. When the equation described above is used to
study accuracy risk its components must be reinterpreted. Vulnerabilities in a voting system become the
vulnerable populations who might be affected by the threat of a poorly conceived voting system. And the
experts in these vulnerabilities are the social scientists and lawyers who know about the problems faced
by people when they interact with governmental systems. The experts on threats are human factors
engineers who understand how people can be buffaloed by machines.
What is at Stake – Both kinds of risks must be taken seriously. Security risks have been taken
seriously partly because most people believe both that computers might be vulnerable and that there are
those who want to rig elections. Yet upon reflection it seems just as self-evident that there must be voting
systems that don’t record votes properly and people who have trouble with them. Moreover, there is
strong empirical evidence that voting system accuracy varies with the kind of voting system and that the
likelihood of someone’s vote being counted depends upon what machine is used.
Figure 2 reveals significantly different levels of voting system accuracy as measured by residual
vote rates across two adjoining counties in Southern California.10 In 2004, Los Angeles County
responded to a court decree that outlawed the use of punch-cards by converting their Votomatic-style
punch-card system to an optical scan system called “Ink-A-Vote.” The County did this by simply
replacing the “stylus” which punches out the chad in the punchcard system with a pen that marks a punch-
card inserted inside the same Votomatic style mechanism. As a result, the Ink-A-Vote system has all the
problems of the widely discredited Votomatic system except for the hanging chads, although that problem
is replaced by concerns about whether the marker pen provides an adequate mark on the ballot. Ink-A-
Vote shares with the Votomatic system the difficulty that a voter cannot easily see whether or not a mark
is made in the proper place while the punch-card is inside the machine, and once the punch-card is
removed, the voter has a hard time telling what was done because there are only numbers on the card that
correspond to the various candidates and contests listed on the ballot.
<Figure 2 here>
6
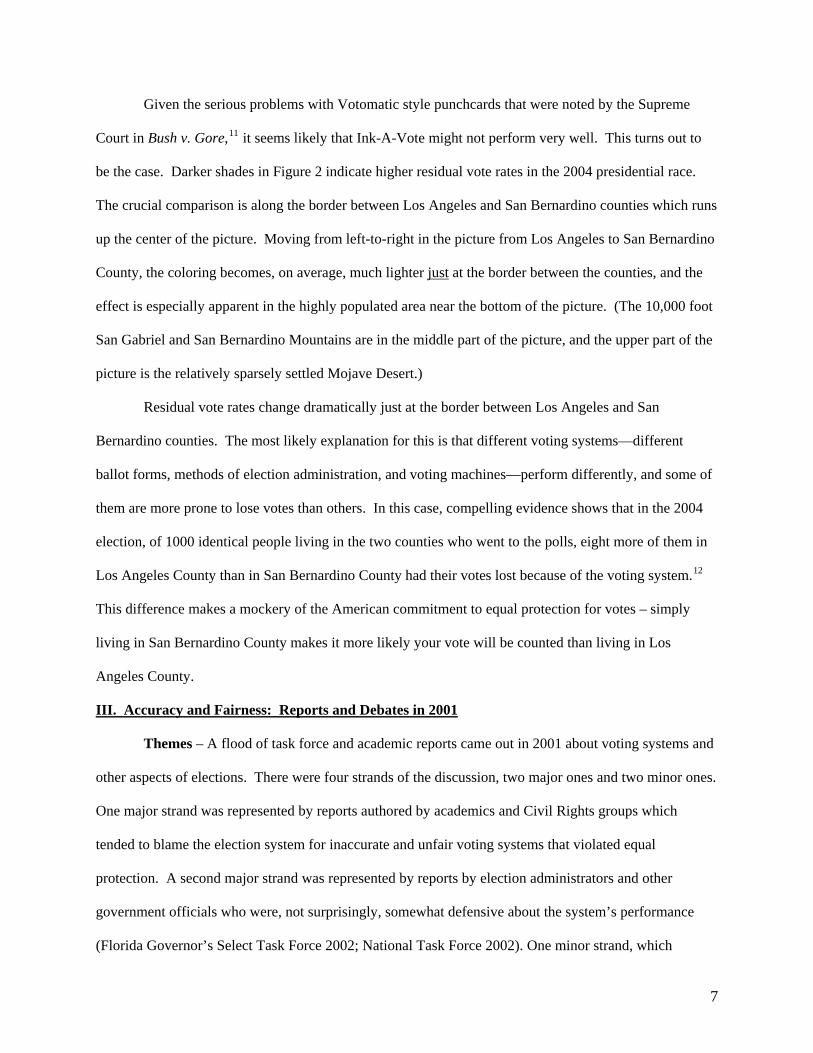
Given the serious problems with Votomatic style punchcards that were noted by the Supreme
Court in Bush v. Gore,11 it seems likely that Ink-A-Vote might not perform very well. This turns out to
be the case. Darker shades in Figure 2 indicate higher residual vote rates in the 2004 presidential race.
The crucial comparison is along the border between Los Angeles and San Bernardino counties which runs
up the center of the picture. Moving from left-to-right in the picture from Los Angeles to San Bernardin
County, the coloring becomes, on average, much lighter just
o
at the border between the counties, and the
effect is especially apparent in the highly populated area near the bottom of the picture. (The 10,000 foot
San Gabriel and San Bernardino Mountains are in the middle part of the picture, and the upper part of the
picture is the relatively sparsely settled Mojave Desert.)
Residual vote rates change dramatically just at the border between Los Angeles and San
Bernardino counties. The most likely explanation for this is that different voting systems—different
ballot forms, methods of election administration, and voting machines—perform differently, and some of
them are more prone to lose votes than others. In this case, compelling evidence shows that in the 2004
election, of 1000 identical people living in the two counties who went to the polls, eight more of them in
Los Angeles County than in San Bernardino County had their votes lost because of the voting system.12
This difference makes a mockery of the American commitment to equal protection for votes – simply
living in San Bernardino County makes it more likely your vote will be counted than living in Los
Angeles County.
III. Accuracy and Fairness: Reports and Debates in 2001
Themes – A flood of task force and academic reports came out in 2001 about voting systems and
other aspects of elections. There were four strands of the discussion, two major ones and two minor ones.
One major strand was represented by reports authored by academics and Civil Rights groups which
tended to blame the election system for inaccurate and unfair voting systems that violated equal
protection. A second major strand was represented by reports by election administrators and other
government officials who were, not surprisingly, somewhat defensive about the system’s performance
(Florida Governor’s Select Task Force 2002; National Task Force 2002). One minor strand, which
7
initially received very little attention, was a concern with the security of DRE systems. A second minor
strand focused on accessibility, but we will treat it as part of the discussion of accuracy and fairness
because it dealt with equal access and equal protection. As we shall see, those concerned with
accessibility, like those concerned with the emphasis upon accuracy and fairness, eventually clashed with
those worried about the security of DRE machines.
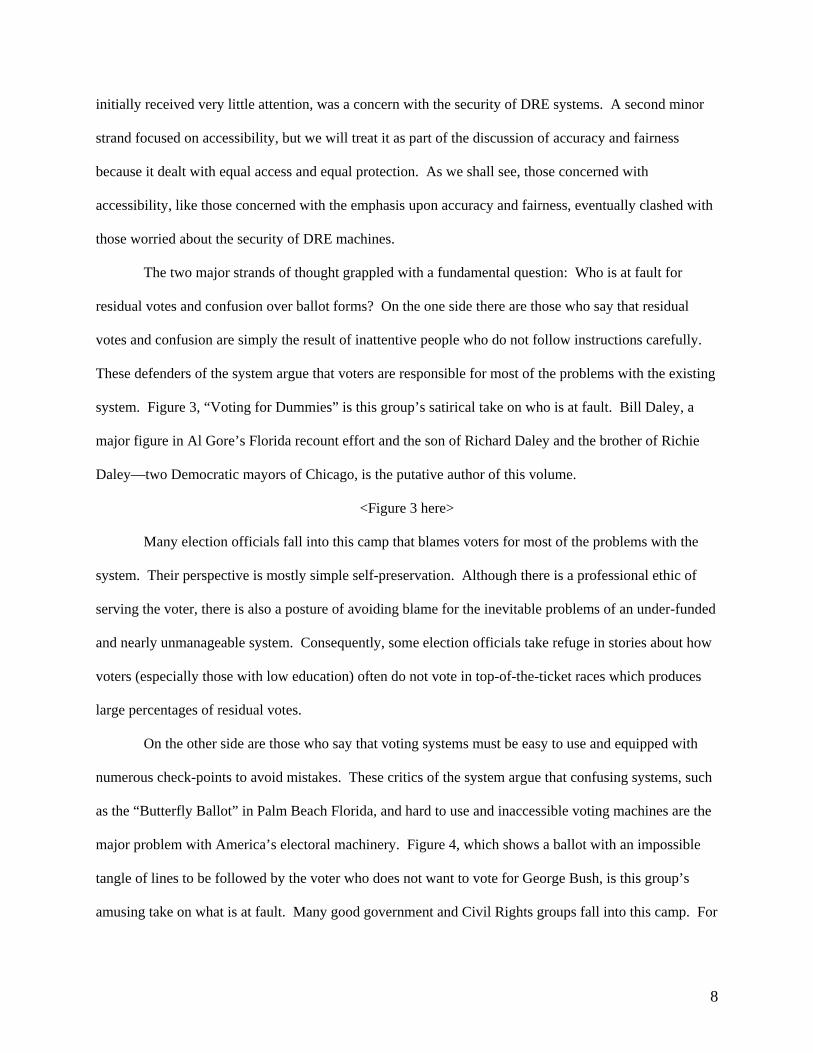
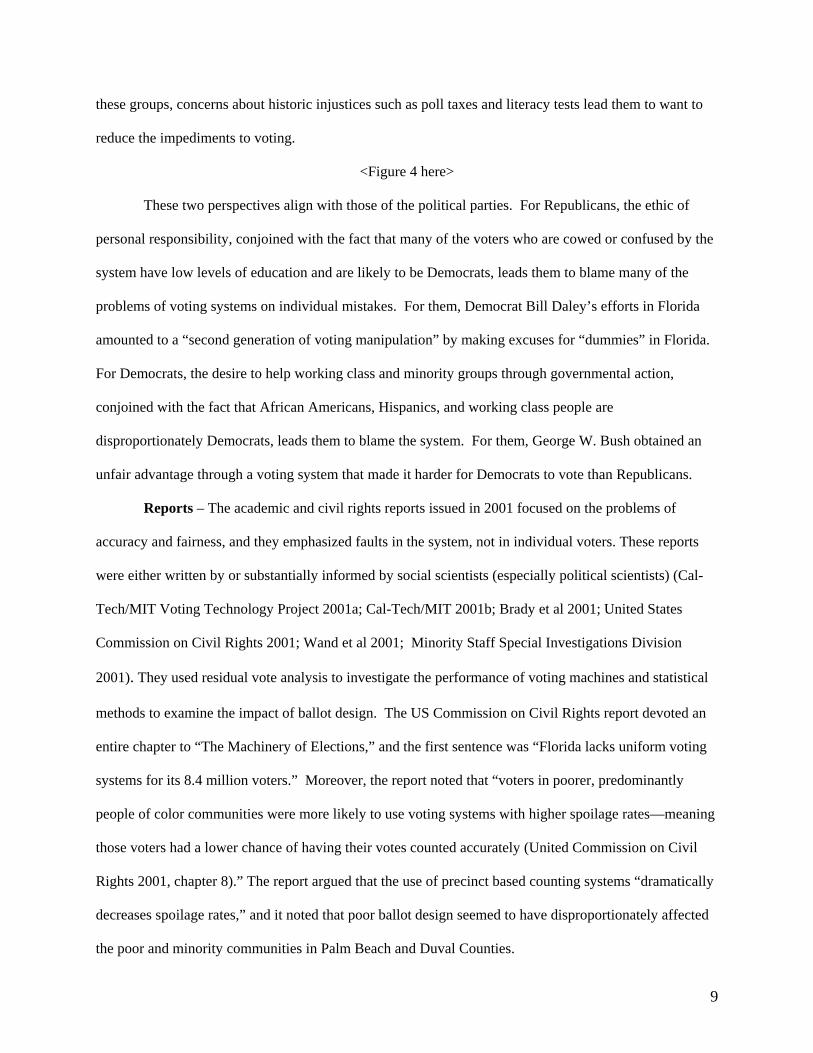
The two major strands of thought grappled with a fundamental question: Who is at fault for
residual votes and confusion over ballot forms? On the one side there are those who say that residual
votes and confusion are simply the result of inattentive people who do not follow instructions carefully.
These defenders of the system argue that voters are responsible for most of the problems with the existing
system. Figure 3, “Voting for Dummies” is this group’s satirical take on who is at fault. Bill Daley, a
major figure in Al Gore’s Florida recount effort and the son of Richard Daley and the brother of Richie
Daley—two Democratic mayors of Chicago, is the putative author of this volume.
<Figure 3 here>
Many election officials fall into this camp that blames voters for most of the problems with the
system. Their perspective is mostly simple self-preservation. Although there is a professional ethic of
serving the voter, there is also a posture of avoiding blame for the inevitable problems of an under-funded
and nearly unmanageable system. Consequently, some election officials take refuge in stories about how
voters (especially those with low education) often do not vote in top-of-the-ticket races which produces
large percentages of residual votes.
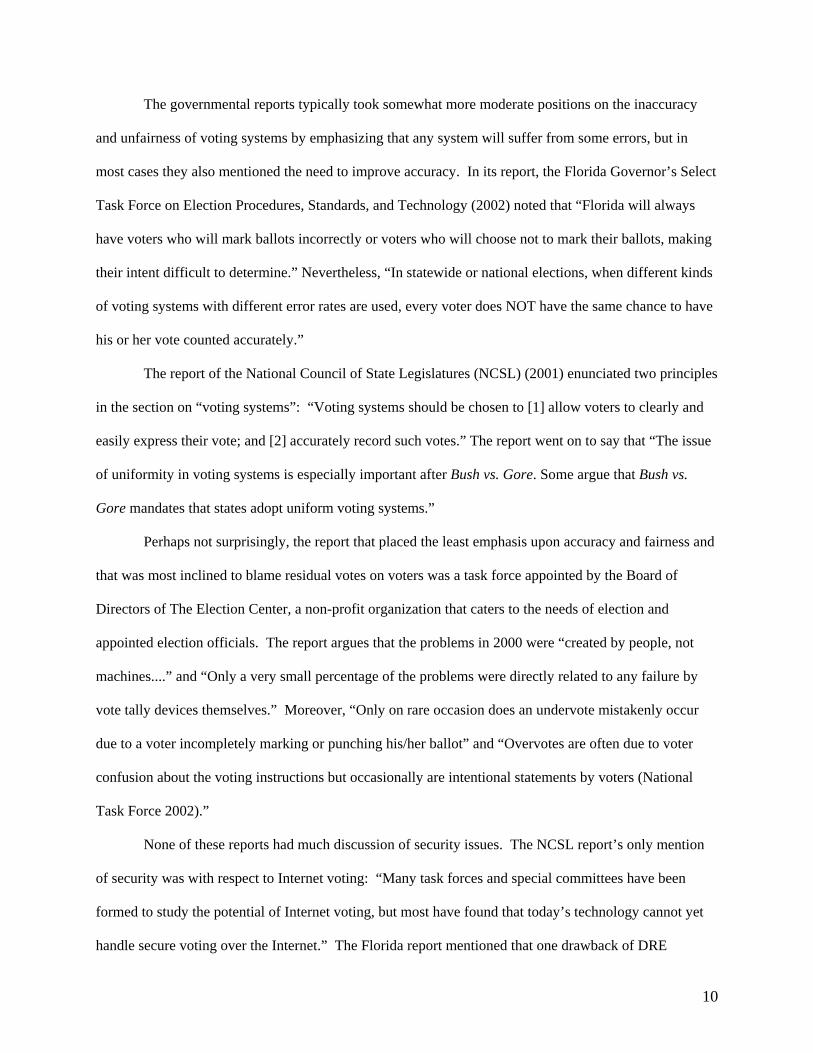
On the other side are those who say that voting systems must be easy to use and equipped with
numerous check-points to avoid mistakes. These critics of the system argue that confusing systems, such
as the “Butterfly Ballot” in Palm Beach Florida, and hard to use and inaccessible voting machines are the
major problem with America’s electoral machinery. Figure 4, which shows a ballot with an impossible
tangle of lines to be followed by the voter who does not want to vote for George Bush, is this group’s
amusing take on what is at fault. Many good government and Civil Rights groups fall into this camp. For
8
these groups, concerns about historic injustices such as poll taxes and literacy tests lead them to want to
reduce the impediments to voting.
<Figure 4 here>
These two perspectives align with those of the political parties. For Republicans, the ethic of
personal responsibility, conjoined with the fact that many of the voters who are cowed or confused by the
system have low levels of education and are likely to be Democrats, leads them to blame many of the
problems of voting systems on individual mistakes. For them, Democrat Bill Daley’s efforts in Florida
amounted to a “second generation of voting manipulation” by making excuses for “dummies” in Florida.
For Democrats, the desire to help working class and minority groups through governmental action,
conjoined with the fact that African Americans, Hispanics, and working class people are
disproportionately Democrats, leads them to blame the system. For them, George W. Bush obtained an
unfair advantage through a voting system that made it harder for Democrats to vote than Republicans.
Reports – The academic and civil rights reports issued in 2001 focused on the problems of
accuracy and fairness, and they emphasized faults in the system, not in individual voters. These reports
were either written by or substantially informed by social scientists (especially political scientists) (Cal-
Tech/MIT Voting Technology Project 2001a; Cal-Tech/MIT 2001b; Brady et al 2001; United States
Commission on Civil Rights 2001; Wand et al 2001; Minority Staff Special Investigations Division
2001). They used residual vote analysis to investigate the performance of voting machines and statistical
methods to examine the impact of ballot design. The US Commission on Civil Rights report devoted an
entire chapter to “The Machinery of Elections,” and the first sentence was “Florida lacks uniform voting
systems for its 8.4 million voters.” Moreover, the report noted that “voters in poorer, predominantly
people of color communities were more likely to use voting systems with higher spoilage rates—meaning
those voters had a lower chance of having their votes counted accurately (United Commission on Civil
Rights 2001, chapter 8).” The report argued that the use of precinct based counting systems “dramatically
decreases spoilage rates,” and it noted that poor ballot design seemed to have disproportionately affected
the poor and minority communities in Palm Beach and Duval Counties.
9
The governmental reports typically took somewhat more moderate positions on the inaccuracy
and unfairness of voting systems by emphasizing that any system will suffer from some errors, but in
most cases they also mentioned the need to improve accuracy. In its report, the Florida Governor’s Select
Task Force on Election Procedures, Standards, and Technology (2002) noted that “Florida will always
have voters who will mark ballots incorrectly or voters who will choose not to mark their ballots, making
their intent difficult to determine.” Nevertheless, “In statewide or national elections, when different kinds
of voting systems with different error rates are used, every voter does NOT have the same chance to have
his or her vote counted accurately.”
The report of the National Council of State Legislatures (NCSL) (2001) enunciated two principles
in the section on “voting systems”: “Voting systems should be chosen to [1] allow voters to clearly and
easily express their vote; and [2] accurately record such votes.” The report went on to say that “The issue
of uniformity in voting systems is especially important after Bush vs. Gore. Some argue that Bush vs.
Gore mandates that states adopt uniform voting systems.”
Perhaps not surprisingly, the report that placed the least emphasis upon accuracy and fairness and
that was most inclined to blame residual votes on voters was a task force appointed by the Board of
Directors of The Election Center, a non-profit organization that caters to the needs of election and
appointed election officials. The report argues that the problems in 2000 were “created by people, not
machines....” and “Only a very small percentage of the problems were directly related to any failure by
vote tally devices themselves.” Moreover, “Only on rare occasion does an undervote mistakenly occur
due to a voter incompletely marking or punching his/her ballot” and “Overvotes are often due to voter
confusion about the voting instructions but occasionally are intentional statements by voters (National
Task Force 2002).”
None of these reports had much discussion of security issues. The NCSL report’s only mention
of security was with respect to Internet voting: “Many task forces and special committees have been
formed to study the potential of Internet voting, but most have found that today’s technology cannot yet
handle secure voting over the Internet.” The Florida report mentioned that one drawback of DRE
10
machines was that they “produce no paper ballots, making recounts difficult” but security per se was only
mentioned in a discussion of Internet voting “No current technology adequately ensures security and
privacy of the voter (Florida Governor’s Select Task Force 2002).”
The minor line of thought, hardly represented in any reports, and mentioned only in an occasional
newspaper story, was some skeptical computer scientists’ concern with touch-screen voting. A March 11,
2001 New York Times article “Ideas and Trends: Down for the Count: Why Some Numbers are Only
Very Good Guesses” by science writer Gina Kolata summarizes the issues and quotes the man who was
the Godfather of the effort to bring these concerns to the fore:
After the Florida election, cries went out to improve the accuracy of voting by getting rid of the old punch cards with their fickle chads. Less error-prone machines, like touch-screen versions, are expensive—Riverside County in California just spent nearly $14 million on 4,250 machines. But you can’t accidentally vote twice, and there should be no ambiguity about whom you voted for. Over all, accuracy tends to go up.
But as with any computer solution, the problem is that not only can the machines introduce errors but the errors can be much harder to detect, Peter Neumann, a computer scientist at SRI International in Menlo Park, Calif., warned.
What if there is a tiny glitch in the software or hardware? How would you know if 1 out of every 100,000 votes goes to someone other than the intended candidate? What if the misdirected votes were created by programmer sabotage?
‘There is no guarantee that you votes goes into the computer the way it looked on the touch screen,’ Dr. Neumann said. ‘One thing is sure: with touch-screen computers, there is no chance for a recount.’13
But none of the New York Times’ articles on the subject of computer security radiates the kind of
intensity that would be apparent in this debate just a few years later, and it is telling that this story was by
a science reporter, not a political reporter.
Carter-Ford Report – After the 2000 election debacle, the National Commission on Federal
Election Reform was created with former Presidents Jimmy Carter and Gerald Ford as co-chairs. The
Carter-Ford report came out in August 2001, and it became the touch-stone for voting reformers.
Informed by the work of over two dozen political scientists, but by very few computer experts, and only
two, David Jefferson and Peter Neumann, who would later figure as skeptics in the debates regarding
touch-screen voting,14 the report listed among its goals for Federal election reform “equipment that
reliably clarifies and registers the voter’s choice” but nothing about security. The first sentence of the
11
chapter on voting equipment noted that “In the 2000 presidential election more than two million voters
went to the polls but did not have any vote counted in the race for president.” The report went far towards
blaming the system for residual votes and ballot design problems by noting that “Every analyst of voting
equipment agrees that the number of residual votes and the rate of voter error is greatly affected by the
kind of equipment that is used.” Among its recommendations were benchmarks for voting system
performance that “should be expressed as a percentage of residual vote (the combination of overvotes,
spoiled votes, and undervotes) in the contest at the top of the ballot (Carter et al 2002, p.5, 50, 50, 9).”
Specifically, the report suggested the following benchmarks:
Good: Below 1% Adequate: Between 1% and 2% Worrying: Between 2% and 3% Unacceptable: Over 3%
Almost six pages of the report were devoted to explaining, justifying, and applying these standards. One
clause in one recommendation was devoted to security—“The scope of voting system standards should
include security (including a documentary audit for non-ballot systems)….”, but this was very little
compared to the page devoted to accessibility and the observation that “accessible voting technology will
tend to promote the future acquisition of DRE (touch-screen) electronic systems equipped with an audio
feedback device (Carter et al 2002, p.57, 58).”
The next few years would be marked by litigation in the courts over voting systems and
procedures, controversy over the passage of HAVA—the Help America Vote Act which attempted to
implement some of the recommendations in the Carter-Ford report, and a growing political movement
concerned with a somewhat surprising topic – the security of computerized voting systems.
IV. Litigation over Punch-Card Voting Systems – 2001-2003
Rationale for Litigation over Voting Systems – Concerns with accuracy and equal protection, the
ambiguous impetus of Bush v. Gore’s flirtation with equal protection, and the availability of data about
residual votes led to major court cases starting in 2001 in California, Illinois, Florida, and elsewhere. In
12
an “op-ed” piece entitled “Equal Protection for Votes” written just a few hours before Bush v. Gore was
announced on the evening of December 12, 2000, Henry Brady argued that:
But if the Supreme Court decides to base its decision in Bush v. Gore on the need for equal protection of votes, then something good may come of this. Because the differences across voting devices is a much bigger problem than differences across manual recount methods—especially once the manual recount has been extended to the entire state of Florida—the next decade may see a flurry of legislation to equalize voting systems so that the promise of one person, one vote is realized. 15
In both California and Illinois, two of the leading users of Votomatic style punch-card systems, court
cases led to decrees that set schedules for eliminating these systems. Many other cases have been brought
as well, but the case with the highest visibility involved the California Recall of 2003.16
The California Recall Case – On September 15, 2003, a three-judge panel of the Ninth Circuit
Court of Appeals postponed the California Gubernatorial Recall Election scheduled for October 7, 2003
based upon concerns with the high residual vote rates of punch card voting systems to be used in the
recall election. Eventually this decision was overturned by an eleven judge Circuit Court panel, but the
preliminary decision leaned upon the 2000 Supreme Court decision in Bush v. Gore to justify postponing
the recall until better voting systems could be installed in six California counties. The panel’s decision
responded to a lawsuit arguing that Votomatic style prescored punch cards (PPC) perform much worse
than any other voting system, thus violating the equal protection clause of the Fourteenth Amendment to
the U.S. Constitution because votes are less likely to be recorded and counted in counties using these
systems. The suit also argued that Votomatic style punch cards violated the Voting Rights Act of 1973
because “people of color in California are more likely to live in counties that continue to use PPC systems
and because, within those counties, PPC systems lead to high rates of undervotes and overvotes for
people of color and those with lower levels of education” (D-ACLU, 8/7/03, 3).17
The lawsuit brought by the plaintiffs named California Secretary of State Kevin Shelley as the
defendant, but the initiator of the recall effort, Ted Costa, asked to intervene to defend the recall. The
responses by the state and Costa’s attorneys were remarkably different. In the first sentence of its brief,
the state announced that “The Secretary of State concurs with plaintiffs that punch-card voting systems
13
are antiquated” (D-State, 8/15/03, 1). Instead of arguing the facts about PPC systems, the state argued
that postponing an election is an extraordinary remedy that should almost never be exercised.
The Costa brief took a much more aggressive approach focusing on PPC performance. The brief
argued that “there is no constitutional right to an error-free voting system or to a particular voting
system—or even to the best available voting system”(11). The Fourteenth Amendment, the brief argued,
requires only “substantial equality” which punch cards amply meet. The brief questioned whether the
statistical evidence actually demonstrates high residual vote rates for punch card systems. It argued that
even if there are higher residual vote rates for punch card systems, residual vote rates are not errors, they
are often intentional undervotes, “Many voters simply choose to abstain from voting in particular
contests, and others register vote protests by casting votes for competing candidates or positions” (17).
The brief also questioned whether findings of one to one and one-half percentage higher residual vote
rates for punch card systems are substantial enough to invoke equal protection or voting rights concerns
even if this higher figure is due to machine errors. Finally, the brief argued that even if punch cards do
perform poorly, new systems would do no better.
Extensive data have been presented elsewhere disputing these claims (Brady 2004). Figure 5
comes from that analysis, and its panels display the residual vote rates by percent minority in census tracts
in Fresno California in 1996, when the county used Votomatic style punchcards, and in 2000, when the
county used a precinct count optical scan system. The right-hand picture for 2000 shows a dramatic
decline in residual votes for all tracts and especially for the virtually 100% minority tracts at the right of
the picture.
<Figure 5 here>
The steep slope of the line in the first panel of Figure 5 shows that PPC systems disadvantage minorities
because they are even more affected by Votomatic-style punch card systems than non-minorities. In
social science parlance, there is both a direct effect of PPC systems on residual vote rates and an
interactive effect with the characteristics of the voters.18 Interactive effects, however, pose special
problems for those who want to explain them, especially in the highly charged area of race. They invite
14
questions about what it is about minorities that results in higher residual vote rates. Perhaps, some might
argue, minorities are at fault for these high residual vote rates.
The plaintiffs met the claim that minorities are at fault by arguing that the most important fact
about Votomatic-style punch card systems is not that they lead to more errors for some people than
others. The most important fact is that they lead to higher residual vote rates for everybody because they
are hard to use. In Figure 5, the intercept is much higher for punch cards in 1996 than for optical scan in
2000. Even in Marin County California, with one of the highest percentages of college graduates in the
country, residual vote rates went down after the county switched away from PPCs.
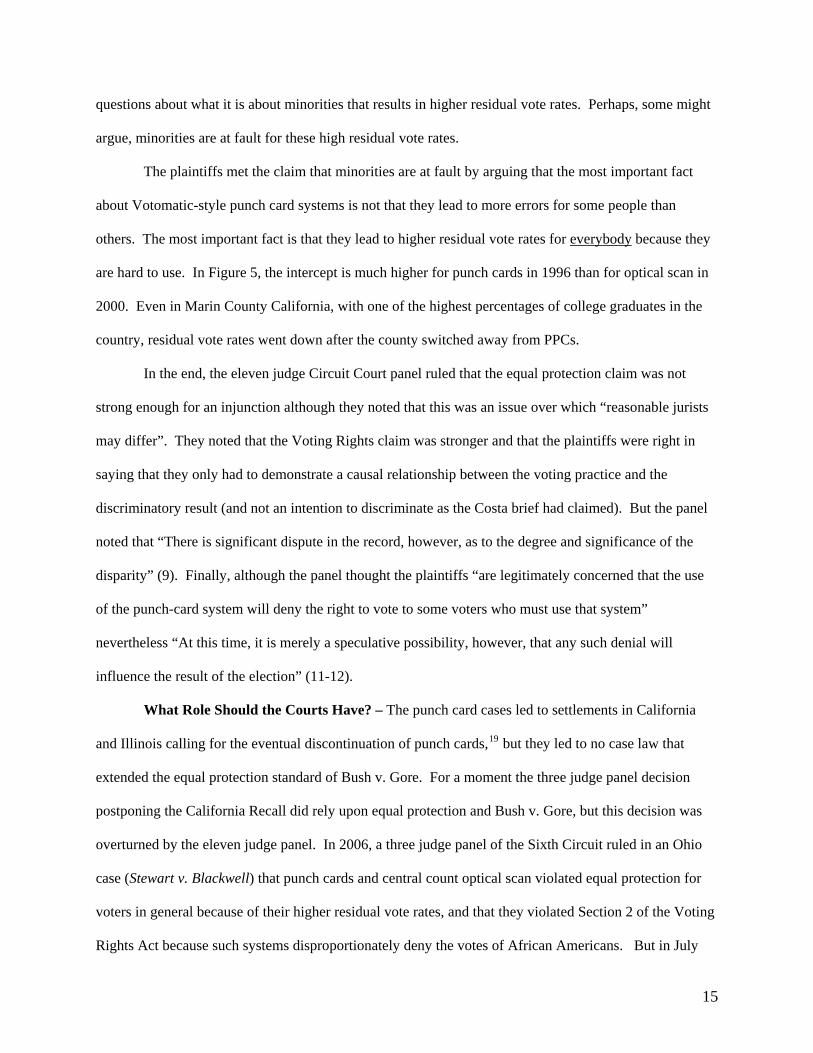
In the end, the eleven judge Circuit Court panel ruled that the equal protection claim was not
strong enough for an injunction although they noted that this was an issue over which “reasonable jurists
may differ”. They noted that the Voting Rights claim was stronger and that the plaintiffs were right in
saying that they only had to demonstrate a causal relationship between the voting practice and the
discriminatory result (and not an intention to discriminate as the Costa brief had claimed). But the panel
noted that “There is significant dispute in the record, however, as to the degree and significance of the
disparity” (9). Finally, although the panel thought the plaintiffs “are legitimately concerned that the use
of the punch-card system will deny the right to vote to some voters who must use that system”
nevertheless “At this time, it is merely a speculative possibility, however, that any such denial will
influence the result of the election” (11-12).
What Role Should the Courts Have? – The punch card cases led to settlements in California
and Illinois calling for the eventual discontinuation of punch cards,19 but they led to no case law that
extended the equal protection standard of Bush v. Gore. For a moment the three judge panel decision
postponing the California Recall did rely upon equal protection and Bush v. Gore, but this decision was
overturned by the eleven judge panel. In 2006, a three judge panel of the Sixth Circuit ruled in an Ohio
case (Stewart v. Blackwell) that punch cards and central count optical scan violated equal protection for
voters in general because of their higher residual vote rates, and that they violated Section 2 of the Voting
Rights Act because such systems disproportionately deny the votes of African Americans. But in July
15
the full court granted rehearing en banc and vacated the panel’s opinion. The case is now moot because
none of the systems being challenged were used in the November 2006 Ohio elections. Consequently, as
election expert Dan Tokaji puts it “The doctrinal legacy of Bush v. Gore remains up for grabs.”20
Court cases involving the accuracy and fairness of voting systems seem to founder on several
difficulties. One is that litigation such as the California Recall case brought right before an election must
speculate about effects and deal with the burden of justifying postponement. Cases brought after an
election must prove the effects and deal with the equally daunting burden of justifying a new election.
Cases that simply deal with equipment and that do not ask for postponements or new elections seem more
promising, but they must still deal with the complexities of residual vote measures and proving effects
using messy observational data. They must also cope with the intricacies of Section 2 of the Voting
Rights Act and the ambiguous equal protection legacy of Bush v. Gore. Nevertheless, there has been
some modest success in changing, and perhaps improving, election systems through court cases.
Certainly they speeded up the retirement of Votomatic style punch card systems.
V. The Passage of the Help American Vote Act: 2002
The Help America Vote Act of 2002 (HAVA) was the nation’s legislative response to the
problems in Florida and to the recommendations of the Carter-Ford Commission. After a difficult
struggle, in which the legislation seemed stalled at several points, partly because Democrats were fighting
for nationwide voting standards, whereas Republicans were more concerned about stronger measures to
combat fraud (Mark 2001; Pear 2002), the bill was signed by President Bush on October 29, 2002.
HAVA was a classic creation of American federalism and two-party compromise. It could and would
give out billions of dollars in payments for voting equipment (especially for replacing punch card or lever
voting) and other purposes (Title I), but it had no authority to issue rules or regulations. It established the
Election Assistance Commission (EAC) but “The Commission shall not have any authority to issue any
rule, promulgate any regulation, or take any other action which imposes any requirement on any State or
unit of local government except to the extent permitted under section 9(a) of the National Voter
Registration Act of 1993” (Section 209) It could only produce “voluntary voting system guidelines”
16
(Title II) based upon relatively weak “Voting Systems Standards” for voting for federal offices (Title III).
The standards in Title III certainly included some excellent principles such as voter notification
about overvotes and audit capacities for voting systems. But the voter notification requirement was
weakened considerably by allowing for “voter education” about overvotes instead of machine notification
(or machine prevention) of their occurrence, and the audit capacity, although it mentioned the need for a
“paper record,” did not stipulate when and how this paper record would be produced or reviewed. Only
the accessibility requirement was specific enough to lead to a clear-cut test of whether or not it was
implemented because it required “the use of at least one direct recording electronic voting system or other
voting system equipped for individuals with disabilities at each polling place.” The Carter-Ford
Commission’s notion of residual vote measures of performance and usability standards ended up in a
section allowing for studies on issues such as the “best methods for establishing voting system
performance benchmarks, expressed as a percentage of residual vote in the Federal contest at the top of
the ballot” (Section 241) or human factors research (Section 243).
Unfortunately, in both its formulation and its implementation, HAVA has run up against the
strong strain of American federalism that has traditionally left voting administration, and many other
functions to the states. In the case of voting, the counties (and in some states the townships) have been
the strongholds of voting administration. There are some reasons to believe that this has been a good
thing – it puts administrators close to the voters and it makes it harder to steal a national election by
manipulating 3000 counties, but there are also reasons to believe that it has hampered reform because the
counties have very different ways of doing things and many of them, partly because of their small size,
lack expertise. As a result, there is a lack of statewide, not to mention national standards for voting
systems. Furthermore, county (and in some states township) officials create a powerful constituency
arrayed against interference from the federal government in the form of clear-cut and forcefully
implemented performance standards. HAVA catered to this constituency by stating most standards in
vague language (Title III), and by not giving the Election Assistance Commission (EAC) any rule-making
or enforcement powers (Title II). Indeed, even the “voluntary voting system guidelines” described in
17
Title II must run the gauntlet of a Board of Advisors and an Election Assistance Standards Board
controlled by state and local governments. Despite EAC’s weakness, it was still too threatening for the
National Association of Secretaries of State who, at their 2005 winter conference, voted to encourage
Congress “not to reauthorize or fund the EAC after the conclusion of the 2006 federal general election,
and not to give rulemaking authority to the EAC (NASS 2005).”21 Perhaps the only bright aspect of the
standards process was the involvement of the highly respected and very competent National Institute of
Standards and Technology with the Technical Guidelines Development Committee.
The 2005 Carter-Baker Commission on Federal Election Reform probably summarized HAVA
best in its opening letter from its co-chairs, Jimmy Carter and James A. Baker: “Many Americans
thought that one report—the Carter-Ford Commission—and one law—the Help America Vote Act of
2002 (HAVA)—would be enough to fix the system. It isn’t (Commission on Federal Election Reform
2005).”
VI. Security and Trustworthiness: The Voter Verified Ballot Movement – 2003-2004
Security Concerns and the Voter Verified Ballot – On October 27, 2000, just eleven days before the
2000 presidential election, computer scientist Rebecca Mercuri defended her dissertation at the University
of Pennsylvania on “Electronic Vote Tabulation Checks & Balances”. Since 1992, Mercuri had been
writing about her doubts regarding the security of electronic voting (Mercuri 1992), and one of her
advisors, Peter Neumann, had written about his concerns at least as early as 1985 (Neumann 1985, 1990,
1993). In her dissertation, she concluded that electronic voting could not be trustworthy and secure
without a voter verified ballot (VVB) in which electronic machines print-out a copy of peoples’ votes
which they can inspect and which can be kept as an audit trail in case there is a need for a recount.22
Within three years, Mercuri’s doubts and her idea of a voter verified ballot would become commonplace,
but they were oddities in 2000.
Starting in September 2002, Bev Harris, a freelance writer and publicist, started to surf the web to
learn more about electronic voting. “On Jan. 23, 2003, she hit the mother lode. On an unprotected Web
site, she found 40,000 files of Diebold Election Systems' source code—the guts of software to run touch-
18
screen voting machines (Howland 2004).” She decided to post these files on the web and to pass them on
to computer scientists. She also went on to write a book, Black Box Voting, that presents electronic
voting in the worst possible light—with tales of back-room machinations and darkly hinted at
conspiracies.
At the same time in January 2003, David Dill, a computer scientist at Stanford University
released the “Resolution on Electronic Voting”:
Computerized voting equipment is inherently subject to programming error, equipment malfunction, and malicious tampering. It is therefore crucial that voting equipment provide a voter-verifiable audit trail, by which we mean a permanent record of each vote that can be checked for accuracy by the voter before the vote is submitted, and is difficult or impossible to alter after it has been checked. Many of the electronic voting machines being purchased do not satisfy this requirement. Voting machines should not be purchased or used unless they provide a voter-verifiable audit trail; when such machines are already in use, they should be replaced or modified to provide a voter-verifiable audit trail. Providing a voter-verifiable audit trail should be one of the essential requirements for certification of new voting systems." Rebecca Mercuri was an early signer, and the resolution eventually garnered the support of over 2,000
technologists and 8,000 other people. Thus began the year 2003 which would prove a turning point in the
discussion of electronic voting.
On July 23, 2003, Professor Aviel D. Rubin of the Information Security Institute at Johns
Hopkins University and three co-authors released a technical report entitled “Analysis of an Electronic
Voting System”23 which analyzed the Diebold code found by Bev Harris. They concluded that “this
voting system is far below even the most minimal security standards applicable in other contexts (Kohno
et al 2004, Abstract).” They argued that both “outsider” and “insider” attacks were possible. Voters
could cast unlimited votes by creating their own “smart cards,” and insiders could modify votes and even
identify individual voters.
The New York Times picked up the story the next day, and quoted Professor Rubin exclaiming
that “We found some stunning, stunning flaws”(Schwartz 2003). The paper led the State of Maryland,
which was procuring Diebold equipment, to commission two reports. The SAIC (2003) report concluded
that “The [Diebold] System, as implemented in policy, procedure, and technology, is at high risk of
compromise” although it also noted that “The State of Maryland procedural controls and general voting
19

environment reduce or eliminate many of the vulnerabilities identified in the Rubin report.” The RABA
(2004) report said that “We generally agree with the conclusions of the Hopkins Report on purely
technical issues” but it noted that the Hopkins report posited threats with respect to “unscrupulous voters
and malevolent insiders” without asking “whether e-voting systems introduce additional vulnerabilities.”
Nevertheless, the report ended with the following:
In discussions amongst the team members, there was no single consensus recommendation, except that the introduction of voter-verifiable paper receipts is absolutely necessary in some limited form. The number of software vulnerabilities such receipts mitigate, the amount of savings they introduce by lowering procedural requirements, and the trust they garner are likely to be just as cost-effective in the long run as a fully locked-down all-electronic system.
RABA (2004, p.23) did not think that voter-verified receipts were needed for every DRE, but they did
think that they should be provided for a small number of randomly chosen machines.
The Politics of the Campaign Against Electronic Voting – Web sites and Internet discussion
have been essential parts of the campaign against electronic voting. Bev Harris was the first to make a
splash with her posting of Diebold source code in January 2003 and with her use of the phrase “Black
Box Voting”. In June 2003, computer scientist David Dill started a website called VerifiedVoting.Org
which incorporated as a nonprofit organization in January 2004. The group grew quickly to have a
lobbyist, a nationwide coordinator, and other staff. A companion nonprofit foundation started in February
2004. These groups engage in lobbying, education, litigation, and organizing voters to monitor elections.
In 2004, VerifiedVoting.org worked to limit the implementation of paperless electronic systems before
the 2004 election, and it has continued to do so.
In the second-half of 2003, the verified voter movement and those with fears about computerized
voting found their cause celebre in the chief executive of Diebold, Walden W. O’Dell, who wrote a letter
in mid-August 2003 inviting 100 wealthy friends to a Republican Party fund-raiser. No doubt to
underscore his earnestness, he told them that “I am committed to helping Ohio deliver its electoral votes
to the president next year (Warner 2003).” For Internet browsers with suspicions about voting machine
manufacturers, Mr. O’Dell’s letter was the smoking gun – electronic voting system manufacturers were
trying to fix elections. O’Dell resigned from Diebold in December 2005.
20
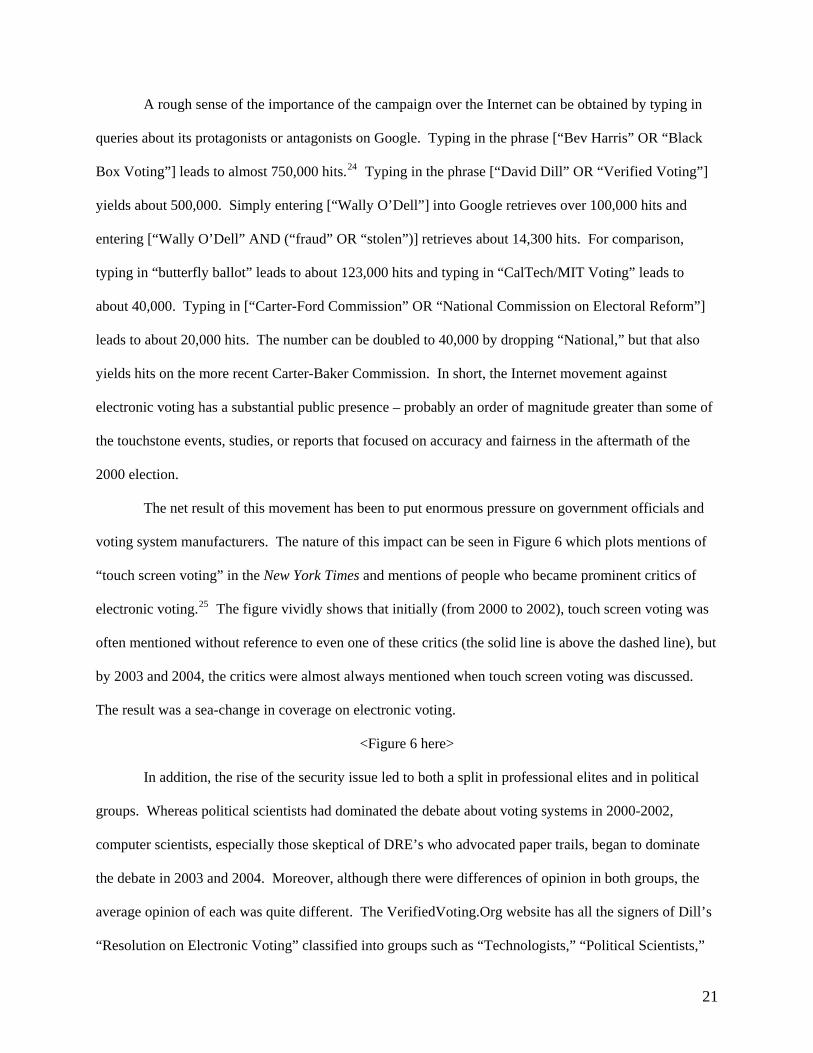
A rough sense of the importance of the campaign over the Internet can be obtained by typing in
queries about its protagonists or antagonists on Google. Typing in the phrase [“Bev Harris” OR “Black
Box Voting”] leads to almost 750,000 hits.24 Typing in the phrase [“David Dill” OR “Verified Voting”]
yields about 500,000. Simply entering [“Wally O’Dell”] into Google retrieves over 100,000 hits and
entering [“Wally O’Dell” AND (“fraud” OR “stolen”)] retrieves about 14,300 hits. For comparison,
typing in “butterfly ballot” leads to about 123,000 hits and typing in “CalTech/MIT Voting” leads to
about 40,000. Typing in [“Carter-Ford Commission” OR “National Commission on Electoral Reform”]
leads to about 20,000 hits. The number can be doubled to 40,000 by dropping “National,” but that also
yields hits on the more recent Carter-Baker Commission. In short, the Internet movement against
electronic voting has a substantial public presence – probably an order of magnitude greater than some of
the touchstone events, studies, or reports that focused on accuracy and fairness in the aftermath of the
2000 election.
The net result of this movement has been to put enormous pressure on government officials and
voting system manufacturers. The nature of this impact can be seen in Figure 6 which plots mentions of
“touch screen voting” in the New York Times and mentions of people who became prominent critics of
electronic voting.25 The figure vividly shows that initially (from 2000 to 2002), touch screen voting was
often mentioned without reference to even one of these critics (the solid line is above the dashed line), but
by 2003 and 2004, the critics were almost always mentioned when touch screen voting was discussed.
The result was a sea-change in coverage on electronic voting.
<Figure 6 here>
In addition, the rise of the security issue led to both a split in professional elites and in political
groups. Whereas political scientists had dominated the debate about voting systems in 2000-2002,
computer scientists, especially those skeptical of DRE’s who advocated paper trails, began to dominate
the debate in 2003 and 2004. Moreover, although there were differences of opinion in both groups, the
average opinion of each was quite different. The VerifiedVoting.Org website has all the signers of Dill’s
“Resolution on Electronic Voting” classified into groups such as “Technologists,” “Political Scientists,”
21
and “Lawyers.” Whereas over 2000 technologists signed the resolution, only about 90 political scientists
did so, and none of them were involved with the Carter-Ford Commission except for Robert Pastor.26
Although many political scientists may not have realized that they were welcome to sign a resolution that
emanated from the computer science community, it is still surprising to see only one prominent name.
Furthermore, the senior author has repeatedly attended meetings at which the split between the two
communities was quite clear. Most political scientists and lawyers focus on accuracy and fairness, and
most computer scientists and other technologists focus on security and trustworthiness.27
This elite split is also reflected in a split between groups on the political left. Civil rights and
disability groups focus on accuracy and fairness while more populist movements such as Moveon.org
focus on security and trustworthiness. The split became a political issue for Common Cause and the
League of Women Voters which both initially supported paperless DRE’s, but which switched mid-2004
to opposition (Konrad 2004). As membership groups, Common Cause and the League of Women Voters
have a populist tendency, but as “good government groups” they have traditionally been concerned with
the political participation of the poor, working class, minorities, and the disabled. It is not surprising they
found themselves “in the middle” on this issue, but it is also telling that they eventually opted to support
voter verification.
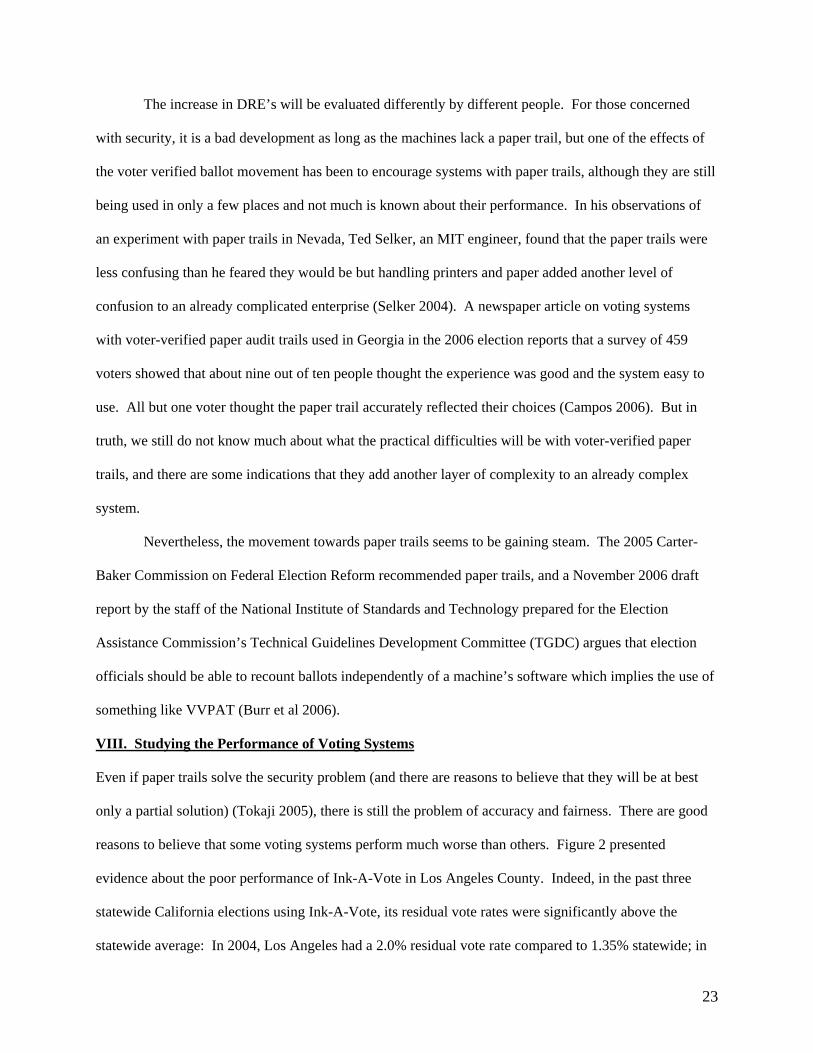
VII. The Situation in 2006
In 2000, almost one-half of American voters voted with either punchcards (31%) or lever systems (17%).
In 2004, only one-quarter of Americans voted with either punch-cards (12%) or lever machines (13%).
In 2006 less than one-twelfth of Americans voted with either lever machines (7%) or punch cards (.24%).
These two older technologies have been practically eliminated. At the same time, the fraction of those
using DRE systems has increased from 12% in 2000 to almost 40% in 2006 while optical scan systems
have increased from 30% to almost 50% (Election Data Services 2006). The elimination of punch-cards
is probably an unmitigated good, although some opponents of DRE’s have argued that using punch-cards
is perfectly fine.28
22
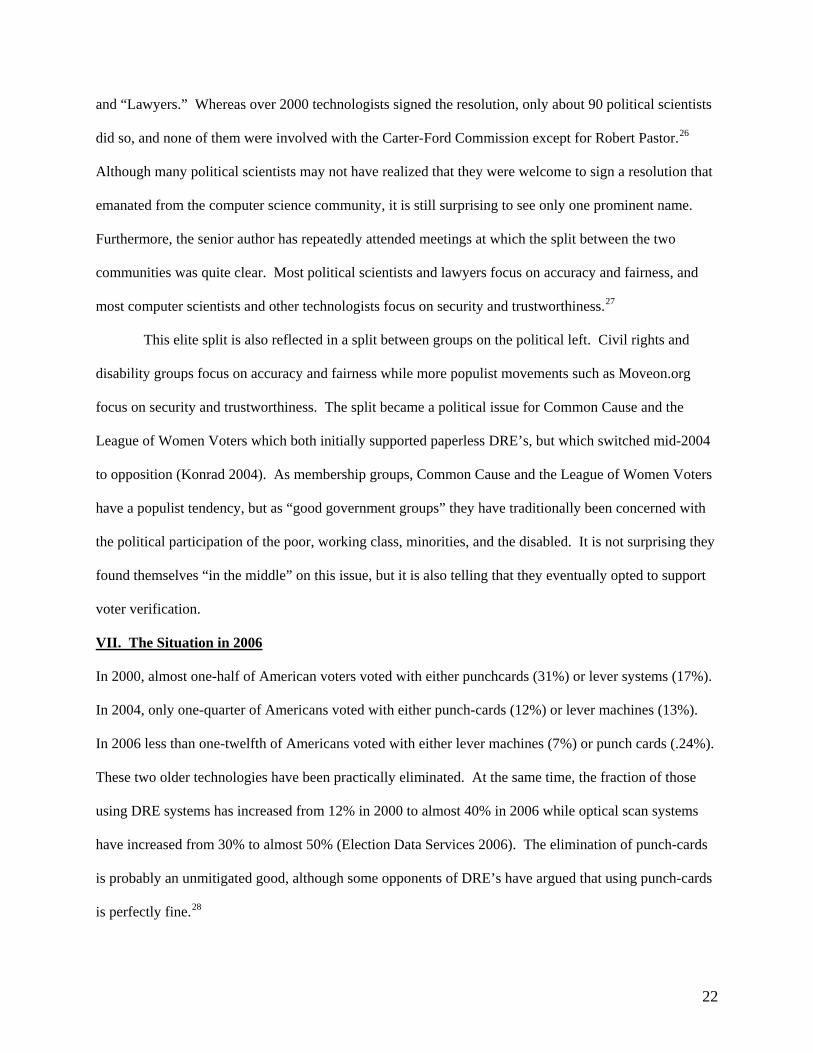
The increase in DRE’s will be evaluated differently by different people. For those concerned
with security, it is a bad development as long as the machines lack a paper trail, but one of the effects of
the voter verified ballot movement has been to encourage systems with paper trails, although they are still
being used in only a few places and not much is known about their performance. In his observations of
an experiment with paper trails in Nevada, Ted Selker, an MIT engineer, found that the paper trails were
less confusing than he feared they would be but handling printers and paper added another level of
confusion to an already complicated enterprise (Selker 2004). A newspaper article on voting systems
with voter-verified paper audit trails used in Georgia in the 2006 election reports that a survey of 459
voters showed that about nine out of ten people thought the experience was good and the system easy to
use. All but one voter thought the paper trail accurately reflected their choices (Campos 2006). But in
truth, we still do not know much about what the practical difficulties will be with voter-verified paper
trails, and there are some indications that they add another layer of complexity to an already complex
system.
Nevertheless, the movement towards paper trails seems to be gaining steam. The 2005 Carter-
Baker Commission on Federal Election Reform recommended paper trails, and a November 2006 draft
report by the staff of the National Institute of Standards and Technology prepared for the Election
Assistance Commission’s Technical Guidelines Development Committee (TGDC) argues that election
officials should be able to recount ballots independently of a machine’s software which implies the use of
something like VVPAT (Burr et al 2006).
VIII. Studying the Performance of Voting Systems
Even if paper trails solve the security problem (and there are reasons to believe that they will be at best
only a partial solution) (Tokaji 2005), there is still the problem of accuracy and fairness. There are good
reasons to believe that some voting systems perform much worse than others. Figure 2 presented
evidence about the poor performance of Ink-A-Vote in Los Angeles County. Indeed, in the past three
statewide California elections using Ink-A-Vote, its residual vote rates were significantly above the
statewide average: In 2004, Los Angeles had a 2.0% residual vote rate compared to 1.35% statewide; in
23
2005, Los Angeles County had 3.5% compared to 1.6% statewide, and in 2006, it had a 3.1% residual
vote rate compared to 2.3% statewide.29
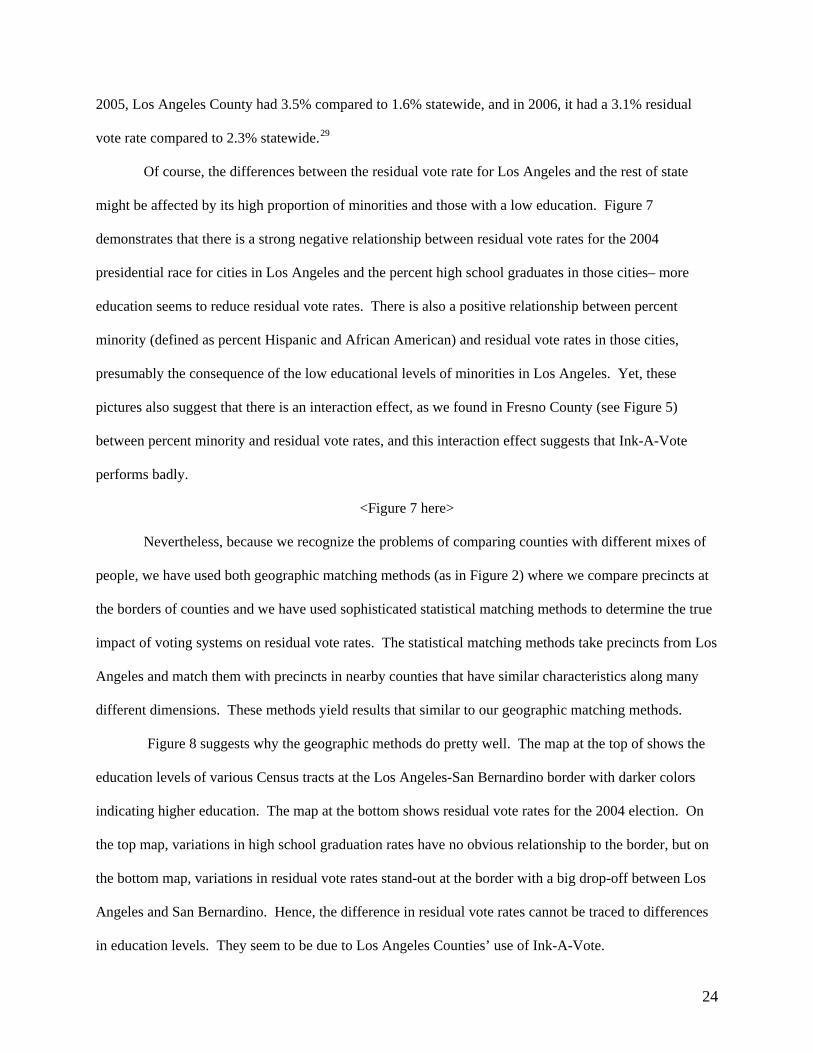
Of course, the differences between the residual vote rate for Los Angeles and the rest of state
might be affected by its high proportion of minorities and those with a low education. Figure 7
demonstrates that there is a strong negative relationship between residual vote rates for the 2004
presidential race for cities in Los Angeles and the percent high school graduates in those cities– more
education seems to reduce residual vote rates. There is also a positive relationship between percent
minority (defined as percent Hispanic and African American) and residual vote rates in those cities,
presumably the consequence of the low educational levels of minorities in Los Angeles. Yet, these
pictures also suggest that there is an interaction effect, as we found in Fresno County (see Figure 5)
between percent minority and residual vote rates, and this interaction effect suggests that Ink-A-Vote
performs badly.
<Figure 7 here>
Nevertheless, because we recognize the problems of comparing counties with different mixes of
people, we have used both geographic matching methods (as in Figure 2) where we compare precincts at
the borders of counties and we have used sophisticated statistical matching methods to determine the true
impact of voting systems on residual vote rates. The statistical matching methods take precincts from Los
Angeles and match them with precincts in nearby counties that have similar characteristics along many
different dimensions. These methods yield results that similar to our geographic matching methods.
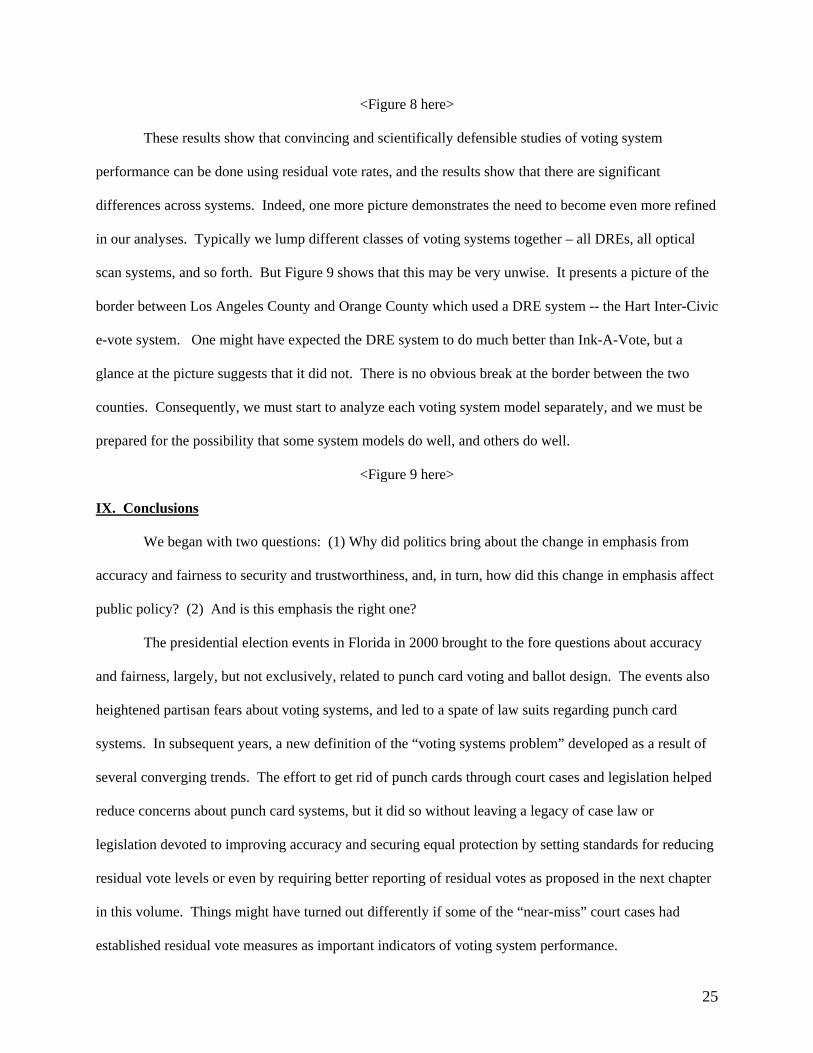
Figure 8 suggests why the geographic methods do pretty well. The map at the top of shows the
education levels of various Census tracts at the Los Angeles-San Bernardino border with darker colors
indicating higher education. The map at the bottom shows residual vote rates for the 2004 election. On
the top map, variations in high school graduation rates have no obvious relationship to the border, but on
the bottom map, variations in residual vote rates stand-out at the border with a big drop-off between Los
Angeles and San Bernardino. Hence, the difference in residual vote rates cannot be traced to differences
in education levels. They seem to be due to Los Angeles Counties’ use of Ink-A-Vote.
24
<Figure 8 here>
These results show that convincing and scientifically defensible studies of voting system
performance can be done using residual vote rates, and the results show that there are significant
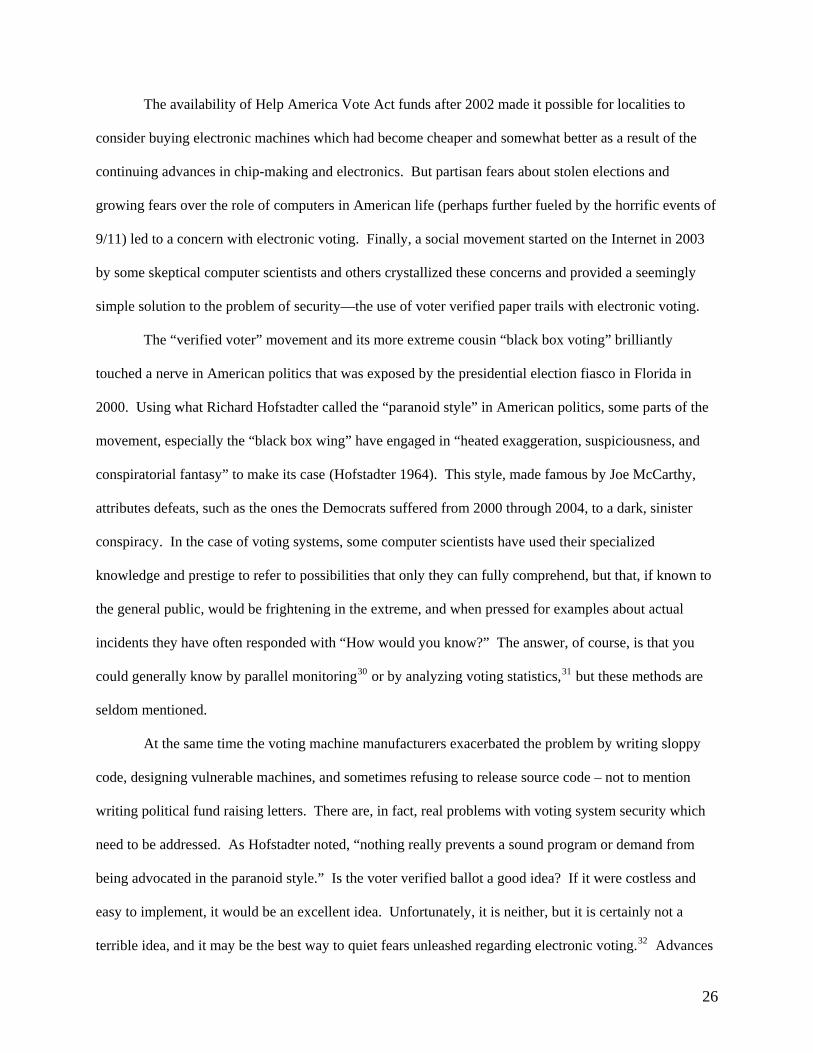
differences across systems. Indeed, one more picture demonstrates the need to become even more refined
in our analyses. Typically we lump different classes of voting systems together – all DREs, all optical
scan systems, and so forth. But Figure 9 shows that this may be very unwise. It presents a picture of the
border between Los Angeles County and Orange County which used a DRE system -- the Hart Inter-Civic
e-vote system. One might have expected the DRE system to do much better than Ink-A-Vote, but a
glance at the picture suggests that it did not. There is no obvious break at the border between the two
counties. Consequently, we must start to analyze each voting system model separately, and we must be
prepared for the possibility that some system models do well, and others do well.
<Figure 9 here>
IX. Conclusions
We began with two questions: (1) Why did politics bring about the change in emphasis from
accuracy and fairness to security and trustworthiness, and, in turn, how did this change in emphasis affect
public policy? (2) And is this emphasis the right one?
The presidential election events in Florida in 2000 brought to the fore questions about accuracy
and fairness, largely, but not exclusively, related to punch card voting and ballot design. The events also
heightened partisan fears about voting systems, and led to a spate of law suits regarding punch card
systems. In subsequent years, a new definition of the “voting systems problem” developed as a result of
several converging trends. The effort to get rid of punch cards through court cases and legislation helped
reduce concerns about punch card systems, but it did so without leaving a legacy of case law or
legislation devoted to improving accuracy and securing equal protection by setting standards for reducing
residual vote levels or even by requiring better reporting of residual votes as proposed in the next chapter
in this volume. Things might have turned out differently if some of the “near-miss” court cases had
established residual vote measures as important indicators of voting system performance.
25
The availability of Help America Vote Act funds after 2002 made it possible for localities to
consider buying electronic machines which had become cheaper and somewhat better as a result of the
continuing advances in chip-making and electronics. But partisan fears about stolen elections and
growing fears over the role of computers in American life (perhaps further fueled by the horrific events of
9/11) led to a concern with electronic voting. Finally, a social movement started on the Internet in 2003
by some skeptical computer scientists and others crystallized these concerns and provided a seemingly
simple solution to the problem of security—the use of voter verified paper trails with electronic voting.
The “verified voter” movement and its more extreme cousin “black box voting” brilliantly
touched a nerve in American politics that was exposed by the presidential election fiasco in Florida in
2000. Using what Richard Hofstadter called the “paranoid style” in American politics, some parts of the
movement, especially the “black box wing” have engaged in “heated exaggeration, suspiciousness, and
conspiratorial fantasy” to make its case (Hofstadter 1964). This style, made famous by Joe McCarthy,
attributes defeats, such as the ones the Democrats suffered from 2000 through 2004, to a dark, sinister
conspiracy. In the case of voting systems, some computer scientists have used their specialized
knowledge and prestige to refer to possibilities that only they can fully comprehend, but that, if known to
the general public, would be frightening in the extreme, and when pressed for examples about actual
incidents they have often responded with “How would you know?” The answer, of course, is that you
could generally know by parallel monitoring30 or by analyzing voting statistics,31 but these methods are
seldom mentioned.
At the same time the voting machine manufacturers exacerbated the problem by writing sloppy
code, designing vulnerable machines, and sometimes refusing to release source code – not to mention
writing political fund raising letters. There are, in fact, real problems with voting system security which
need to be addressed. As Hofstadter noted, “nothing really prevents a sound program or demand from
being advocated in the paranoid style.” Is the voter verified ballot a good idea? If it were costless and
easy to implement, it would be an excellent idea. Unfortunately, it is neither, but it is certainly not a
terrible idea, and it may be the best way to quiet fears unleashed regarding electronic voting.32 Advances
26
in technology and worries about computer security—not to mention the populist logic of the voter
verified paper trail idea and the very effective campaign waged by computer scientists—appear to be
leading to national standards for paper trails.
So have we made any progress over the past six years? None of the strategies that have been
pursued to improve voting systems – including court cases, federal legislation, and the verified voting
social movement – has really solved the system’s problems although some progress has been made.
Court cases are slow, incremental, and often poor instruments for changing administrative systems.
National legislation has been vexed by partisan differences over the causes and nature of voting system
failures and by the power of American federalism—especially the power of local election officials. The
“verified-voting” social movement has become enormously powerful, but it has mostly focused on one
thing – security issues for DRE voting systems – and it has both encountered substantial opposition from
election administrators and it has focused almost all of its and the media’s attention on security when
many other issues, such as poor registration systems, inaccurate voting systems, and poorly trained poll
workers, are equally pressing and important (see the next chapter).
The result has been a failure to consider all risks of voting systems – not just security risks but
accuracy risks as well, and to often focus on only one side of the risk equation, such as the vulnerabilities
of electronic systems without considering the nature of the threats. One approach that might get beyond
the current focus on one thing at a time would be to develop risk analyses that considered all risks of
voting systems and that utilized measures of performance. This paper has shown that it is possible to get
a meaningful measure of performance for accuracy by using residual vote analysis and sophisticated
statistical and mapping techniques. Moreover, the mapping techniques have something in common with
the voter verified ballot idea – they are very compelling. The problem becomes immediately clear to
anyone who will look. Perhaps that is the device that proponents of accuracy and fairness need to make
their case.
27
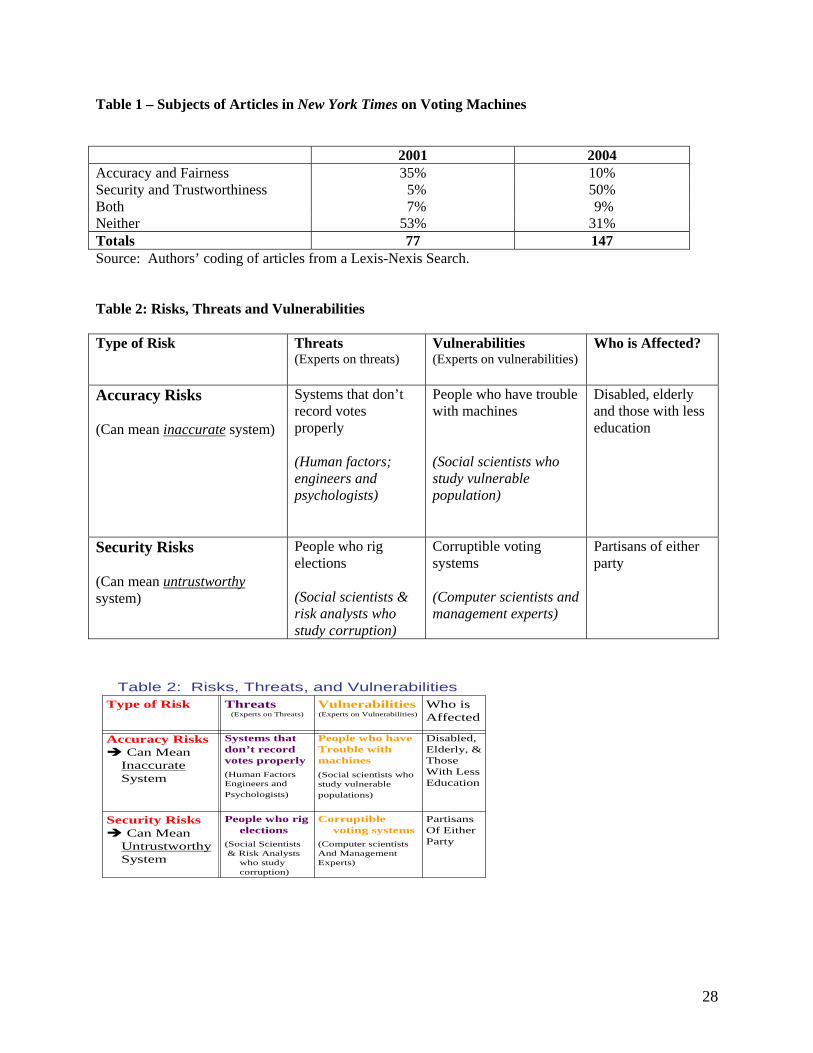
Table 1 – Subjects of Articles in New York Times on Voting Machines
2001 2004 Accuracy and Fairness 35% 10% Security and Trustworthiness 5% 50% Both 7% 9% Neither 53% 31% Totals 77 147 Source: Authors’ coding of articles from a Lexis-Nexis Search.
Table 2: Risks, Threats and Vulnerabilities
Type of Risk Threats (Experts on threats)
Vulnerabilities (Experts on vulnerabilities)
Who is Affected?
Accuracy Risks (Can mean inaccurate system)
Systems that don’t record votes properly (Human factors; engineers and psychologists)
People who have trouble with machines (Social scientists who study vulnerable population)
Disabled, elderly and those with less education
Security Risks (Can mean untrustworthy system)
People who rig elections (Social scientists & risk analysts who study corruption)
Corruptible voting systems (Computer scientists and management experts)
Partisans of either party
Disabled,Elderly, &Those With Less Education
People who have Trouble with machines(Social scientists who study vulnerable populations)
Systems that don’t record votes properly(Human Factors Engineers and Psychologists)
Accuracy RisksCan Mean
InaccurateSystem
Partisans Of Either Party
Corruptible voting systems
(Computer scientists And Management Experts)
People who rig elections
(Social Scientists& Risk Analysts
who study corruption)
Can Mean Untrustworthy
Security Risks
System
Who is Affected
Vulnerabilities(Experts on Vulnerabilities)
Threats(Experts on Threats)
Type of RiskTable 2: Risks, Threats, and Vulnerabilities
28
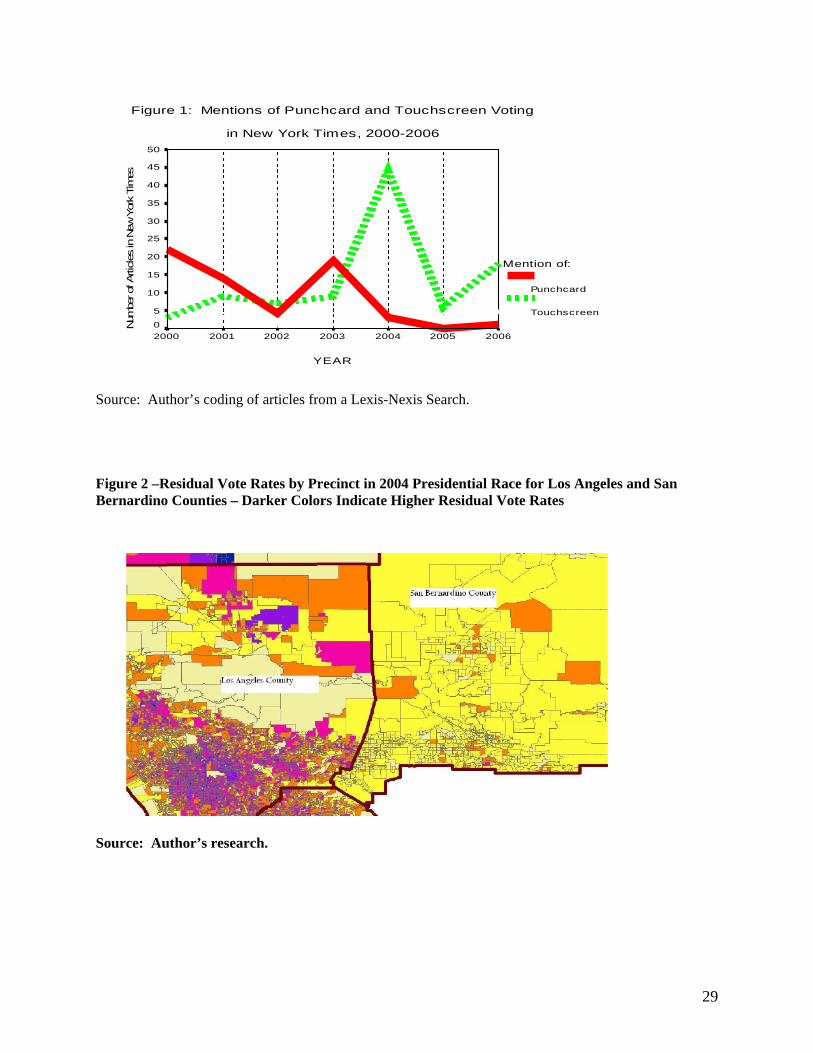
Figure 1: Mentions of Punchcard and Touchscreen Voting
in New York Times, 2000-2006
YEAR
2006200520042003200220012000
Num
ber o
f Arti
cles
in N
ew Y
ork
Tim
es
50
45
40
35
30
25
20
15
10
5
0
Mention of:
Punchcard
Touchscreen
Source: Author’s coding of articles from a Lexis-Nexis Search.
Figure 2 –Residual Vote Rates by Precinct in 2004 Presidential Race for Los Angeles and San Bernardino Counties – Darker Colors Indicate Higher Residual Vote Rates
Source: Author’s research.
29
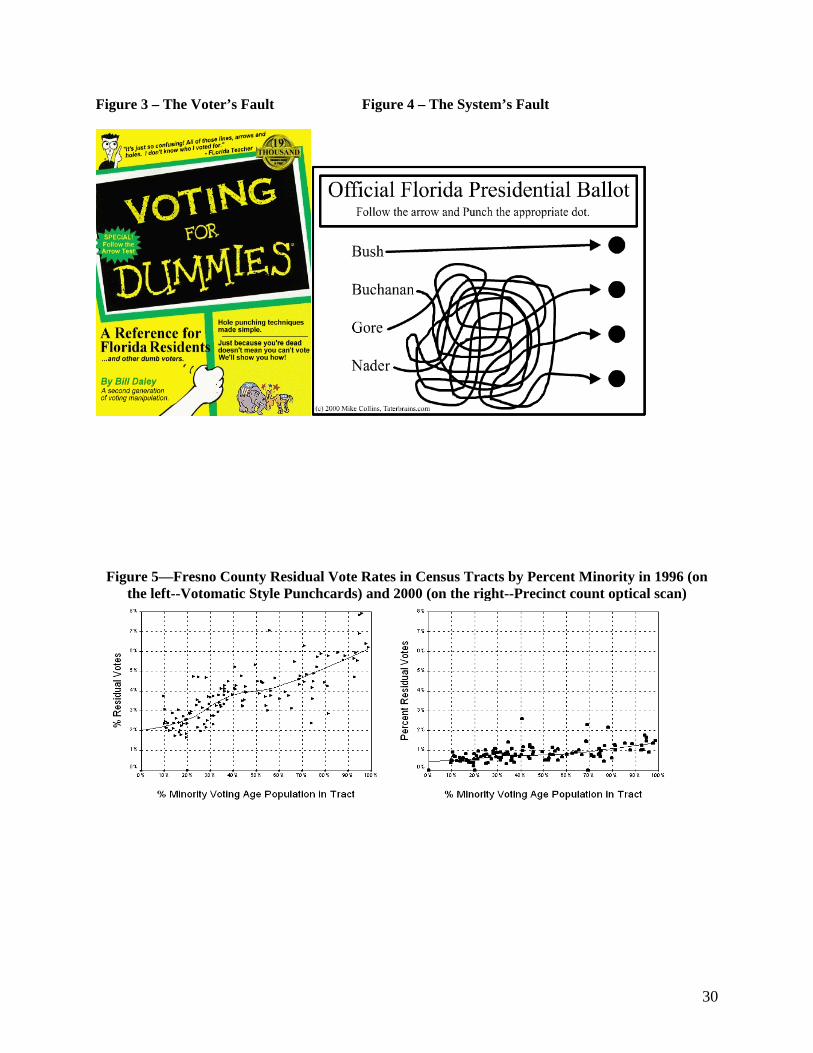
Figure 3 – The Voter’s Fault Figure 4 – The System’s Fault
Figure 5—Fresno County Residual Vote Rates in Census Tracts by Percent Minority in 1996 (on the left--Votomatic Style Punchcards) and 2000 (on the right--Precinct count optical scan)
30
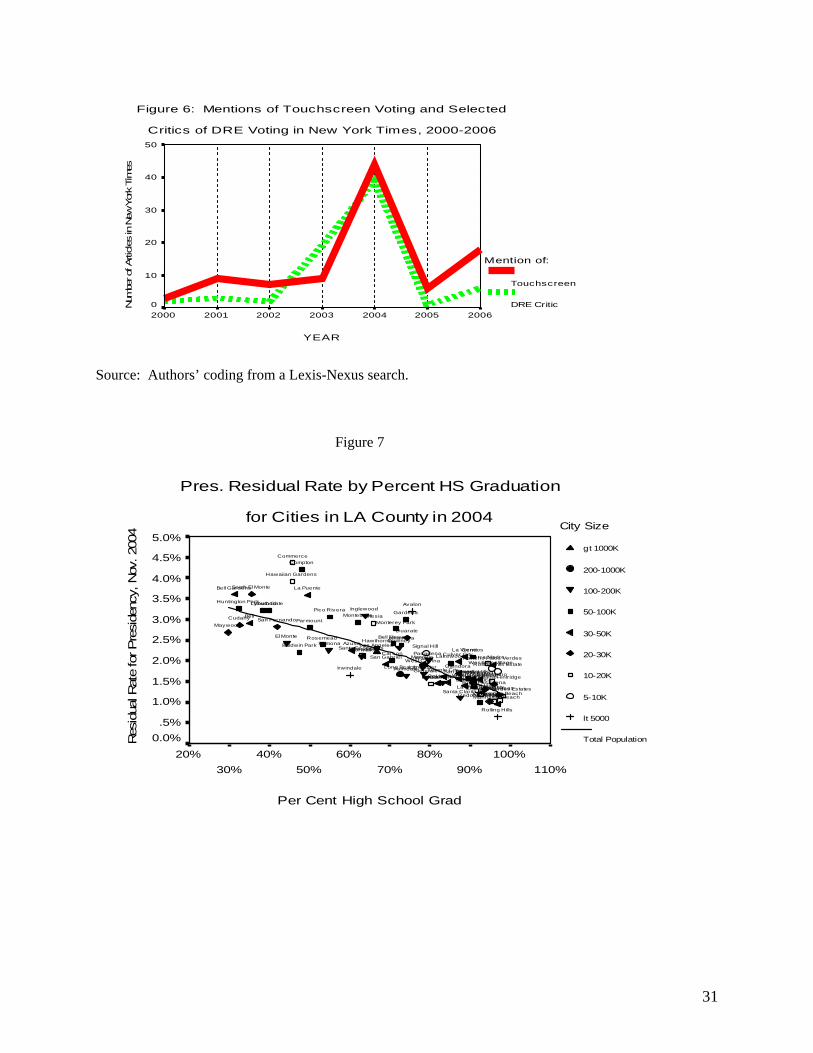
Figure 6: Mentions of Touchscreen Voting and Selected
Critics of DRE Voting in New York Times, 2000-2006
YEAR
2006200520042003200220012000
Num
ber o
f Arti
cles
in N
ew Y
ork
Tim
es
50
40
30
20
10
0
Mention of:
Touchscreen
DRE Critic
Source: Authors’ coding from a Lexis-Nexus search.
Figure 7
Pres. Residual Rate by Percent HS Graduation
for Cities in LA County in 2004
Per Cent High School Grad
110%100%
90%80%
70%60%
50%40%
30%20%
Res
idua
l Rat
e fo
r Pre
side
ncy,
Nov
. 200
4 5.0%
4.5%
4.0%
3.5%
3.0%
2.5%
2.0%
1.5%
1.0%
.5%0.0%
City Size
gt 1000K
200-1000K
100-200K
50-100K
30-50K
20-30K
10-20K
5-10K
lt 5000
Total Population
WhittierWestlake Village
West Hollywood
West Covina
WalnutTorranceTemple City
South Pasadena
South Gate
South El Monte
Signal Hill
Sierra Madre
Santa Monica
Santa Fe Springs
Santa Clarita
San Marino
San Gabriel
San Fernando
San Dimas
Rosemead
Rolling Hills Estate
Rolling Hills
Redondo Beach
Rancho Palos Verdes
Pomona
Pico Rivera
Pasadena
Parmount
Palos Verdes Estates
Palmdale
Norwalk
Monterey ParkMontebello
Morovia
Maywood
Manhattan BeachMalibu
Lynwood
Los Angeles
Long Beach
Lomita
Lawndale La Verne
La Puente
Lancaster
La Mirad
Lakewood
La Habra Heights
La Canada/Flintridge
Irwindale
InglewoodHuntington Park
Hidden Hills
Hermosa Beach
Hawthorne
Hawaiian Gardens
GlendoraGlendale
Gardena
El Segundo
El MonteDuarate
Downey
Diamond Bar
Culver City
Cudahy
Covina
ComptonCommerce
Claremont
CerritosCarson
Calabasas
BurbankBeverly Hills
Bell Gardens
Bell Flower
Bell
Baldwin Park Azusa
Avalon
Artesia
Arcadia
Alhambra
Agoura Hills
31
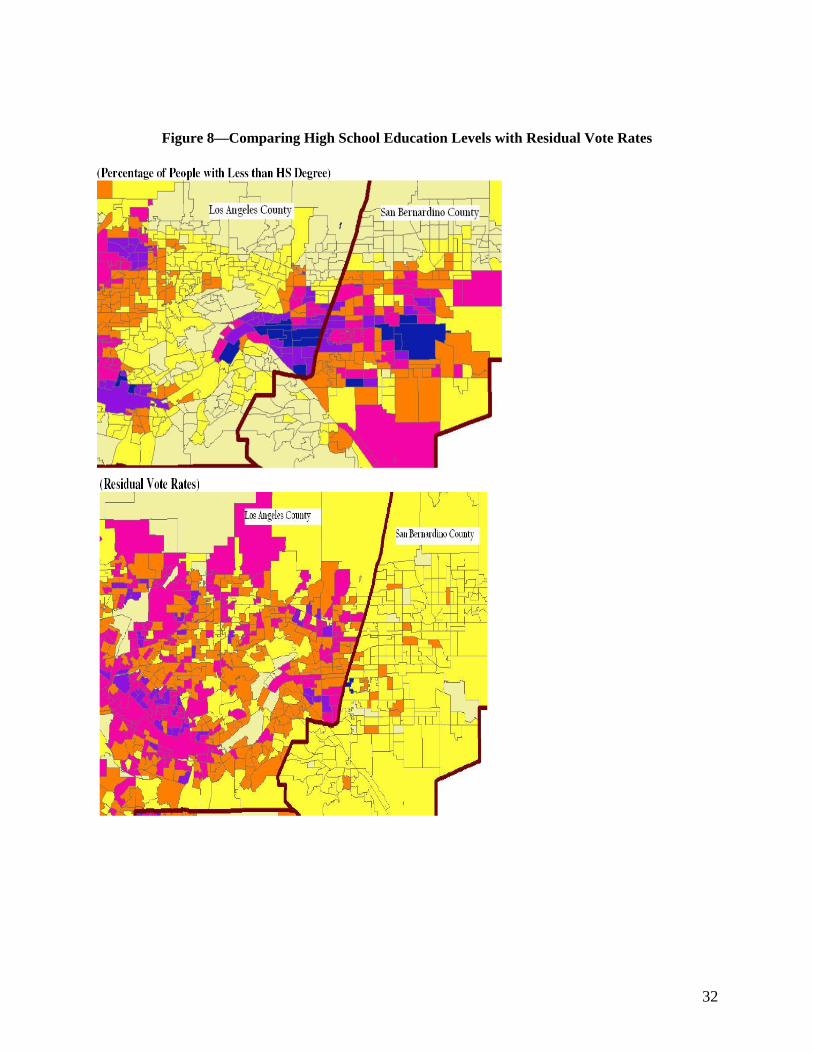
Figure 8—Comparing High School Education Levels with Residual Vote Rates
32
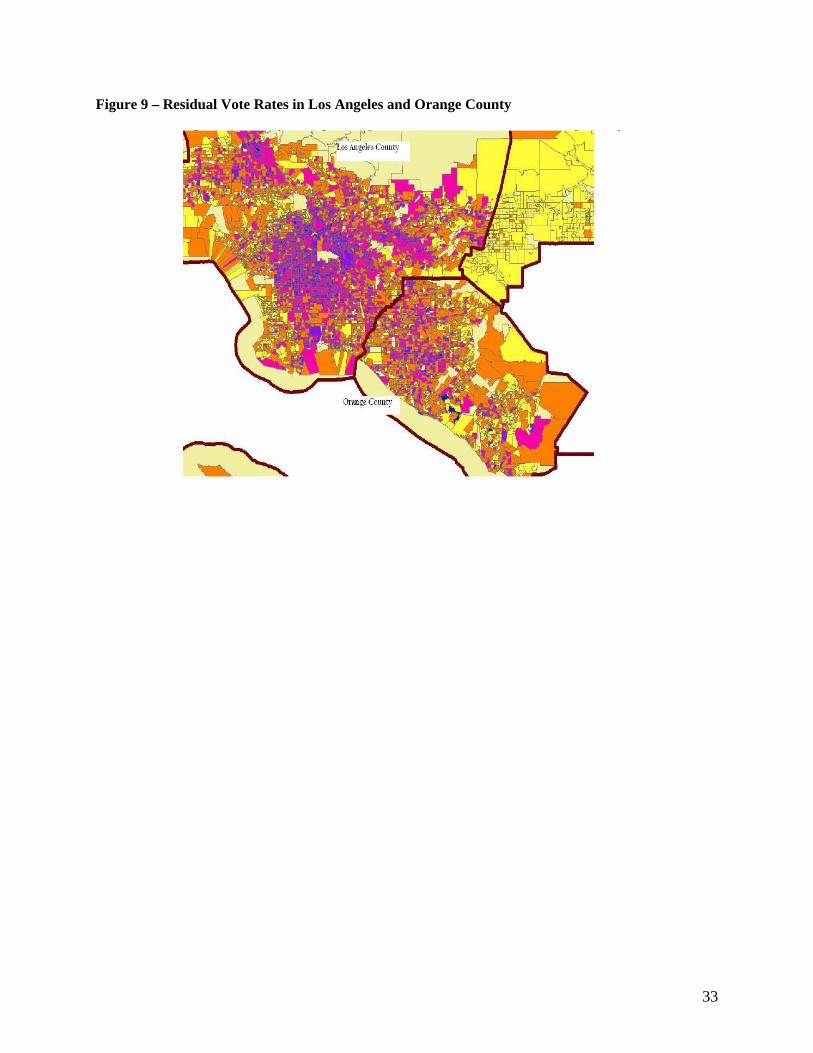
Figure 9 –
Residual Vote Rates in Los Angeles and Orange County
33
Bibliography
Adida, Ben. 2006. “Advances in Cryptographic Voting Systems.” P.h.D. diss., MIT. Barr, Earl, Matt Bishop and Mark Gondree. 2007. “Fixing Federal E-Voting Standards.”
Communications of the ACM 50(3):19-24. Brady, Henry. 2002. “Equal Protection for Votes.” In The Longest Night: Polemics and
Perspectives on Election 2000, edited by Arthur J. Jacobson and Michel Rosenfeld. University of California Press.
Brady, Henry and Iris Hui. 2006. “Is It Worth Going the Extra Mile to Improve Causal
Inference.” Paper presented to the Political Methodology Meeting. Davis, California. Brady, Henry, Justin Buchler, Matt Jarvis, John McNulty. 2001. Counting All the Votes. Survey
Research Center: University of California, Berkeley. Brady, Henry. 2004. “Postponing the California Recall to Protect Voting Rights.” PS: Political
Science and Politics 37(1): 27-32. Burr, William, John Kelsey, Rene Peralta, John Wack. 2006. “Requiring Software Independence
in VVSG 2006: STS Recommendations for the TGDC.” National Institute of Standards and Technology.
Caltech/MIT Voting Technology Project. 2001a. “Residual Votes Attributable to Technology:
An Assessment of the Reliability of Existing Voting Equipment.” Caltech/MIT Voting Technology Project. 2001b.”Voting: What Is, What Could be.” Campos, Carlos. 2006. “Paper Trail a Winner with Voters.” Atlanta Journal Constitution,
November 28, 2006, p.3B. Carter, Jimmy, Robert Michel, Lloyd Cutler, Gerald Ford, National Commission on
Federal Election Reform. 2002. To Assure Pride and Confidence in the Electoral Process: Report of the National Commission on Federal Election Reform. Brookings Institution Press.
Commission on Federal Election Reform. 2005. Building Confidence in U.S. Elections: Report of
the Commission on Federal Election Reform. Center for Democracy and Election Management, American University.
Election Data Services. 2006. “Almost 55 Million, or One-Third of the Nation’s Voters, Will
Face New Voting Equipment in 206 Election.” Press Release. October 2, 2006. Florida Governor’s Select Task Force on Election Procedures, Standards and Technology. 2002.
34
“The Governor’s Select Task Force on Election Procedures, Standards and Technology, Revitalizing Democracy in Florida.” Election Law Journal 1(1): 125-136.
Frisina, Laurin, Michael Herron, James Honaker and Jeffrey Lewis. 2007. “Ballot Formats,
Touchscreens, and Undervotes: A Study of the 2006 Midterm Elections in Florida.” Working Paper.
Gathright, Alan and John Wildermuth. 2003. “Counties Pushing Punch Cards into Extinction, All
Those Remaining Should be Gone by March, Officials Say.” San Francisco Chronicle September 16, 2003. p. A-17
Harris, Beverly. 2003. Black Box Voting: Ballot Tampering in the 21st Century. Elon House/Plan
Nine Press. Hofstadter, Richard. 1964. “The Paranoid Style in American Politics.” Harper’s Magazine
November, 1964, p.77-86. Howland Jr, George. 2004. “Black Box Backlash.” Seattle Weekly, March 10, 2004. Kohno, Tadayoshi, Adam Stubblefield, Aviel Rubin, Dan Wallach. 2004. “Analysis of an
Electronic Voting System.” IEEE Symposium on Security and Privacy Proceedings (2004): 27-40.
Konrad, Rachel. 2004. “League of Women Voters Drops Support for Paperless Voting
Machines.” Associated Press, June 15, 2004. Mark, David. 2001. “With Next Election Only a Year Away, Proponents of Ballot Overhaul
Focus Their Hopes on 2004.” CQ Weekly, October 1, 2001, p.2532. Mebane Jr., Walter and David Dill. 2007. “Factors Associated with the Excessive CD-13
Undervote in the 2006 General Election in Sarasota County, Florida.” Working Paper. Mercuri, Rebecca. 1992. “Voting Machine Risks.” Communications of the ACM 35(11):138.
--- 2002a. “Explanation of Voter-Verified Ballot Systems.” ACM Committee on Computers and Public Policy. The Risks Digest, July 24, 2002.
--2002b. “A Better Ballot Box?” 2002. IEEE Spectrum, October 2002. p.46-50.
Minority Staff Special Investigations Division. 2001. Income and Racial Disparities in the
Undercount in the 2000 Presidential Election. Committee on Governmental Reform, U.S. House of Representatives.
National Association of Secretaries of State (NASS). 2005. “NASS Position on Funding and
Authorization of the U.S. Election Assistance Commission.” Press Release February 6, 2005.
35
National Conference of State Legislatures Elections Reform Task Force. 2001. Voting in
America: Final Report of the NCSL Elections Reform Task Force. National Task Force. 2002. “National Task Force on Election Reform Election 2000: Review
and Recommendations by the Nation’s Elections Administrators.” Election Law Journal 1(1): 91-103.
Neumann, Peter. 1985. ACM Committee on Computers and Public Policy. The Risks Digest,
August 1, 1985.
-- 1990. “Risks in Computerized Elections.” Communications of the Association for Computing Machinery 33(11), p.170.
-- 1993. “Security Criteria for Electronic Voting.” Paper Presented at the 16th National Computer Security Conference. Baltimore, Maryland. (September 20-23, 1993)
Pear, Robert. 2002. “Bill to Overhaul System of Voting is Seen in Danger.” New York Times,
September 7, 2002, p.A1. RABA Innovative Solution Cell. 2004. “Trusted Agent Report: Diebold AccuVote-TS Voting
System.” Department of Legislative Services. Maryland General Assembly. R& G Associates, LLC. 2005. “Parallel Monitoring Program---California Special Statewide
Election Report of Findings.” California Secretary of State Office. Saltman, Roy G. 2006. The History and Politics of Voting Technology: In Quest of Integrity and
Public Confidence. Palgrave Macmillan. Schwartz, John. 2003. “Computer Voting is Open to Easy Fraud, Experts Say.” New York Times,
July 24, 2003, p.16. Science Applications International Corporation (SAIC). 2003. “Risk Assessment Report:
Diebold AccuVote-TS Voting System and Process.” Department of Budget and Management, Office of Information Technology, State of Maryland.
Selker, Ted. 2004. “Processes Can Improve Electronic Voting: A Case Study of an Election.”
Caltech/MIT Voting Technology Project. Shamos, Michael. 2004. “Paper v. Electronic Voting Records---An Assessment.” Working
Paper. Smith, Warren D. 2005. “Cryptography Meets Voting.” Working Paper. Technical Guidelines Development Committee. 2006. “Resolutions Adopted by the Technical
36
Guidelines Development Committee at the December 4-5, 2006 Plenary Session.” [http://vote.nist.gov/AdoptedResolutions12040506.pdf]
Tokaji, Daniel. 2005. “The Paperless Chase: Electronic Voting and Democratic Values.”
Fordham Law Review 73(4):69-84. United States Commission on Civil Rights. 2001. Voting Irregularities in Florida During the
2000 Presidential Election. Wand, Jonathan, Kenneth Shotts, Jasjeet Sekhon, Walter Mebane, Michael Herron and Henry
Brady. 2001. “The Butterfly Did It: The Aberrant Vote for Buchanan in Palm Beach County, Florida.” American Political Science Review 95(4): 793-810.
Warner, Melanie. 2003. “Machine Politics in the Digital Age.” New York Times. November 9,
2003, Section 3.
37
38
FOOTNOTES
1 The best history of where we have been is Saltman (2006).
2 In addition to problems with voting systems, registration systems failed to record people who had legally
registered, and they listed others who should have been eliminated from the rolls. Felons and those thought to be
felons (sometimes only because they shared a name similar to that of a felon) were purged from the rolls, sometimes
correctly and sometimes incorrectly. When people arrived at the polls, some found congestion and others
experienced what they considered harassment and even discrimination. Some found that they could not vote
because there was no provisional balloting procedure. Absentee votes were handled in different ways depending
upon the County, and some absentee votes were counted even though they lacked the proper date and signatures.
3 In Votomatic style punchcard systems, voters put their punchcard into a machine that makes it impossible to see
which chad is being punched out when they mark their ballot. Optical scan systems use paper ballots in which
voters mark candidates as on standardized tests—central count systems count these ballots at a central location
whereas precinct count systems count them at the precinct. Datavote punchcards make it possible for voters to see
the marks they are making as they choose a candidate.
4 The Supreme Court, however, explicitly disavowed the notion that their one-time decision should lead to a general
concern with equal protection for voting systems: “Our consideration is limited to the present circumstances, for the
problem of equal protection in election processes generally presents many complexities.” (Bush v. Gore, Per
Curiam, Section II.B.). Yet many court cases have been launched based upon the presumption that Bush v. Gore set
a precedent in which equal protection in voting systems should be considered. For an argument about why this
should be so see Brady (2002).
5 These results are based upon a search for articles on “Voting Machines” in Lexis-Nexis for both years. Articles
were then coded by the author as to their subject matter. An approach based upon searching for key words such as
“fraud,” “tampering,” “trustworthy,” or “security” in the text as indicators of “security and trustworthiness” and
“accuracy,” “mistakes,” or “fairness” for accuracy and fairness led to broadly similar results for each year from 2000
to 2005 for The New York Times and for the Washington Post newspapers.
6 Tokaji (2005) offers a somewhat similar take on these issues. He argues that four equality norms can be advanced
by electronic technology: racial equality, disability access, multi-language access, and inter-jurisdictional equality.
39
7 Shamos (2004) notes that “It is pointless to discuss the security of a computer system in the absence of a well-
articulated list of threats.”
8 Some of these methods include ensuring a “chain of custody” for machines that makes it difficult for hackers to
corrupt them, using “parallel monitoring” that involves taking a random sample of voting machines on election day
and entering a known script of votes into them while video-taping the process, and using statistical methods after an
election to make sure that the election results make sense. For a description of parallel monitoring see R&G
Associates, LLC, (2005).
9 Exceptions to this include the work of computer scientists Shamos (2004) and Barr et al (2007, p.19) which
criticizes current standards for containing “no system model or threat model.”
10 This picture is taken from Brady & Hui (2006). For a discussion of the strengths and limitations of residual vote
rates see Brady et al (2001) and the next chapter. Residual vote comparisons are meaningful here because they are
being compared across counties within the same state. Residual vote measures still miss people (as many as half a
percent) who make mistakes by marking adjacent races—as in the butterfly ballot in Palm Beach County in 2000.
11 Bush v. Gore, Per Curiam, Section IIA. “This case has shown that punch card balloting machines can produce an
unfortunate number of ballots which are not punched in a clean, complete way by the voter. After the current
counting, it is likely legislative bodies nationwide will examine ways to improve the mechanisms and machinery for
voting.”
12 The raw figures for residual vote rates are 1.35% statewide in California, 1.1% in San Bernardino County, and
2.0% in Los Angeles County. The net difference cited in the text of 0.8% is determined from sophisticated
statistical techniques described in more detail later in the paper.
13 The original article referred to Sequoia County but a subsequent correction changes this to Riverside County. All
in all in 2001, The New York Times mentioned these security issues only four times, and three of the articles cited
Peter Neumann.
14 Carter et al (2002). See Appendix A, “Contributors to the Commission’s Work.” There were some other
engineers or computer scientists listed as contributors such as David Chaum of SureVote, Ron Rivest of MIT, Roy
Saltman (formerly of the National Bureau of Standards), and Ted Selker of MIT, but none of them became
outspoken advocates for paper trails, although Rivest has been instrumental in pushing for the idea in his capacity as
a member of the Election Assistance Commission’s Technical Guidelines Development Committee. See Technical
40
Guidelines Development Committee (2006). At least one other person, Kim Alexander of the California Voter
Foundation, later became an outspoken critic of touch-screen voting and an advocate for voter verified paper trails.
15 The piece was not published as an op-ed, but it was subsequently published, see Brady (2002).
16 Brady was an expert witness in California and Illinois and in the Recall case discussed in the next section.
17 Three sets of documents were produced during the court cases heard by the Federal District Court, the three-judge
panel of the Ninth Circuit Court of Appeals, and the 11-judge panel of the Ninth Circuit. Documents submitted to
these courts are indicated by D, A3, and A11 respectively. There were briefs from the American Civil Liberties
Union (ACLU), the state of California (State), and the lawyers for Ted Costa (Costa). In addition there was a
decision (Court). We reference documents by using the abbreviation for the venue, the author, the date of the
document, and the page number. These documents can be found on FindLaw (http://www.findlaw.com/) by
searching on “Southwest Voter Education Project v. Shelley.” Brady’s declarations can be found at:
http://ucdata.berkeley.edu/new_web/recall.html.
18 In terms of the curves in Figure 5 – the curve on the left has a higher intercept than the curve on the right (a direct
effect of PPC) and a much steeper slope (due to the interaction between race and PPC).
19 The California case was Common Cause v. Jones and the Illinois case was Black v. McGuffage. There were at
least three other cases: NAACP v. Harris in Florida, Andrews v. Cox in Georgia, and Stewart v. Blackwell in Ohio.
20 Daniel Tokaji Blog, December 1st, 2006. http://moritzlaw.osu.edu/blogs/tokaji/
21 Source obtained from Charles Stewart.
22 On her web page, (http://www.notablesoftware.com/evote.html), Mercuri says that she first proposed the idea in
her paper: “Physical Verifiability of Computer Systems" presented at the 5th International Computer Virus and
Security Conference in March 1992, and she apparently refers to this paper in an October 2002 publication: “A
method of voting described by this author over a decade ago, referred to as the Mercuri Method, requires that the
voting system print a paper ballot containing the selections made on the computer. This ballot is then examined for
correctness by the voter through a glass or screen, and deposited mechanically into a ballot box, eliminating the
chance of accidental removal from the premises (Mercuri 2002b).” But the 1992 paper is not available on her
website. Perhaps the first use of the phrase “Voter-Verified Ballot” appeared in Mercuri (2002a).
41
23 Kohno et al 2004. According to VerifiedVoting.org’s website, David Dill was responsible for assembling this
group: “July 2003 Professor Dill assembles a team of computer security experts to study Diebold e-voting software
brought to light by Bev Harris.” http://www.verifiedvoting.org/article.php?id=5604.
24 All searches done in December 2006. Because of a break with one of her collaborators, the original website called
“BlackBoxVoting.Com” displays a banner saying: “Reminder: We are NOT affiliated with Bev Harris”. Harris’
website is now “BlackBoxVoting.Org”.
25 These people are Bev Harris and computer scientists David Dill, David Jefferson, Douglas Jones, Rebecca
Mercuri, Peter Neumann, Avi Rubin, and Barbara Simons. These people were chosen because of their prominence
in the DRE debate and because they were mentioned at least twice in New York Times’articles between January 1,
2000 and December 15, 2006. They were also all signers of Dill’s “Resolution on Electronic Voting,” and many of
them have close professional connections. An article counted as one mention if the person (or concept of touch
screen voting) was mentioned once or several times. The same article could count twice (or more) if two (or more)
critics were mentioned.
26 Pastor was an especially important political scientist because he was a senior advisor to the Carter-Ford
Commission and later organizer of the Carter-Baker Commission.
27 There are some important exceptions such as Ted Selker of MIT and Michael Shamos of Carnegie Mellon.
28 “’I’m deeply concerned about the rush to change voting systems,’ said Kim Alexander, president of the California
Voter Foundation, a nonpartisan group focusing on voting technology. ‘I’m frustrated that the ACLU is doing
everything to ban the (punch-card) systems. They’re not bad systems if they’re used properly (Gathright and
Wildermuth 2003).’”
29 Since Los Angeles County is roughly one-quarter of the total electorate, the statewide figures are inflated by their
inclusion of LA.
30 Parallel monitoring involves taking a random sample of voting machines on election day and entering a known
script of votes into them while video-taping the process. The machine results are then compared with known results
to check for mistakes or fraud. For a description of parallel monitoring see R&G Associates, LLC (2005).
31 See Wand et al (2002) for an example of how to do the analysis by using past voting statistics to predict current
patterns—departures from these patterns may be due to mistakes or fraud.
42
32 Since this is an area where one’s opinion often matters and the senior author has been involved in debates over
voting systems, it may be worth remarking that Brady supports having some kind of voter verification system of
which a paper trail is one possibility. Paper trails might be a useful interim measure to increase trust in electronic
voting systems, but it is not a magic fix for all the problems which ail American voting systems.