Accuracy and Precision of Electro-oculographic...
6
Accuracy and precision of electro-oculographic recording Alvin W. North The transorbital potential varies with eye movement. With skin electrodes and DC recording equipment, eye position and movement can be monitored, and the technique is called electro- oculography. The potential is assumed to be in large part a projection of the corneoretinal potential, known to vary with illumination. With variation of the corneoretinal potential, identical eye movements will not yield the same potential. It was attempted to minimize the effects of changes of the corneoretinal potential as a source of error in electro-oculography. Twenty experiments were conducted on ten test subjects under conditions of stable and un- stable corneoretinal potentials. The possible error due to an unstable corneoretinal potential was demonstrated. Dispersion of the data increased with time since calibration. Within practical limits, error due to an unstable corneoretinal potential can be reduced by calibra- tions every 10 seconds. A nonlinearity of the function of the sine of angular deviation on eye movement potential was observed with symmetrical eye movements of 15 degrees of arc around the midsagittal plane. TL .he electro-oculographic technique of monitoring ocular motility and position of- fers advantages over other methods. These are mainly close linearity over a wide range of eye movements, no attachment to the eye, and recordability in the dark. In 1922 Schott 1 used the potential ap- pearing at periorbital electrodes to indicate eye movement. There was confusion as to the source of this potential until Mowrer, Ruch, and Miller- demonstrated in 1936 that it was the projected resting potential of the eye, first described by DuBois-Rey- mond 3 in 1849. The potential appearing at periorbital electrodes varies with orienta- tion of the eye, and the recording process is called electro-oculography. Aspects of historical development and techniques of From the Departments of Ophthalmology and Physiology, Emory University School of Medi- cine, Atlanta, Ga. This study was supported by Research Grant 02530 and Training Grant 5323 from the National Institute of Neurological Diseases and Blindness, United States Public Health Service. electro-oculography were reviewed by Marg, 3 Shackel, 4 and Kris. 5 Reported in- vestigations of quantitative limitations have been made recently by Mackensen 0 and Shackel. 4 It had been frequently assumed that the electro-oculographically recorded potential depended only on the angular movement of the eye, until Miles 7 and subsequently others 8 ' 10 reported changes of the corneo- retinal potential (CRP) with illumination. Further experiments showed not only monophasic changes but large oscillatory variations of the CRP with a single change in illumination intensity. The oscillation can persist for more than one hour. 1 ' 1 Vi Fig. 1 is an actual record of a damped oscillation of the CRP induced by illumi- nation. Such variations in the CRP will severely affect the reliability of electro- oculographic measurements. The objectives of the present study were to assess sta- tistically the limits of accuracy and pre- cision of electro-oculography, to establish the influence of stabilization of the CRP 343 Downloaded From: http://iovs.arvojournals.org/pdfaccess.ashx?url=/data/journals/iovs/933628/ on 05/18/2018
Transcript of Accuracy and Precision of Electro-oculographic...
Accuracy and precision ofelectro-oculographic recording
Alvin W. North
The transorbital potential varies with eye movement. With skin electrodes and DC recordingequipment, eye position and movement can be monitored, and the technique is called electro-oculography. The potential is assumed to be in large part a projection of the corneoretinalpotential, known to vary with illumination. With variation of the corneoretinal potential,identical eye movements will not yield the same potential. It was attempted to minimize theeffects of changes of the corneoretinal potential as a source of error in electro-oculography.Twenty experiments were conducted on ten test subjects under conditions of stable and un-stable corneoretinal potentials. The possible error due to an unstable corneoretinal potentialwas demonstrated. Dispersion of the data increased with time since calibration. Withinpractical limits, error due to an unstable corneoretinal potential can be reduced by calibra-tions every 10 seconds. A nonlinearity of the function of the sine of angular deviation on eyemovement potential was observed with symmetrical eye movements of 15 degrees of arcaround the midsagittal plane.
TL.he electro-oculographic technique ofmonitoring ocular motility and position of-fers advantages over other methods. Theseare mainly close linearity over a wide rangeof eye movements, no attachment to theeye, and recordability in the dark.
In 1922 Schott1 used the potential ap-pearing at periorbital electrodes to indicateeye movement. There was confusion as tothe source of this potential until Mowrer,Ruch, and Miller- demonstrated in 1936that it was the projected resting potentialof the eye, first described by DuBois-Rey-mond3 in 1849. The potential appearing atperiorbital electrodes varies with orienta-tion of the eye, and the recording processis called electro-oculography. Aspects ofhistorical development and techniques of
From the Departments of Ophthalmology andPhysiology, Emory University School of Medi-cine, Atlanta, Ga.
This study was supported by Research Grant02530 and Training Grant 5323 from theNational Institute of Neurological Diseases andBlindness, United States Public Health Service.
electro-oculography were reviewed byMarg,3 Shackel,4 and Kris.5 Reported in-vestigations of quantitative limitations havebeen made recently by Mackensen0 andShackel.4
It had been frequently assumed that theelectro-oculographically recorded potentialdepended only on the angular movementof the eye, until Miles7 and subsequentlyothers8'10 reported changes of the corneo-retinal potential (CRP) with illumination.Further experiments showed not onlymonophasic changes but large oscillatoryvariations of the CRP with a single changein illumination intensity. The oscillationcan persist for more than one hour.1'1 Vi
Fig. 1 is an actual record of a dampedoscillation of the CRP induced by illumi-nation. Such variations in the CRP willseverely affect the reliability of electro-oculographic measurements. The objectivesof the present study were to assess sta-tistically the limits of accuracy and pre-cision of electro-oculography, to establishthe influence of stabilization of the CRP
343
Downloaded From: http://iovs.arvojournals.org/pdfaccess.ashx?url=/data/journals/iovs/933628/ on 05/18/2018

344 North Investigative OphthalmologyJune 1965
30 min
Fig. 1. Variation of the corneoretinal potential in man with illumination. The indirectly andintermittently (every 10 seconds) recorded potential shows a damped oscillation evoked byan increase of constant illumination (average 400 mL., subtending 40 degrees of arc) follow-ing 90 minutes of dark adaptation. All eye movements were made at 45 degrees of arc.
45°
9 0 ruin dork
Stabilized
Condition
5-30°
angletesls
2minCol
UnstobilizedCond
45°
10 minlight
lion
5-30°
angletesls
L I G H T
Fig. 2. The experimental program used to assessaccuracy and precision of electro-oculography.For details see text.
on accuracy and precision, and to quanti-tate the effect of frequent calibrations.
MethodThe experimental program is shown in Fig. 2.
Tqn test subjects without apparent visual defectcompleted the entire program. Eye movementsWere made over an angle of 45 degrees every10 seconds during 90 minutes of dark adaptation.Oscillations in the corneoretinal potential evokedby unknown illumination conditions prior to thebeginning of the experiment disappeared duringdark adaptation. Thereafter, during the period ofa stabilized CRP ("stabilized condition"), theeye movement potential was recorded over a seriesof test angles. Each eye movement was repeatedten times ("repetitions"). The test angle eyemovements were interspersed with eye movementsover 45 degrees to monitor the CRP, i.e., one eyemovement was made every 5 seconds. Next, eyemovements over 45 degrees of arc were made for2 minutes and the mean of the recorded potentialsserved as a basis for calibration of measurementsrecorded during the next part of the experiment.Illumination commenced then and eye move-ments of 45 degrees were made for 10 minutes,during which time the CRP began to oscillate.Thereafter, the test angle eye movements wererepeated exactly as done previously except that
illumination was turned on and off at random andthe CRP was in an unstabilized state ("un-stabilized condition"). Eye movements of 45 de-grees were interspersed alternately throughoutthe experiment for calibration use. The test sub-jects were thoroughly familiar with the procedure.
Skin electrodes (Ag-AgCl, made by LexingtonSales, Inc., Waltham, Mass., Type C-100) wereplaced 1 cm. from the lateral cantlms of eacheye. The CRP was recorded by means of a DCamplifier and DC rectilinear recorder as de-scribed by Kolder and Brecher.13 The test subjectslay supine with a horizontally oriented bank offixation lights directly overhead. The head wasimmobilized with a contour cushion, with the eyesat a distance of 60.6 cm. from the fixation bank.An automatic timer commanded the sequence ofactivation of pairs of red fixation lights. The lineof sight to the pairs of red lights subtendedangles of 5, 10, 15, 30, and 45 degrees of arcat the eye symmetrically around the midsagittaiplane. Eye movements were made from left toright. To change the illumination an incandescentlight was mounted in front of the test subject.The light source illuminated an opalescent Plexi-glas plate which extended over 7 degrees of arcat a distance of 35 cm. from the eye. Duringdark adaptation the luminance of the Plexiglasplate was less than 0.005 mL.; during illuminationit was 500 mL., measured with, a Pritchardphotometer.
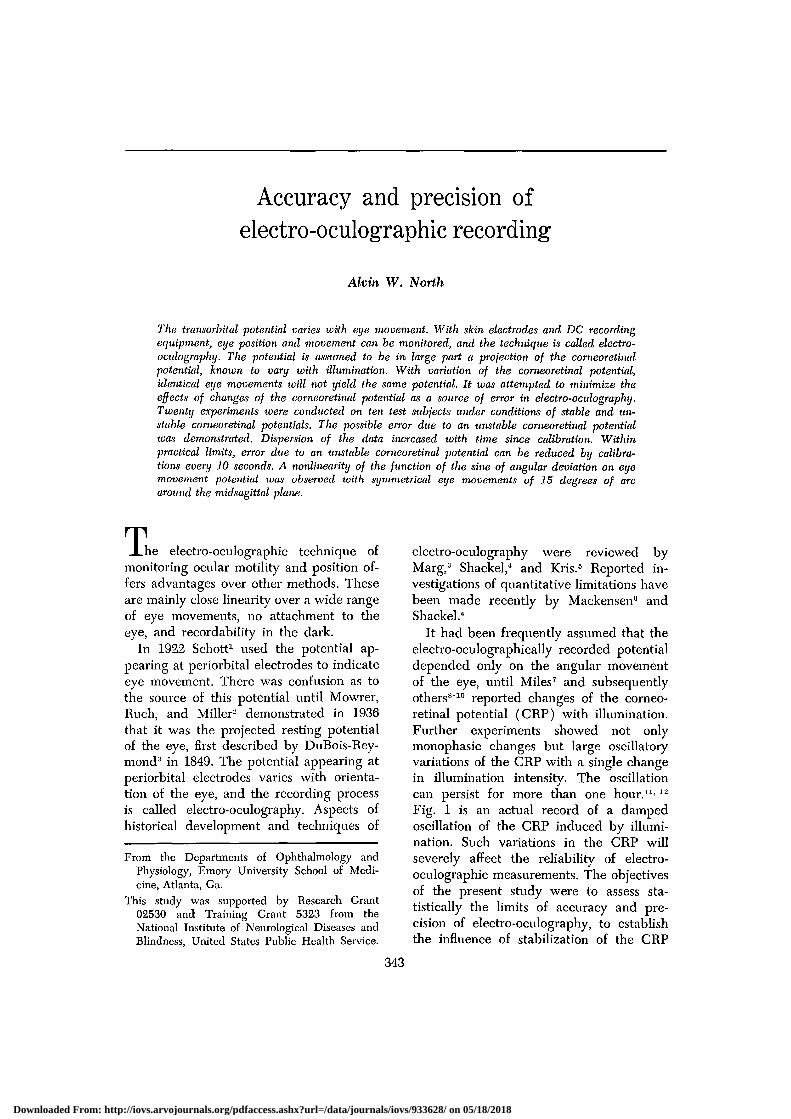
A segment of an actual record appears in Fig. 3.Employment of a seven-power microscope witha micrometer eyepiece translated the deflectionsinto millimeters.
A linear relationship was assumed between therecorded potential and the sine of the angularmovement of the eyes so that:
sine of test angle potential of test anglesine of 45 degrees potential of 45 degrees
or: sine of test angle =potential of test angle * sine of 45 degrees
potential of 45 degreesThe ratio of the potential for each test angle
Downloaded From: http://iovs.arvojournals.org/pdfaccess.ashx?url=/data/journals/iovs/933628/ on 05/18/2018
Volume 4'Number 3
Electro-ocidographic recording 345
45°
10°
r r f r
UUUUUUULJL -L
ImV
10 sec
Fig. 3. A segment of an actual record showing the potential from eye movements over 45degrees of arc for calibration interspersed between potentials from eye movements over 10degrees of arc. Measurements were made every 5 seconds.
and the subsequent calibration angle were calcu-lated and averaged for ten repetitions and thismean was used to calculate the sine of the testangle. From this value the "calculated angle" ofmovement was expressed to the nearest minute ofarc.
ResultsAccuracy is the nearness of the calcu-
lated angle to the known test angle. Pre-cision is a measure of dispersion of data,reported in this paper as standard devia-tion. Error is the difference between thecalculated angle and test angle, and isexpressed in degrees and minutes of arc.The error resulting from a change in thecorneoretinal potential after calibration isshown in Fig. 4. For this graph a ratiowas established between the mean ofmeasurements of the 2 minutes' calibra-tion period (Fig. 2) and the combinedmeasurements of each minute for the next10 minutes in light. The effect of the po-tential change, or the mentioned ratio, onan angle (arbitrarily selected at 10 de-grees ) was determined by multiplication ofthe sine of 10 degrees by the ratio:sine angle resultant =
(potential 45° - stabilized condition)
(potential 45° - unstabilized condition)sine angle arbitrary.
(IDThe resultant sine value was expressed
in degrees and appears for each minutein Fig. 4. The deviation of this angle from10 degrees, and dispersion of data increase
after illumination; and the silhouette of thechart resembles the first portion of adamped oscillation as shown in Fig. 1.The dispersion includes individual varia-tions of amplitude and natural frequencyof the CRP of the ten test subjects.
Fig. 5 is constructed from measurementsof eye movements over 15 degrees of arcunder the unstabilized condition, with aprogressive increase in time between eyemovement and calibration. The same ten15 degree measurements were used inEquation I to derive the data with fivedifferent calibration sets (ten measure-ments) which preceded the test anglemeasurements by intervals of 0.16 to 13.5minutes.
The data from eye movements over fourdifferent test angles under stabilized andunstabilized conditions of the CRP areshown in Fig. 6, excluding individual varia-tions. Calibrations were made every 10seconds. The assumed linear relationshipbetween the sine of the angle and eyemovement potential (insert A) forms thehorizontal reference line for the main fig-ure. No significant difference was foundbetween measurements under the stabilizedcondition and unstabilized condition of theCRP. Seventeen out of 20 of the meansof ten repetitions for 15 degrees of arc re-mained below the line of linear relation-ship between the sine of the angle andthe potential. With the two-sided sign test
Downloaded From: http://iovs.arvojournals.org/pdfaccess.ashx?url=/data/journals/iovs/933628/ on 05/18/2018
346 North Investigative OphthalmologyJune 1965
RESULTANT ANGLEIT c
MEAN ANDTWOSTANDARDDEVIATIONS
ILLUMINATION AFTER
CALI BRAT I ON
nfl
-»*-"-CALIB. I
MINUTES AFTER ILLUMINATION
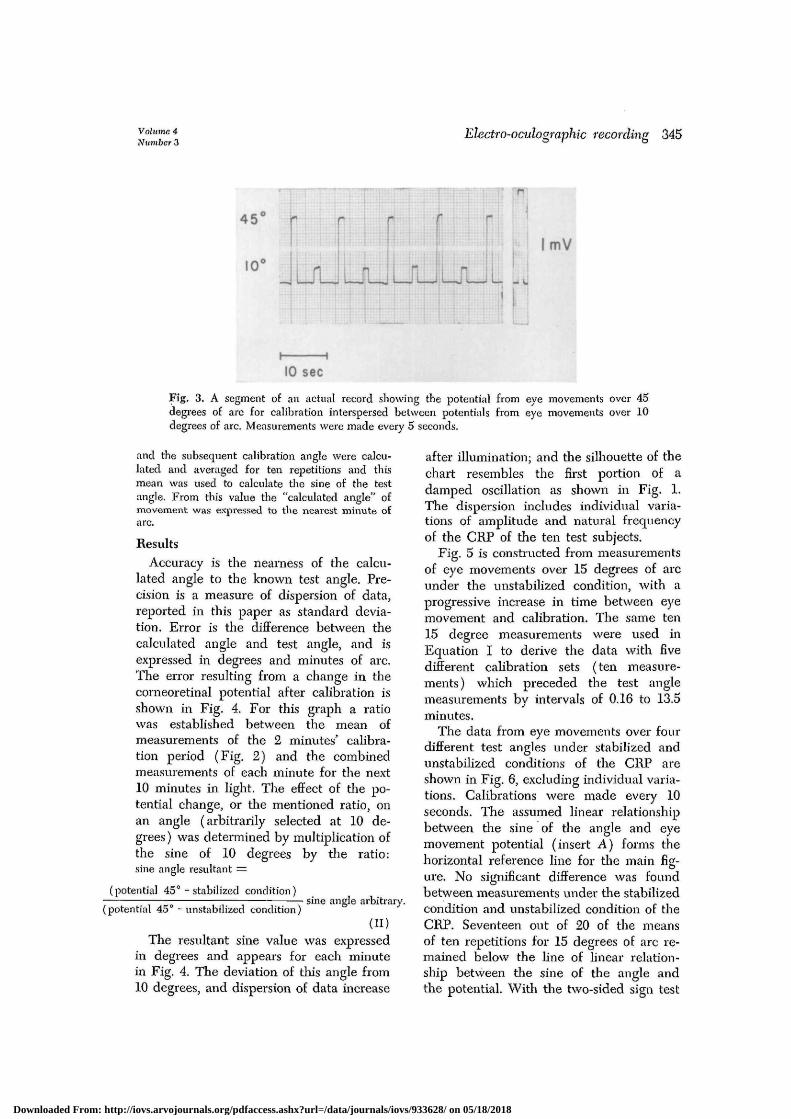
Fig. 4. Error introduced in electro-oculographicmeasurements caused by a variable corneoretinalpotential. The abscissa represents time after com-mencement of illumination following 100 minutesof dark adaptation. The average of 12 measure-ments during the last 2 minutes of dark adapta-tion was used for calibration. The ordinate repre-sents of the effect of a change of the corneo-retinal potential on an arbitrary angle (10 de-grees), derived from Equation II. The barsrepresent - 1 standard deviation.
TWO STANDARD DEVIATIONS
7
6
.. 5UNSTABILIZEDCONDITION
INTERVAL BETWEEN TEST ANGLE AND CALIBRATION
Fig. 5. Dispersion of data from measurements ofeye movements over 15 degrees of arc, dependingon time since calibration with the corneoretinalpotential in unstabilized condition, including in-dividual variation. The abscissa represents timeon a logarithmic scale and the ordinate, standarddeviation in degrees of arc. The bars representtwo standard deviations.
by van der Waerden and Nievergelt,14 thisresult signifies a deviation from linearity.
Discussion
The total error of measurement of eyeposition by electro-oculography may in-
clude errors due to electrical artifacts inthe amplifier and recorder, electricalchanges at the electrodes, variations in theconductivity of the medium between theeye and electrodes, fixation disparity, headmovements, and a variable corneoretinalpotential. Efforts were made to reduce thecontrollable variables and effects of theuncontrollable factors were consideredminimal. The D.C. amplifier with filter hasa shorted input noise level of 5 mv. and isattenuated 3 db at 20 c.p.s. ReversibleAg-AgCl electrodes were selected forminimal noise and drift. Psychogalvanicskin responses can cause apparent eyemovements as error in electro-oculogra-phy.15 All input to the amplifier was re-duced to zero by an automatic electronicdevice of negative feedback, and it wasinactivated only at the instant of each eyemovement. This mechanism ensured a sta-ble base line and minimized random eventswhich were amplified only when they oc-curred during eye movements. The zeromechanism also eliminated events occur-ring between measurements, i.e., blinks.The effects of fixation disparity and "elec-trical rider artifacts"1C were minimized bymeasurement of the deflection at the finalposition and not at over or undershoots.An attempt was made in the present ex-periment to demonstrate and minimize theeiTor due to a variable CRP.
Error due to variation in the CRP ispossible if the magnitude and duration ofvariation are not known. Kris17 stated thatelectro-oculography can be used withoutrecalibration only as long as the magni-tude of variation remains below a pre-selected level. Ry frequent monitoring ofthe CRP, every 10 seconds, the error dueto variations in the CRP was minimized.A t test analysis of the means obtainedduring stabilized and unstabilized condi-tions (not including the variance of repe-titions) showed no significant differenceat the level P = 0.05. An eye movementevery 5 seconds represents about the tech-nical limit for programming repetitive eyemovements necessary for indirect record-
Downloaded From: http://iovs.arvojournals.org/pdfaccess.ashx?url=/data/journals/iovs/933628/ on 05/18/2018

Volume 4Number 3
Electro-oculographic recording 347
DEVIATION FROM LINEAR FUNCTION
60
Poteni
50
40
30
20
10
0
10
20
30
40
50
60
70
A.
m
Angle
MEAN AND TWOSTANDARD DEVIATIONS:
• StabiIi zed Condition
- Unstabi I ized Condition
I |
II1I
-m-
10 15
TEST ANGLES IN DEGREES OF ARC
30
Fig. 6. Deviation of accuracy and precision of the electro-oculographically recorded eye move-ments from the linear relationship between sine of angle of eye movement and the recordedpotential (insert A). The abscissa represents the test angles subtended at the eyes betweenpairs of fixation lights, and the ordinate, deviations in minutes of arc. The individual meansof ten measurements were used for calculation of interindividual variation. Individual varia-tions are not included.
ing of the CRP. Lengthening the intervalbetween calibration and angle test not onlyreduces accuracy, but decreases precisionas shown in Fig. 5.
Fig. 6 indicates accuracy and precisionof the calculated angles. Including repeti-tions and the angle demonstrating thegreatest dispersion (30 degrees, includingrepetitions), 95 per cent of all measure-ments (800 eye movements) would fallwithin ±1.8 degrees of the various testangles. This includes the unstabilizedportion of the experiment when the CRPwas widely varying (as indicated in Fig. 5).However, the greatest error of a calculatedangle mean (15 degrees) is 40 minutes ofarc (stabilized condition) (Fig. 6). Forangle deviations up to 30 degrees, Shackel4
reported that 95 per cent of his data ob-served fell within ±1.2 degrees of the testangles (3 repetitions at each angle, 97
test subjects). Mackensen0 (5 repetitions,6 test subjects) reported his error in percent at various angles tested. His reportedstandard deviation ranged from 1.4 to 2.4degrees of arc for eye movements over an-gles from 10 to 40 degrees. Both authorsassumed a linear relationship between theangle of eye movement and potential re-corded. The status of variability of theCRP is unspecified in both mentioned in-vestigations. Seventeen out of 20 meansof the potential of 15 degree test anglemeasurements are below the mean repre-sentative of the actual test angle. Repeatedmeasurements ruled out an error in theposition of the 15 degree fixation lights.This result supports the concept that re-corded potentials of eye movements arenot a linear function of the sine of angu-lar deviation of the eye. Law and Deva-lois18 concluded from their experiments
Downloaded From: http://iovs.arvojournals.org/pdfaccess.ashx?url=/data/journals/iovs/933628/ on 05/18/2018

348 North Investigative Ophthalmology]une 1965
that there is apparently a curvilinearmonotonic relationship between the re-corded potential and the angular devia-tion of the eye, the relationship being morepronounced for test subjects yielding largerperiorbital skin potentials. In their figuresof potential plotted against angular devia-tion, a striking similarity to the results ofthe present experiment is noted. At 15degrees the measurements are below thelinear function line and at greater anglesabove the line. This fact is additional evi-dence to support the nonlinear functionbetween the angle or sine of the angleand the recorded potential. This functionmay be specific and predictable for indi-viduals, once carefully plotted. Shackel4
too noted a different sine angle-potentialrelationship between some test subjects,and speculated on individual anatomicalvariations, though Shackel, as in the pres-ent study, assumed the theoretical rela-tionship to be linear to the sine of angulardeviation.
The present experiment demonstratesthat frequent calibrations improve test an-gle determinations. The maximum time in-terval between calibration and the angletests depends on the accuracy and preci-sion desired. By adaptation of the test sub-jects to the illumination of the test site, thecorneoretinal potential can be stabilizedand this will allow a longer interval be-tween calibrations. Environmental factorssuch as noise or distraction may adverselyaffect the stability of the CRP. A nonlinear-ity between the sine or the angular devia-tion of the eyes and the recorded potentialduring electro-oculography is observed.
The biometrical advice of Dr. Lewis Homer andthe technical assistance of Patricia Martinez weregreatly appreciated.
REFERENCES
1. Schott, E.: Ueber die Registrierung desNystagmus und anderer Augenbewegungenvermittels des Saitengalvanometers, Klin. med.140: 79, 1922.
2. Mowrer, O. H., Ruch, T. C, and Miller,
N. E.: The corneo-retinal potential differenceas the basis of the galvanometric method ofrecording eye movements, Am. J. Physiol.114: 423, 1936.
3. Marg, E.: Development of electro-oculog-raphy, Arch. Ophth. 45: 169, 1951.
4. Shackel, B.: Pilot study in electro-oculog-raphy, Brit. J. Ophth. 44: 89, 1960.
5. Kris, C : Vision: Electro-oculography, InGlasser, O., editor: Medical physics, vol. 3,Chicago, 1960, Year Book Publishers, Inc.,pp. 692-700.
6. Mackensen, C , and Harder, S.: Untersuch-ungen zur elektrischen Aufzeichnung vonAugenbewegungen, von Graefes Arch. Ophth.155: 397, 1954.
7. Miles, W.: Modification of the human-eyepotential by dark and light adaptation, Sci-ence 91: 456, 1940.
8. Aserinsky, E.: Effects of illumination andsleep upon amplitude of electro-oculogram,Arch. Ophth. 53: 542, 1955.
9. ten Doesschate, C , and ten Doesschate, J.:The influence of the state of adaptation onthe resting potential of the human eye, Oph-thalmologica 132: 308, 1956.
10. Francois, J., Verriest, C , and De Rouck, A.:Modification of the amplitude of the humanelectro-oculogram by light and dark adap-tation, Brit. J. Ophth. 39: 398, 1955.
11. Kolder, H.: Spontane und experimentelleAenderungen des Bestandpotentials desmenschlichen Auges, Pfluegers Arch, gesPhysiol. 268: 258, 1959.
12. Kris, C : Corneo-fundal potential variationsduring light and dark adaptation, Nature182: 1027, 1958.
13. Kolder, H., and Brecher, G. A.: Automaticrecording of the corneo-retinal potential ofthe human eye, Fourth Intermit. Conf. onMed. Electronics, New York, 1961, Digest,p. 78.
14. van der Waerden, B. L., and Nieverjrelt E.:Tables for comparing two samples by X-testand sign test, Berlin, Gottingen, Heidelberg,1956, Springer-Verlag.
15. Byford, G. H.: Non-linear relations betweenthe corneo-retinal potential and horizontal eyemovements, J. Physiol. 168: 14P, 1963.
16. Ford, A.: Significance of terminal transientsin electro-oculographic recordings, Arch.Ophth. 61: 899, 1959.
17. Kris, C.: A technique for electrically record-ing eye position, WADC Technical ReportNo. 58-660, 1958.
18. Law, T., and Devalois, R. L.: Periorbitalpotentials recorded during small eye move-ments. Papers of the Michigan Academyof Science, Arts, and Letters 43: 171, 1958.
Downloaded From: http://iovs.arvojournals.org/pdfaccess.ashx?url=/data/journals/iovs/933628/ on 05/18/2018


![The FLUKA code: description and benchmarking€¦ · since more than 17 years FLUKA can handle with similar or better accuracy electro magnetic effects [8]. Briefly, the energy range](https://static.fdocuments.net/doc/165x107/5fd547d5a804e81cdf3ba885/the-fluka-code-description-and-benchmarking-since-more-than-17-years-fluka-can.jpg)