Assess the Potential for Accumulation of Toxic Trace Elements in

Page 1 of 12
ENVIRONMENTAL CHEMISTRY, POLLUTION & WASTE MANAGEMENT | RESEARCH ARTICLE
Accumulation of toxic metals in fish raised from sewage-fed aquaculture and estimated health risks associated with their consumptionGodfred Darko, David Azanu and Nelson Kwame Logo
Cogent Environmental Science (2016), 2: 1190116
Darko et al., Cogent Environmental Science (2016), 2: 1190116http://dx.doi.org/10.1080/23311843.2016.1190116
ENVIRONMENTAL CHEMISTRY, POLLUTION & WASTE MANAGEMENT | RESEARCH ARTICLE
Accumulation of toxic metals in fish raised from sewage-fed aquaculture and estimated health risks associated with their consumptionGodfred Darko1*, David Azanu1 and Nelson Kwame Logo1
Abstract: We determined the health risks associated with the consumption of toxic metals in fish raised from a sewage-fed aquaculture. Concentrations of toxic met-als in fish, water and sediments in the waste stabilization ponds were determined using atomic absorption spectrophotometer. All the fish samples had some amount of toxic metals in them. The maximum concentrations of lead, cadmium, copper, chromium and mercury in the water samples were 28.7, 18.2, 246.0, 310.0 and 150.0 μg/kg, respectively, which were all below the US-EPA limits. The maximum concentrations of Pb, Cu, Cr and Hg in all sediment samples are 27.4, 323.0, 240.0 and 150.0 μg/kg, respectively. The maximum concentrations of Pb, Cd, Cu, Cr and Hg in the fish samples were 48.6, 18.9, 434.0, 300.0 and 320 μg/kg, respectively, which were below the EU maximum residual limit. The estimated daily intake calculated ranged from 1.0 × 10⁻⁶ to 6.0 × 10⁻⁵ mg/kg/day. Mercury showed the highest health risk, while Pb had the lowest. None of the risk indexes was up to 1, indicating that human beings who consume fish from the ponds are not be exposed to health risks as far as toxic metals are concerned.
Subjects: Environment & Agriculture; Nanoscience & Nanotechnology; Physical Sciences
Keywords: heavy metals; wastewater; sewage; sediment; health risk index
1. IntroductionAgricultural reuse of untreated, partially treated and diluted wastewater is a common reality in and around three out of four cities in low-income countries (Keraita, 2008). It is practiced in both dry and wet climates, mostly as an informal activity. The economic benefits derived from reuse of
*Corresponding author: Godfred Darko, Department of Chemistry, Kwame Nkrumah University of Science and Technology, Kumasi, Ghana. E-mails: [email protected]; [email protected]
Reviewing editor:Carla Aparecida Ng, University of Pittsburgh, USA
Additional information is available at the end of the article
ABOUT THE AUTHORSGodfred Darko is a senior lecturer in analytical chemistry at Kwame Nkrumah University of Science and Technology, Ghana.
David Azanu is a doctoral student at Kwame Nkrumah University of Science and Technology, Ghana.
Nelson Kwame Logo is a Bachelor of Science candidate at Kwame Nkrumah University of Science and Technology, Ghana.
PUBLIC INTEREST STATEMENTSome metals, called essential metals, are needed in small quantities in our bodies to function. However, the toxic metals have no use in the body and even poison the body. In this paper, we worked out the extent to which the poisonous metals in fish reared in sewage water could affect the health of those who consume the fish. All the fish we took had some amount of toxic metals in them but their quantities were lower than those that could harm the human body. This shows that those who consume the fish reared in the pond systems we investigated are not exposed to health hazards as far as the metals in the fish is concerned.
Received: 05 December 2015Accepted: 11 May 2016First Published: 16 May 2016
© 2016 The Author(s). This open access article is distributed under a Creative Commons Attribution (CC-BY) 4.0 license.
Page 2 of 12

Page 3 of 12
Darko et al., Cogent Environmental Science (2016), 2: 1190116http://dx.doi.org/10.1080/23311843.2016.1190116
wastewater include its reliable flow, nutrient recovery, contributions to urban food supply and safe-guarding of livelihoods (Drechsel, Scott, Raschid-Sally, Redwood, & Bahri, 2009). However, health risks to farmers and consumers, such as worm infections, diarrhoea and disorders of the nervous system due to toxic metals are major possible drawbacks, limiting formal recognition and support of wastewater reuse. In several instances, raw wastewater is used in irrigation and for fish farming (Drechsel, Graefe, Sonou, & Cofie, 2006).
Waste stabilization ponds are the most common type of low-cost natural sewage treatment plants. They are usually designed to remove heavy metals and other contaminants in wastewater through adsorption to suspended matter and precipitation (Mara, 2000). They comprise a series of engineered basins through which the wastewater flows by gravity, usually over a period of several weeks. Waste stabilization ponds often emerge as the least costly wastewater and faecal sludge treatment option (Mara, 2000). In a properly functioning system, the water in the tertiary (or matu-ration) ponds and the final effluent should meet applicable standards for in situ aquaculture, and for discharge to the environment or cultivated land (Von Sperling & Chernicharo, 2005; WHO, 2006a). Reuse of sewage effluent for aquaculture has been advocated recently due to scarcity of water re-source. In India for example, there are about 254 fisheries, producing over 8,000 tons of fish per year using sewage effluent water also termed as sewage-fed aquaculture (Nandeesha, 2002).
The use of waste stabilization ponds for commercial fish farming has been adopted in Ghana to justify the occupancy of the ponds on scarce urban land (Azanu, JØrgensen, Darko, & Styrishave, 2016; Tenkorang, Yeboah-Agyepong, Buamah, Agbo, Chaudhry & Murray , 2012). In Kumasi, the second largest city in Ghana, all sewage treatment ponds are waste stabilization ponds. They in-clude three community-scale waste stabilization ponds (in Asafo, Ahensan and Chirapatre suburbs) and a municipal-scale faecal sludge stabilization pond system (in Dompoase). The maturation ponds of the two community-scale waste stabilization ponds at Ahensan and Chirapatre have been con-verted to sewage-fed aquaculture. Water in the maturation ponds would inevitably contain con-taminants such as toxic metals. If the treated wastewater is used for aquaculture, then it is obviously necessary to monitor the concentrations of toxic compounds accumulated in the fish produced by the aquaculture. This is crucial to avert possible health effects to consumers.
Toxic metals that are especially toxic to aquatic organisms and humans are mercury, cadmium, chromium and lead. Low concentrations of metals dissolved in the water are absorbed into fish tis-sues and bio-concentrate to toxic levels. Metal toxicity produces adverse biological effects on an organism’s survival, activity, growth, metabolism or reproduction (Wright & Welbourn, 2002). Metal contamination in fish, soil, water and vegetables has reached unprecedented levels in some parts of Africa (Yabe, Ishizuka, & Umemura, 2010). As a result, human exposure to toxic metals has become a major health risk. Chronic intake of heavy metals, above their safe threshold in humans and ani-mals, has damaging effects and can cause non-carcinogenic hazards such as neurologic involve-ment, headache and liver disease (John & Andrew, 2011; Lai et al., 2010; Zheng, Wang, & Zheng, 2007). Dietary cadmium intake due to consumption of environmentally contaminated rice and other foods was associated with an increased risk of post-menopausal breast cancer (Hiroaki et al., 2013). Copper on the other hand is a required microelement but affects human organs upon excessive ab-sorption (Kramer et al., 2001).
Excess Pb is known to reduce the cognitive development and intellectual performance in children and to increase blood pressure and cardiovascular disease incidence in adults (EU, 2006). Mercury is a neurotoxic poison that causes neurobehavioral effects (especially on psychomotor coordination), neuroendocrine, renal damage and gastrointestinal toxicity (Standardization Administration China/Ministry of Health, China, 2005). The objective of this study was to determine the concentrations of toxic metals in the muscles of Clarias gariepinus (African Sharptooth catfish) reared in sewage-fed aquaculture in order to estimate the health risks associated with its consumption.

Page 4 of 12
Darko et al., Cogent Environmental Science (2016), 2: 1190116http://dx.doi.org/10.1080/23311843.2016.1190116
2. Materials and methods
2.1. Reagents and glasswareAll glassware used were washed with detergent, rinsed with tap water, soaked in 10% nitric acid overnight and afterwards rinsed with distilled water before drying. All chemicals used were analyti-cal grade. Nitrate salts (purity > 99.9%) of Cd, Pb, Cu, Cr and Hg (Merck Chemicals, Germany) were used to prepare 1,000 mg/L stock solutions and serial dilutions (working solutions) prepared from them.
2.2. Site descriptionTwo waste stabilization ponds located in two communities in the Kumasi metropolis (Figure 1), were investigated. Kumasi is the second largest city in Ghana and had a human population of 2 million (Ghana Statistical Service, 2012). The waste stabilization ponds located at Ahensan in Kumasi were designed to handle sewage from the suburb. Currently about 200 houses, with an estimated popula-tion of 1,500, have been connected to the facility (Tenkorang, et al., 2012). The Ahensan waste sta-bilization ponds comprise an anaerobic pond, one facultative pond and two maturation ponds. The maturation ponds are used for aquaculture. The effluents from the waste stabilization ponds are discharged into the Wiwi River through a nearby stream which is used for vegetable irrigation down-stream (see Figure 2(a)).
Chirapatre waste stabilization ponds comprise an anaerobic pond, two facultative pond and two maturation ponds. The Chirapatre waste stabilization ponds are situated in the Chirapatre township with the sewer lines connected to 300 household serving an estimated population of 1,800 people (Tenkorang, et al., 2012). The main pollutants that go into the waste stabilization ponds are soaps and detergents, oil and greases, human excreta and solid wastes that are washed down the drains. The maturation ponds are used for aquaculture (see Figure 2(b)).
2.3. Sampling and sample preparationSixty-one samples of fish, water and sediment were collected in one sampling campaign from the waste stabilization ponds in January 2014. Permission was obtained from the Kumasi Metropolitan
Figure 1. The map of Kumasi showing the Ahensan and Chirapatre suburbs.

Page 5 of 12
Darko et al., Cogent Environmental Science (2016), 2: 1190116http://dx.doi.org/10.1080/23311843.2016.1190116
Assembly—Waste Management Division to catch fish from the waste stabilization ponds and ethical clearance for this study was obtained from the Committee on Human Research Publication and Ethics, KNUST. Sampling was carried out in accordance with the American Public Health Association (APHA) standard method 9221 for examination of water and wastewater (American Public Health Association, American Water Works Association, Water Environment Federation, 1999). Composite water samples (200 mL each, pooling 5 aliquots collected from the same site in 1 h intervals) were fetched from influents of each waste stabilization pond. A total of 10 water samples were separately collected into 1 L plastic bottles and each acidified with 5 mL of nitric acid.
Sediment sampling was carried out in accordance with the United Nations Environment Programme’s reference method for sediment pollution studies (UNEP method number RSRM 20)(UNEP, 1992). Composite sediment samples from each study pond were collected into pre-cleaned polythene bag using a stainless van-ven grab, air dried and then sieved with 2 mm mesh screen.
The fish samples were caught from the maturation pond of each waste stabilization pond using dragnet. The samples were then kept in an ice-chest containing ice blocks and transported to the laboratory where they were kept in a deep freezer at −4°C until analysis. The frozen fish samples were thawed and portions of muscle tissue cut out, homogenized prior to acid digestion (Aderinola, Clarke, Olarinmoye, Kusemiju, & Anatekhai, 2012).
Figure 2a. Schematic diagram of Ahensan waste stabilization ponds (Azanu et al., 2016).
Figure 2b. Schematic diagram of Chirapatre waste stabilization ponds (Azanu et al., 2016).

Page 6 of 12
Darko et al., Cogent Environmental Science (2016), 2: 1190116http://dx.doi.org/10.1080/23311843.2016.1190116
2.4. Digestion of samplesA portion (0.5 g) of homogenized fish or sediment samples was placed in 50 mL digestion tube and 1 mL H2O, 2 mL HCl, 5 mL of 1:1HNO3:HClO4 were added. Samples were then heated in a digestion block on a hotplate at 200°C until clear solutions were obtained. The digests were left to cool, filtered into 50 mL volumetric flask and diluted to 50 mL mark with distilled water (Akagi & Nishimura, 1991). An aliquot of 1 L water sample was digested with 5 mL concentrated nitric acid to a final volume of about 25 mL. The digest was left to cool. It was then filtered into 50 mL volumetric flask and diluted to 50 mL mark with distilled water.
2.5. Heavy metals determinationConcentrations of Pb, Cd, Cr and Cu were determined using Perkin Elmer Spectra AA 220 flame atom-ic absorption spectrophotometer (Perkin Elmer Ltd, USA). An automatic mercury analyzer model HG-5000 (Sanso Seisakusho Co., Ltd, Japan), operating at a wavelength of 253.7 nm was used to determine Hg concentration in samples (Voegborlo & Akagi, 2007).
2.6. Target hazard quotient (THQ)The method of estimating estimated daily intake (EDI) was provided by the US-EPA Region III risk-based concentration table (US EPA, 2009) and Wang, Sato, Xing, and Tao (2005). EDI of each toxic metal was calculated using the Equation (1):
where EF is the exposure frequency (365 days/year); ED is the exposure duration, equivalent to aver-age lifetime (64 years for Ghanaian population); FIR is the fresh food ingestion rate (g/person/day), which was considered to be 48 g/person/day for fish (Ali & Hau, 2001); Cf is the conversion factor (0.208) for fresh weight (FW) to dry weight (DW), Cm is the heavy metal concentration in foodstuffs (μg/kg FW); WAB is the average body weight (average adult body weight was considered to be 75 kg) and TA is the average exposure time for non-carcinogens (equal to EF × ED) (Saha & Zaman, 2012).
Health risk of consumers due to intake of metal in fish was assessed by using THQ in accordance with US-EPA Region III risk-based concentration table (US EPA, 2009) and Bortey-Sam et al. (2015). If THQ is less than 1 then the exposed population is unlikely to experience adverse effects; whereas THQ greater than 1 indicates a likelihood of non-carcinogenic effects, with an increasing probability as the value increase (Wang et al., 2005). THQ was calculated using the Equation (2):
where the reference oral doses (RfD) for Pb, Cd, Cu, Cr and Hg are 1.4 × 10⁻¹, 1.0 × 10⁻³, 4. × 10−2, 1.5 × 10⁻³ and 4.0 × 10⁻⁴ mg/kg/day, respectively (US EPA, 2009).
2.7. Analytical quality assuranceCalibration curves were prepared for various elements using triplicates of standard solutions ranging from 0.0 to 5.0 mg/L. Detection limit was determined based on the standard deviation and the slope of the calibration curves (ICH Harmonised Tripartite Guideline, 2005). Spike recovery was performed for the elements by adding 50 mg metals mixture to 0.1 g homogenized fish samples. The amount recovered was then calculated. Precision of the instrument was determined by running one sample eight times and calculating the percent coefficient of variation. Linearity of the analytical procedure was evaluated by calculation of a regression line by the method of least squares.
2.8. Statistical analysesThe results obtained were subjected to statistical evaluation. The mean, standard deviation (SD) and coefficient of variation (CV%) were evaluated with Microsoft Office Excel 2013 (Version 15, Microsoft, USA). Pearson’s correlation coefficient was performed as a measure of dependence of toxic metals in fish with fish length and size. The closer the coefficient is to either −1 (decreasing linear relation-ship) or +1 (direct linear relationship), the stronger the correlation between the variables.
(1)EDI = (EF× E
D× F
IR× C
f× C
m)∕(W
AB× T
A)
(2)HQ = EDI∕RfD

Page 7 of 12
Darko et al., Cogent Environmental Science (2016), 2: 1190116http://dx.doi.org/10.1080/23311843.2016.1190116
Non-parametric test (t-test) to compare toxic metals concentrations in water from the two waste stabilization ponds was performed. The p values calculated, test the null hypothesis that the two waste stabilization ponds have the same distribution. The p value was considered statistically signifi-cant at p < 0.05. Pearson’s correlation coefficient and non-parametric test were performed by using GraphPad Prism version 5.01 for Windows (GraphPad Software Inc., USA).
3. Results and discussionThe recoveries, regression coefficients and detection limits of the analysis are presented in Table 1. Recoveries of the spiked elements ranged from 95 to 99%. The detection limits ranged from 0.001 to 0.006 μg/kg. The regression coefficients ranged from 97 to 99%. The precision expressed as percent coefficient of variation ranged from 3 to 5%.
3.1. Concentrations of toxic metal in waterConcentrations of Pb, Cd, Cu, Cr, and Hg in water from Ahensan and Chirapatre waste stabilization ponds are presented in Table 2, with US EPA guideline thresholds for short- and long-term reuse of wastewater. Concentrations of Pb, Cd, Cu, Cr and Hg in water from Ahensan ranged from 21.3 to 26.1, 14.6 to 15.6, 232.0 to 246.0, 120.0 to 310.0 and 1.1 to 2.0 μg/L, respectively. The concentrations of Pb, Cd, Cu, Cr and Hg in water from Chirapatre ranged from 26.9 to 28.7, 14.9 to 18.2, 216.0 to 222.0, 180.0 to 250.0 and 0.9 to 1.4 μg/L, respectively. The maximum concentration of Pb, Cd, Cu, Cr and Hg in the water samples are 28.7, 18.2, 246.0, 310.0 and 2.0 μg/L, respectively, which were all below the US-EPA thresholds for short-term reuse of wastewater of 10,000.0, 50.0, 5,000.0 and 1,000.0 μg/L, respectively(US EPA, 2012). However, Cd and Cr concentrations in all water samples analysed were above the US EPA thresholds for long-term reuse of wastewater (Table 2). Therefore, Cd and Cr could bio-concentrate in fish due to long-term use of sewage-fed aquaculture. The con-centrations of toxic metals could be due to natural sources, surface run-off and wastewater from the estate houses connected to the waste stabilization ponds.
Mwakaboko and colleagues determined the mean concentrations of Pb, Cu and Cr in the influents of waste stabilization ponds at University of Dar es Salaam main campus to be 51.7, 6.7 and <1 μg/L (detection limit), respectively (Mwakaboko, Lugwisha, & Kayogolo, 2014). They also determined the mean concentrations of Pb, Cu and Cr in the effluents of waste stabilization ponds at University of Dar es Salaam main campus to be 51.7, <1 (detection limit) and <1 μg/L (detection limit), respec-tively (Mwakaboko et al., 2014). The concentration of Pb found in influents and effluents samples from waste stabilization ponds at University of Dar es Salaam main campus were higher than the ones obtained in this study. The differences in concentrations could be due to the population size, run-offs and quality of water used and many other factors pertaining in two different countries. The mean concentrations of Cu, Pb and Cd, 10,970.0, 93,330.0 and 2,230.0 μg/L, respectively (Maiti & Banerjee, 2012), determined in wastewater in waste stabilization ponds used in sewage-fed aqua-culture in the East Kolkata Wetlands in India are higher than those in the present in Ghana. The high concentrations of toxic metals found in the waste stabilization ponds in the wetlands could be at-tributed the large volumes of wastewater, sewage, storm water and effluents from the thousands of industries that shed into the wetlands.
Table 1. Recoveries, regression co-efficiencies and detection limits of toxic metals measuredElement Detection limits
(μg/kg)Recovery (%) Regression
coefficient (R2) (%)
Precision (%CV)
Pb 0.001 97 99 3
Cd 0.002 95 98 4
Cu 0.003 98 99 5
Cr 0.006 96 99 4
Hg 0.005 95 97 4

Page 8 of 12
Darko et al., Cogent Environmental Science (2016), 2: 1190116http://dx.doi.org/10.1080/23311843.2016.1190116
Tabl
e 2.
Con
cent
ratio
ns o
f tox
ic m
etal
s in
sed
imen
ts, fi
sh a
nd w
ater
in w
aste
sta
biliz
atio
n po
nds
from
Kum
asi
Not
e: S
edim
ent a
nd fi
sh s
ampl
es w
ere
mea
sure
d in
(μg/
kg) w
hile
wat
er in
(μg/
L).
Elem
ent
Ahen
san
was
te s
tabi
lizat
ion
pond
sCh
irapa
tre
was
te s
tabi
lizat
ion
pond
sM
axim
um
resi
due
limit
for
fish
(EC,
20
06)
Guid
elin
es fo
r w
aste
wat
er re
use
(Mw
akab
oko
et a
l.,
2014
)
Guid
elin
es fo
r sed
imen
t (W
HO,
2006
)
Sedi
men
t W
ater
Fish
Sedi
men
tW
ater
Fish
Shor
t te
rmLo
ng te
rmNo
t po
llute
dM
oder
atel
y po
llute
dHe
avily
po
llute
dPb
26.5
± 0
.4
(26.
2–27
.1)
24.1
± 2
.0
(21.
3–26
.1)
41.3
± 3
.2
(36.
7–48
.6)
25.5
± 1
.1
(24.
7–27
.4)
27.8
± 0
.6
(26.
9–28
.7)
33.3
± 2
.1
(23.
5–36
.1)
300.
010
,000
.05,
000
<40,
000
40,0
00–6
0,00
0>6
0,00
0
Cd16
.3 ±
1.7
(1
4.7–
18.1
)15
.0 ±
0.5
(1
4.6–
15.6
)14
.9 ±
2.1
(1
2.0–
18.9
)13
.4 ±
0.7
(1
2.5−
14.2
)16
.4 ±
1.3
(1
4.9–
18.2
)16
.6 ±
1.3
(1
0.8–
18.4
)50
.050
.010
.0–
–>6
,000
Cu31
3.5
± 11
.0
(299
.0–3
23.0
)23
8.8
± 5.
7 (2
32.0
–246
.0)
350.
4 ±
42.2
(2
91.0
–434
.0)
247.
4 ±
4.9
(241
.0–2
53.0
)21
8.6
± 2.
4 (2
16.0
–222
.0)
304.
4 ±
62.6
(2
12.0
–432
.0)
20,0
00.0
5,00
0.0
200.
0<2
5,00
025
,000
–50,
000
>50,
000
Cr20
5.0
± 12
.9
(190
.0–2
20.0
)20
2.5
± 82
.6
(120
.0–3
10.0
)21
0.0
± 47
.4
(120
.0–3
00.0
)21
4.0
± 20
.7
(190
.0–2
40.0
)21
0.0
± 27
.4
(180
.0–2
50.0
)72
.7 ±
56.
1 (1
0.0–
180.
0)1,
000.
01,
000.
010
0.0
<25,
000
25,0
00–7
5,00
0>7
5,00
0
Hg
115.
0 ±
20.8
(9
0.0–
140.
0)1.
7 ±
0.4
(1.1
–2.0
)28
3.6
± 27
.8
(217
.0–3
20.0
)12
6.0
± 18
.2
(100
.0–1
50.0
)1.
1 ±
0.2
(0.9
–1.4
)23
1.1
± 19
.9
(203
.0–2
78.0
)1,
000.
0–
–1,
100
––
Page 9 of 12
Darko et al., Cogent Environmental Science (2016), 2: 1190116http://dx.doi.org/10.1080/23311843.2016.1190116
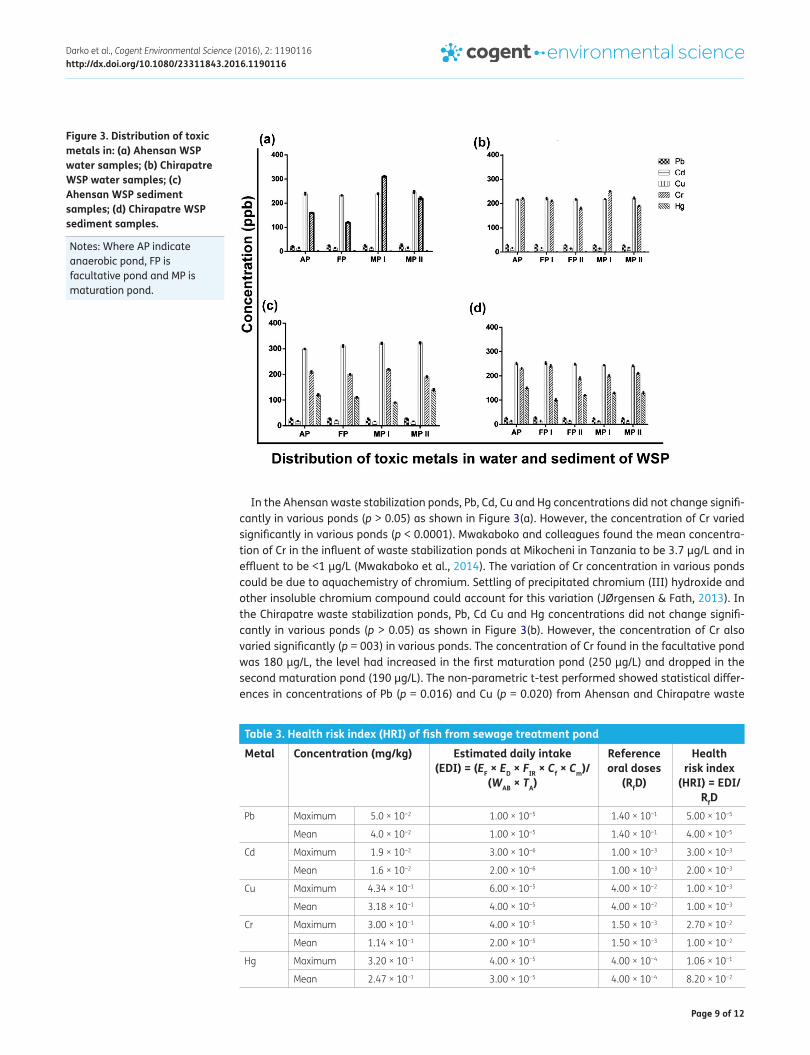
In the Ahensan waste stabilization ponds, Pb, Cd, Cu and Hg concentrations did not change signifi-cantly in various ponds (p > 0.05) as shown in Figure 3(a). However, the concentration of Cr varied significantly in various ponds (p < 0.0001). Mwakaboko and colleagues found the mean concentra-tion of Cr in the influent of waste stabilization ponds at Mikocheni in Tanzania to be 3.7 μg/L and in effluent to be <1 μg/L (Mwakaboko et al., 2014). The variation of Cr concentration in various ponds could be due to aquachemistry of chromium. Settling of precipitated chromium (III) hydroxide and other insoluble chromium compound could account for this variation (JØrgensen & Fath, 2013). In the Chirapatre waste stabilization ponds, Pb, Cd Cu and Hg concentrations did not change signifi-cantly in various ponds (p > 0.05) as shown in Figure 3(b). However, the concentration of Cr also varied significantly (p = 003) in various ponds. The concentration of Cr found in the facultative pond was 180 μg/L, the level had increased in the first maturation pond (250 μg/L) and dropped in the second maturation pond (190 μg/L). The non-parametric t-test performed showed statistical differ-ences in concentrations of Pb (p = 0.016) and Cu (p = 0.020) from Ahensan and Chirapatre waste
Figure 3. Distribution of toxic metals in: (a) Ahensan WSP water samples; (b) Chirapatre WSP water samples; (c) Ahensan WSP sediment samples; (d) Chirapatre WSP sediment samples.
Notes: Where AP indicate anaerobic pond, FP is facultative pond and MP is maturation pond.
Table 3. Health risk index (HRI) of fish from sewage treatment pondMetal Concentration (mg/kg) Estimated daily intake
(EDI) = (EF × ED × FIR × Cf × Cm)/(WAB × TA)
Reference oral doses
(RfD)
Health risk index
(HRI) = EDI/RfD
Pb Maximum 5.0 × 10⁻² 1.00 × 10⁻⁵ 1.40 × 10⁻¹ 5.00 × 10⁻⁵
Mean 4.0 × 10⁻² 1.00 × 10⁻⁵ 1.40 × 10⁻¹ 4.00 × 10⁻⁵
Cd Maximum 1.9 × 10⁻² 3.00 × 10⁻⁶ 1.00 × 10⁻³ 3.00 × 10⁻³
Mean 1.6 × 10⁻² 2.00 × 10⁻⁶ 1.00 × 10⁻³ 2.00 × 10⁻³
Cu Maximum 4.34 × 10⁻¹ 6.00 × 10⁻⁵ 4.00 × 10⁻² 1.00 × 10⁻³
Mean 3.18 × 10⁻¹ 4.00 × 10⁻⁵ 4.00 × 10⁻² 1.00 × 10⁻³
Cr Maximum 3.00 × 10⁻¹ 4.00 × 10⁻⁵ 1.50 × 10⁻³ 2.70 × 10⁻²
Mean 1.14 × 10⁻¹ 2.00 × 10⁻⁵ 1.50 × 10⁻³ 1.00 × 10⁻²
Hg Maximum 3.20 × 10⁻¹ 4.00 × 10⁻⁵ 4.00 × 10⁻⁴ 1.06 × 10⁻¹
Mean 2.47 × 10⁻¹ 3.00 × 10⁻⁵ 4.00 × 10⁻⁴ 8.20 × 10⁻²

Page 10 of 12
Darko et al., Cogent Environmental Science (2016), 2: 1190116http://dx.doi.org/10.1080/23311843.2016.1190116
stabilization ponds. However, Cd, Cr and Hg concentrations in water were not statistically different in two waste stabilization ponds studied.
3.2. Concentrations of toxic metal in sedimentResults for toxic metals in sediment samples from the waste stabilization ponds are presented in Table 3. The concentration of Pb, Cd, Cu, Cr and Hg in sediment from Ahensan ranged from 26.2 to 27.1, 14.7 to 18.1, 299.0 to 323.0, 190.0 to 220.0 and 90.0 to 140.0 μg/kg, respectively. The concen-tration of Pb, Cd, Cu, Cr and Hg in sediment from Chirapatre ranged from 24.7 to 27.4, 12.5 to 14.2, 241.0 to 253.0, 190.0 to 240.0 and 100.0 to 150.0 μg/kg, respectively. The maximum concentration of Pb, Cu, Cr and Hg in the sediment samples is 27.4, 323.0, 240.0 and 150.0 μg/kg, respectively. These were below the pollution limits of 40,000.0, 25,000.0, 25,000.0 and 1,100.0 μg/kg, respectively (US EPA, 1997), and WHO maximum tolerable soil concentrations of 84,000.0, 7,000.0 and 4,000.0 μg/kg for Pb, Hg and Cd, respectively (WHO, 2006b).
In the Ahensan sampling site, Pb, Cu and Hg concentrations in various ponds increased slightly from pond to pond. The Cd concentration was slightly higher in the facultative pond than was in the anaerobic pond. It decreased in the first maturation pond and remained the same in the second maturation pond. The concentration (μg/kg) in the first maturation pond increased slightly from 200.0 to 220.0 before dropping to 190.0 in the second maturation pond (Figure 3(c)). The concentra-tions of Pb, Cu and Cd in the sediment samples from Chirapatre did not change significantly (p > 0.05) as shown in the Figure 3(d). However, the concentration of Cr was higher than Hg in the anaerobic pond and showed a drop in the second facultative pond.
3.3. Concentrations of toxic metal in fishFish is a good indicator of heavy metal contamination in aquatic systems because they occupy dif-ferent trophic levels (Burger et al., 2002). Heavy metal intake by fish in a polluted aquatic environ-ment varies depending on factors such as ecological requirements, metabolisms, salinity and water pollution level. Fish accumulates metals directly from water and through the food it feeds on. The consumption of contaminated fish could cause acute and chronic effects to humans (Nord, Adams, Wixson, Loftin, & Huang, 2004). Concentrations of toxic metal levels in fish samples are summarized in Table 2. All the fish samples had some amount of the metals in them. The concentration of Pb, Cd, Cu, Cr and Hg in fish samples from Ahensan ranged from 36.7 to 48.6, 12.0 to 18.9, 291.0 to 434.0, 120.0 to 300.0 and 217.0 to 320.0 μg/kg, respectively. The concentration of Pb, Cd, Cu, Cr and Hg in fish samples from Chirapatre ranged from 23.5 to 36.1, 10.8 to 18.4, 212.0 to 432.0, 10.0 to 180.0 and 203.0 to 278.0 μg/kg, respectively. The maximum concentration of Pb, Cd, Cu, Cr and Hg in the fish samples were 48.6, 18.9, 434.0, 300.0 and 320.0 μg/kg, respectively. These were below the EU maximum tolerable limits of 300.0, 50.0, 20,000.0, 1,000.0 and 1,000.0 μg/kg, respectively (EU, 2006). Lead and Cd are classified among the most toxic heavy metals which have no known bio-chemical benefits to animals and humans but could pose serious systemic health problems in hu-mans (Akoto, Eshun, Darko, & Adei, 2014). The maximum concentrations of Cu, Pb and Cd, (5,580.0, 52,160.0 and 3,680.0 μg/kg, respectively), found in four fish species, (Cirrhinus mrigala, Oreochromis nilitica, Catla catla and Labeo rohita) reared in the sewage-fed ponds in the East Kolkata Wetlands in India (Maiti & Banerjee, 2012) were all higher than the concentrations found in the present study.
3.4. Toxicity indices in fishHealth risk assessments (HRI) due to various toxic metals considered in this study are presented in Table 3. There was no HRI value > 1, indicating that human beings who consume fish from the pond would not be exposed to health hazards due to toxic metals in the fish. Mercury showed the highest HRI value of 0.106, while Pb gave the lowest HRI (4 × 10⁻⁵). The EDI calculated ranged from 1.0 × 10⁻⁶ to 6.0 × 10⁻⁵ mg/kg/day.
4. ConclusionThis study investigated whether toxic metals accumulated in fish raised in sewage-fed aquaculture pose any health risks to consumers. The results showed that all the fish had some amount of toxic

Page 11 of 12
Darko et al., Cogent Environmental Science (2016), 2: 1190116http://dx.doi.org/10.1080/23311843.2016.1190116
metals in them but their quantities were lower than those that could harm the human body. This shows that those who consume the fish reared in the pond systems we investigated are not exposed to health hazards as far as the metals in the fish is concerned. It is worrying that the Cd and Cr con-centrations in all water samples were above the US-EPA thresholds for long-term reuse of wastewa-ter. There is therefore an urgent need to find the source of Cr and Cd and also develop more robust type of waste stabilization ponds that could effectively remove all the toxic metals.
FundingThe authors received no direct funding for this research.
Author detailsGodfred Darko1
E-mails: [email protected], [email protected] ID: http://orcid.org/0000-0001-7157-646XDavid Azanu1
E-mail: [email protected] Kwame Logo1
E-mail: [email protected] Department of Chemistry, Kwame Nkrumah University of
Science and Technology, Kumasi, Ghana.
Citation informationCite this article as: Accumulation of toxic metals in fish raised from sewage-fed aquaculture and estimated health risks associated with their consumption, Godfred Darko, David Azanu & Nelson Kwame Logo, Cogent Environmental Science (2016), 2: 1190116.
Cover imageSource: Author.
ReferencesAderinola, O. J., Clarke, E. O., Olarinmoye, O. M., Kusemiju,
V., & Anatekhai, M. A. (2012). Heavy metals in surface water, sediments, fish and Perwinkles of Lagos Lagoon. American-Eurasian Journal of Agricultural and Environmental Sciences, 5, 609–617.
Akagi H., & Nishimura H. (1991). Speciation of mercury in the environment. In T. Suzuki, N. Imura, & T. W. Clarkson (Eds.), Advances in Mercury Toxicology (pp. 53–76). New York, NY: Plenum Press. http://dx.doi.org/10.1007/978-1-4757-9071-9
Akoto, O., Eshun, B. F., Darko, G., & Adei, E. (2014). Concentrations and health risk assessments of heavy metals in fish from the Fosu Lagoon. International Journal of Environmental Research, 8, 403–410.
Ali, M., & Hau, V. T. B. (2001). Vegetables in Bangladesh economic and nutritional impact of new varieties and technologies. Tainan, Taiwan: Technical Bulletin 25, AVRDC.
American Public Health Association, American Water Works Association, Water Environment Federation. (1999). Standard Methods for the Examination of Water and Wastewater (p. 541). Washington, DC: Standard Methods.
Azanu, D., JØrgensen, S. E., Darko, G., & Styrishave, B. (2016). Simple metal model for predicting uptake and chemical processes in sewage-fed aquaculture ecosystem. Ecological Modelling, 319, 130–136. doi:10.1016/j.ecolmodel.2015.07.023
Bortey-Sam, N., Nakayama, S. M. M., Ikenaka, Y., Akoto, O., Baidoo, E., Yohannes, Y. B., ... Ishizuka, M. (2015). Human health risks from metals and metalloid via consumption of food animals near gold mines in Tarkwa, Ghana: Estimation of the daily intakes and target hazard quotients (THQs). Ecotoxicology and Environmental Safety, 111, 160–167. doi:10.1016/j.ecoenv.2014.09.008
Burger, J., Gaines, K. F., Shane Boring, C., Stephens, W. L., Snodgrass, J., & Dixon, C. (2002). Metal levels in fish from the Savannah river: Potential hazards to fish and other
receptors. Environmental Research, 89, 85–97. http://dx.doi.org/10.1006/enrs.2002.4330
Drechsel, P., Graefe, S., Sonou, M., & Cofie, O. O. (2006). Informal irrigation in urban West Africa: An overview. Sri Lanka. doi:10.3910/2009.102
Drechsel, P., Scott, C. A., Raschid-Sally, L., Redwood, M., & Bahri, A. (2009). Wastewater irrigation and health. London: Routledge. doi:10.4324/9781849774666
EU. (2006). Commission Regulation (EC) No 1881/2006 Setting maximum levels for certain contaminants in foodstuffs. Official Journal of the European Union, L364, 5–24.
Ghana Statistical Service. (2012). 2010 population and housing census. 1–117. doi:10.1371/journal.pone.0104053
Hiroaki, I., Motoki, I., Norie, S., Ribeka, T., Yoshio, K., & Shiro, Y. (2013). Dietary cadmium intake and breast cancer risk in Japanese women: A case-control study. International journal of hygiene and environmental health, 217, 70–77.
ICH Harmonised Tripartite Guideline. (2005). Validation of analytical procedures: Text and methodology Q2(R1) (Vol. 1994). Geneva: United States Food and Drug Administration.
John, G. F., & Andrew, B. A. (2011). Lead isotopic study of the human bioaccessibility of lead in urban soils from Glasgow, Scotland. Science of the total environment, 409, 4958–4965.
JØrgensen, S. E., & Fath B. (2013). Fundamentals of ecological modelling; applications in environmental management and research (4th ed.). Amsterdam: Elsevier.
Keraita, B. (2008). Extent and implications of agricultural reuse of untreated, partly treated and diluted wastewater in developing countries. CAB reviews: Perspectives in agriculture, veterinary science, nutrition and natural resources, 3, 1–15. doi:10.1079/PAVSNNR20083058
Kramer, M. L., Kratzin, H. D., Schmidt, B., Romer, A., Windl, O., Liemann, S., ... Kretzschmar, H. (2001). Prion protein binds copper within the physiological concentration range. Journal of Biological Chemistry, 276, 16711–16719. http://dx.doi.org/10.1074/jbc.M006554200
Lai, H. Y., Hseu, Z. Y., Chen, T. C., Chen, B. C., Guo, H. Y., & Chen, Z. S. (2010). Health risk-based assessment and management of heavy metals-contaminated soil sites in Taiwan. International Journal of Environmental Research and Public Health, 7, 3595–3614. http://dx.doi.org/10.3390/ijerph7103596
Maiti, P., & Banerjee, S. (2012). Fate of metals in fish under variable sewage input in fish ponds. International Journal of Scientific Research Publication, 2, 1–13.
Mara, D. (2000). The production of microbiologically safe effluents for wastewater reuse in the Middle East and North Africa. Water, Air, and Soil Pollution, 123, 595–603. http://dx.doi.org/10.1023/A:1005233520118
Mwakaboko, A. S., Lugwisha, E. H. J., & Kayogolo, C. W. (2014). The performance of the selected waste stabilization ponds in Dar es Salaam, Tanzania in removing heavy metals. International Journal of Science, Environment and Technology, 3, 2024–2037.
Nandeesha, M. C. (2002). Sewage fed aquaculture systems of Kolkata: A century old innovation of farmers. Aquaculture Asia, 7, 28–32.
Nord, L. G., Adams, C. D., Wixson, B. G., Loftin, K. A., & Huang, Y. (2004). Lead, zinc, copper and cadmium in fish and sediments from the Big River Creek of Missouri’s old lead belt. Environmental Geochemistry and Health, 26, 37–49.
Saha, N., & Zaman, M. R. (2012). Evaluation of possible health risks of heavy metals by consumpt ion of foodstuffs

Page 12 of 12
Darko et al., Cogent Environmental Science (2016), 2: 1190116http://dx.doi.org/10.1080/23311843.2016.1190116
© 2016 The Author(s). This open access article is distributed under a Creative Commons Attribution (CC-BY) 4.0 license.You are free to: Share — copy and redistribute the material in any medium or format Adapt — remix, transform, and build upon the material for any purpose, even commercially.The licensor cannot revoke these freedoms as long as you follow the license terms.
Under the following terms:Attribution — You must give appropriate credit, provide a link to the license, and indicate if changes were made. You may do so in any reasonable manner, but not in any way that suggests the licensor endorses you or your use. No additional restrictions You may not apply legal terms or technological measures that legally restrict others from doing anything the license permits.
Cogent Environmental Science (ISSN: 2331-1843) is published by Cogent OA, part of Taylor & Francis Group. Publishing with Cogent OA ensures:• Immediate, universal access to your article on publication• High visibility and discoverability via the Cogent OA website as well as Taylor & Francis Online• Download and citation statistics for your article• Rapid online publication• Input from, and dialog with, expert editors and editorial boards• Retention of full copyright of your article• Guaranteed legacy preservation of your article• Discounts and waivers for authors in developing regionsSubmit your manuscript to a Cogent OA journal at www.CogentOA.com
available in the central market of Rajshahi City, Bangladesh. Environmental monitoring and assessment, 185, 3867–3878.
Standardization Administration China/Ministry of Health, China. (2005). Maximum levels of contaminants in foods(GB2762-2005). Beijing: Chinese Ministry of Health.
Tenkorang, A., Yeboah-Agyepong, M., Buamah, R., Agbo, N. W., Chaudhry, R., & Murray, A. (2012). Promoting sustainable sanitation through wastewater-fed aquaculture: A case study from Ghana. Water International, 37, 831–842. doi:10.1080/02508060.2012.733669
UNEP. (1992). Determination of petroleum hydrocarbons in sediments. Geneva, Switzaland: UNESCO.
US EPA. (1997). The incidence and severity of sediment contamination in surface waters of the United States (Vol. 1). Washington, DC: United States Environmental Protection Agency.
US EPA. (2009). Risk-based concentration table. Washington, DC: United States Environmental Protection Agency.
US EPA. (2012). Guidelines for water reuse. Washington, DC: United States Environmental Protection Agency.
Voegborlo, R. B., & Akagi, H. (2007). Determination of mercury in fish by cold vapour atomic absorption spectrometry using an automatic mercury analyzer. Food Chemistry, 100, 853–858. doi:10.1016/j.foodchem.2005.09.025
Von Sperling, M., Chernicharo, C. A-L. (2005). Biological wastewater treatment in warn climate regions. London: IWA Publishers.
Wang, X., Sato, T., Xing, B., & Tao, S. (2005). Health risks of heavy metals to the general public in Tianjin, China via consumption of vegetables and fish. Science of The Total Environment, 350, 28–37. doi:10.1016/j.scitotenv.2004.09.044
WHO. (2006a). Guidelines for drinking-water quality, (3rd ed., Vol. 1). Geneva: Author. ISBN 92 4 154696 4.
WHO. (2006b). Guidelines for the safe use of wastewater, excreta and greywater: Wastewater use in agriculture (Vol. 2). Geneva: Author.
Wright, D. A., & Welbourn, P. (2002). Environmental toxicology. Cambridge: Cambridge University Press. http://dx.doi.org/10.1017/CBO9780511805998
Yabe, J., Ishizuka, M., & Umemura, T. (2010). Current levels of heavy metal pollution in Africa. Journal of Veterinary Medical Science, 72, 1257–1263. http://dx.doi.org/10.1292/jvms.10-0058
Zheng, N., Wang, Q. C., & Zheng, D. M. (2007). Health risk of Hg, Pb, Cd, Zn, and Cu to the inhabitants around Huludao zinc plant in China via consumption of vegetables. Science of The Total Environment, 383, 81–89. doi:10.1017/CBO9781107415324.004