Acctg 320 2010 FOSTER Business School 1 CHAPTER 3 Systems Development and Documentation Techniques.
57
Acctg 320 2010 FOSTER Business School 1 CHAPTER 3 Systems Development and Documentation Techniques
-
Upload
charity-harmon -
Category
Documents
-
view
215 -
download
0
Transcript of Acctg 320 2010 FOSTER Business School 1 CHAPTER 3 Systems Development and Documentation Techniques.
Acctg 320 2010 FOSTER Business School 1
CHAPTER 3
Systems Development and Documentation Techniques
Acctg 320 2010 FOSTER Business School 2
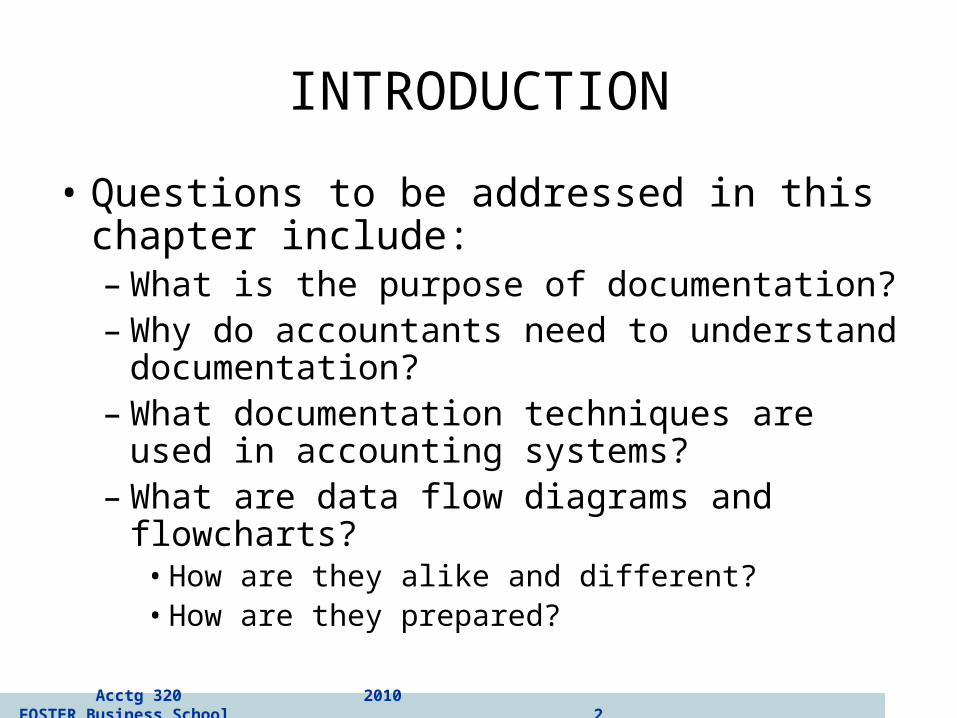
INTRODUCTION
• Questions to be addressed in this chapter include:– What is the purpose of documentation?– Why do accountants need to understand
documentation?– What documentation techniques are used in
accounting systems?– What are data flow diagrams and flowcharts?
• How are they alike and different?• How are they prepared?
Acctg 320 2010 FOSTER Business School 3
INTRODUCTION
• Documentation includes the following types of tools:– Narratives (written descriptions)– Flowcharts (document, system, program)– Diagrams (DFD)– Other written material

Acctg 320 2010 FOSTER Business School 4
INTRODUCTION
• Documentation covers the who, what, when, where, why, and how of:– Data entry– Processing– Storage– Information output– System controls
Acctg 320 2010 FOSTER Business School 5
INTRODUCTION
• How do accountants use documentation?– At a minimum, they have to read documentation to
understand how a system works.– They may need to evaluate the strengths and
weaknesses of an entity’s internal controls.• Requires heavy reliance on documentation
– They may examine documentation to determine if a proposed system meets the needs of its users.
– They may prepare documentation to:• Demonstrate how a proposed system would work• Demonstrate their understanding of a system of internal
controls
Acctg 320 2010 FOSTER Business School 6
INTRODUCTION
• In this chapter, we discuss two of the most common documentation tools:– Data flow diagrams
• Graphical descriptions of the sources and destinations of data. They show:– Where data comes from
– How it flows
– The processes performed on it
– Where it goes
Acctg 320 2010 FOSTER Business School 7
INTRODUCTION
• In this chapter, we discuss two of the most common documentation tools:– Data flow diagrams– Flowcharts
• Include three types:– Document flowcharts describe the flow of documents and
information between departments or units.
– System flowcharts describe the relationship between inputs, processing, and outputs for a system.
– Program flowcharts describe the sequence of logical operations performed in a computer program.
Acctg 320 2010 FOSTER Business School 8
INTRODUCTION
• Documentation techniques are necessary tools for accountants:– SAS-94 requires that auditors understand the
automated and manual procedures an entity uses.• This understanding can be gleaned through documenting the
internal control system—a process that effectively exposes strengths and weaknesses of the system.
– SOX (2002) effectively requires that publicly-traded corporations and their auditors document and test the company’s internal controls.
– Auditing Standard No. 2 promulgated by the PCAOB requires that the external auditor express an opinion on the client’s system of internal controls.
Acctg 320 2010 FOSTER Business School 9
INTRODUCTION
• Documentation tools help accountants by:– Organizing very complicated systems into a
form that can be more readily understood.– Helping new team members understand a
pre-existing system.
Acctg 320 2010 FOSTER Business School 10
INTRODUCTION
• Which method should you use—flowcharts or DFDs?– Both are used by IS professionals.– Both can be prepared relatively simply using
available software.– Both are tested on professional exams.
– CONCLUSION: You need to know them both
Acctg 320 2010 FOSTER Business School 11
DATA FLOW DIAGRAMS (DFDs)
• A data flow diagram (DFD) graphically describes the flow of data within an organization. It is used to:– Document existing systems– Plan and design new systems
• There is no black-and-white approach to developing a DFD. Pg. 69 of the AIS text gives 15 guidelines for making a DFD.
Acctg 320 2010 FOSTER Business School 12
DATA FLOW DIAGRAMS
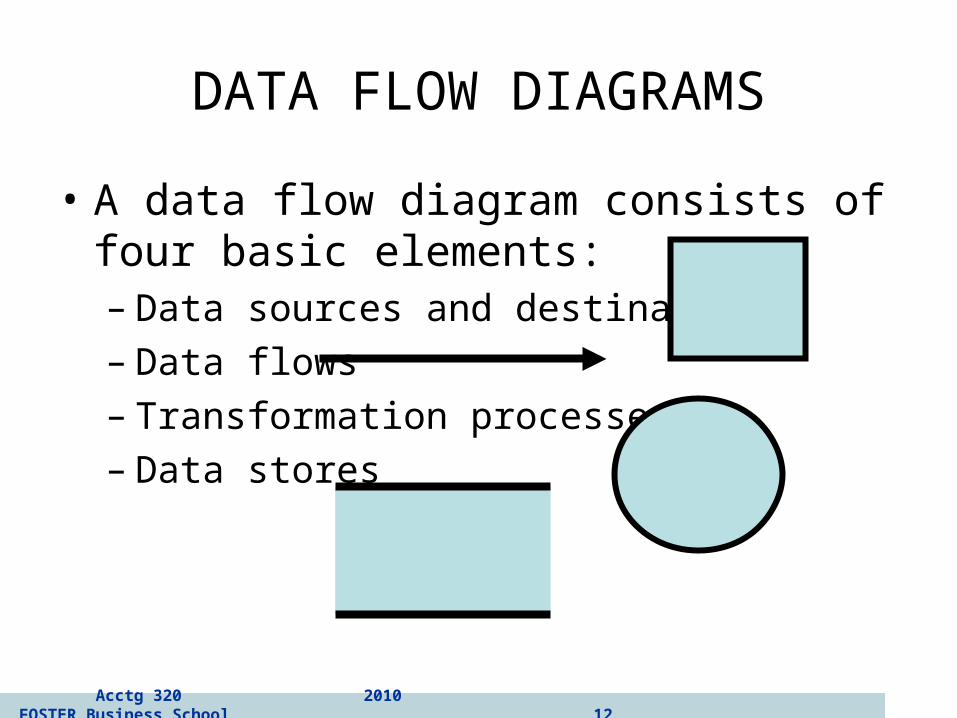
• A data flow diagram consists of four basic elements:– Data sources and destinations – Data flows– Transformation processes– Data stores
Acctg 320 2010 FOSTER Business School 13
DATA FLOW DIAGRAMS
Customer1.0
ProcessPayment
2.0Update
A/R
CreditManager
Bank
AccountsReceivable
Customerpayment
Remittancedata
ReceivablesInformation
Deposit
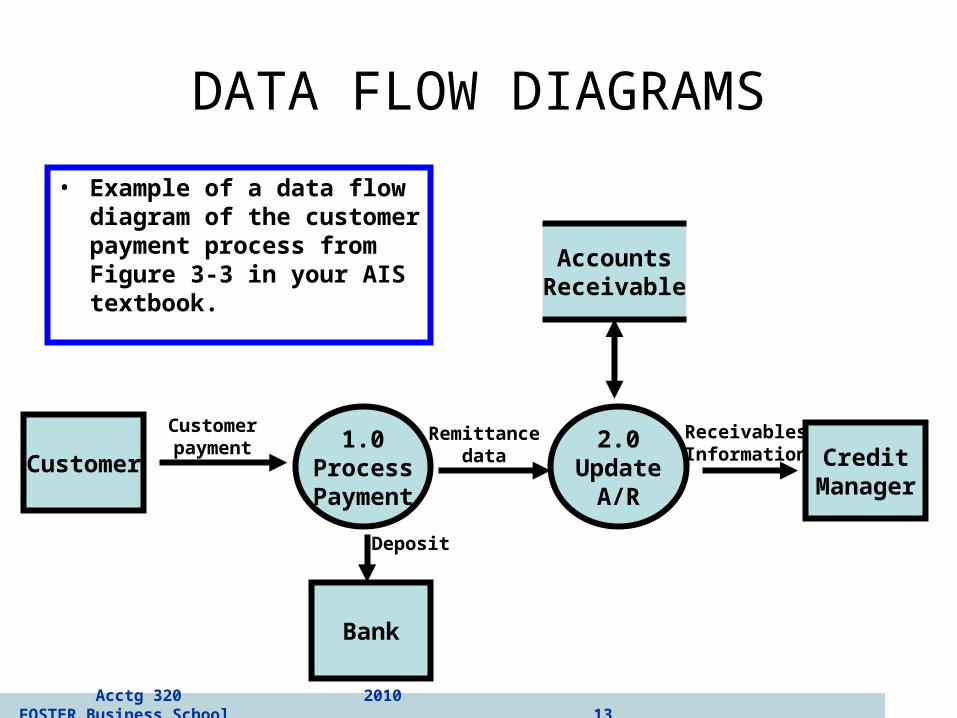
• Example of a data flow diagram of the customer payment process from Figure 3-3 in your AIS textbook.
Acctg 320 2010 FOSTER Business School 14
DATA FLOW DIAGRAMS
• Subdividing the DFD:– Few systems can be fully diagrammed on one
sheet of paper, and users have needs for differing levels of detail.
– Consequently, DFDs are subdivided into successively lower levels to provide increasing amounts of detail.
Acctg 320 2010 FOSTER Business School 15
DATA FLOW DIAGRAMS
• The highest level of DFD is called a context diagram.– It provides a summary-level view of the
system.– It depicts a data processing system and the
external entities that are:• Sources of its input• Destinations of its output
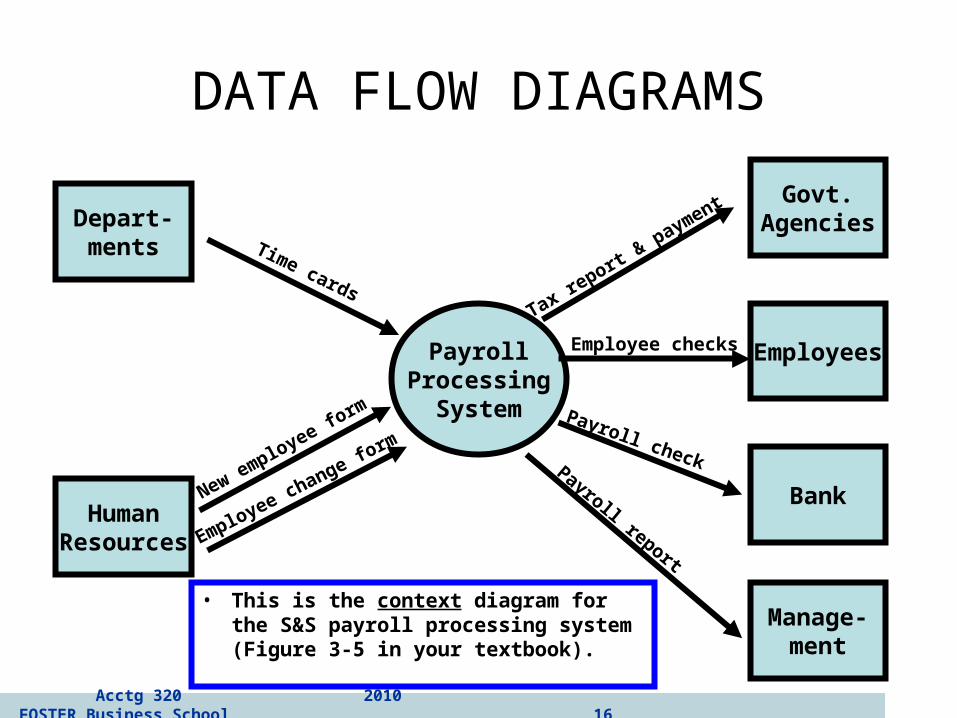
Acctg 320 2010 FOSTER Business School 16
DATA FLOW DIAGRAMS
PayrollProcessing
System
Depart-ments
HumanResources
Govt.Agencies
Employees
Bank
Manage-ment
Time cards
New employee form
Employee change form
Tax report &
payment
Employee checks
Payroll checkPayroll report
• This is the context diagram for the S&S payroll processing system (Figure 3-5 in your textbook).
Acctg 320 2010 FOSTER Business School 17
DATA FLOW DIAGRAMS (15 rules)
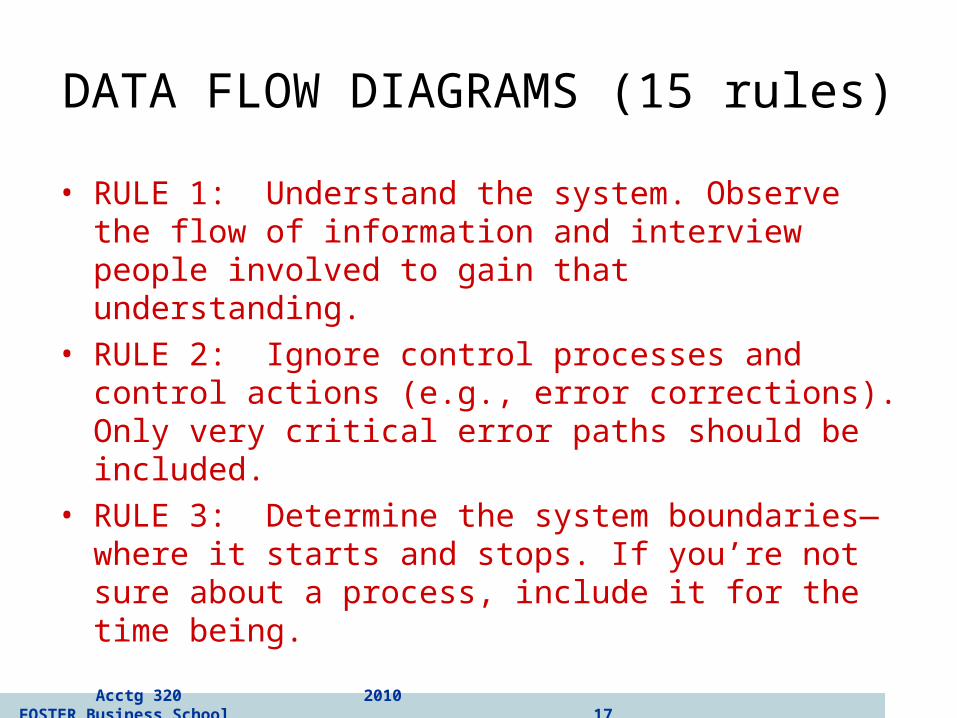
• RULE 1: Understand the system. Observe the flow of information and interview people involved to gain that understanding.
• RULE 2: Ignore control processes and control actions (e.g., error corrections). Only very critical error paths should be included.
• RULE 3: Determine the system boundaries—where it starts and stops. If you’re not sure about a process, include it for the time being.
Acctg 320 2010 FOSTER Business School 18
DATA FLOW DIAGRAMS
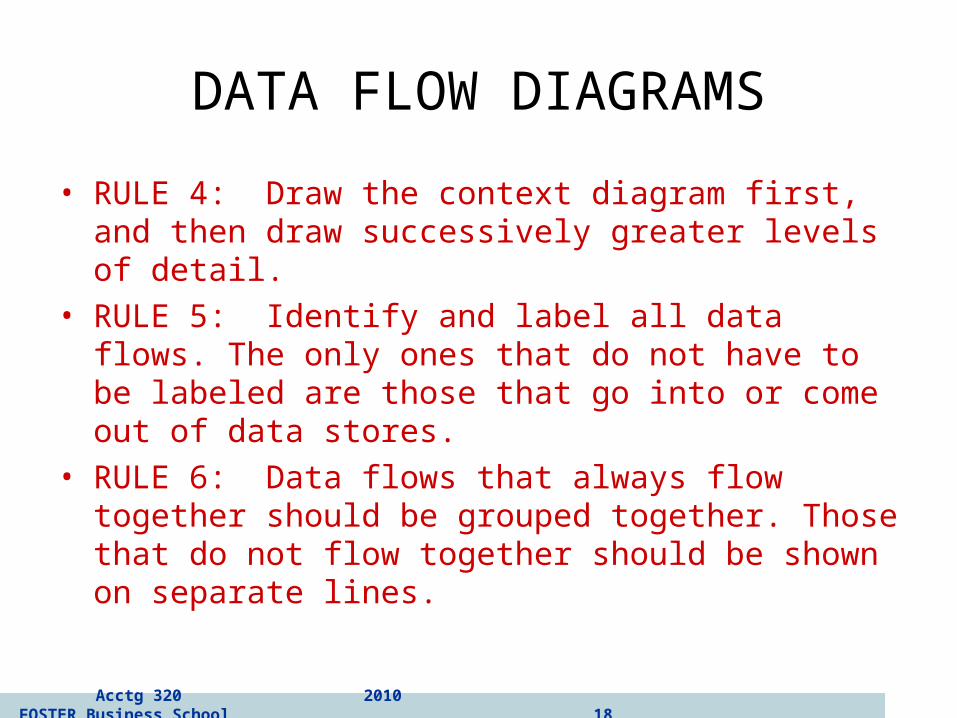
• RULE 4: Draw the context diagram first, and then draw successively greater levels of detail.
• RULE 5: Identify and label all data flows. The only ones that do not have to be labeled are those that go into or come out of data stores.
• RULE 6: Data flows that always flow together should be grouped together. Those that do not flow together should be shown on separate lines.

Acctg 320 2010 FOSTER Business School 19
DATA FLOW DIAGRAMS
• RULE 7: Show a process (circle) wherever a data flow is converted from one form to another. Likewise, every process should have at least one incoming data flow and at least one outgoing data flow.
• RULE 8: Transformation processes that are logically related or occur simultaneously can be grouped in one bubble.
• RULE 9: Number each process sequentially. A process labeled 5.0 would be exploded at the next level into processes numbered 5.1, 5.2, etc. A process labeled 5.2 would be exploded into 5.21, 5.22, etc.

Acctg 320 2010 FOSTER Business School 20
DATA FLOW DIAGRAMS
• RULE 10: Process names should include action verbs, such as update, prepare, etc.
• RULE 11: Identify and label all data stores, whether temporary or permanent.
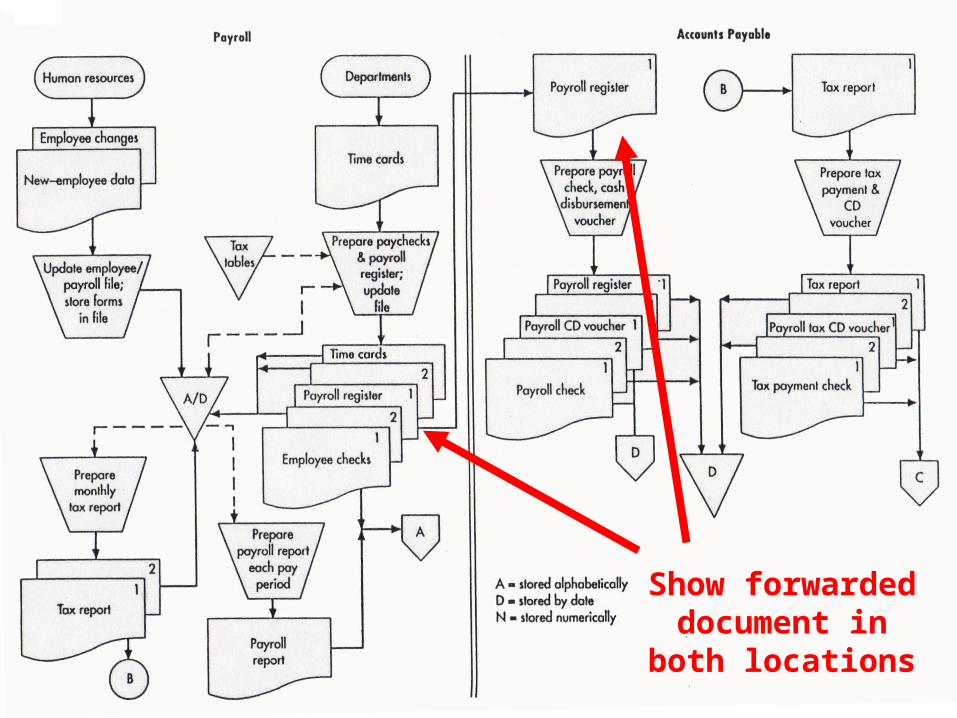
• RULE 12: Identify and label all sources and destinations. An entity can be both a source and destination. You may wish to include such items twice on the diagram, if needed, to avoid excessive or crossing lines.
Acctg 320 2010 FOSTER Business School 21
DATA FLOW DIAGRAMS
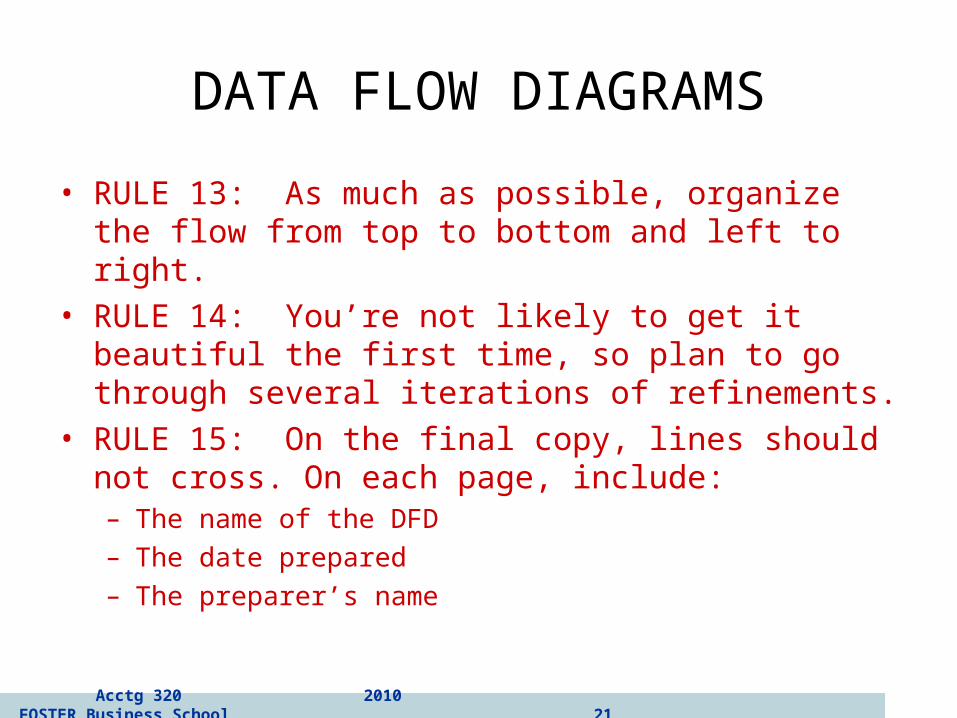
• RULE 13: As much as possible, organize the flow from top to bottom and left to right.
• RULE 14: You’re not likely to get it beautiful the first time, so plan to go through several iterations of refinements.
• RULE 15: On the final copy, lines should not cross. On each page, include:– The name of the DFD– The date prepared– The preparer’s name
Acctg 320 2010 FOSTER Business School 22
DATA FLOW DIAGRAMS
• The DFD focuses on the logical flow of data.• Next, we will discuss flowcharts, which place
greater emphasis on physical details.

Acctg 320 2010 FOSTER Business School 23
FLOWCHARTS
• A flowchart is an analytical technique that describes some aspect of an information system in a clear, concise, and logical manner.
• Flowcharts use a set of standard symbols to depict processing procedures and the flow of data.
• Flowcharting History:– Introduced in 1950s by industrial engineers to document
business processes and document flows for process improvement.
– Sarbanes-Oxley 2002 increased importance by requiring companies to document business processes and internal controls procedures.
Acctg 320 2010 FOSTER Business School 24
FLOWCHARTS
• Every symbol on a flowchart depicts a unique operation, input, processing activity, or storage medium.
• Years ago, flowcharts were manually created using plastic templates. (I had a set of these)
• Most flowcharts are now drawn using a software program such as Visio.– Microsoft and Power Point are also used.– The software uses pre-drawn shapes, and the
developer drags the shapes into the drawing.
Acctg 320 2010 FOSTER Business School 25
FLOWCHARTS
• There are four types (groups) of flowcharting symbols:– Input/output symbols– Processing symbols– Storage symbols– Flow and miscellaneous symbols
Acctg 320 2010 FOSTER Business School 48
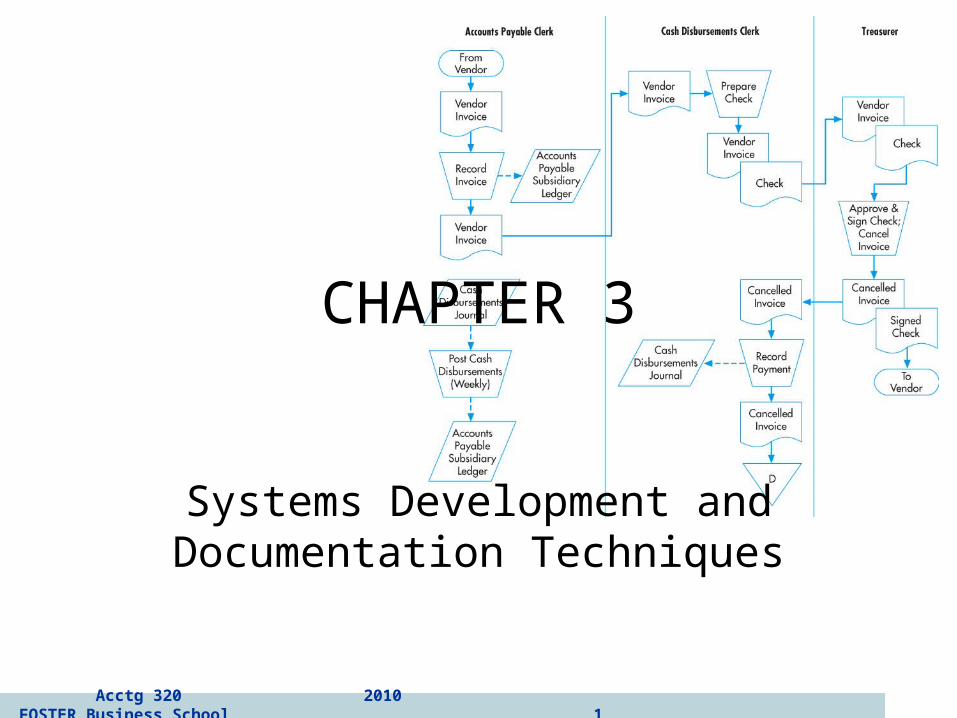
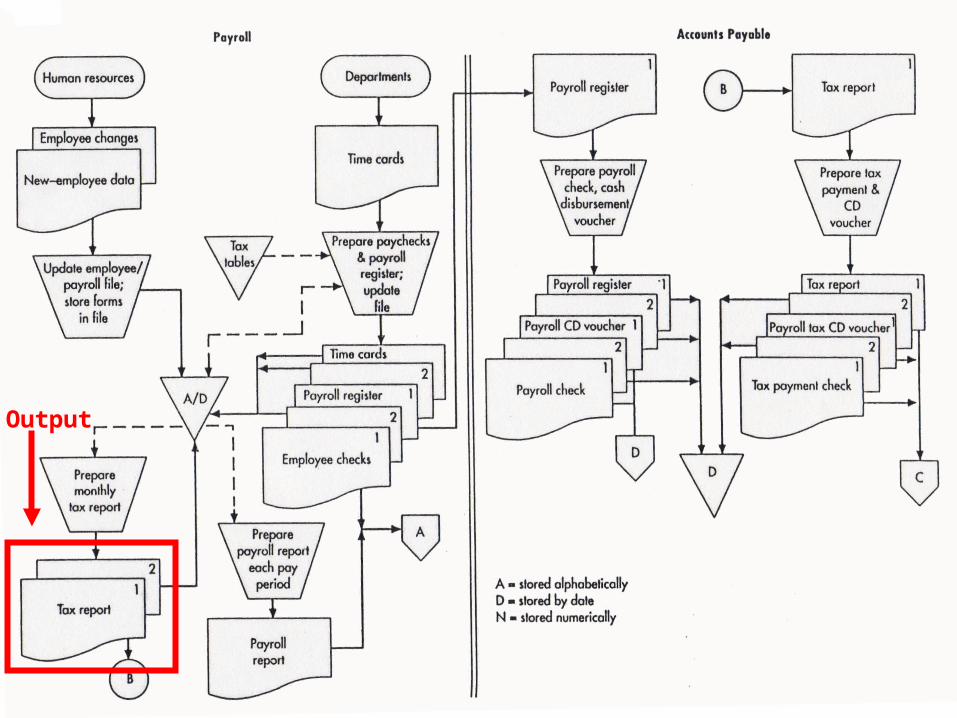
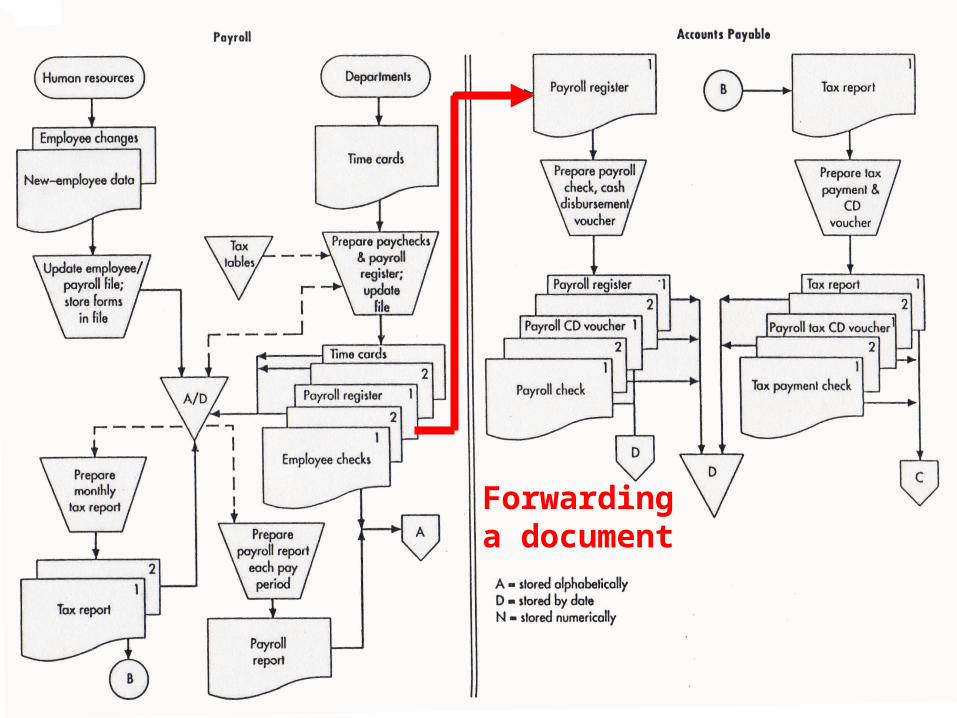
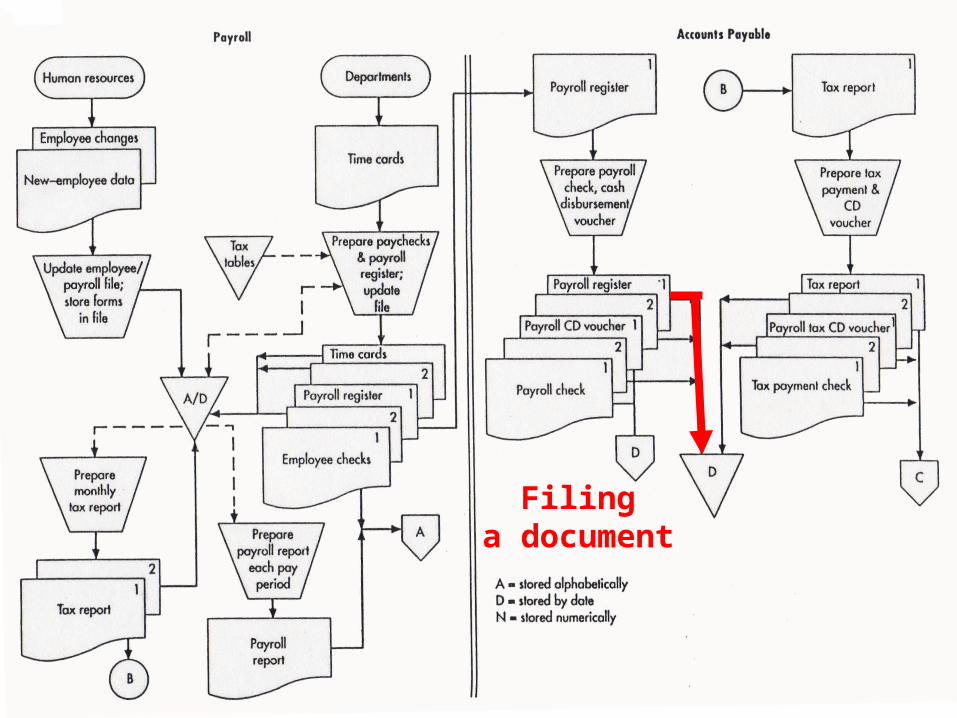
DOCUMENT FLOWCHARTS
• A document flowchart shows the flow of documents and information among areas of responsibility in an organization.
• These flowcharts trace a document from cradle to grave and show:– Where a document comes from– Where it’s distributed– How it’s used– It’s ultimate disposition– Everything that happens as it flows through the
system
Acctg 320 2010 FOSTER Business School 49
DOCUMENT FLOWCHARTS
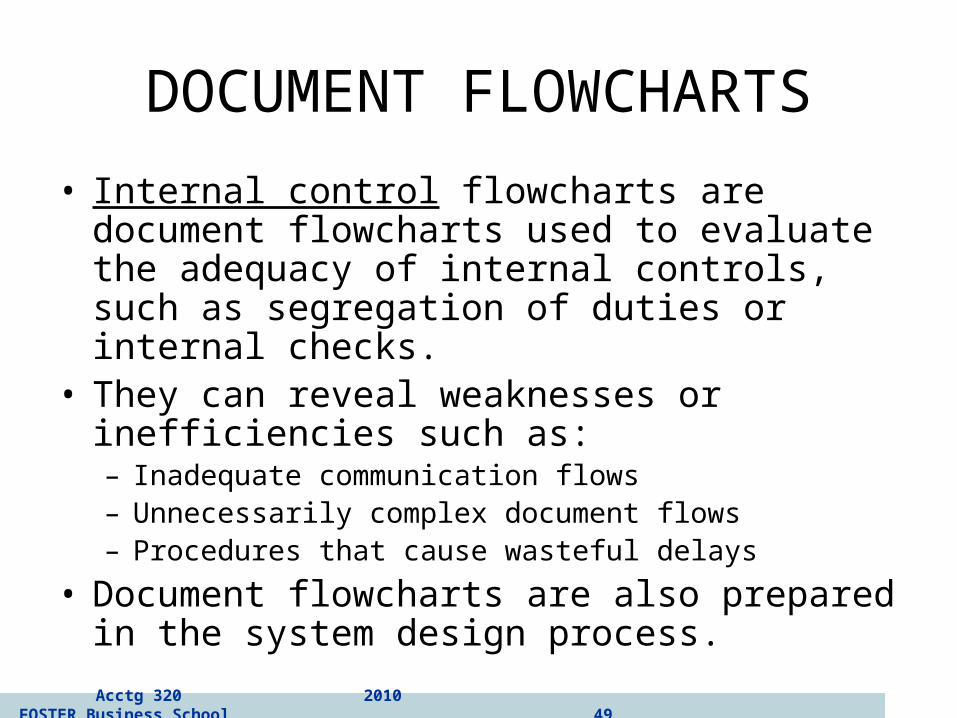
• Internal control flowcharts are document flowcharts used to evaluate the adequacy of internal controls, such as segregation of duties or internal checks.
• They can reveal weaknesses or inefficiencies such as:– Inadequate communication flows– Unnecessarily complex document flows– Procedures that cause wasteful delays
• Document flowcharts are also prepared in the system design process.
Acctg 320 2010 FOSTER Business School 50
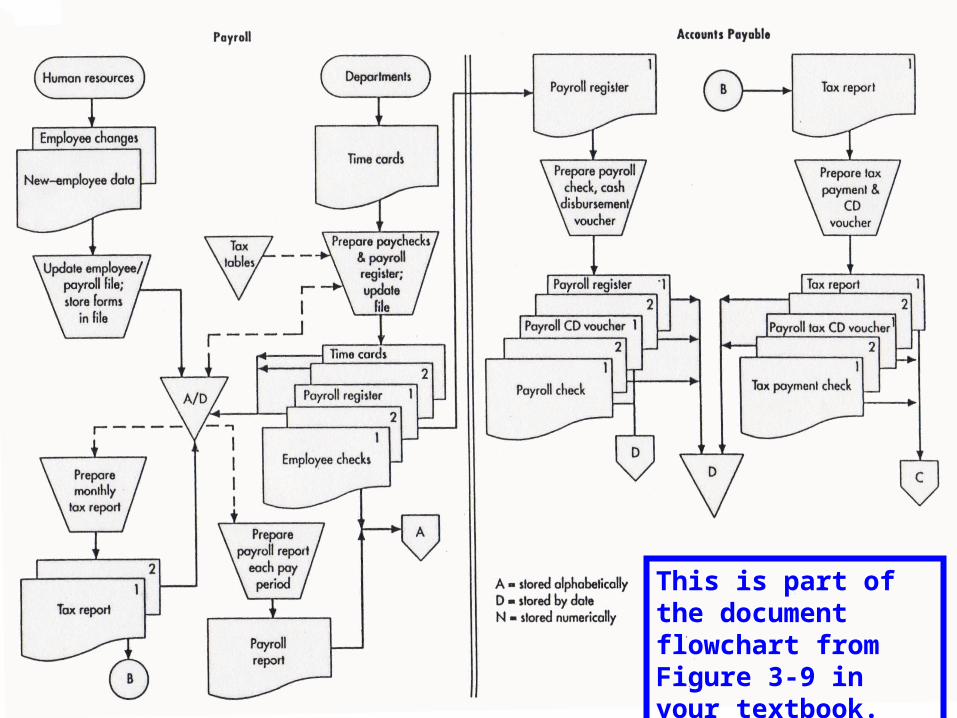
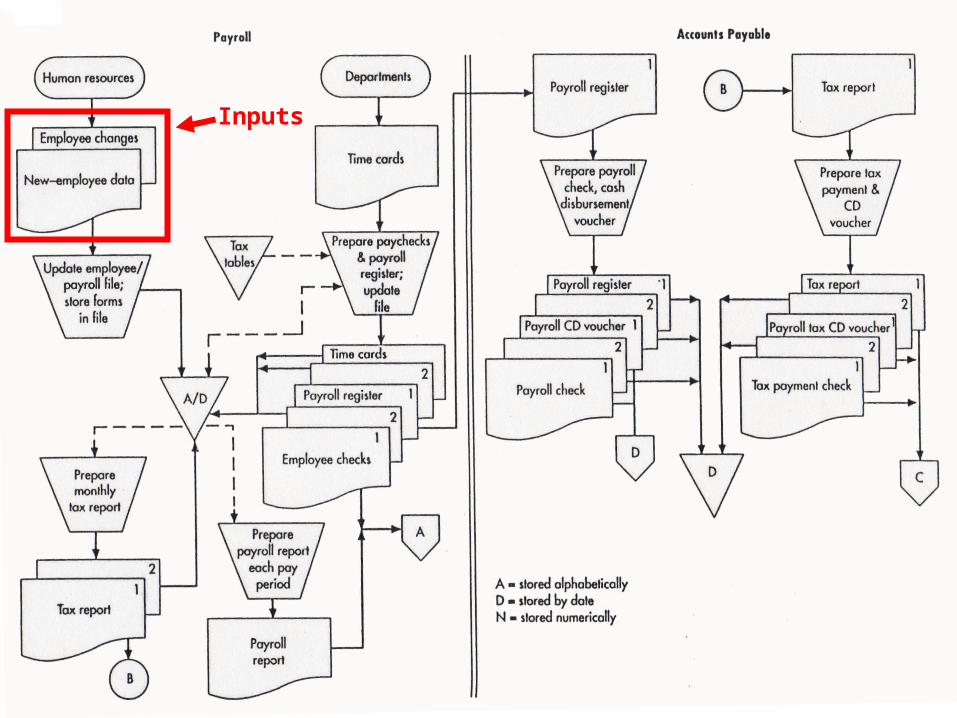
This is part of the document flowchart from Figure 3-9 in your textbook.

Acctg 320 2010 FOSTER Business School 51
GUIDELINES FOR PREPARING FLOWCHARTS
• 3-2 Focus on page 73 of your AIS text gives 20 rules for preparing flowcharts. Make sure to read them.
Acctg 320 2010 FOSTER Business School 52
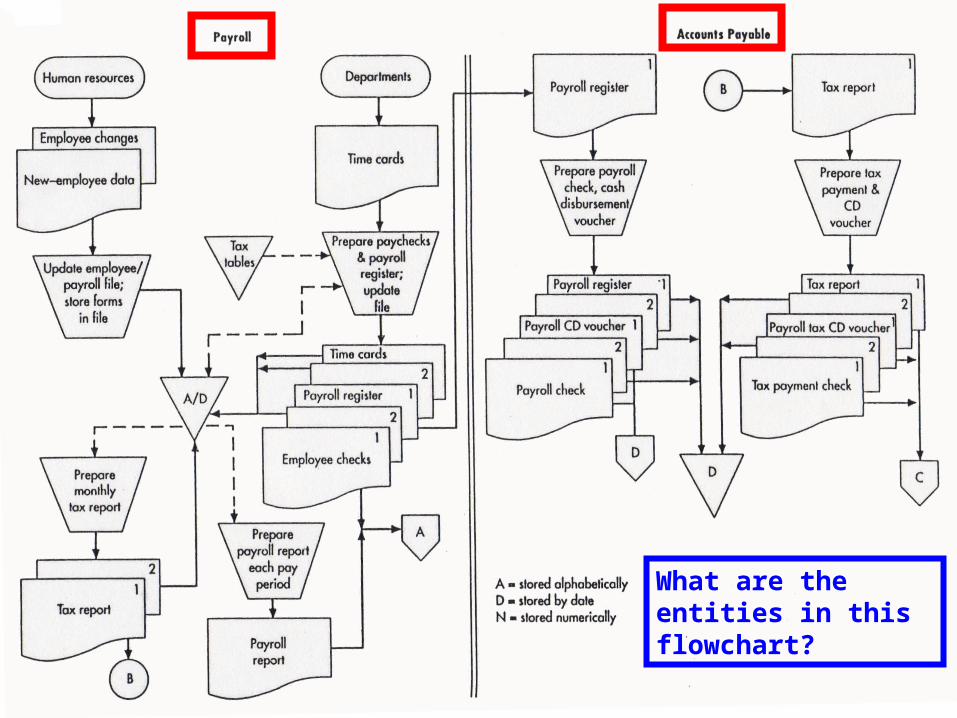
What are the entities in this flowchart?
Acctg 320 2010 FOSTER Business School 53
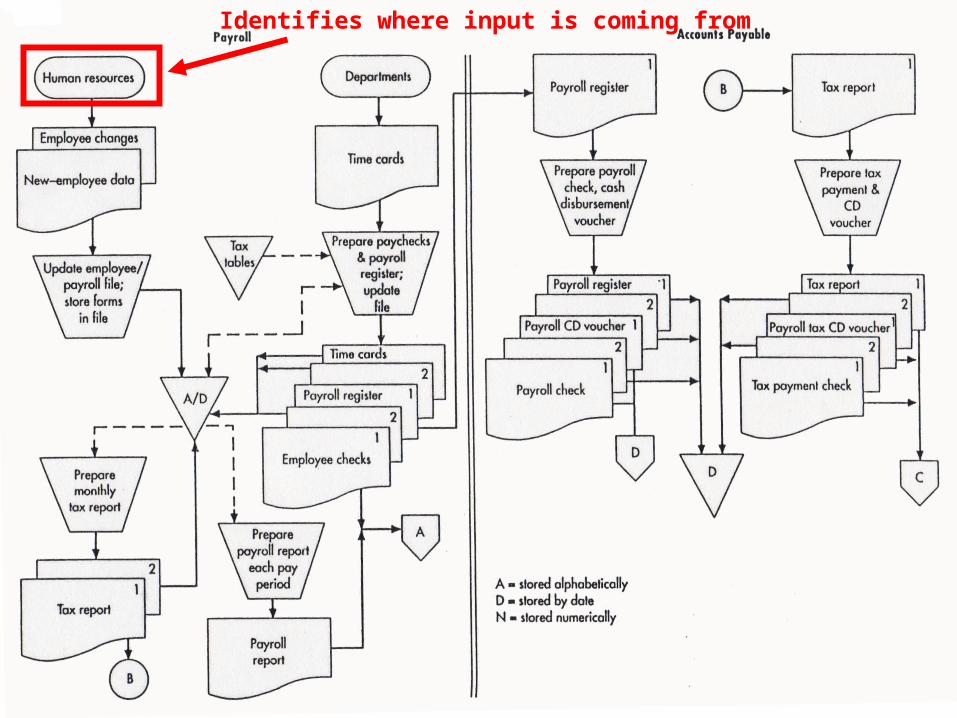
Identifies where input is coming from
Acctg 320 2010 FOSTER Business School 54
Inputs
Acctg 320 2010 FOSTER Business School 55
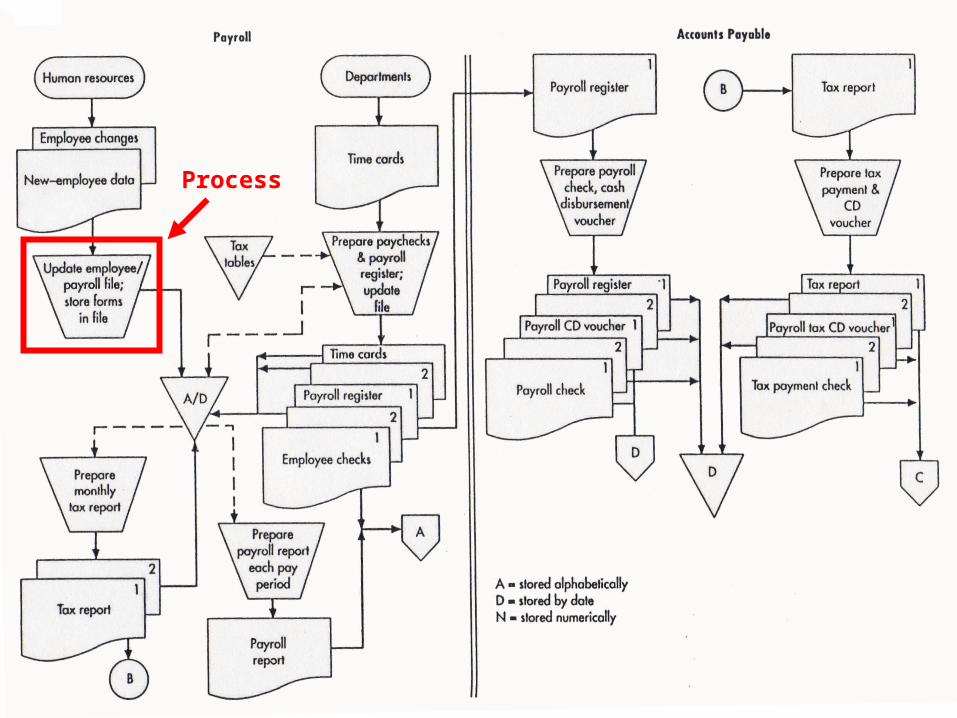
Process
Acctg 320 2010 FOSTER Business School 56
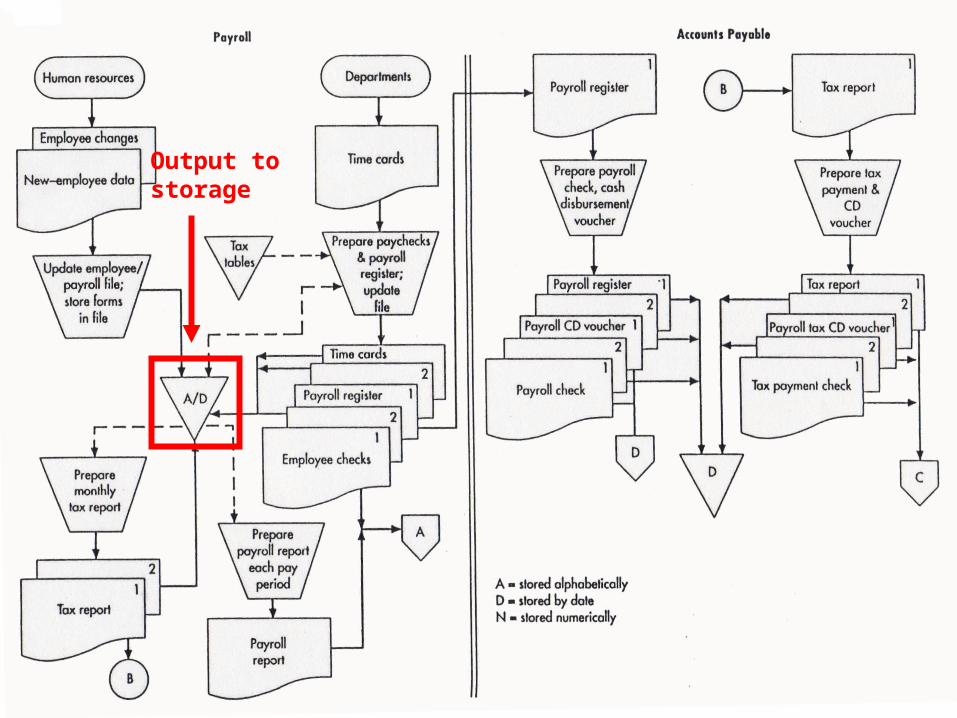
Output tostorage

Acctg 320 2010 FOSTER Business School 57
Input fornext
process
Acctg 320 2010 FOSTER Business School 58
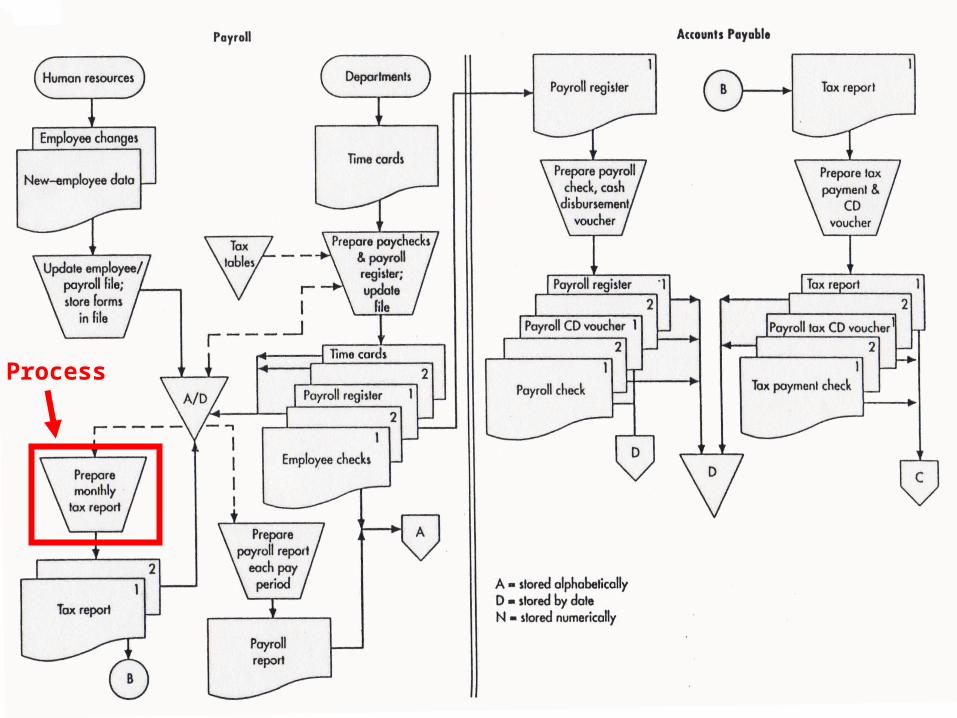
Process
Acctg 320 2010 FOSTER Business School 59
Output
Acctg 320 2010 FOSTER Business School 60
Forwardinga document
Acctg 320 2010 FOSTER Business School 61
Filinga document
Acctg 320 2010 FOSTER Business School 62
Show forwarded document in both
locations

Acctg 320 2010 FOSTER Business School 63
What happens to the document numbers as the documents
move to other locations?
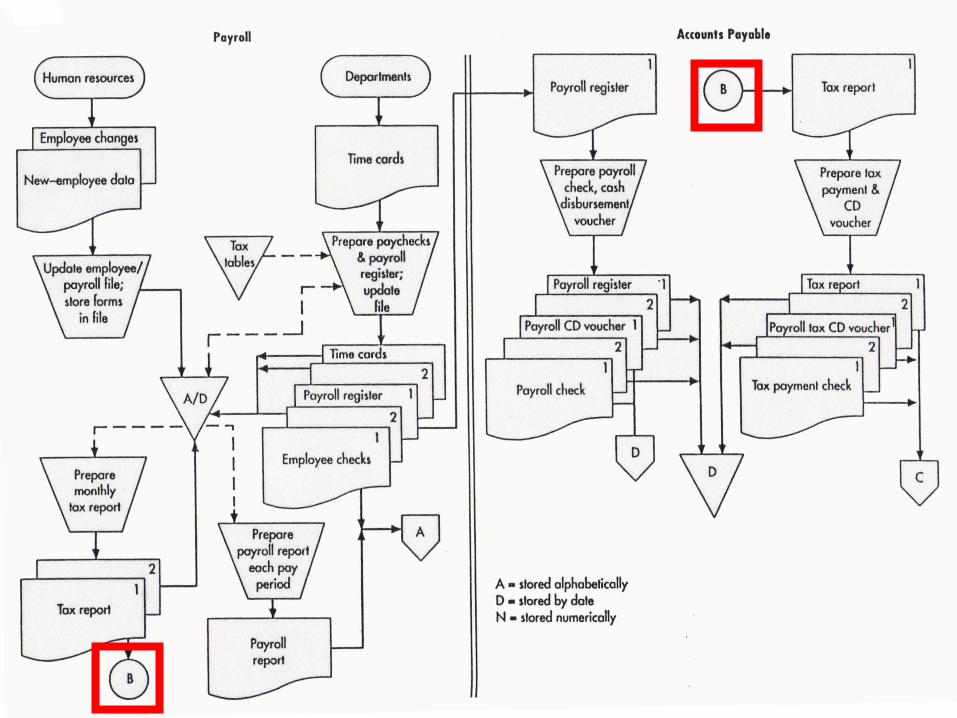
Acctg 320 2010 FOSTER Business School 64
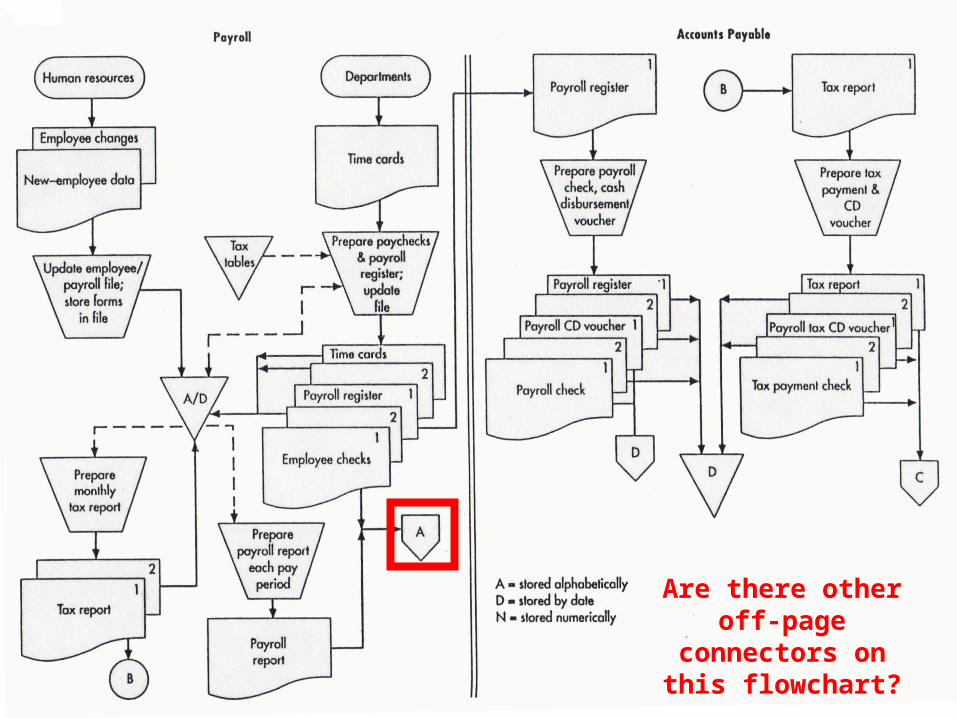
Acctg 320 2010 FOSTER Business School 65
Are there other off-page connectors on
this flowchart?
Acctg 320 2010 FOSTER Business School 66
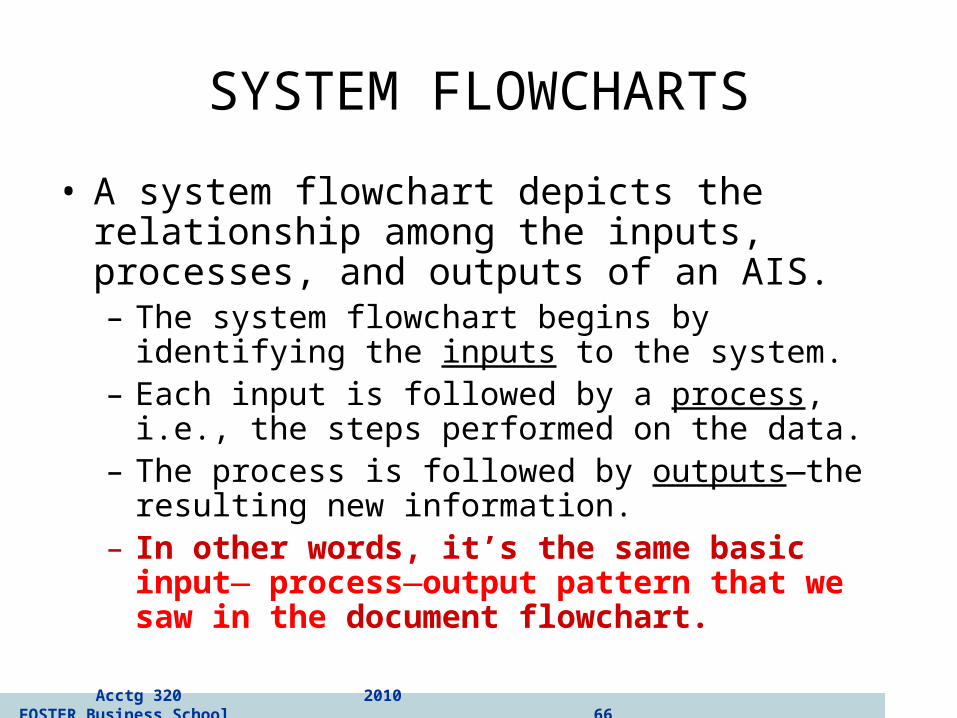
SYSTEM FLOWCHARTS
• A system flowchart depicts the relationship among the inputs, processes, and outputs of an AIS.– The system flowchart begins by identifying the inputs
to the system.– Each input is followed by a process, i.e., the steps
performed on the data.– The process is followed by outputs—the resulting new
information.– In other words, it’s the same basic input—
process—output pattern that we saw in the document flowchart.

Acctg 320 2010 FOSTER Business School 67
• System Flowchart Shown in Figure 3-10 in your textbook
• Can you spot the input— process—output pattern?
Acctg 320 2010 FOSTER Business School 68
PROGRAM FLOWCHARTS
• Program flowcharts illustrate the sequence of logical operations performed by a computer in executing a program.
• They also follow an input—process— output pattern.
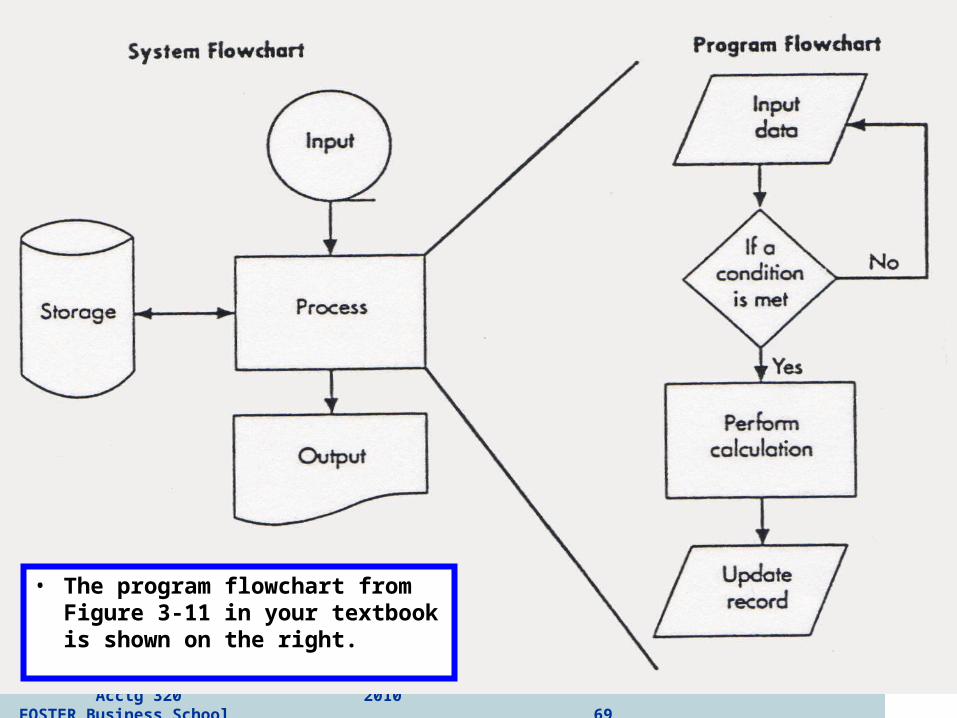
Acctg 320 2010 FOSTER Business School 69
• The program flowchart from Figure 3-11 in your textbook is shown on the right.
Acctg 320 2010 FOSTER Business School 70
FLOWCHARTS VS. DFDs
• Now that we’ve examined both flowcharts and DFDs, it may be useful to discuss the differences again.
• DFDs place a heavy emphasis on the logical aspects of a system.
• Flowcharts place more emphasis on the physical characteristics of the system.
• An example may be useful.
Acctg 320 2010 FOSTER Business School 71
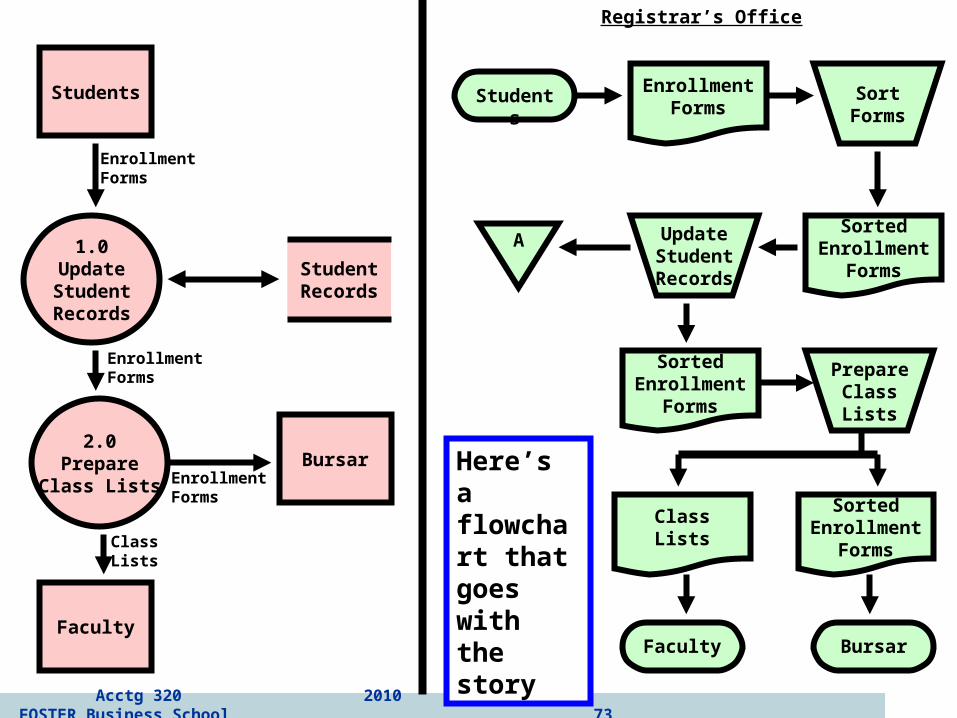
FLOWCHARTS VS. DFDs
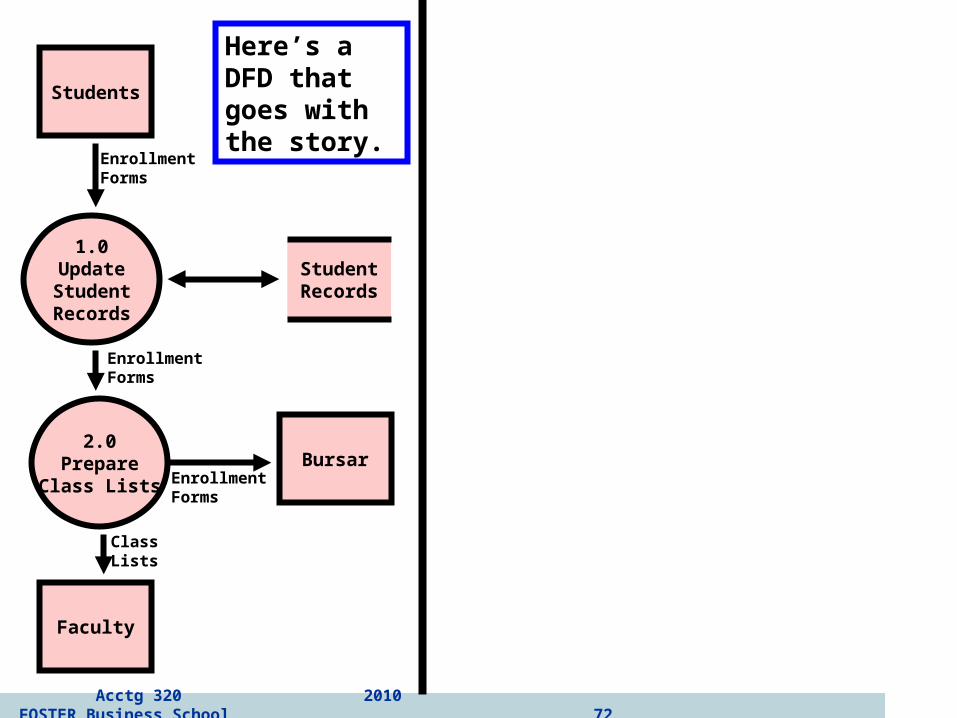
• EXAMPLE: The registrar’s office of a small college receives paper enrollment forms from students. They sort these records alphabetically and then update the student record file to show the new classes.They also prepare class lists from the same data. The sorted enrollment forms are forwarded to the bursar’s office for billing purposes. Class lists are mailed to faculty members.
Acctg 320 2010 FOSTER Business School 72
Students
1.0UpdateStudentRecords
2.0Prepare
Class Lists
StudentRecords
Faculty
Bursar
EnrollmentForms
EnrollmentForms
EnrollmentForms
ClassLists
Here’s a DFD that goes with the story.
Acctg 320 2010 FOSTER Business School 73
Students
1.0UpdateStudentRecords
2.0Prepare
Class Lists
StudentRecords
Faculty
Bursar
EnrollmentForms
EnrollmentForms
EnrollmentForms
ClassLists
Students
Registrar’s Office
EnrollmentForms
SortForms
SortedEnrollment
Forms
UpdateStudentRecords
A
PrepareClassLists
SortedEnrollment
Forms
ClassLists
SortedEnrollment
Forms
BursarFaculty
Here’s a flowchart that goes with the story

Acctg 320 2010 FOSTER Business School 74
FLOWCHARTS VS. DFDs
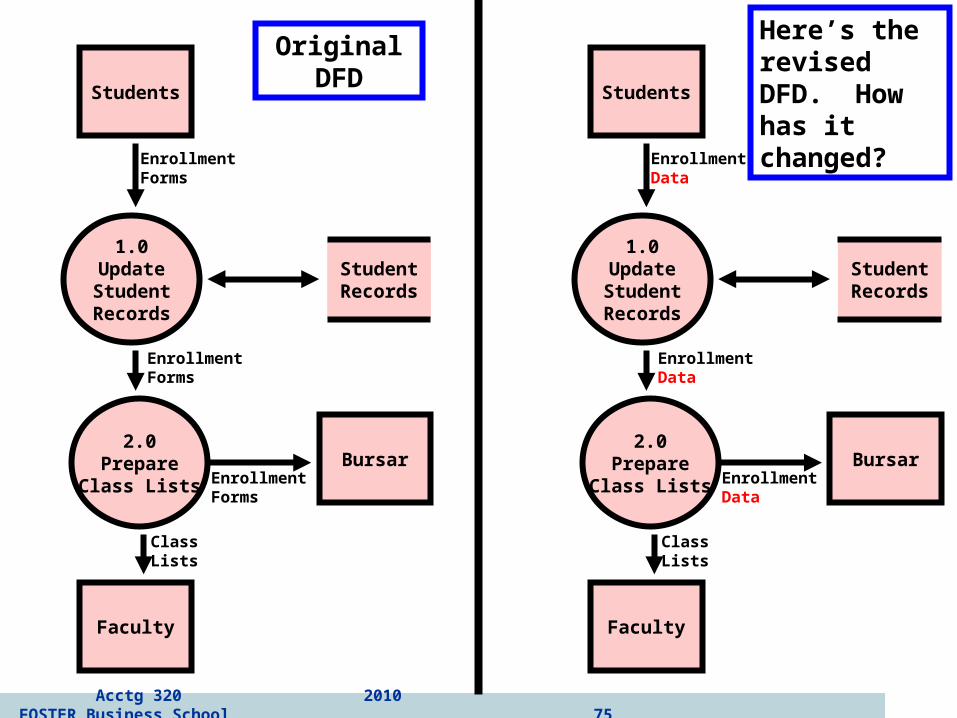
• Now let’s change the story so that students enter enrollment data online. The registrar’s office sends a tape file of the enrollment data to the bursar’s office and continues to send paper class lists to faculty.
Acctg 320 2010 FOSTER Business School 75
Students
1.0UpdateStudentRecords
2.0Prepare
Class Lists
StudentRecords
Faculty
Bursar
EnrollmentData
EnrollmentData
EnrollmentData
ClassLists
Original DFD
Students
1.0UpdateStudentRecords
2.0Prepare
Class Lists
StudentRecords
Faculty
Bursar
EnrollmentForms
EnrollmentForms
EnrollmentForms
ClassLists
Here’s the revised DFD. How has it changed?
Acctg 320 2010 FOSTER Business School 76
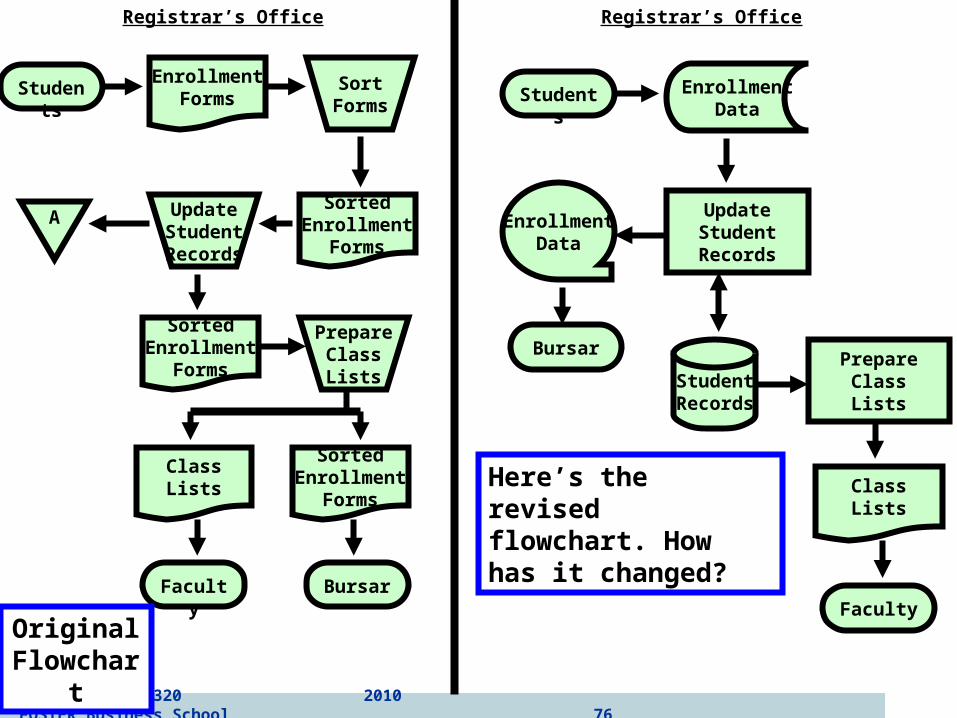
Here’s the revised flowchart. How has it changed?
Registrar’s Office
Students
ClassLists
Bursar
Faculty
EnrollmentData
UpdateStudentRecords
StudentRecords
EnrollmentData
PrepareClassLists
Students
Registrar’s Office
EnrollmentForms
SortForms
SortedEnrollment
Forms
UpdateStudentRecords
A
PrepareClassLists
SortedEnrollment
Forms
ClassLists
SortedEnrollment
Forms
BursarFaculty
Original Flowchart
Acctg 320 2010 FOSTER Business School 77
FLOWCHARTS VS. DFDs
• Moral of the story: Changes in the physical characteristics of the process do affect the flowchart but have little or no impact on the DFD.
• The DFD focuses more on the logic.
• When deciding which tool to employ, consider the information needs of those who will view it.

Acctg 320 2010 FOSTER Business School 78
QUIZ QUESTION
• How is playing the piano like making DFDs and flowcharts?– You can’t learn to do it by just watching
someone else.– You can’t learn to do it by just looking at
examples.– Your first attempts are clumsy.– Practice leads to improvement and maybe
even perfection.
Acctg 320 2010 FOSTER Business School 79
SUMMARY
• We’ve learned about graphical forms of documentation, particularly:– Data flow diagrams– Flowcharts
• We’ve learned why these tools are important to accountants and how they are employed.
• We’ve learned basic guidelines for creating data flow diagrams and flowcharts.