Acct303 chapter2
37
CHAPTER 2 AN INTRODUCTION TO COST TERMS AND PURPOSES 2-16 (15 min.) Computing and interpreting manufacturing unit costs. 1. (in millions) Supreme Deluxe Regular Total Direct material cost $ 84.00 $ 54.00 $ 62.00 $200.00 Direct manuf. labor costs 14.00 28.00 8.0050.00 Indirect manuf. costs 42.00 84.00 24.00 150.00 Total manuf. costs $140.00 $166.00 $ 94.00 $400.00 Fixed costs allocated at a rate of $20M $50M (direct mfg. labor) equal to $0.40 per dir. manuf. labor dollar (0.40 $14; 28; 8) 5.60 11.20 3.20 20.00 Variable costs $134.40 $154.80 $ 90.80 $380.00 Units produced (millions) 80 120 100 Cost per unit (Total manuf. costs ÷ units produced) $1.7500 $1.3833 $0.9400 Variable manuf. cost per unit (Variable manuf. costs Units produced) $1.6800 $1.2900 $0.9080 (in millions) Supreme Deluxe Regular Total 2. Based on total manuf. cost per unit ($1.75 120; $1.3833 160; $0.94 180)$210.00 $221.33 $169.20 $600.53 Correct total manuf. costs based on variable manuf. costs plus fixed costs equal Variable costs ($1.68 120; $201.60$206.40 $163.44 $571.44 $1.29 160; $0.908 180) Fixed costs 20.00 Total costs $591.44 The total manufacturing cost per unit in requirement 1 includes $20 million of indirect manufacturing costs that are fixed 2-1
-
Upload
deepa-devanathan -
Category
Business
-
view
65 -
download
0
Transcript of Acct303 chapter2

CHAPTER 2AN INTRODUCTION TO COST TERMS AND PURPOSES
2-16 (15 min.) Computing and interpreting manufacturing unit costs.
1.(in millions)
Supreme Deluxe Regular TotalDirect material cost $ 84.00 $ 54.00 $ 62.00 $200.00Direct manuf. labor costs 14.00 28.00 8.00 50.00Indirect manuf. costs 42.00 84.00 24.00 150.00Total manuf. costs $140.00 $166.00 $ 94.00 $400.00Fixed costs allocated at a rateof $20M $50M (direct mfg. labor) equal to $0.40 per dir. manuf. labor dollar(0.40 $14; 28; 8) 5.60 11.20 3.20 20.00Variable costs $134.40 $154.80 $ 90.80 $380.00Units produced (millions) 80 120 100Cost per unit (Total manuf.costs ÷ units produced) $1.7500 $1.3833 $0.9400Variable manuf. cost per unit (Variable manuf. costs
Units produced) $1.6800 $1.2900 $0.9080
(in millions)Supreme Deluxe Regular Total
2. Based on total manuf. cost per unit ($1.75 120; $1.3833 160; $0.94 180) $210.00 $221.33 $169.20 $600.53Correct total manuf. costs based on variable manuf. costs plus fixed costs equalVariable costs ($1.68 120; $201.60 $206.40 $163.44 $571.44$1.29 160; $0.908 180)Fixed costs 20.00Total costs $591.44
The total manufacturing cost per unit in requirement 1 includes $20 million of indirect manufacturing costs that are fixed irrespective of changes in the volume of output per month, while the remaining variable indirect manufacturing costs change with the production volume. Given the unit volume changes for August 2008, the use of total manufacturing cost per unit from the past month at a different unit volume level (both in aggregate and at the individual product level) will yield incorrect estimates of total costs of $600.53 million in August 2008 relative to the correct total manufacturing costs of $591.44 million calculated using variable manufacturing cost per unit times units produced plus the fixed costs of $20 million.
2-17 (15 min.) Direct, indirect, fixed and variable costs.
2-1
1. Clay – Direct, variablePaint- direct, variablePackaging materials –direct (or could be indirect if small and not traced to each unit), variableDepreciation on machinery and molds –indirect, fixed (unless “units of output” depreciation,
which then would be variable)Rent on factory – indirect, fixedInsurance on factory –indirect, fixedFactory utilities – indirect, probably some variable and some fixed (e.g. electricity may be
variable but heating costs may be fixed)Painters – direct, variablePainting Department manager –indirect, fixedBaking Department manager – indirect, fixedMaterials handlers –depends on how they are paid. Most likely indirect fixed if salariedCustodian –indirect, fixedNight guard –indirect, fixedMachinist (running the baking machine) –depends on how they are paid. Most likely indirect
fixed, if salariedMachine maintenance personnel – indirect, probably fixed, if salaried, but may be variable if
paid only for time worked and maintenance increases with increased productionMaintenance supplies – indirect, variableCleaning supplies – indirect, most likely fixed since the custodians probably do the same
amount of cleaning every night
2. If the cost object is Baking Department, then anything directly associated with the Baking Department will be a direct cost. This will include:
depreciation on machinery and molds Baking Department manager Materials handlers (of the Baking Department) Machinist Machine Maintenance personnel (of the Baking Department) Maintenance supplies (of the Baking Department)
Of course the clay will also be a direct cost of the Baking Department, but it is already a direct cost of each kind of figurine produced.
2-2
2-18 (15–20 min.) Classification of costs, service sector.
Cost object: Each individual focus groupCost variability: With respect to the number of focus groups
There may be some debate over classifications of individual items, especially with regard to cost variability.
Cost Item D or I V or FA D VB I FC I Va
D I FE D VF I FG D VH I Vb
aSome students will note that phone call costs are variable when each call has a separate charge. It may be a fixed cost if Consumer Focus has a flat monthly charge for a line, irrespective of the amount of usage.bGasoline costs are likely to vary with the number of focus groups. However, vehicles likely serve multiple purposes, and detailed records may be required to examine how costs vary with changes in one of the many purposes served.
2-19 (15–20 min.) Classification of costs, merchandising sector.
Cost object: Videos sold in video section of storeCost variability: With respect to changes in the number of videos sold
There may be some debate over classifications of individual items, especially with regard to cost variability.
Cost Item D or I V or FA D FB I FC D VD D FE I FF I VG I FH D V
2-3

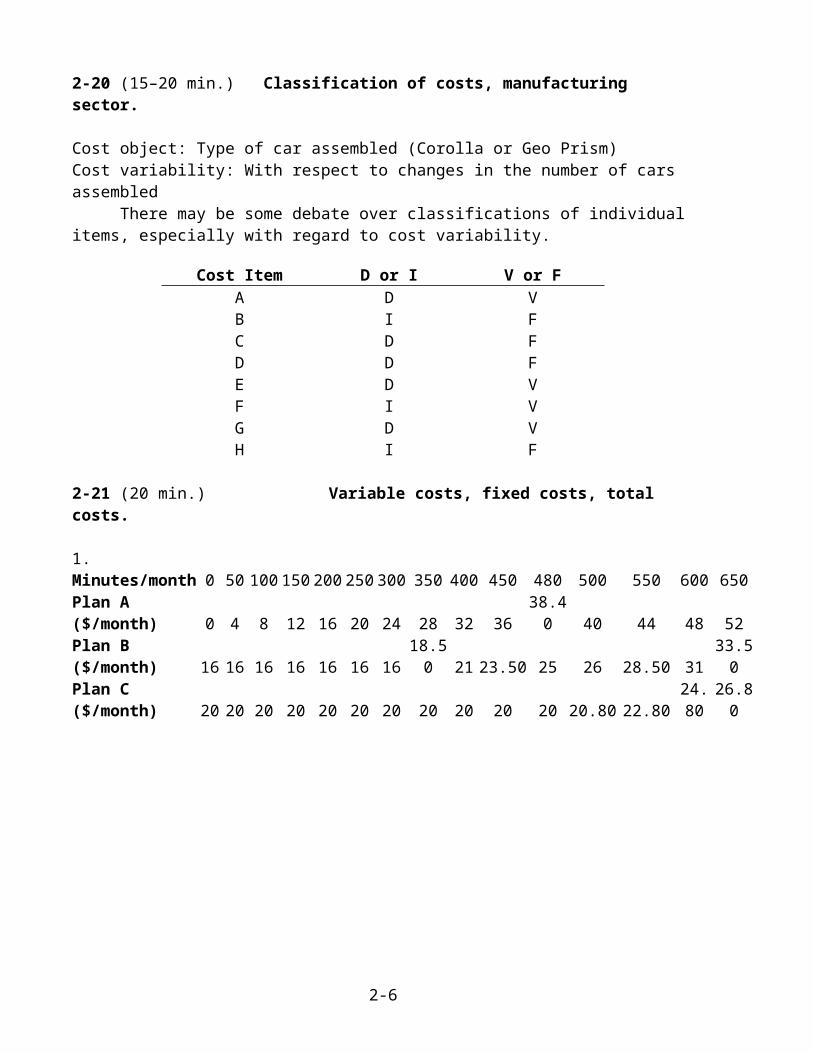
2-20 (15–20 min.) Classification of costs, manufacturing sector.
Cost object: Type of car assembled (Corolla or Geo Prism)Cost variability: With respect to changes in the number of cars assembled
There may be some debate over classifications of individual items, especially with regard to cost variability.
Cost Item D or I V or FA D VB I FC D FD D FE D VF I VG D VH I F
2-21 (20 min.) Variable costs, fixed costs, total costs.
1.Minutes/month 0 50 100 150 200 250 300 350 400 450 480 500 550 600 650Plan A ($/month) 0 4 8 12 16 20 24 28 32 36 38.40 40 44 48 52Plan B ($/month) 16 16 16 16 16 16 16 18.50 21 23.50 25 26 28.50 31 33.50Plan C ($/month) 20 20 20 20 20 20 20 20 20 20 20 20.80 22.80 24.80 26.80
2. In each region, Compo chooses the plan that has the lowest cost. From the graph (or from calculations), we can see that if Compo expects to use 0–200 minutes of long-distance each month, she should buy Plan A; for 200–380 minutes, Plan B; and for over 380 minutes, Plan C. If Compo plans to make 100 minutes of long-distance calls each month, she should choose Plan A; for 300 minutes, choose Plan B; for 500 minutes, choose Plan C.
2-4

2-22 (15–20 min.) Variable costs and fixed costs.
1. Variable cost per ton of beach sand minedSubcontractor $ 80 per tonGovernment tax 50 per ton Total $130 per ton
Fixed costs per month0 to 100 tons of capacity per day = $150,000101 to 200 tons of capacity per day = $300,000201 to 300 tons of capacity per day = $450,000
2.
The concept of relevant range is potentially relevant for both graphs. However, the question does not place restrictions on the unit variable costs. The relevant range for the total fixed costs is from 0 to 100 tons; 101 to 200 tons; 201 to 300 tons, and so on. Within these ranges, the total fixed costs do not change in total.
3.Tons Mined
per DayTons Mined per Month
Fixed Unit Cost per Ton
Variable Unit Cost per Ton
Total Unit Cost per Ton
(1) (2) = (1) × 25 (3) = FC ÷ (2) (4) (5) = (3) + (4)(a) 180 4,500 $300,000 ÷ 4,500 = $66.67 $130 $196.67
(b) 220 5,500 $450,000 ÷ 5,500 = $81.82 $130 $211.82
The unit cost for 220 tons mined per day is $211.82, while for 180 tons it is only $196.67. This difference is caused by the fixed cost increment from 101 to 200 tons being spread over an increment of 80 tons, while the fixed cost increment from 201 to 300 tons is spread over an increment of only 20 tons.
2-5
2-23 (20 min.) Variable costs, fixed costs, relevant range.1. Since the production capacity is 4,000 jaw breakers per month, the current annual relevant range of output is 0 to 4,000 jaw breakers × 12 months = 0 to 48,000 jaw breakers.
2. Current annual fixed manufacturing costs within the relevant range are $1,000 × 12 = $12,000 for rent and other overhead costs, plus $6,000 ÷ 10 = $600 for depreciation, totaling $12,600. The variable costs, the materials, are 10 cents per jaw breaker, or $3,600 ($0.10 per jaw breaker × 3,000 jaw breakers per month × 12 months) for the year.
3. If demand changes from 3,000 to 6,000 jaw breakers per month, or from 3,000 × 12 = 36,000 to 6,000 × 12 = 72,000 jaw breakers per year, Yumball will need a second machine. Assuming Yumball buys a second machine identical to the first machine, it will increase capacity from 4,000 jaw breakers per month to 8,000. The annual relevant range will be between 4,000 × 12 = 48,000 and 8,000 × 12 = 96,000 jaw breakers. Assume the second machine costs $6,000 and is depreciated using straight-line depreciation over 10 years and zero residual value, just like the first machine. This will add $600 of depreciation per year. Fixed costs for next year will increase to $13,200, $12,600 from the current year + $600 (because rent and other fixed overhead costs will remain the same at $12,000). That is, total fixed costs for next year equal $600 (depreciation on first machine) + $600 (depreciation on second machine) + $12,000 (rent and other fixed overhead costs). The variable cost per jaw breaker next year will be 90% × $0.10 = $0.09. Total variable costs equal $0.09 per jaw breaker × 72,000 jaw breakers = $6,480.
2-6

2-24 (20 min.) Cost drivers and value chain.
1. Identify the customer need (what do faculty and students want in a book?) – Product developmentFind an author – Product developmentMarket the book to faculty – MarketingAuthor writes book – Product developmentProcess orders from bookstores – DistributionEditor edits book – Product developmentReceive unsold copies of book from bookstore – DistributionAuthor rewrites book– Product developmentProvide on-line assistance to faculty and students (study guides, test banks, etc.) – Customer servicePrint and bind the books – ProductionDeliver the book to bookstores – Distribution
2. Value Chain Category Activity Cost driverProduct Development
Identify the customer need Number of schools the marketing representative visits to discuss book ideas
Find an author Number of potential authors interviewedAuthor writes book Number of pages of text
Amount paid to the author (direct labor cost as cost driver)
Editor edits book Number of changes editor makesNumber of pages of text
Author rewrites book Number of times author must do rewritesProduction Print and bind the books Machine hours for running the printing and
binding equipmentMarketing Market the book to faculty Number of schools the marketing representative
visits to market the bookHours spent with prospective customers to sell the book
Distribution Process orders from bookstores Number of deliveries made to bookstoresNumber of schools that adopt the new bookNumber of books ordered by bookstores (Note: Number of purchase orders would be a better driver, but it is not on the list of activities.)
Deliver the book to bookstores Number of deliveries made to bookstores
Receive unsold copies of book from bookstores
Number of unsold books sent back from bookstores
Customer service
Provide on-line assistance to faculty and students
Number of faculty that adopt the new bookNumber of books ordered by bookstores (probably net of number of unsold books sent back from bookstores)
2-7

2-25 (10–15 min.) Cost drivers and functions.
1.
Function Representative Cost Driver1. Accounting Number of transactions processed2. Human Resources Number of employees3. Data processing Hours of computer processing unit (CPU)4. Research and development Number of research scientists5. Purchasing Number of purchase orders6. Distribution Number of deliveries made7. Billing Number of invoices sent
2.
Function Representative Cost Driver1. Accounting Number of journal entries made2. Human Resources Salaries and wages of employees3. Data Processing Number of computer transactions4. Research and Development Number of new products being developed5. Purchasing Number of different types of materials purchased6. Distribution Distance traveled to make deliveries7. Billing Number of credit sales transactions
2-8

2-26 (20 min.) Total costs and unit costs
1.
2. Number of attendees 0 100 200 300 400 500 600Total costs (fixed + variable) $1,600 $2,000 $2,400 $2,800 $3,200 $3,600 $4,000 Costs per attendee (total costs
number of attendees) $20.00 $12.00 $9.33 $ 8.00 $ 7.20 $ 6.67
As shown in the table above, for 100 attendees the total cost will be $2,000 and the cost per attendee will be $20.
3. As shown in the table in requirement 2, for 500 attendees the total cost will be $3,600 and the cost per attendee will be $7.20.
2-9
Number of attendees 0 100 200 300 400 500 600Variable cost per person ($9 caterer charge – $5 student door fee) $4 $4 $4 $4 $4 $4 $4Fixed Costs $1,600 $1,600 $1,600 $1,600 $1,600 $1,600 $1,600Variable costs (number of attendees × variable cost per person) 0 400 800 1,200 1,600 2,000 2,400Total costs (fixed + variable) $1,600 $2,000 $2,400 $2,800 $3,200 $3,600 $4,000

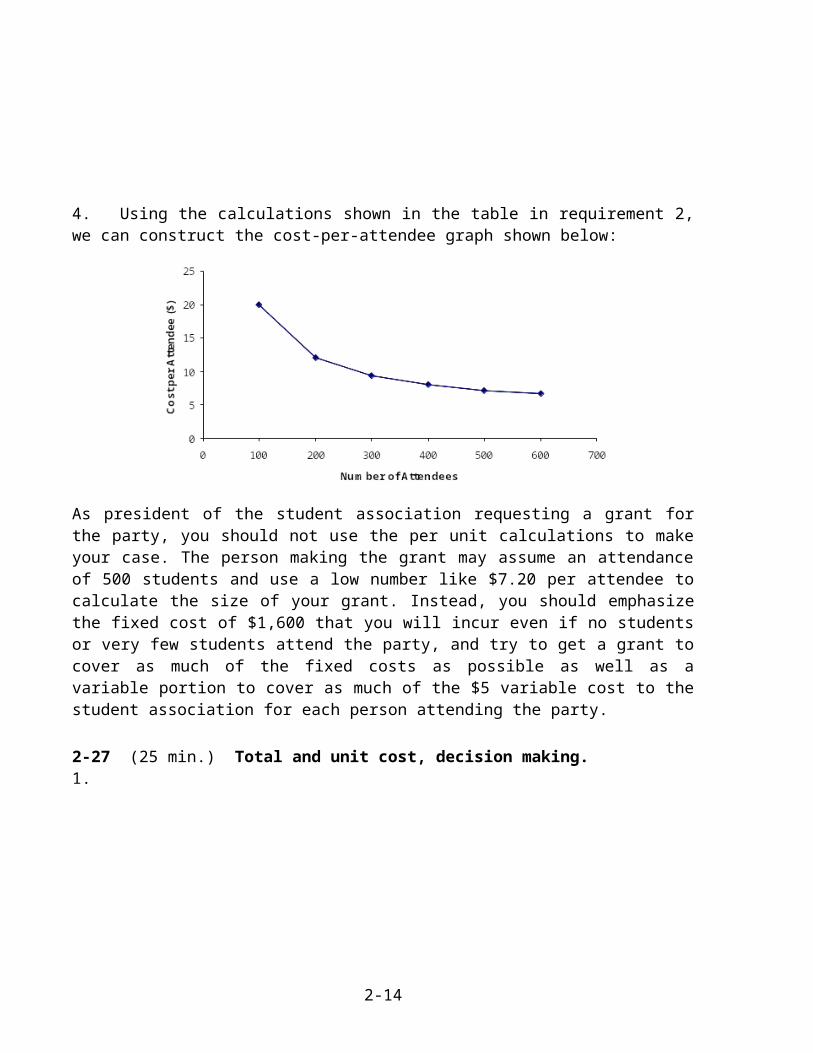
4. Using the calculations shown in the table in requirement 2, we can construct the cost-per-attendee graph shown below:
As president of the student association requesting a grant for the party, you should not use the per unit calculations to make your case. The person making the grant may assume an attendance of 500 students and use a low number like $7.20 per attendee to calculate the size of your grant. Instead, you should emphasize the fixed cost of $1,600 that you will incur even if no students or very few students attend the party, and try to get a grant to cover as much of the fixed costs as possible as well as a variable portion to cover as much of the $5 variable cost to the student association for each person attending the party.
2-27 (25 min.) Total and unit cost, decision making.1.
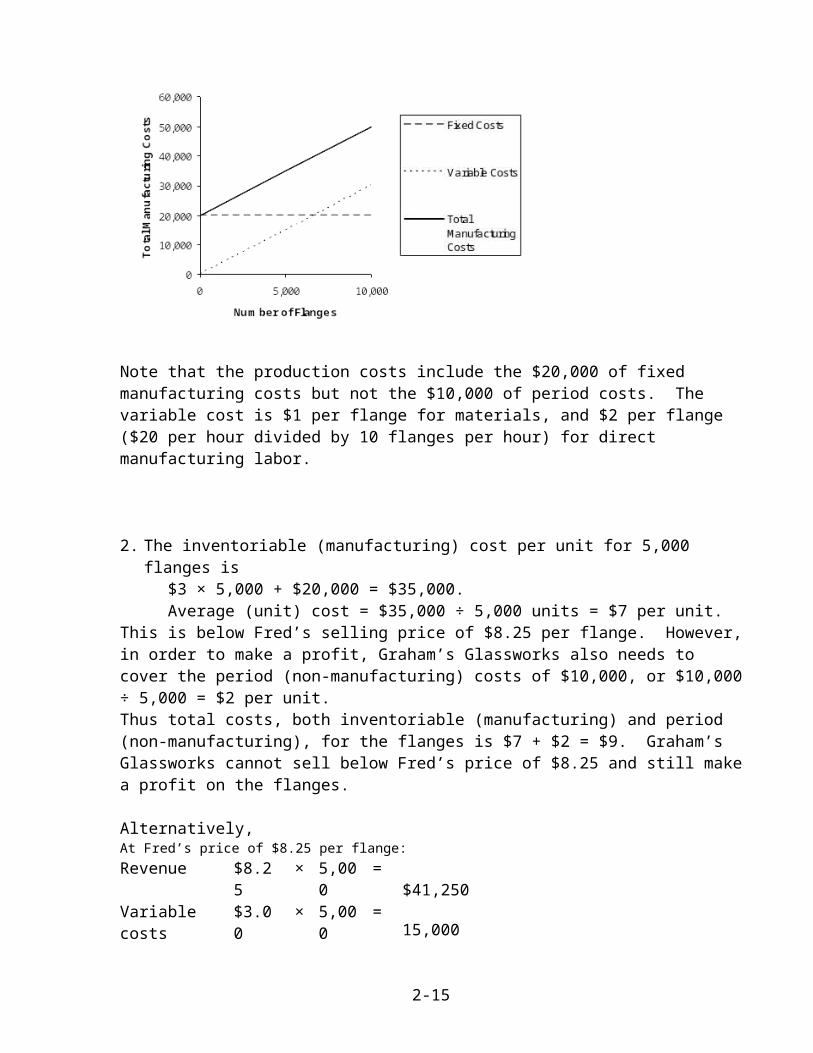
Note that the production costs include the $20,000 of fixed manufacturing costs but not the $10,000 of period costs. The variable cost is $1 per flange for materials, and $2 per flange ($20 per hour divided by 10 flanges per hour) for direct manufacturing labor.
2-10

2. The inventoriable (manufacturing) cost per unit for 5,000 flanges is $3 × 5,000 + $20,000 = $35,000.Average (unit) cost = $35,000 ÷ 5,000 units = $7 per unit.
This is below Fred’s selling price of $8.25 per flange. However, in order to make a profit, Graham’s Glassworks also needs to cover the period (non-manufacturing) costs of $10,000, or $10,000 ÷ 5,000 = $2 per unit.Thus total costs, both inventoriable (manufacturing) and period (non-manufacturing), for the flanges is $7 + $2 = $9. Graham’s Glassworks cannot sell below Fred’s price of $8.25 and still make a profit on the flanges.
Alternatively,At Fred’s price of $8.25 per flange:Revenue $8.25 × 5,000 = $41,250Variable costs $3.00 × 5,000 = 15,000Fixed costs 30,000Operating Loss $ (3,750)
Graham’s Glassworks cannot sell below $8.25 per flange and make a profit. At Fred’s price of $8.25 per flange, the company has an operating loss of $3,750.
3. If Graham’s Glassworks produces 10,000 units, then total inventoriable cost will be:Variable cost ($3 × $10,000 ) + fixed manufacturing costs, $20,000 = total manufacturing costs, $50,000.
Unit total cost including both inventoriable and period costs will be ($50,000 +$10,000) ÷ 10,000 = $6 per flange, and Graham’s Glassworks will be able to sell the flanges for less than Fred and still make a profit.
Alternatively,At Fred’s price of $8.25 per flange:
Revenue $8.25 × 10,000 = $ 82,500Variable costs $3.00 × 10,000 = 30,000Fixed costs 30,000Operating income $ 22,500
Graham’s Glassworks can sell at a price below $8.25 per flange and still make a profit. The company earns operating income of $22,500 at a price of $8.25 per flange. The company will earn operating income as long as the price exceeds $6.00 per flange.
The reason the unit cost decreases significantly is that inventoriable (manufacturing) fixed costs and fixed period (nonmanufacturing) costs remain the same regardless of the number of units produced. So, as Graham’s Glassworks produces more units, fixed costs are spread over more units, and cost per unit decreases. This means that if you use unit costs to make decisions about pricing, and which product to produce, you must be aware that the unit cost only applies to a particular level of output.
2-28 (20–30 min.) Inventoriable costs versus period costs.
2-11

1. Manufacturing-sector companies purchase materials and components and convert them into different finished goods. Merchandising-sector companies purchase and then sell tangible products without changing their basic form.
Service-sector companies provide services or intangible products to their customers—for example, legal advice or audits.
Only manufacturing and merchandising companies have inventories of goods for sale.
2. Inventoriable costs are all costs of a product that are regarded as an asset when they are incurred and then become cost of goods sold when the product is sold. These costs for a manufacturing company are included in work-in-process and finished goods inventory (they are “inventoried”) to build up the costs of creating these assets. Period costs are all costs in the income statement other than cost of goods sold. These costs are treated as expenses of the period in which they are incurred because they are presumed not to benefit future periods (or because there is not sufficient evidence to conclude that such benefit exists). Expensing these costs immediately best matches expenses to revenues.
3. (a) Mineral water purchased for resale by Safeway—inventoriable cost of a merchandising company. It becomes part of cost of goods sold when the mineral water is sold.
(b) Electricity used at GE assembly plant—inventoriable cost of a manufacturing company. It is part of the manufacturing overhead that is included in the manufacturing cost of a refrigerator finished good.
(c) Depreciation on Google’s computer equipment—period cost of a service company. Google has no inventory of goods for sale and, hence, no inventoriable cost.
(d) Electricity for Safeway’s store aisles—period cost of a merchandising company. It is a cost that benefits the current period and it is not traceable to goods purchased for resale.
(e) Depreciation on GE’s assembly testing equipment—inventoriable cost of a manufacturing company. It is part of the manufacturing overhead that is included in the manufacturing cost of a refrigerator finished good.
(f) Salaries of Safeway’s marketing personnel—period cost of a merchandising company. It is a cost that is not traceable to goods purchased for resale. It is presumed not to benefit future periods (or at least not to have sufficiently reliable evidence to estimate such future benefits).
(g) Bottled water consumed by Google’s engineers—period cost of a service company. Google has no inventory of goods for sale and, hence, no inventoriable cost.
(h) Salaries of Google’s marketing personnel—period cost of a service company. Google has no inventory of goods for sale and, hence, no inventoriable cost.
2-12

2-29 (20 min.) Flow of Inventoriable Costs.
(All numbers below are in millions).
1. Direct materials inventory 8/1/2008 $ 90 Direct materials purchased 360 Direct materials available for production 450 Direct materials used 375 Direct materials inventory 8/31/2008 $ 75
2.Total manufacturing overhead costs $ 480 Subtract: Variable manufacturing overhead costs (250)Fixed manufacturing overhead costs for August $ 230
3.Total manufacturing costs $ 1,600 Subtract: Direct materials used (from requirement 1) (375)Total manufacturing overhead costs (480)Direct manufacturing labor costs for August $ 745
4.Work-in-process inventory 8/1/2008 $ 200 Total manufacturing costs 1,600 Work-in-process available for production 1,800 Subtract: Cost of goods manufactured (moved into FG) (1,650)Work-in-process inventory 8/31/2008 $ 150
5. Finished goods inventory 8/1/2008 $ 125 Cost of goods manufactured (moved from WIP) 1,650 Finished goods available for sale in August $ 1,775
6.Finished goods available for sale in August (from requirement 5) $ 1,775 Subtract: Cost of goods sold (1,700)Finished goods inventory 8/31/2008 $ 75
2-13
2-30 (20 min.) Computing cost of goods purchased and cost of goods sold.
(1) Marvin Department StoreSchedule of Cost of Goods Purchased
For the Year Ended December 31, 2008(in thousands)
Purchases $155,000Add transportation-in 7,000
162,000Deduct:Purchase return and allowances $4,000Purchase discounts 6,000 10,000Cost of goods purchased $152,000
(2) Marvin Department StoreSchedule of Cost of Goods Sold
For the Year Ended December 31, 2008(in thousands)
Beginning merchandise inventory 1/1/2008 $ 27,000Cost of goods purchased (above) 152,000Cost of goods available for sale 179,000Ending merchandise inventory 12/31/2008 34,000Cost of goods sold $145,000
2-14
2-31 (30–40 min.) Cost of goods manufactured.
1. Canseco CompanySchedule of Cost of Goods Manufactured
Year Ended December 31, 2009 (in thousands)
Direct materials: Beginning inventory, January 1, 2009 $ 22,000 Purchases of direct materials 75,000 Cost of direct materials available for use 97,000 Ending inventory, December 31, 2009 26,000 Direct materials used $ 71,000 Direct manufacturing labor 25,000 Indirect manufacturing costs: Indirect manufacturing labor 15,000 Plant insurance 9,000 Depreciation—plant building & equipment 11,000 Repairs and maintenance—plant 4,000 Total indirect manufacturing costs 39,000 Manufacturing costs incurred during 2009 135,000 Add beginning work-in-process inventory, January 1, 2009 21,000 Total manufacturing costs to account for 156,000 Deduct ending work-in-process inventory, December 31, 2009 20,000 Cost of goods manufactured (to Income Statement) $136,000
2. Canseco CompanyIncome Statement
Year Ended December 31, 2009 (in thousands)
Revenues $300,000 Cost of goods sold: Beginning finished goods, January 1, 2009 $ 18,000 Cost of goods manufactured 136,000 Cost of goods available for sale 154,000 Ending finished goods, December 31, 2009 23,000 Cost of goods sold 131,000 Gross margin 169,000 Operating costs: Marketing, distribution, and customer-service costs 93,000 General and administrative costs 29,000 Total operating costs 122,000 Operating income $ 47,000
2-15

2-32 (25–30 min.) Income statement and schedule of cost of goods manufactured.
Howell CorporationIncome Statement for the Year Ended December 31, 2009
(in millions)
Revenues $950Cost of goods sold:
Beginning finished goods, Jan. 1, 2009 $ 70Cost of goods manufactured (below) 645Cost of goods available for sale 715Ending finished goods, Dec. 31, 2009 55 660
Gross margin 290Marketing, distribution, and customer-service costs 240Operating income $ 50
Howell CorporationSchedule of Cost of Goods Manufactured
for the Year Ended December 31, 2009(in millions)
Direct materials costs:Beginning inventory, Jan. 1, 2009 $ 15Purchases of direct materials 325Cost of direct materials available for use 340Ending inventory, Dec. 31, 2009 20
Direct materials used $320Direct manufacturing labor costs 100Indirect manufacturing costs:
Indirect manufacturing labor 60Plant supplies used 10Plant utilities 30Depreciation––plant and equipment 80Plant supervisory salaries 5Miscellaneous plant overhead 35 220
Manufacturing costs incurred during 2009 640Add beginning work-in-process inventory, Jan. 1, 2009 10Total manufacturing costs to account for 650Deduct ending work-in-process, Dec. 31, 2009 5Cost of goods manufactured $645
2-16

2-33 (15–20 min.) Interpretation of statements (continuation of 2-32).
1. The schedule in 2-32 can become a Schedule of Cost of Goods Manufactured and Sold simply by including the beginning and ending finished goods inventory figures in the supporting schedule, rather than directly in the body of the income statement. Note that the term cost of goods manufactured refers to the cost of goods brought to completion (finished) during the accounting period, whether they were started before or during the current accounting period. Some of the manufacturing costs incurred are held back as costs of the ending work in process; similarly, the costs of the beginning work in process inventory become a part of the cost of goods manufactured for 2009.
2. The sales manager’s salary would be charged as a marketing cost as incurred by both manufacturing and merchandising companies. It is basically an operating cost that appears below the gross margin line on an income statement. In contrast, an assembler’s wages would be assigned to the products worked on. Thus, the wages cost would be charged to Work-in-Process and would not be expensed until the product is transferred through Finished Goods Inventory to Cost of Goods Sold as the product is sold.
3. The direct-indirect distinction can be resolved only with respect to a particular cost object. For example, in defense contracting, the cost object may be defined as a contract. Then, a plant supervisor working only on that contract will have his or her salary charged directly and wholly to that single contract.
4. Direct materials used = $320,000,000 ÷ 1,000,000 units = $320 per unitDepreciation on plant equipment = $80,000,000 ÷ 1,000,000 units = $80 per unit
5. Direct materials unit cost would be unchanged at $320 per unit. Depreciation cost per unit would be $80,000,000 ÷ 1,200,000 = $66.67 per unit. Total direct materials costs would rise by 20% to $384,000,000 ($320 per unit × 1,200,000 units), whereas total depreciation would be unaffected at $80,000,000.
6. Unit costs are averages, and they must be interpreted with caution. The $320 direct materials unit cost is valid for predicting total costs because direct materials is a variable cost; total direct materials costs indeed change as output levels change. However, fixed costs like depreciation must be interpreted quite differently from variable costs. A common error in cost analysis is to regard all unit costs as one—as if all the total costs to which they are related are variable costs. Changes in output levels (the denominator) will affect total variable costs, but not total fixed costs. Graphs of the two costs may clarify this point; it is safer to think in terms of total costs rather than in terms of unit costs.
2-17

2-34 (25–30 min.) Income statement and schedule of cost of goods manufactured.
Chan CorporationIncome Statement
for the Year Ended December 31, 2009(in millions)
Revenues $350Cost of goods sold:
Beginning finished goods, Jan. 1, 2009 $ 40Cost of goods manufactured (below) 204Cost of goods available for sale 244Ending finished goods, Dec. 31, 2009 12 232
Gross margin 118Marketing, distribution, and customer-service costs 90Operating income $ 28
Chan CorporationSchedule of Cost of Goods Manufactured
for the Year Ended December 31, 2009(in millions)
Direct material costs:Beginning inventory, Jan. 1, 2009 $ 30Direct materials purchased 80Cost of direct materials available for use 110Ending inventory, Dec. 31, 2009 5
Direct materials used $105Direct manufacturing labor costs 40Indirect manufacturing costs:
Plant supplies used 6Property taxes on plant 1Plant utilities 5Indirect manufacturing labor costs 20Depreciation––plant and equipment 9Miscellaneous manufacturing overhead costs 10 51
Manufacturing costs incurred during 2009 196Add beginning work-in-process inventory, Jan. 1, 2009 10Total manufacturing costs to account for 206Deduct ending work-in-process inventory, Dec. 31, 2009 2Cost of goods manufactured (to income statement) $204
2-18

2-35 (15–20 min.)Terminology, interpretation of statements (continuation of 2-34).
1. Direct materials used $105 millionDirect manufacturing labor costs 40 millionPrime costs $145 million
Direct manufacturing labor costs $ 40 millionIndirect manufacturing costs 51 millionConversion costs $ 91 million
2. Inventoriable costs (in millions) for Year 2009Plant utilities $ 5Indirect manufacturing labor 20Depreciation—plant and equipment 9Miscellaneous manufacturing overhead 10Direct materials used 105Direct manufacturing labor 40Plant supplies used 6Property tax on plant 1
Total inventoriable costs $196Period costs (in millions) for Year 2009
Marketing, distribution, and customer-service costs $ 90
3. Design costs and R&D costs may be regarded as product costs in case of contracting with a governmental agency. For example, if the Air Force negotiated to contract with Lockheed to build a new type of supersonic fighter plane, design costs and R&D costs may be included in the contract as product costs.
4. Direct materials used = $105,000,000 ÷ 1,000,000 units = $105 per unitDepreciation on plant and equipment = $9,000,000 ÷ 1,000,000 units = $9 per unit
5. Direct materials unit cost would be unchanged at $105. Depreciation unit cost would be $9,000,000 ÷ 1,500,000 = $6 per unit. Total direct materials costs would rise by 50% to $157,500,000 ($105 per unit × 1,500,000 units). Total depreciation cost of $9,000,000 would remain unchanged.
6. In this case, equipment depreciation is a variable cost in relation to the unit output. The amount of equipment depreciation will change in direct proportion to the number of units produced.
(a) Depreciation will be $4 million (1 million × $4) when 1 million units are produced. (b) Depreciation will be $6 million (1.5 million × $4) when 1.5 million units are produced.
2-19

2-36 (20 min.) Labor cost, overtime and idle time.
1.(a) Total cost of hours worked at regular rates42 hours × 12 per hour $ 504.0042 hours × 12 per hour 504.0043 hours × 12 per hour 516.0040 hours × 12 per hour 480.00
2,004.00Minus idle time (5.2 hours × $12 per hour) 62.40Direct manufacturing labor costs $1,941.60
(b) Idle time = 5.2 hours × 12 per hour = (c) Overtime and holiday premium.
$62.40
Week 1: Overtime (42-40) hours × Premium, $6 per hour $ 12.00Week 2: Overtime (42-40) hours ×Premium, $6 per hour 12.00Week 3: Overtime (43-40) hours × Premium, $6 per hour 18.00Week 4: Holiday 8 hours × Premium, $12 per hour 96.00Total overtime and holiday premium $138.00
(d) Total earnings in May Direct manufacturing labor costs $1,941.60Idle time 62.40Overtime and holiday premium 138.00Total earnings $2,142.00
2. Idle time caused by equipment breakdowns and scheduling mixups is an indirect cost of the job because it is not related to a specific job.
Overtime premium caused by the heavy overall volume of work is also an indirect cost because it is not related to a particular job that happened to be worked on during the overtime hours. If, however, the overtime is the result of a demanding “rush job,” the overtime premium is a direct cost of that job.
2-20

2-37 (30–40 min.) Fire loss, computing inventory costs.
1. Finished goods inventory, 2/26/2009 = $50,0002. Work-in-process inventory, 2/26/2009 = $28,0003. Direct materials inventory, 2/26/2009 = $62,000
This problem is not as easy as it first appears. These answers are obtained by working from the known figures to the unknowns in the schedule below. The basic relationships between categories of costs are:
Prime costs (given) = $294,000Direct materials used = $294,000 – Direct manufacturing labor costs
= $294,000 – $180,000 = $114,000Conversion costs = Direct manufacturing labor costs ÷ 0.6
$180,000 ÷ 0.6 = $300,000Indirect manuf. costs = $300,000 – $180,000 = $120,000 (or 0.40 $300,000)
Schedule of ComputationsDirect materials, 1/1/2009 $ 16,000Direct materials purchased 160,000Direct materials available for use 176,000Direct materials, 2/26/2009 3 = 62,000Direct materials used ($294,000 – $180,000) 114,000Direct manufacturing labor costs 180,000Prime costs 294,000Indirect manufacturing costs 120,000Manufacturing costs incurred during the current period 414,000Add work in process, 1/1/2009 34,000Manufacturing costs to account for 448,000Deduct work in process, 2/26/2009 2 = 28,000Cost of goods manufactured 420,000Add finished goods, 1/1/2009 30,000Cost of goods available for sale (given) 450,000Deduct finished goods, 2/26/2009 1 = 50,000Cost of goods sold (80% of $500,000) $400,000
Some instructors may wish to place the key amounts in a Work in Process T-account. This problem can be used to introduce students to the flow of costs through the general ledger (amounts in thousands):
Work in Process Finished Goods
Cost of Goods Sold
BI 34 BI 30DM used 114 COGM 420 -------> 420 COGS 400 ---->400DL 180OH 120 AvailableTo account for 448 for sale 450
EI 28 EI 50
2-21

2-38 (30 min.) Comprehensive problem on unit costs, product costs.
1. If 2 pounds of direct materials are used to make each unit of finished product, 100,000 units × 2 lbs., or 200,000 lbs. were used at $0.70 per pound of direct materials ($140,000 ÷ 200,000 lbs.). (The direct material costs of $140,000 are direct materials used, not purchased.) Therefore, the ending inventory of direct materials is 2,000 lbs. $0.70 = $1,400.
2. Manufacturing Costs for 100,000 unitsVariable Fixed Total
Direct materials costs $140,000 $ – $140,000Direct manufacturing labor costs 30,000 – 30,000Plant energy costs 5,000 – 5,000Indirect manufacturing labor costs 10,000 16,000 26,000Other indirect manufacturing costs 8,000 24,000 32,000Cost of goods manufactured $193,000 $40,000 $233,000
Average unit manufacturing cost: $233,000 ÷ 100,000 units= $2.33 per unit
Finished goods inventory in units: =
= 9,000 units
3. Units sold in 2009 = Beginning inventory + Production – Ending inventory = 0 + 100,000 – 9,000 = 91,000 units
Selling price in 2009 = $436,800 ÷ 91,000= $4.80 per unit
4.Revenues (91,000 units sold × $4.80) $436,800Cost of units sold:
Beginning finished goods, Jan. 1, 2009 $ 0Cost of goods manufactured 233,000Cost of goods available for sale 233,000Ending finished goods, Dec. 31, 2009 20,970 212,030
Gross margin 224,770Operating costs:
Marketing, distribution, and customer-service costs 162,850Administrative costs 50,000 212,850
Operating income $ 11,920
Note: Although not required, the full set of unit variable costs is:Direct materials cost $1.40Direct manufacturing labor cost 0.30Plant energy cost 0.05 = $1.93 per unit manufacturedIndirect manufacturing labor cost 0.10Other indirect manufacturing cost 0.08
Marketing, distribution, and customer-service costs $1.35 per unit sold
2-22

2-39 (20-25 min.) Labor cost classification; ethics.
1. No. The direct manufacturing labor costs are not 20% or greater of total manufacturing costs. Direct manufacturing labor costs are $410,000 which are 16.4% of total manufacturing costs, $410,000 ÷ $2,500,000 = 16.4%
2. Bob Zixson can ask the controller to reclassify at least two of the costs that are currently reported as indirect manufacturing costs to direct manufacturing labor costs. The most logical are the fringe benefits and some of the overtime costs, particularly if it can be argued that some of the overtime was directly caused by jobs. The fringe benefits are logical because they are not only the largest, but can be argued to be a part of normal cost of manufacturing labor. Fringe benefits related to direct manufacturing labor costs together with some of the overtime premium could bring the total direct manufacturing labor cost over the minimum $500,000.
Justification for reclassifying vacation and sick time is similar to that of fringe benefits—that it is a normal cost of labor since it is part of and can be traced to the direct manufacturing laborer’s payment. It is harder to justify reclassifying idle time, since it is difficult to identify a specific job that the idle time relates to. Idle time is also the smallest cost item.
3. The controller should not reclassify overhead costs as direct manufacturing labor costs just so the firm can reap tax benefits particularly if the changes would violate the company’s policy of computing direct manufacturing labor costs. The idea of cost classification is to allow internal (and external) decision making by clarifying what each cost item represents. Also, if costs in only the Costa Melon plant are reclassified, it will be harder for Zix to evaluate the Costa Melon plant, when compared to Zix’s other plants. Nevertheless, some of the arguments presented in requirement 2 can be justified and could prompt a reevaluation of Zix’s direct manufacturing labor classifications.
2-23

2-40 (20–25 min.) Finding unknown amounts.
Let G = given, I = inferredStep 1: Use gross margin formula Case 1 Case 2
Revenues $ 32,000 G $31,800 GCost of goods sold A 20,700 I 20,000 GGross margin $ 11,300 G C $11,800 I
Step 2: Use schedule of cost of goods manufactured formulaDirect materials used $ 8,000 G $ 12,000 GDirect manufacturing labor costs 3,000 G 5,000 GIndirect manufacturing costs 7,000 G D 6,500 IManufacturing costs incurred 18,000 I 23,500 IAdd beginning work in process, 1/1 0 G 800 GTotal manufacturing costs to account for 18,000 I 24,300 IDeduct ending work in process, 12/31 0 G 3,000 GCost of goods manufactured $ 18,000 I $ 21,300 I
Step 3: Use cost of goods sold formulaBeginning finished goods inventory, 1/1 $ 4,000 G $ 4,000 GCost of goods manufactured 18,000 I 21,300 ICost of goods available for sale 22,000 I 25,300 IEnding finished goods inventory, 12/31 B 1,300 I 5,300 GCost of goods sold $ 20,700 I $ 20,000 G
For case 1, do steps 1, 2, and 3 in order.For case 2, do steps 1, 3, and then 2.
2-24