ACCT2522 Course Notes - Amazon Web Services Accounting 1 – Course Notes Understanding P First off,...
6
ACCT2522 MANAGEMENT ACCOUNTING 1 SEMESTER 1 2009 COURSE NOTES Version 1.0.2 (10 th June 2009) kaheiyeh.web.officelive.com
Transcript of ACCT2522 Course Notes - Amazon Web Services Accounting 1 – Course Notes Understanding P First off,...

ACCT2522
MANAGEMENT ACCOUNTING 1
SEMESTER 1 2009 COURSE NOTES
Version 1.0.2 (10th June 2009)
kaheiyeh.web.officelive.com

Contents
Management Accounting 1 – Course Notes – Semester 1 2009 2
CCoonntteennttss Page 3: Understanding Processes and Value Creation
Page 8: Cost Basics
Page 15: Overhead Costs
Page 18: Activity Based Costing
Page 21: Standard Costs and Variance Analysis
Page 24: Costing and Tactical Decisions
Page 28: Transfer Pricing
Page 32: Managing Quality
Page 36: The Theory of Constraints
Page 40: Capital Expenditure Decisions
Page 45: Performance Evaluation and Management Control
Management Accounting 1 – Course Notes
UUnnddeerrssttaannddiinngg PP First off, what is Management Accounting? It is defined by Langfield
“The processes and techniques that focus on the effective an
resources, to support managers in their tasks of enhancing both customer value and shareholder
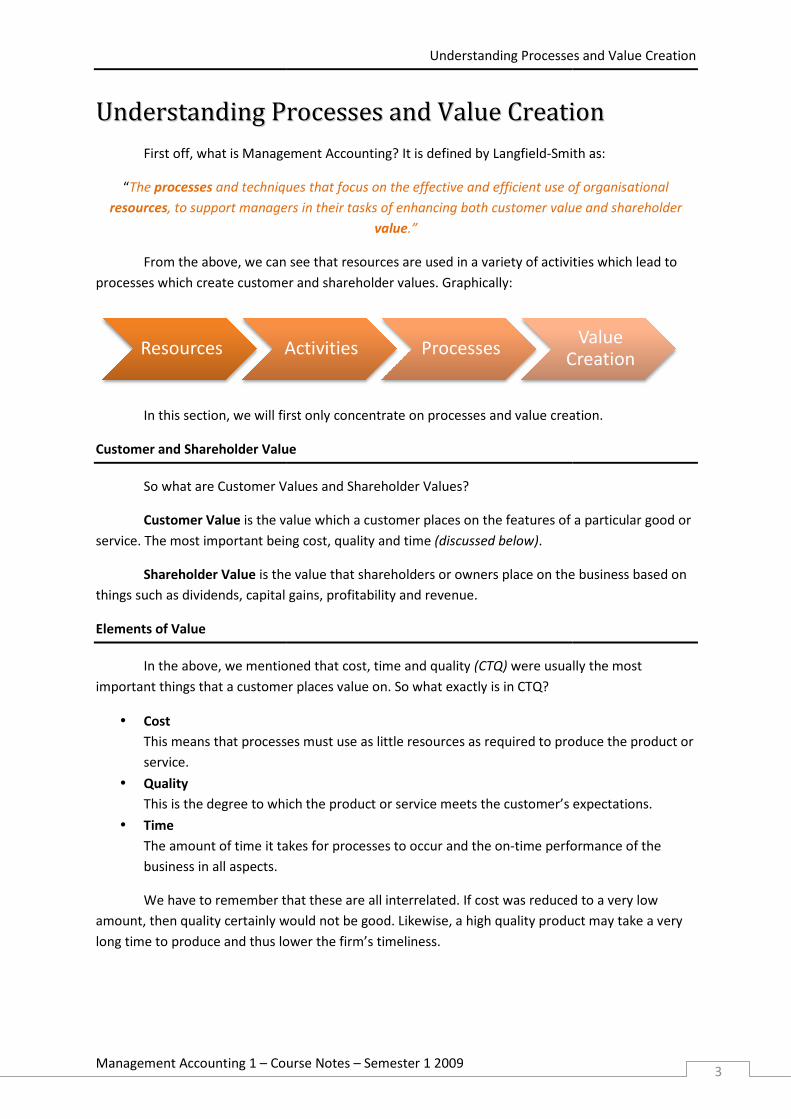
From the above, we can see that resources are used in a variety of activities which lead to processes which create customer and shareholder values. Graphically:
In this section, we will first only concentrate on processes and value creation.
Customer and Shareholder Value
So what are Customer Value
Customer Value is the value which a customer places on service. The most important being cost, quality and time
Shareholder Value is the value that shareholdersthings such as dividends, capital gains, profitability and revenue.
Elements of Value
In the above, we mentioned that cost, time and qualityimportant things that a customer places value on. So what exactly
• Cost This means that processes must use as little resources as required to produce the product or service.
• Quality This is the degree to which the product or service meets the customer’s expectations.
• Time The amount of time it takes for processes to occur and the onbusiness in all aspects.
We have to remember that these are all interrelated. If cost was reduced to a very low amount, then quality certainly would not be good. Likewise, a high quality product may take a very long time to produce and thus lower the firm’s timeliness.
Resources Activities
Understanding Processes and Value Creation
Course Notes – Semester 1 2009
Prroocceesssseess aanndd VVaalluuee CCrreeaattiiFirst off, what is Management Accounting? It is defined by Langfield-Smith as:
and techniques that focus on the effective and efficient use of organisational
, to support managers in their tasks of enhancing both customer value and shareholder
value.”
From the above, we can see that resources are used in a variety of activities which lead to tomer and shareholder values. Graphically:
In this section, we will first only concentrate on processes and value creation.
Value
So what are Customer Values and Shareholder Values?
is the value which a customer places on the features of service. The most important being cost, quality and time (discussed below).
is the value that shareholders or owners place on the business based on as dividends, capital gains, profitability and revenue.
oned that cost, time and quality (CTQ) were usually the most important things that a customer places value on. So what exactly is in CTQ?
processes must use as little resources as required to produce the product or
This is the degree to which the product or service meets the customer’s expectations.
The amount of time it takes for processes to occur and the on-time performance of the
We have to remember that these are all interrelated. If cost was reduced to a very low amount, then quality certainly would not be good. Likewise, a high quality product may take a very
hus lower the firm’s timeliness.
Activities Processes Creation
Understanding Processes and Value Creation
3
iioonn Smith as:
d efficient use of organisational
, to support managers in their tasks of enhancing both customer value and shareholder
From the above, we can see that resources are used in a variety of activities which lead to
In this section, we will first only concentrate on processes and value creation.
the features of a particular good or
place on the business based on
were usually the most
processes must use as little resources as required to produce the product or
This is the degree to which the product or service meets the customer’s expectations.
performance of the
We have to remember that these are all interrelated. If cost was reduced to a very low amount, then quality certainly would not be good. Likewise, a high quality product may take a very
Value Creation

Understanding Processes and Value Creation
Management Accounting 1 – Course Notes – Semester 1 2009 4
Resources
Resources are both the financial and non-financial items that an organisation uses to run the business. Non-financial resources are usually used to determine the competency of a firm.
Examples of resources include cash and supplies.
Processes
A process is a group of activities that, when done together in sequential order, utilise the firm’s resources to produce a result. From this, we can define an activity as a subset of a process. I.e. A step in a process.
In the definition of a process, we stated that activities were done in a sequential order. These activities are related to each other because the completion of one is required to start another. A string of activities is separated by the points, where an output occurs or information is passed along, into individual activities.
Processes can either be operational or administrative. To classify a process into either of these categories requires knowledge of the firm and its context. An accountant filing a tax return for a car manufacturer would be seen as an administrative process, where as an accountant that does tax returns for clients would see this as an operational process.
Process Analysis
Four objectives are usually included in process analysis. These are:
1. Understanding This process divides the business into processes and activities which makes it easier for management to understand the structure and flow of the business. It becomes a lot easier to see relationships between activities/processes and the links between them. This is usually done with process mapping (discussed on the next page).
2. Monitoring This objective involves continually monitoring processes and improving on them with comparison to benchmarks and targets. This is usually done by utilising Statistical Process Control (SPC; discussed later).
3. Prioritising This process allows management to decide which processes are most critical to the business’s survival and thus, allow them to most appropriately address issues in a timely matter. This usually achieved with the aid of a Pareto diagram (discussed later).
4. Problem Solving Process analysis assists in problem solving by opening up and showing to management the business’s processes. This means management now have a much clearer view of problems and issues in each process.
Collectively, they are usually known as UMPP or UMPPS. A smart student should have noted by now that process analysis is actually a process itself!
Understanding Processes and Value Creation
Management Accounting 1 – Course Notes – Semester 1 2009 5
The first step is to identify the process of interest which is usually one that’s critical to the business.
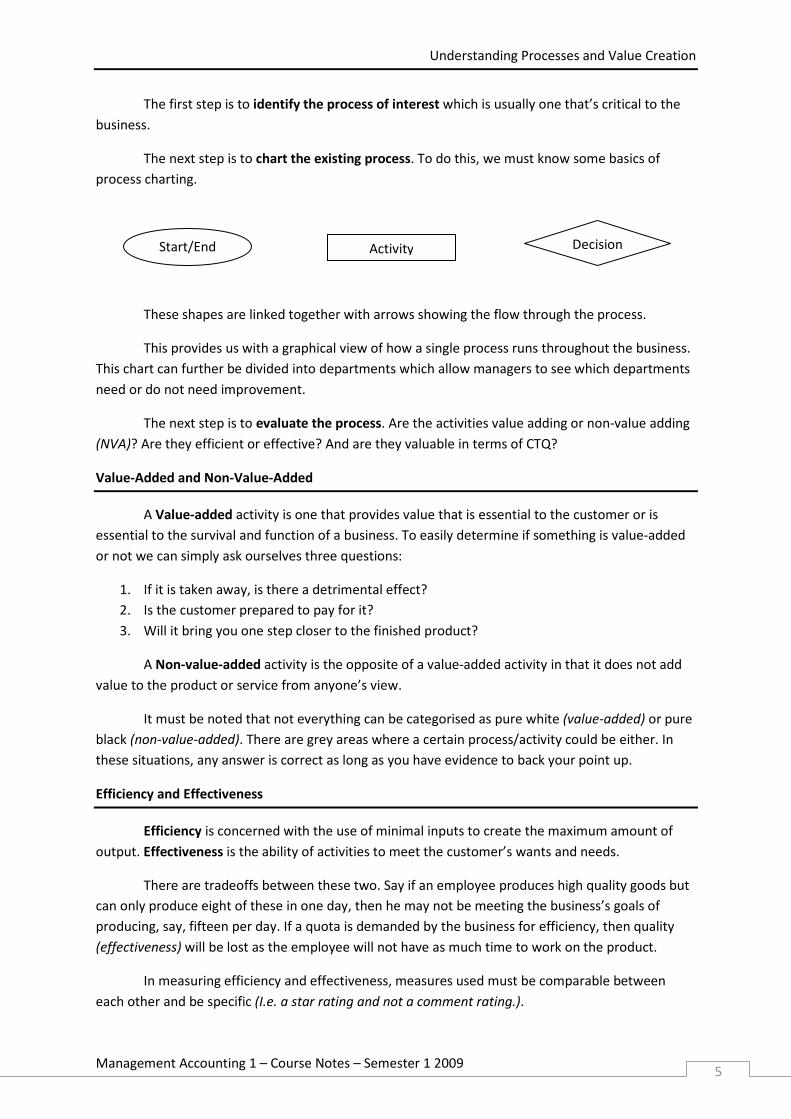
The next step is to chart the existing process. To do this, we must know some basics of process charting.
These shapes are linked together with arrows showing the flow through the process.
This provides us with a graphical view of how a single process runs throughout the business. This chart can further be divided into departments which allow managers to see which departments need or do not need improvement.
The next step is to evaluate the process. Are the activities value adding or non-value adding (NVA)? Are they efficient or effective? And are they valuable in terms of CTQ?
Value-Added and Non-Value-Added
A Value-added activity is one that provides value that is essential to the customer or is essential to the survival and function of a business. To easily determine if something is value-added or not we can simply ask ourselves three questions:
1. If it is taken away, is there a detrimental effect? 2. Is the customer prepared to pay for it? 3. Will it bring you one step closer to the finished product?
A Non-value-added activity is the opposite of a value-added activity in that it does not add value to the product or service from anyone’s view.
It must be noted that not everything can be categorised as pure white (value-added) or pure black (non-value-added). There are grey areas where a certain process/activity could be either. In these situations, any answer is correct as long as you have evidence to back your point up.
Efficiency and Effectiveness
Efficiency is concerned with the use of minimal inputs to create the maximum amount of output. Effectiveness is the ability of activities to meet the customer’s wants and needs.
There are tradeoffs between these two. Say if an employee produces high quality goods but can only produce eight of these in one day, then he may not be meeting the business’s goals of producing, say, fifteen per day. If a quota is demanded by the business for efficiency, then quality (effectiveness) will be lost as the employee will not have as much time to work on the product.
In measuring efficiency and effectiveness, measures used must be comparable between each other and be specific (I.e. a star rating and not a comment rating.).
Start/End Decision Activity

Understanding Processes and Value Creation
Management Accounting 1 – Course Notes – Semester 1 2009 6
Value
In terms of CTQ, value is described in terms of cost, time and quality.
• Cost Costs must be measured frequently and reduced as much as possible, but beware of the consequences of reducing too much on efficiency and effectiveness.
• Quality This should also be measured frequently but beware of the effects of reducing or increasing this on costs and time.
• Time Process, Waiting, Manufacturing, Inspection (PWMI) times should be kept to a minimum to ensure timeliness.
Tools to evaluate the process
Generally, four approaches are used:
• Root Cause Analysis This analysis looks at one, and only one, main reason why something happened.
• Fishbone Analysis This analysis looks at a group of potential causes and the individual processes that caused those main causes are also looked at. See Exhibit 2.17 in BDMM Chapter 2, Page 53 for a diagram.
• Statistical Process Control (SPC) A statistical process control is generally looking at something which varies between an upper and lower control limit (3 standard deviations above and below the mean respectively), such as the amount of water inside a water bottle varies and is not always the same. This assesses the variations in the process and also allows management to address the causes of very large variations above and below the limits.
• Pareto Diagrams This diagram is based on the 80/20 theory where 20% of the population holds 80% of the wealth in the world. This same theory is applied to Pareto Diagrams where small problems account for a lot of the firm’s quality problems. These diagrams show the relative size of problems encountered in a process. In this sense, it is a very useful prioritising tool for management to use as it shows relative sizes.
Process Improvement
Processes can be improved by doing any of the following to activities:
• Activity Elimination This means eliminating an activity altogether. Bear in mind that value-added activities should not be removed and only non-value-added activities should be removed.
• Activity Selection This means selecting the activity that costs the least for the same quality level.