Accretive Health - Quality Care - Health Care Quality
33
DECEMBER 3, 2012 Quality and Care Coordination Driving Growth Through Measured Results
-
Upload
accretivehealth -
Category
Documents
-
view
886 -
download
0
description
http://www.accretivehealth.com/AboutUs/CreatingValueinHealthcare/tabid/425/Default.aspx
Transcript of Accretive Health - Quality Care - Health Care Quality
DECEMBER 3, 2012
Quality and Care Coordination
Driving Growth Through Measured Results

Driving Growth Through Measured Results
Certain statements contained in this presentation may be considered forward-looking as
defined by the Private Securities Litigation Reform Act of 1995. In particular, any statements
made about Accretive Health’s expectations for future financial and operational performance,
expected growth, new services, profitability or business outlook are forward-looking
statements. Investors are cautioned not to place undue reliance on such forward-looking
statements. There is no assurance that the matters contained in such statements will occur
since these statements involve various risks and uncertainties that could cause actual
results to differ materially from those expressed in such forward-looking statements. These
risks and uncertainties include those listed under the heading Risk Factors in the company’s
Quarterly Report on Form 10-Q for the quarter ended September 30, 2012, which is available
on the SEC’s website as well as in the investor relations portion of Accretive Health’s website
at www.accretivehealth.com. The forward-looking statements made in this presentation are
based on the company’s beliefs and expectations as of December 3, 2012 only and should
not be relied upon as representing the company’s views as of any subsequent date. While the
company may elect to update these forward-looking statements at some point in the future,
Accretive Health specifically disclaims any obligation to do so, even if its views change.
Safe Harbor
2
Driving Growth Through Measured Results
Use of Non-GAAP Financial Measures
*Reconciliations of non-GAAP measures to their most directly comparable GAAP measures are presented, where possible in the Appendix, as well as in the
Company’s financial press releases and related Form 8-K filings with the Securities and Exchange Commission. This information can be accessed for free in
the Investor Relations section of the Company’s website at www.accretivehealth.com
We believe adjusted EBITDA is useful to stockholders in evaluating our
operating performance for the following reasons:
• these and similar non-GAAP measures are widely used by investors to
measure a company’s operating performance without regard to items that
can vary substantially from company to company depending upon financing
and accounting methods, book values of assets, capital structures and the
methods by which assets were acquired;
• securities analysts often use adjusted EBITDA and similar non-GAAP
measures as supplemental measures to evaluate the overall operating
performance of companies; and
• by comparing our adjusted EBITDA in different historical periods, our
stockholders can evaluate our operating results without the additional
variations of interest income (expense), income tax expense (benefit),
depreciation and amortization expense and share-based compensation
expense.
We understand that, although measures similar to adjusted EBITDA are
frequently used by investors and securities analysts in their evaluation of
companies, these measures have limitations as analytical tools, and you
should not consider it in isolation or as a substitute for analysis of our
results of operations as reported under GAAP. To properly and prudently
evaluate our business, we encourage you to review the GAAP financial
statements included elsewhere in our regulatory filings, including the
Preliminary Prospectus, Form 8-K, and Form 10-K, and not to rely on any
single financial measure to evaluate our business.
In order to provide stockholders with greater insight and to
allow for better understanding of how our management and
board of directors analyze our financial performance and
make operational decisions, we supplement our condensed
consolidated financial statements presented on a GAAP
basis with the adjusted EBITDA and adjusted net income
measures *.
Adjusted EBITDA measure has limitations, as noted below,
and should not be considered in isolation or in substitute for
analysis of our results as reported under GAAP.
Our management uses adjusted EBITDA:
• as a measure of operating performance, because it does not
include the impact of items that we do not consider indicative
of our core operating performance;
• for planning purposes, including the preparation of our
annual operating budget;
• to allocate resources to enhance the financial performance
of our business;
• to evaluate the effectiveness of our business strategies; and
• in communications with our board of directors and investors
concerning our financial performance.
3

Driving Growth Through Measured Results
ACCRETIVE HEALTH OVERVIEW
Driving Growth Through Measured Results
• Our primary goal is to help our healthcare clients strengthen their financial
stability and deliver better care to the communities they serve
• We use technology to drive best practices and best outcomes
• We work collaboratively with clients to create solutions to existing challenges
• We promote an entrepreneurial culture to encourage innovation and
continuously upgrade our functionality with a focus on value creation
Our Guiding Principles
5
Driving Growth Through Measured Results
Founded in 2003, headquartered in Chicago
Win – Win Proposition with our Client Partners
• We are paid based on our results; no upfront costs for Quality or Revenue Cycle Services
• We have partnered with some of the most well-respected health systems in the U.S.
We Drive Measured Results for our Partners
• Since inception we have delivered $1.5 billion in cash benefits to clients
Innovation and Operational Excellence is at the Core of What We Do
• Success of our RCM offering is driven by applying technology and innovative process
improvements to drive measurable results
• Seeded Physician Advisory Services in 2009, now a $60 million run-rate business
• Developed unique offerings to improve care quality at lower costs – Intra-Stay Quality and
Population Health Management Infrastructure
Accretive Health Snapshot
6
Driving Growth Through Measured Results 7
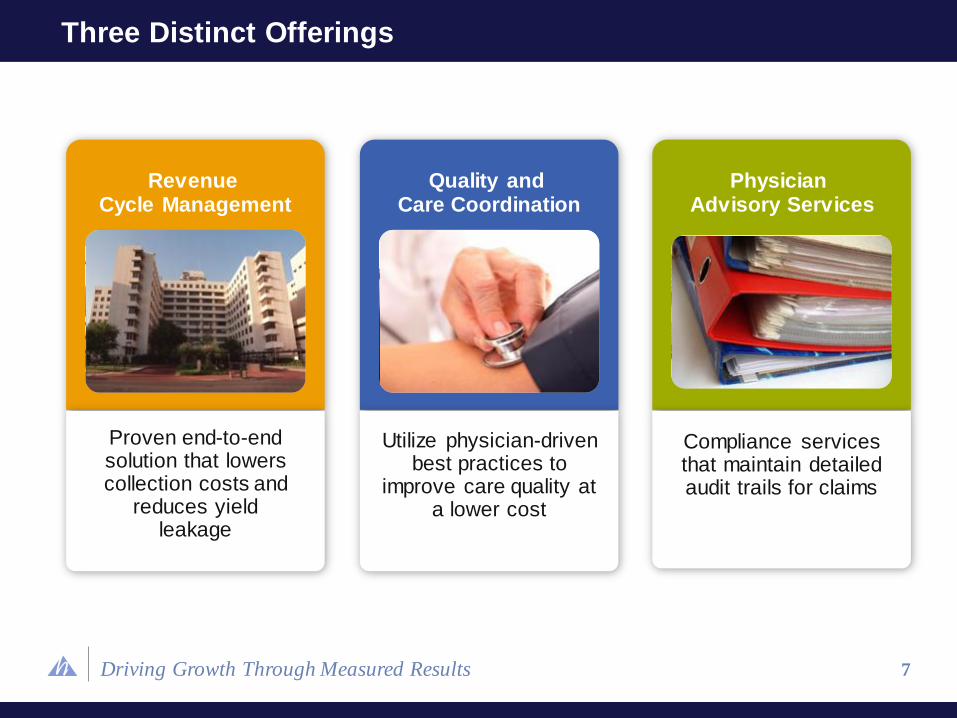
Three Distinct Offerings
Proven end-to-end solution that lowers collection costs and
reduces yield leakage
Utilize physician-driven best practices to
improve care quality at a lower cost
Compliance services that maintain detailed audit trails for claims
Physician Advisory Services
Quality and Care Coordination
Revenue Cycle Management
Driving Growth Through Measured Results
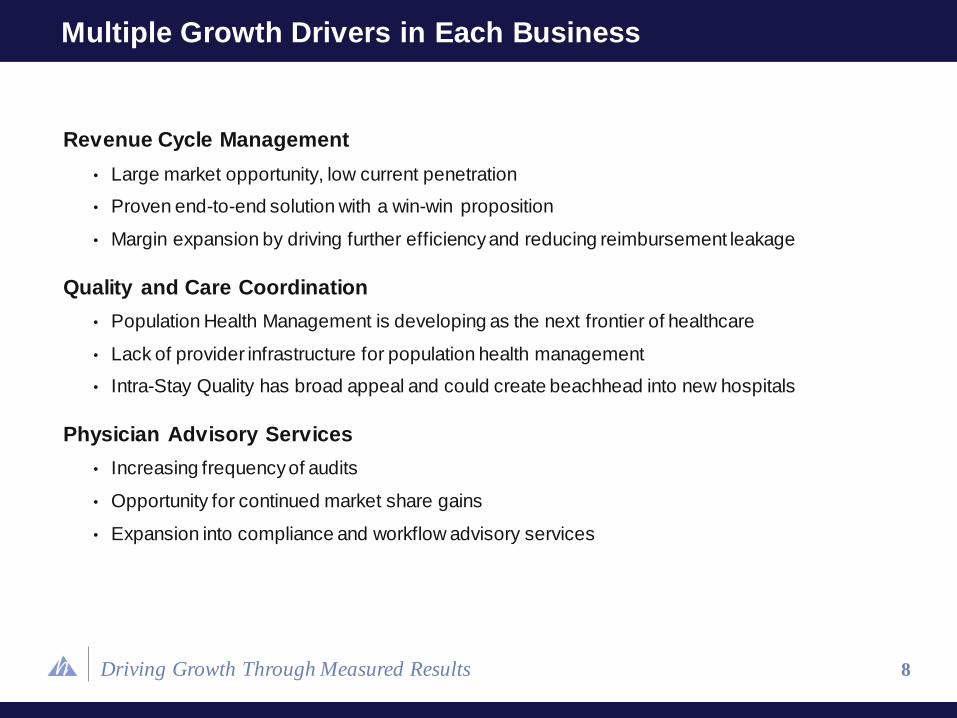
Revenue Cycle Management
• Large market opportunity, low current penetration
• Proven end-to-end solution with a win-win proposition
• Margin expansion by driving further efficiency and reducing reimbursement leakage
Quality and Care Coordination
• Population Health Management is developing as the next frontier of healthcare
• Lack of provider infrastructure for population health management
• Intra-Stay Quality has broad appeal and could create beachhead into new hospitals
Physician Advisory Services
• Increasing frequency of audits
• Opportunity for continued market share gains
• Expansion into compliance and workflow advisory services
Multiple Growth Drivers in Each Business
8
Driving Growth Through Measured Results 9
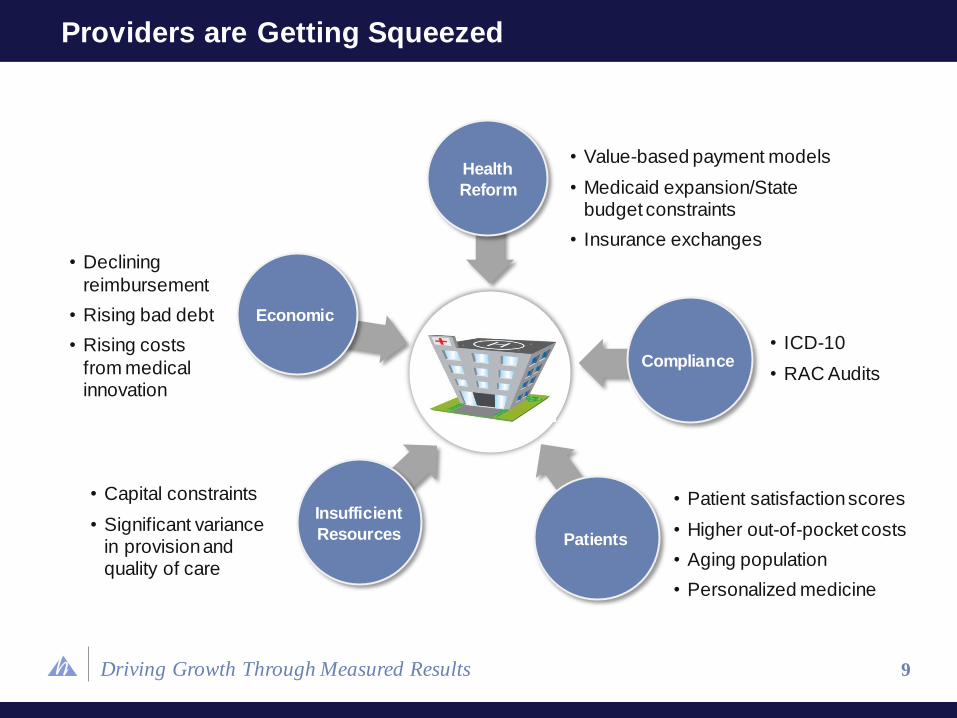
Providers are Getting Squeezed
• Capital constraints
• Significant variance in provision and quality of care
• Declining
reimbursement
• Rising bad debt
• Rising costs
from medical innovation
• Value-based payment models
• Medicaid expansion/State budget constraints
• Insurance exchanges
• ICD-10
• RAC Audits
• Patient satisfaction scores
• Higher out-of-pocket costs
• Aging population
• Personalized medicine
Patients
Compliance
Health
Reform
Economic
Insufficient
Resources

Driving Growth Through Measured Results
Market Size
% to AH Revenue
Revenue Opportunity
Sources: CMS National Healthcare Expenditures, September 2011 and Definitive Healthcare
RCM market scope includes net patient revenue at all hospitals based on CMS 2014 projected expenditures
Quality market scope includes all hospital and physician expenditures
PAS market scope includes all hospitals with >$250 million in net patient revenue
10
Market Opportunity
$50 Billion
$100 Billion
$850 Million
0.12% 6.25% 5.0%
$1.0 Trillion $1.6 Trillion $ 710 billion
PAS Quality RCM
Driving Growth Through Measured Results
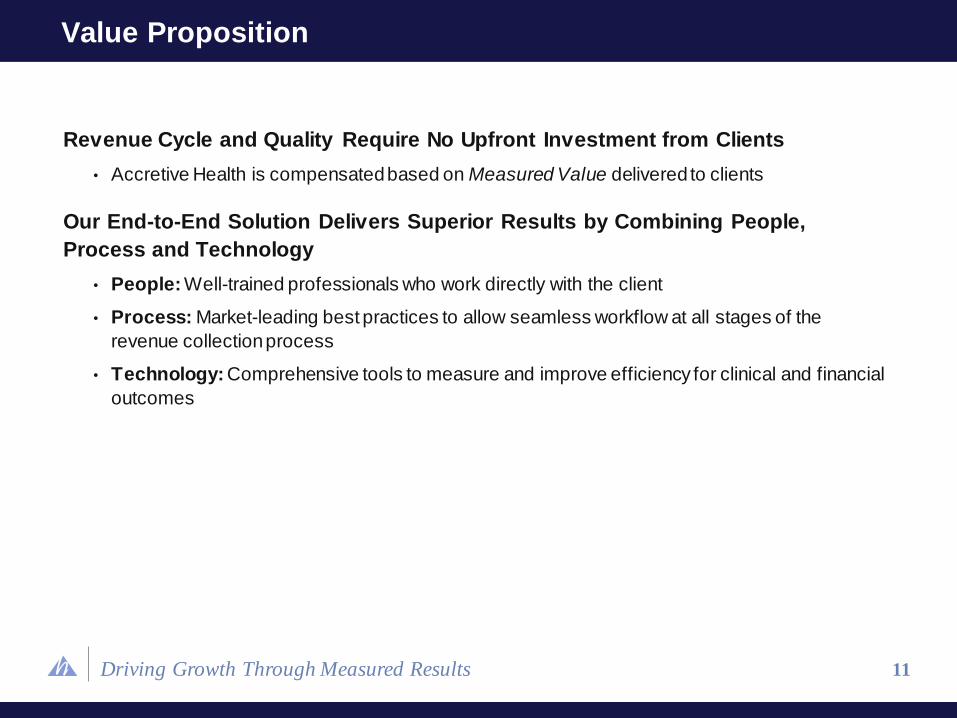
Revenue Cycle and Quality Require No Upfront Investment from Clients
• Accretive Health is compensated based on Measured Value delivered to clients
Our End-to-End Solution Delivers Superior Results by Combining People,
Process and Technology
• People: Well-trained professionals who work directly with the client
• Process: Market-leading best practices to allow seamless workflow at all stages of the
revenue collection process
• Technology: Comprehensive tools to measure and improve efficiency for clinical and financial
outcomes
Value Proposition
11
Driving Growth Through Measured Results
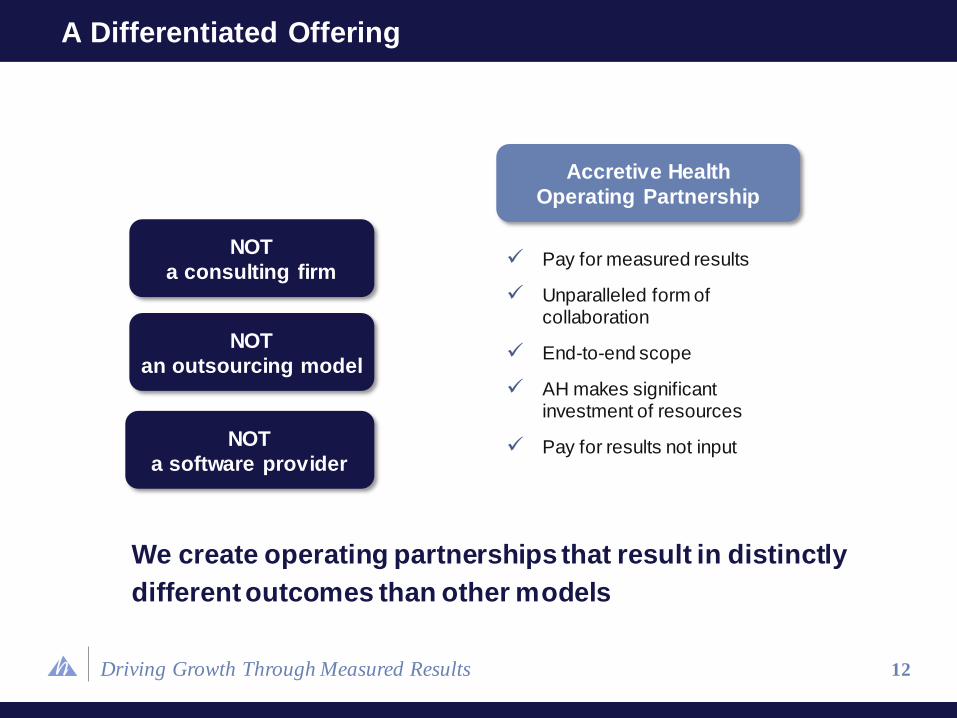
Pay for measured results
Unparalleled form of collaboration
End-to-end scope
AH makes significant investment of resources
Pay for results not input
12
A Differentiated Offering
We create operating partnerships that result in distinctly
different outcomes than other models
NOT
a consulting firm
Accretive Health
Operating Partnership
NOT
a software provider
NOT
an outsourcing model

Driving Growth Through Measured Results
SaaS /
Technology- Supported RCM
Consulting
IT Outsourcing /
Non-HC BPO
Payor Follow-Up
Patient Advocacy
Patient Share
Lost Charges
Compliance
4-6% (Measured)
Value Proposition
(% revenue lift)
Est. 0.5-1% (Not Measured)
Est. 0.5-1% (Measured)
Est. 0.5-1.5% (Not Measured)
Note: Based on Accretive Health’s estimates
13
End-to-End RCM Solution Provides Competitive Advantages
Driving Growth Through Measured Results 14
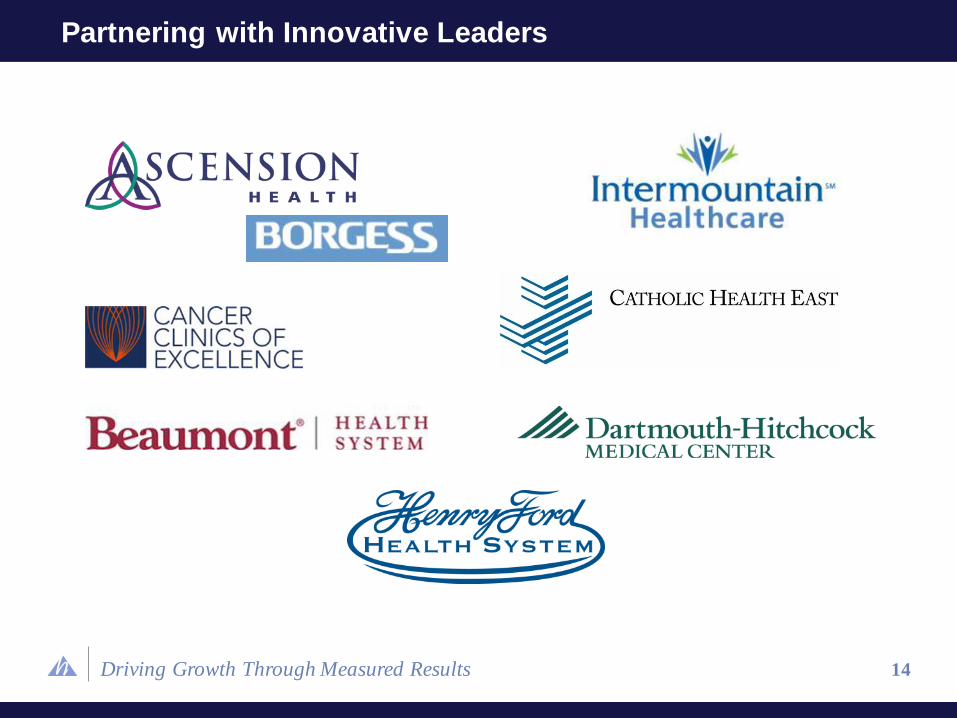
Partnering with Innovative Leaders

Driving Growth Through Measured Results
QUALITY AND CARE COORDINATION
Driving Growth Through Measured Results
DR. WALTER ETTINGER
TIM BARRY President, Quality and Care Coordination
Chief Medical Officer
16

Driving Growth Through Measured Results 17
Market Overview
$148 $356
$1,102
$2,851
$4,791
$8,223
$78 $187
$628
$1,185
$1,888
$3,265
5.1%
7.1%
9.0%
12.4%
13.7%
17.6%
3.8%
5.1%
6.6%
6.9%
7.8%
9.5%
0%
2%
4%
6%
8%
10%
12%
14%
16%
18%
20%
$-
$1,000
$2,000
$3,000
$4,000
$5,000
$6,000
$7,000
$8,000
$9,000
1960 1970 1980 1990 2000 2009
He
alt
hcare
Sp
en
d a
s a
% o
f G
DP
He
alt
hcare
Sp
en
d p
er
Cap
ita (U
SD
)
USA OECD
Source: The Organization for Economic Cooperation and Development (OECD) Health Expenditure Data
2010
Healthcare Spend in the U.S. is Unsustainable…
Driving Growth Through Measured Results
IRE
18
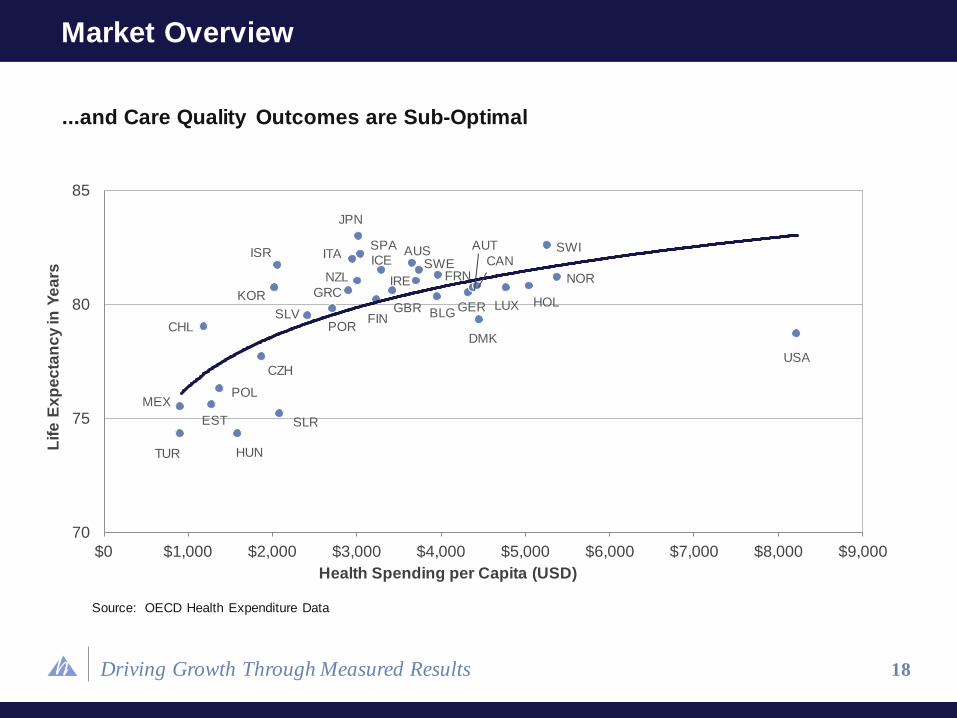
Market Overview
...and Care Quality Outcomes are Sub-Optimal
70
75
80
85
$0 $1,000 $2,000 $3,000 $4,000 $5,000 $6,000 $7,000 $8,000 $9,000
TUR
MEX
HUN
SLR EST
POL
CHL
CZH
ISR
KOR
SLV
JPN
ITA SPA
NZL
GRC
POR
ICE
FIN GBR
AUS SWE
FRN
BLG
DMK
GER
AUT
CAN SWI
NOR
HOL LUX
USA
Source: OECD Health Expenditure Data
Health Spending per Capita (USD)
Lif
e E
xp
ec
tan
cy
in Y
ea
rs
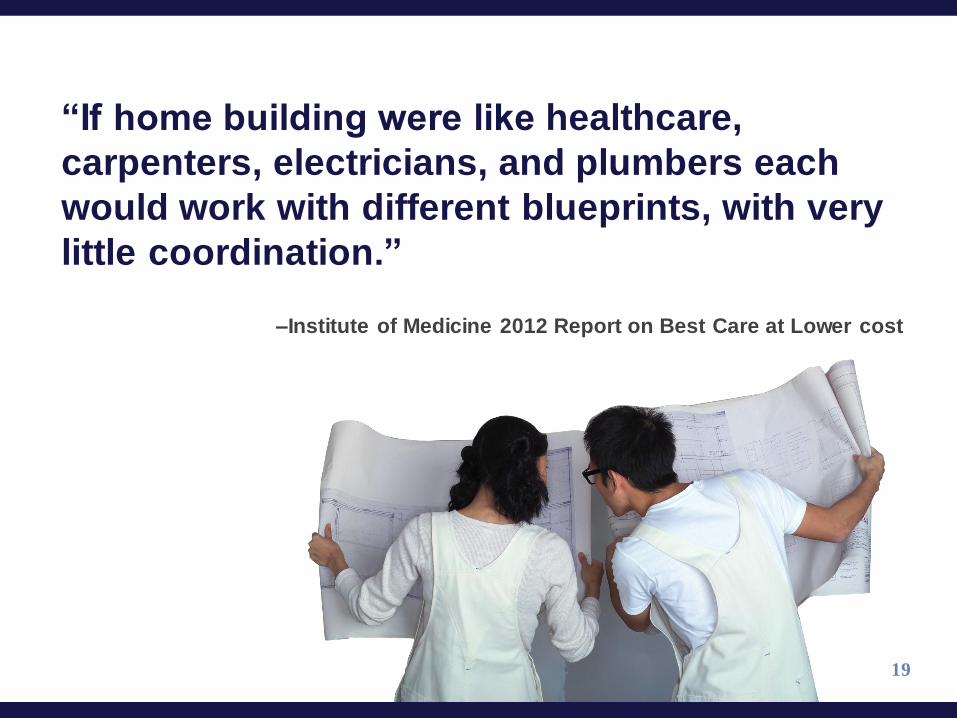
“If home building were like healthcare,
carpenters, electricians, and plumbers each
would work with different blueprints, with very
little coordination.”
19
–Institute of Medicine 2012 Report on Best Care at Lower cost
Driving Growth Through Measured Results
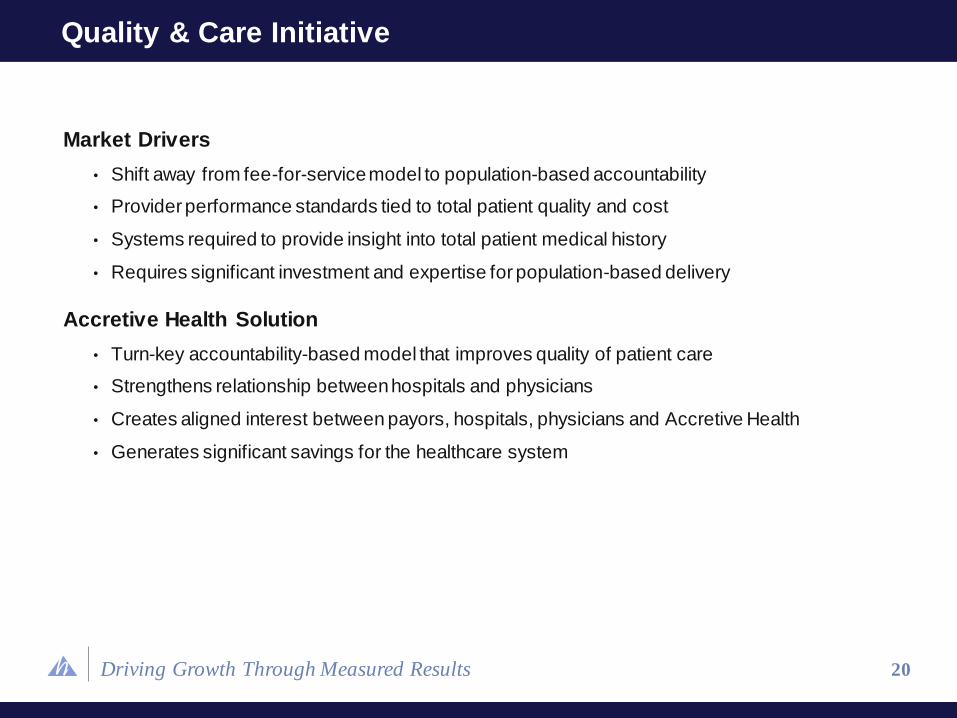
Market Drivers
• Shift away from fee-for-service model to population-based accountability
• Provider performance standards tied to total patient quality and cost
• Systems required to provide insight into total patient medical history
• Requires significant investment and expertise for population-based delivery
Accretive Health Solution
• Turn-key accountability-based model that improves quality of patient care
• Strengthens relationship between hospitals and physicians
• Creates aligned interest between payors, hospitals, physicians and Accretive Health
• Generates significant savings for the healthcare system
Quality & Care Initiative
20
Driving Growth Through Measured Results
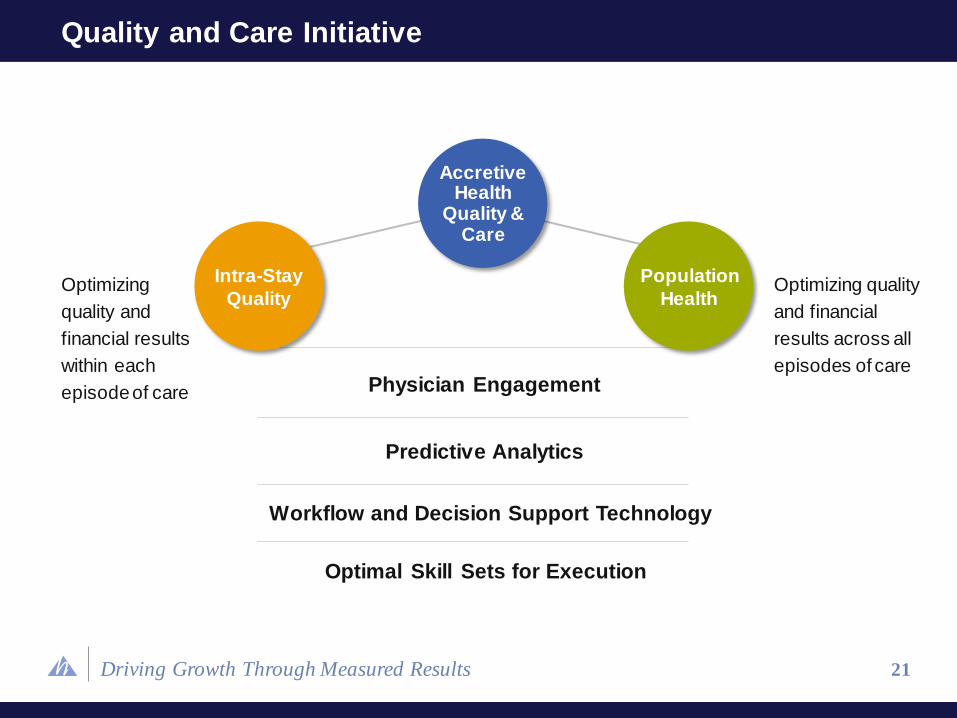
Intra-Stay
Quality
Population
Health
21
Quality and Care Initiative
Optimizing
quality and
financial results
within each
episode of care Physician Engagement
Predictive Analytics
Workflow and Decision Support Technology
Optimal Skill Sets for Execution
Optimizing quality
and financial
results across all
episodes of care
Accretive Health
Quality & Care

Driving Growth Through Measured Results
Continuous care assessment
allows physicians to focus on the
sickest patients and coordinate
care to improve outcomes
22
End-to-end Infrastructure for Population Health Management
Sickest
and most responsive
patients
Patient-
specific care
plans and
care
coordination
workflow
Real-time
clinical
pathway
adjustment
Starting point

Driving Growth Through Measured Results 23
End-to-End Infrastructure for Population Health
Sophisticated Business and
Payor Contracting Model
Proprietary Data and
Technology Platform
Physician Performance and
Change Management
Patient Engagement and
Real-time Care Management
Continuous R&D and Predictive
Performance
Driving Growth Through Measured Results
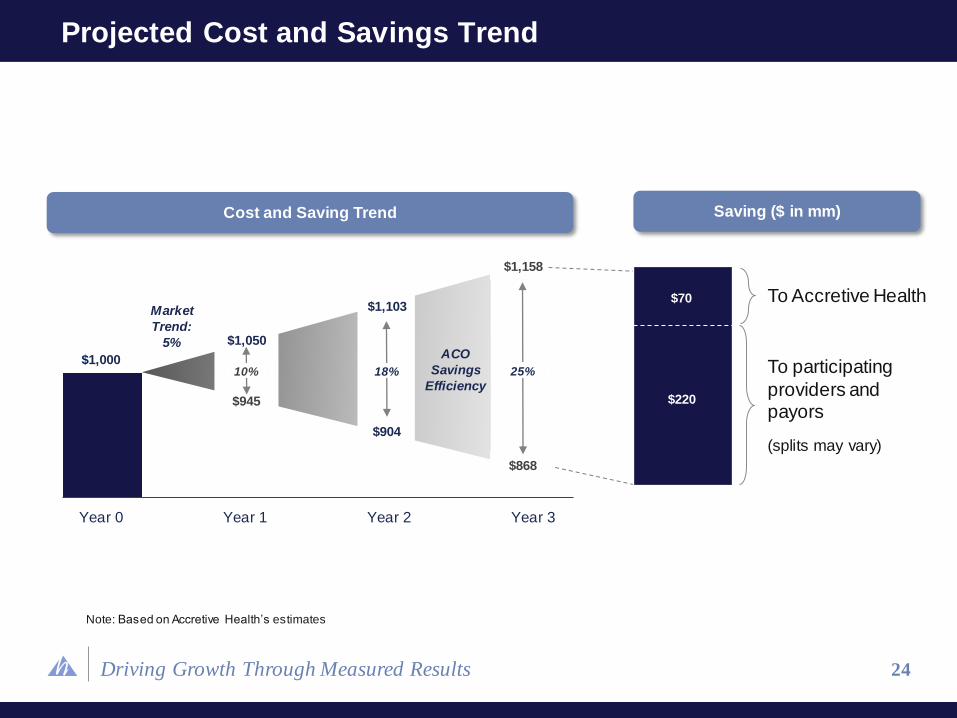
Year 0 Year 1 Year 2 Year 3
Cost and Saving Trend
$1,000
$1,050
$1,158
$1,103
$290
Saving ($ in mm)
$945
$904
$868
10% 18% 25%
Market
Trend:
5% ACO
Savings
Efficiency
To Accretive Health
To participating
providers and payors
(splits may vary)
$70
$220
24
Projected Cost and Savings Trend
Note: Based on Accretive Health’s estimates
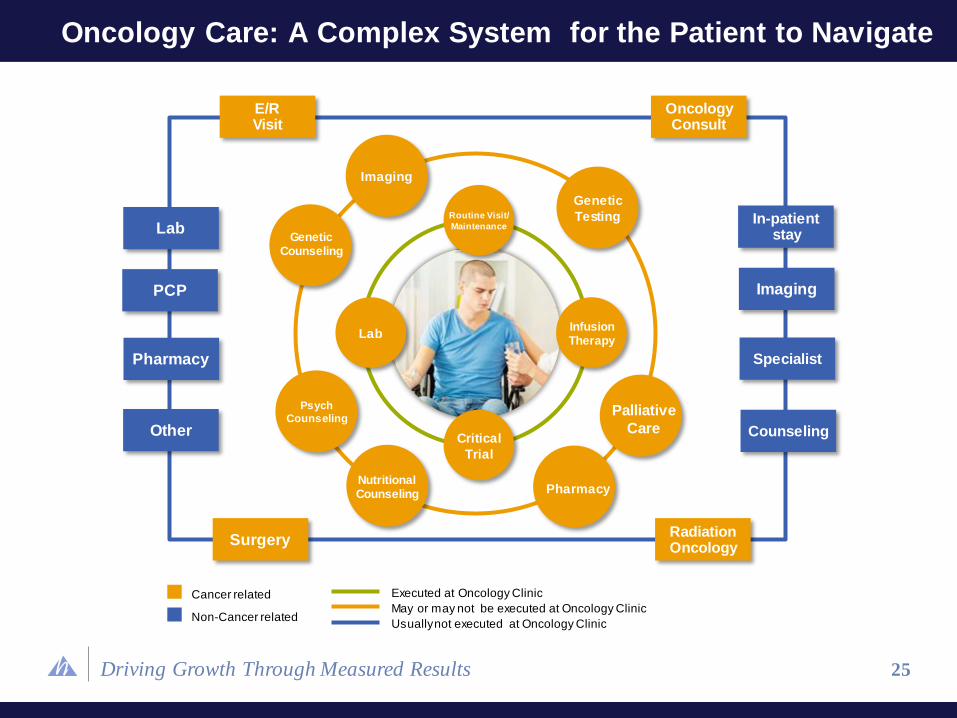
Driving Growth Through Measured Results 25
Oncology Care: A Complex System for the Patient to Navigate
Routine Visit/
Maintenance
Critical
Trial
Infusion Therapy
Lab
Psych
Counseling
Pharmacy
Palliative
Care
Nutritional Counseling
Genetic
Testing
Imaging
Genetic Counseling
E/R Visit
Oncology Consult
In-patient stay Lab
Imaging PCP
Pharmacy Specialist
Other Counseling
Surgery Radiation Oncology
Cancer related
Non-Cancer related
Executed at Oncology Clinic
May or may not be executed at Oncology Clinic
Usually not executed at Oncology Clinic
Driving Growth Through Measured Results
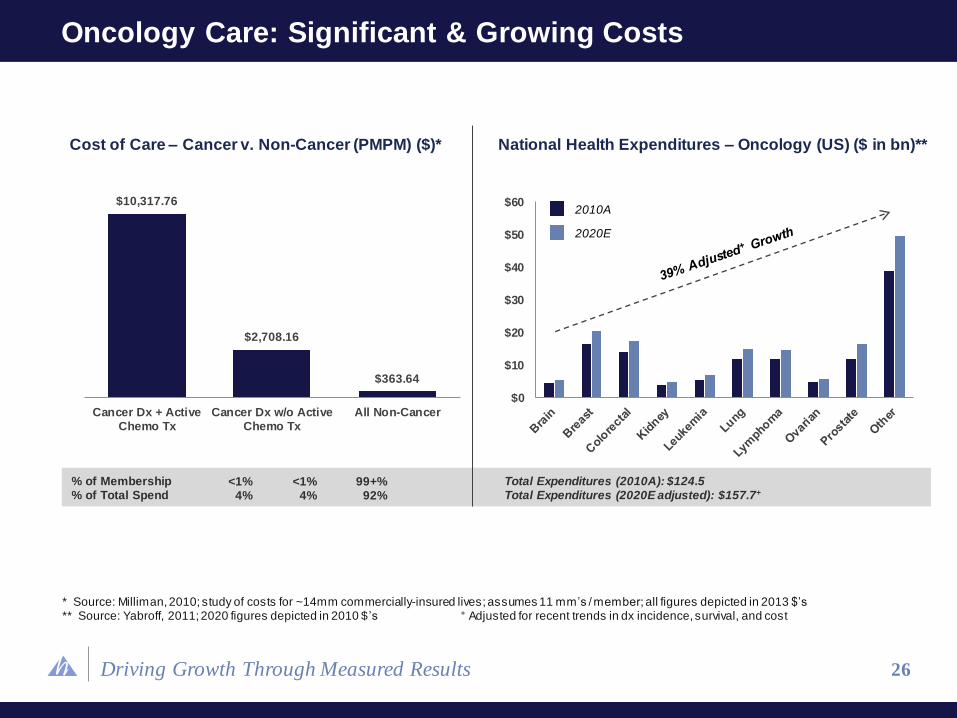
% of Membership % of Total Spend
Cost of Care – Cancer v. Non-Cancer (PMPM) ($)*
$0
$10
$20
$30
$40
$50
$602010A
2020E
Total Expenditures (2010A): $124.5 Total Expenditures (2020E adjusted): $157.7+
$10,317.76
$2,708.16
$363.64
Cancer Dx + ActiveChemo Tx
Cancer Dx w/o ActiveChemo Tx
All Non-Cancer
26
Oncology Care: Significant & Growing Costs
<1% 4%
<1% 4%
99+% 92%
National Health Expenditures – Oncology (US) ($ in bn)**
* Source: Milliman, 2010; study of costs for ~14mm commercially-insured lives; assumes 11 mm’s / member; all figures depicted in 2013 $’s ** Source: Yabroff, 2011; 2020 figures depicted in 2010 $ ’s + Adjusted for recent trends in dx incidence, survival, and cost
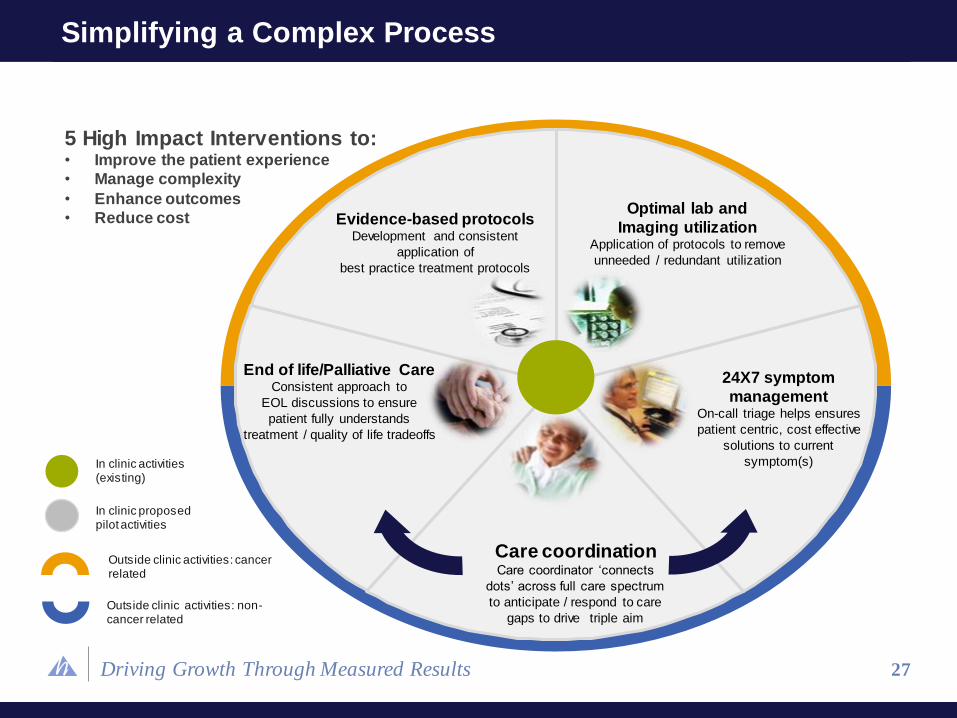
Driving Growth Through Measured Results
Simplifying a Complex Process
Outside clinic activities: cancer related
Outside clinic activities: non-cancer related
In clinic activities (existing)
In clinic proposed pilot activities
Care coordination Care coordinator ‘connects
dots’ across full care spectrum
to anticipate / respond to care
gaps to drive triple aim
24X7 symptom
management On-call triage helps ensures
patient centric, cost effective
solutions to current
symptom(s)
End of life/Palliative Care Consistent approach to
EOL discussions to ensure
patient fully understands
treatment / quality of life tradeoffs
Evidence-based protocols Development and consistent
application of
best practice treatment protocols
Optimal lab and
Imaging utilization Application of protocols to remove
unneeded / redundant utilization
27
5 High Impact Interventions to: • Improve the patient experience
• Manage complexity
• Enhance outcomes
• Reduce cost
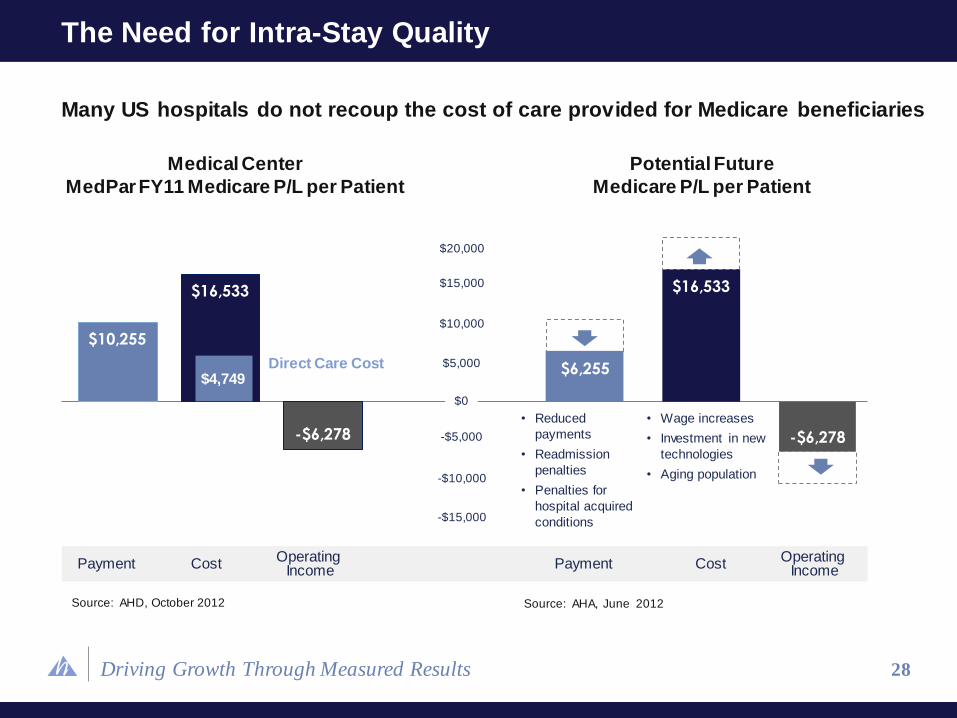
Driving Growth Through Measured Results 28
The Need for Intra-Stay Quality
Source: AHD, October 2012
$10,255
$16,533
-$6,278
$6,255
$16,533
-$6,278
• Reduced
payments
• Readmission
penalties
• Penalties for
hospital acquired
conditions
• Wage increases
• Investment in new
technologies
• Aging population
Source: AHA, June 2012
$4,749 Direct Care Cost
Many US hospitals do not recoup the cost of care provided for Medicare beneficiaries
Medical Center
MedPar FY11 Medicare P/L per Patient
Potential Future
Medicare P/L per Patient
Payment Cost Operating
Income
-$15,000
-$10,000
-$5,000
$0
$5,000
$10,000
$15,000
$20,000
Payment Cost Operating
Income

Driving Growth Through Measured Results 29
Intra-Stay Quality Timeline
ISQ Solution Today Tomorrow
Align Partners • Establish a shared vision
• Prepare for changes from Health Reform
• Administer payment model and disburse
payments
Analytics and
Reporting
• Analyze DRG and service level
performance
• Establish system/hospital scorecard
and targets
• Introduce real time DRG cost buildup tool
• Establish evidence-based plans of care to
reduce variation
Accountability
Across the
Continuum
• Implement defined plan of care
model for high priority patients
• Implement tools and technology to
support efficient through-put
• Establish post discharge relationships and
communication
• Introduce pre-stay communication, education,
and decision support
• Integrate care plans with primary care providers
Operational
Excellence and
Innovation
• Identify enterprise wide and DRG
specific opportunities and implement
solutions
• Identify and implement next wave of enterprise-
wide and DRG opportunities
• Embed CI behaviors and outcomes into
individual performance goals
Driving Growth Through Measured Results
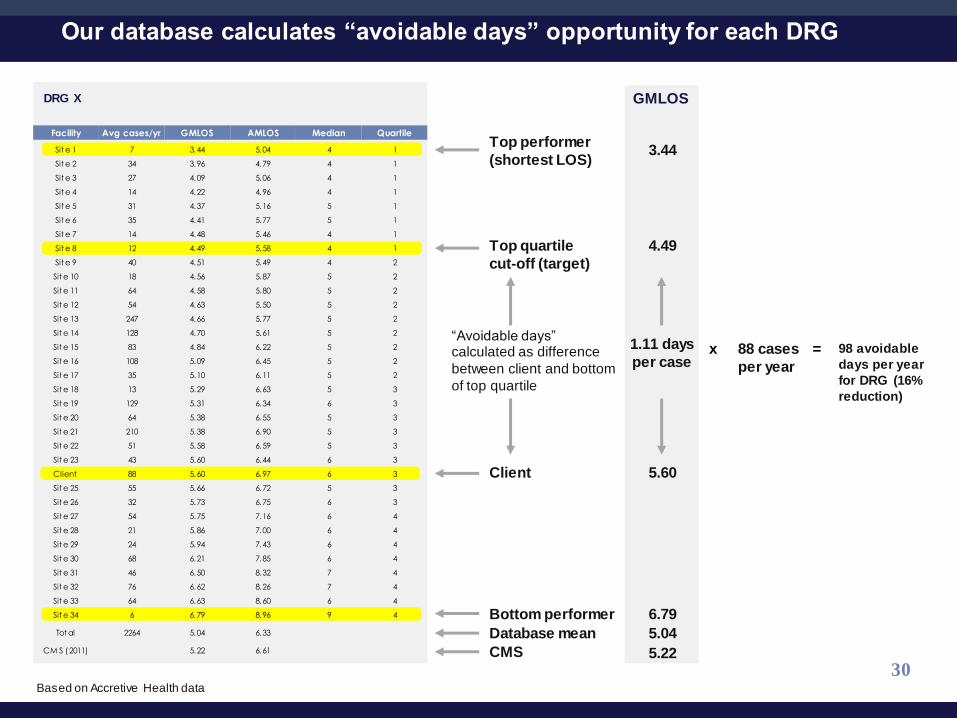
DRG X
98 avoidable
days per year
for DRG (16%
reduction)
Top performer
(shortest LOS)
Bottom performer
Top quartile
cut-off (target)
Client
“Avoidable days” calculated as difference
between client and bottom
of top quartile
Facility Avg cases/yr GMLOS AMLOS Median Quartile
Sit e 1 7 3.44 5.04 4 1
Sit e 2 34 3.96 4.79 4 1
Sit e 3 27 4.09 5.06 4 1
Sit e 4 14 4.22 4.96 4 1
Sit e 5 31 4.37 5.16 5 1
Sit e 6 35 4.41 5.77 5 1
Sit e 7 14 4.48 5.46 4 1
Sit e 8 12 4.49 5.58 4 1
Sit e 9 40 4.51 5.49 4 2
Sit e 10 18 4.56 5.87 5 2
Sit e 11 64 4.58 5.80 5 2
Sit e 12 54 4.63 5.50 5 2
Sit e 13 247 4.66 5.77 5 2
Sit e 14 128 4.70 5.61 5 2
Sit e 15 83 4.84 6.22 5 2
Sit e 16 108 5.09 6.45 5 2
Sit e 17 35 5.10 6.11 5 2
Sit e 18 13 5.29 6.63 5 3
Sit e 19 129 5.31 6.34 6 3
Sit e 20 64 5.38 6.55 5 3
Sit e 21 210 5.38 6.90 5 3
Sit e 22 51 5.58 6.59 5 3
Sit e 23 43 5.60 6.44 6 3
Client 88 5.60 6.97 6 3
Sit e 25 55 5.66 6.72 5 3
Sit e 26 32 5.73 6.75 6 3
Sit e 27 54 5.75 7.16 6 4
Sit e 28 21 5.86 7.00 6 4
Sit e 29 24 5.94 7.43 6 4
Sit e 30 68 6.21 7.85 6 4
Sit e 31 46 6.50 8.32 7 4
Sit e 32 76 6.62 8.26 7 4
Sit e 33 64 6.63 8.60 6 4
Sit e 34 6 6.79 8.96 9 4
Tot al 2264 5.04 6.33
CM S (2011) 5.22 6.61
3.44
4.49
5.60
6.79
1.11 days
per case
Database mean 5.04
CMS 5.22
GMLOS
x 88 cases
per year
=
30
Our database calculates “avoidable days” opportunity for each DRG
Based on Accretive Health data
Driving Growth Through Measured Results 31
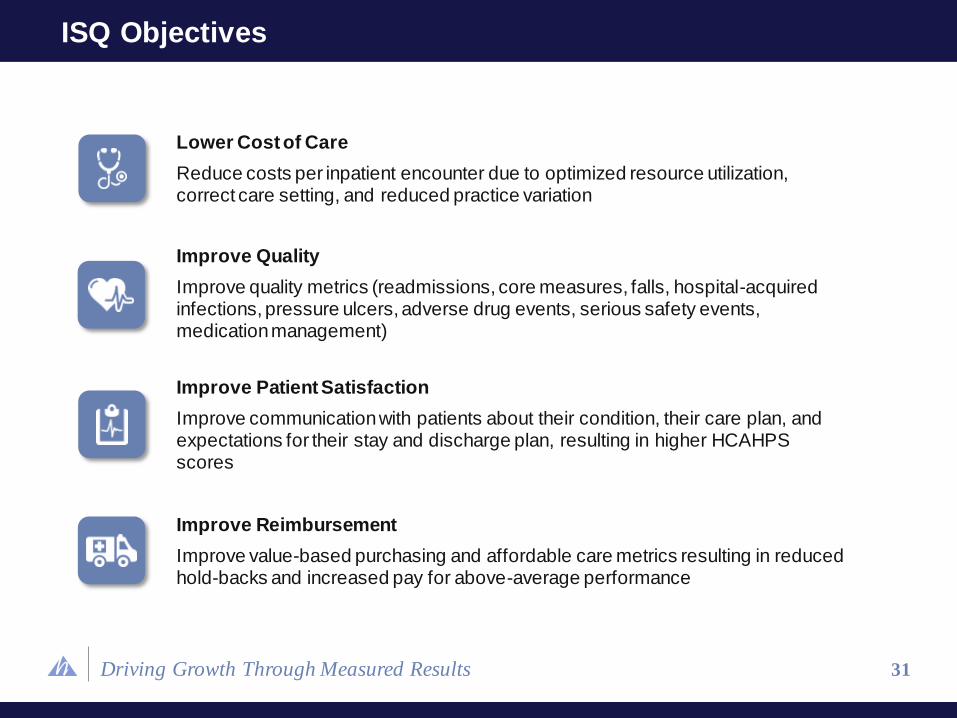
ISQ Objectives
Lower Cost of Care
Reduce costs per inpatient encounter due to optimized resource utilization, correct care setting, and reduced practice variation
Improve Quality
Improve quality metrics (readmissions, core measures, falls, hospital-acquired infections, pressure ulcers, adverse drug events, serious safety events, medication management)
Improve Patient Satisfaction
Improve communication with patients about their condition, their care plan, and expectations for their stay and discharge plan, resulting in higher HCAHPS scores
Improve Reimbursement
Improve value-based purchasing and affordable care metrics resulting in reduced hold-backs and increased pay for above-average performance
Driving Growth Through Measured Results
• Current episodic care environment offers tremendous opportunity to improve
resource utilization, reduce variation in treatment practices and ensure care is
provided in the optimal setting
• Competitors have not driven successful or sustainable results
• Accretive believes it can favorably impact length of stay and improve quality
through:
• Patient care coordination
• Physician engagement
• Optimal care setting
• Proprietary tools and technology
• Quick deployment upon contract execution
Maximizing Value in Episodic Care
32

Driving Growth Through Measured Results