ACCOUNTING TAX POLICY - Wolfe Research & Tax Policy September 26 ... FCFF, after dividends NM NM NM...
38
Chris Senyek, CFA, CPA (646) 845-0759 [email protected] Adam Calingasan, CFA, CPA (646) 845-0757 [email protected] Clinton Chang, CFA, CPA (646) 845-0756 [email protected] This report is limited solely for the use of clients of Wolfe Trahan & Co. Please refer to the DISCLOSURE SECTION located at the end of this report for Analyst Certifications and Other Disclosures. For Important Disclosures, please go to www.WolfeTrahan.com/Disclosures or write to us at Wolfe Trahan & Co., 420 Lexington Avenue, Suite 648, New York, NY 10170. WolfeTrahan.com Page 1 of 38 ACCOUNTING &TAX POLICY CORPORATE ACTIONS September 26, 2012 TYCO: ADT DEEP DIVE Investing in corporate action ideas has historically produced alpha and is an investment theme we are closely following in 2012. Tyco is spinning-off its ADT business to shareholders as of September 28, 2012 with Tyco shareholders receiving 0.5 shares of ADT for each share of Tyco held. After the spin- off, the remaining Tyco parent will consist of the Fire and Commercial Security businesses (Tyco also agreed to merge its flow business with Pentair in a reverse Morris Trust merger that is expected to close on September 28, 2012). ADT encompasses important themes we follow: a cash flow generative spin-off, material tax assets, and an expected initial 1.4% dividend yield, with the potential opportunity for material dividend increases/capital allocation activities over the next few years. This report is our financial analysis and model of Tyco’s ADT spin-off. What is ADT? ADT is the largest provider of electronic security and monitoring for homes and small businesses in the United States (93% of revenues) and Canada (7% of revenues) with over 6 million customers and an estimated 25% market share in what is an otherwise fragmented ~$13 billion market. In 2011, the company had approximately $3.1 billion in revenues, a 22% operating margin, and 15% free cash flow margin. After the spin-off, ADT will have $300 million in cash and $2.9B in debt, for a 1.8x 2012E gross debt / EBITDA ratio. Complicated Subscriber Accounting Makes Earnings Less Meaningful; Focus on Cash Flow. ADT’s business model lends itself to asymmetrical accounting from the incurrence of up-front costs and different accounting methods for internally generated new customers compared with dealer generated customers. Therefore, we believe cash flow and recurring monthly revenue are the best valuation measures upon which to analyze ADT. Tax Assets Are a Source of Additional Cash Flow. ADT is assuming certain NOLs from Tyco that we forecast will shield income over the next two years. Beyond that time frame, we believe there is an opportunity for tax policy accounting changes to immediately expense costs that are currently capitalized, the impact of which could provide an additional tax shield in the years ahead. Therefore, we believe ADT’s cash tax rate could remain below 10% over the next 3 to 5 years. Trading Valuations. Based on ADT’s 9/25/2012 $36.45 share price in when-issued trading ($8.6 billion market cap.), the shares currently trade at 6.5x our FY ‘13E EBITDA estimates of $1.7 billion and 43.3x our 2013E monthly recurring revenue estimate. Free cash flow yield is estimated at 4.1% based on our FY ‘13E free cash flow estimate of $463 million and the company has indicated that it will pay a $0.125 quarterly dividend, equating to a ~1.4% yield based on the current share price. In FY ’13, we estimate $347 million in free cash flow after dividend payments, providing future opportunities for a potentially large dividend increase and/or tuck-in acquisitions.
Transcript of ACCOUNTING TAX POLICY - Wolfe Research & Tax Policy September 26 ... FCFF, after dividends NM NM NM...

Chris Senyek, CFA, CPA (646) 845-0759
Adam Calingasan, CFA, CPA (646) 845-0757
Clinton Chang, CFA, CPA (646) 845-0756
This report is limited solely for the use of clients of Wolfe Trahan & Co. Please refer to the DISCLOSURE SECTION located at the end of this report for Analyst Certifications and Other Disclosures. For Important Disclosures, please go to www.WolfeTrahan.com/Disclosures or write to us at Wolfe Trahan & Co., 420 Lexington Avenue, Suite 648, New York, NY 10170.
WolfeTrahan.com Page 1 of 38
ACCOUNTING & TAX POLICYCORPORATE ACTIONS
September 26, 2012
TYCO: ADT DEEP DIVE
Investing in corporate action ideas has historically produced alpha and is an investment theme we are closely following in 2012. Tyco is spinning-off its ADT business to shareholders as of September 28, 2012 with Tyco shareholders receiving 0.5 shares of ADT for each share of Tyco held. After the spin-off, the remaining Tyco parent will consist of the Fire and Commercial Security businesses (Tyco also agreed to merge its flow business with Pentair in a reverse Morris Trust merger that is expected to close on September 28, 2012). ADT encompasses important themes we follow: a cash flow generative spin-off, material tax assets, and an expected initial 1.4% dividend yield, with the potential opportunity for material dividend increases/capital allocation activities over the next few years. This report is our financial analysis and model of Tyco’s ADT spin-off.
What is ADT? ADT is the largest provider of electronic security and monitoring for homes and small businesses in the United States (93% of revenues) and Canada (7% of revenues) with over 6 million customers and an estimated 25% market share in what is an otherwise fragmented ~$13 billion market. In 2011, the company had approximately $3.1 billion in revenues, a 22% operating margin, and 15% free cash flow margin. After the spin-off, ADT will have $300 million in cash and $2.9B in debt, for a 1.8x 2012E gross debt / EBITDA ratio.
Complicated Subscriber Accounting Makes Earnings Less Meaningful; Focus on Cash Flow. ADT’s business model lends itself to asymmetrical accounting from the incurrence of up-front costs and different accounting methods for internally generated new customers compared with dealer generated customers. Therefore, we believe cash flow and recurring monthly revenue are the best valuation measures upon which to analyze ADT.
Tax Assets Are a Source of Additional Cash Flow. ADT is assuming certain NOLs from Tyco that we forecast will shield income over the next two years. Beyond that time frame, we believe there is an opportunity for tax policy accounting changes to immediately expense costs that are currently capitalized, the impact of which could provide an additional tax shield in the years ahead. Therefore, we believe ADT’s cash tax rate could remain below 10% over the next 3 to 5 years.
Trading Valuations. Based on ADT’s 9/25/2012 $36.45 share price in when-issued trading ($8.6 billion market cap.), the shares currently trade at 6.5x our FY ‘13E EBITDA estimates of $1.7 billion and 43.3x our 2013E monthly recurring revenue estimate. Free cash flow yield is estimated at 4.1% based on our FY ‘13E free cash flow estimate of $463 million and the company has indicated that it will pay a $0.125 quarterly dividend, equating to a ~1.4% yield based on the current share price. In FY ’13, we estimate $347 million in free cash flow after dividend payments, providing future opportunities for a potentially large dividend increase and/or tuck-in acquisitions.

WolfeTrahan.com Page 2 of 38 Accounting & Tax Policy September 26, 2012
TTAABBLLEE OOFF CCOONNTTEENNTTSS
Portfolio Manager’s Summary: The ADT Corporation Spin‐Off ................................................................ 3
Why is ADT Interesting To Us? .................................................................................................................. 3
Portfolio Manager’s Summary: ADT’s Valuation...................................................................................... 4
Portfolio Manager’s Summary: ADT’s Summary Financials ...................................................................... 5
ADT: Company Overview ........................................................................................................................ 6
Management Team ................................................................................................................................... 6
ADT’s Business Model ............................................................................................................................. 7
ADT Pulse ............................................................................................................................................... 9
The North American Home Security Market .......................................................................................... 12
How We Believe ADT Should be Valued ................................................................................................ 14
ADT Financial Statement Deep Dive and Key Drivers ............................................................................. 15
Revenue ................................................................................................................................................... 16
Margin and Expenses .............................................................................................................................. 18
Balance Sheet and Cash Flow .................................................................................................................. 19
ADT Revenue Detail .............................................................................................................................. 20
ADT Income Statement ......................................................................................................................... 21
ADT Balance Sheet ................................................................................................................................ 22
ADT Statement of Cash Flows ............................................................................................................... 23
ADT’s Capital Structure Provides Financial Flexibility ............................................................................ 24
ADT’s Capital Allocation ........................................................................................................................ 25
Accounting for Customer and ADT Owned Installation Costs ................................................................ 26
Material NOL Tax Assets, Low Cash Tax Rates, and Likely Further Tax Optimization .............................. 27
Off‐Balance Sheet Deferred Tax Asset? .................................................................................................. 27
Acquisition Activity and Transaction Multiples in Security Monitoring .................................................. 29
Appendix: Detailed ADT Model ............................................................................................................. 30
Accounting & Tax Policy Research Library ............................................................................................. 36
Disclosure Section ................................................................................................................................. 38

WolfeTrahan.com Page 3 of 38 Accounting & Tax Policy September 26, 2012
PPOORRTTFFOOLLIIOO MMAANNAAGGEERR’’SS SSUUMMMMAARRYY:: TTHHEE AADDTT CCOORRPPOORRAATTIIOONN SSPPIINN‐‐OOFFFF
Corporate actions, such as spin-offs, are an area we closely monitor. To that end, Tyco is spinning-off its ADT business to shareholders as of September 28, 2012 with Tyco shareholders receiving 0.5 shares of ADT for each share of Tyco held. In this report, we provide a financial analysis deep dive/model and company background information on ADT. After the spin-off, the remaining Tyco parent will consist of the Commercial Fire and Security business (Tyco also agreed to merge its flow business with Pentair in a reverse Morris Trust merger that is expected to close on September 28, 2012). WWHHYY IISS AADDTT IINNTTEERREESSTTIINNGG TTOO UUSS??
ADT encompasses important themes we follow: a cash flow generative spin-off, material tax assets, and an expected initial dividend yield of 1.4%, with the potential for material dividend increases/capital allocation activities over the next few years.
We like the business model: ADT is an understandable business (and arguably dull) with high market share (25%) in an otherwise fragmented market. The business characteristics afford a relatively stable and recurring revenue base (monthly fees) and high free cash flow margins. Customer churn has been relatively low and fairly stable over recent years. Additional potential catalysts to future growth are a housing market recovery and higher market penetration (currently, only ~19% of homes have a monitored security system).
ADT Pulse is a new product offering providing an up-sell to existing customers (~$10 more per
month) and higher average revenue per user (ARPU) from new customers. Tax assets provide additional cash flow. The ADT spin-off will assist Tyco in monetizing its NOLs
and provide a cash tax savings to ADT. Tyco is expected to transfer a $411 million deferred tax asset to ADT that, at an assumed 35% tax rate, would shield over $1 billion in future U.S. federal and state taxable income. We believe there is an additional opportunity for tax savings from tax intangible amortization and the immediate expensing of costs incurred to initiate new customer contracts. Therefore, we’re forecasting a below 10% tax rate for the next few years.
Modest debt on the spin-off date affords the company flexibility to enhance their capital allocation
activities in the future and/or pursue tuck-in acquisitions. There has also been acquisition activity in the security monitoring industry in recent years; Blackstone announced its intent to acquire one of ADT’s competitors, Vivint, in September 2012.
WolfeTrahan.com Page 4 of 38 Accounting & Tax Policy September 26, 2012
PPOORRTTFFOOLLIIOO MMAANNAAGGEERR’’SS SSUUMMMMAARRYY:: AADDTT’’SS VVAALLUUAATTIIOONN
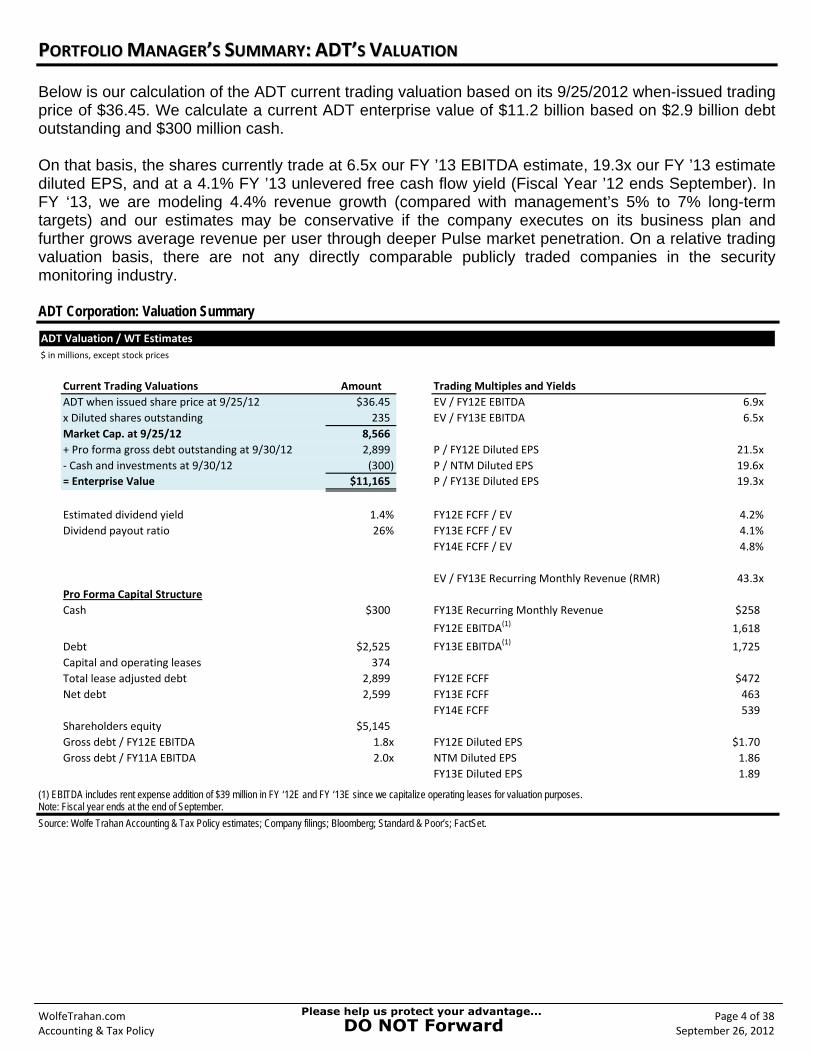
Below is our calculation of the ADT current trading valuation based on its 9/25/2012 when-issued trading price of $36.45. We calculate a current ADT enterprise value of $11.2 billion based on $2.9 billion debt outstanding and $300 million cash. On that basis, the shares currently trade at 6.5x our FY ’13 EBITDA estimate, 19.3x our FY ’13 estimate diluted EPS, and at a 4.1% FY ’13 unlevered free cash flow yield (Fiscal Year ’12 ends September). In FY ‘13, we are modeling 4.4% revenue growth (compared with management’s 5% to 7% long-term targets) and our estimates may be conservative if the company executes on its business plan and further grows average revenue per user through deeper Pulse market penetration. On a relative trading valuation basis, there are not any directly comparable publicly traded companies in the security monitoring industry. ADT Corporation: Valuation Summary
ADT Valuation / WT Estimates
$ in millions, except stock prices
Current Trading Valuations Amount Trading Multiples and Yields
ADT when issued share price at 9/25/12 $36.45 EV / FY12E EBITDA 6.9x
x Diluted shares outstanding 235 EV / FY13E EBITDA 6.5x
Market Cap. at 9/25/12 8,566
+ Pro forma gross debt outstanding at 9/30/12 2,899 P / FY12E Diluted EPS 21.5x
‐ Cash and investments at 9/30/12 (300) P / NTM Diluted EPS 19.6x
= Enterprise Value $11,165 P / FY13E Diluted EPS 19.3x
Estimated dividend yield 1.4% FY12E FCFF / EV 4.2%
Dividend payout ratio 26% FY13E FCFF / EV 4.1%
FY14E FCFF / EV 4.8%
EV / FY13E Recurring Monthly Revenue (RMR) 43.3x
Pro Forma Capital Structure
Cash $300 FY13E Recurring Monthly Revenue $258
FY12E EBITDA(1)1,618
Debt $2,525 FY13E EBITDA(1)1,725
Capital and operating leases 374
Total lease adjusted debt 2,899 FY12E FCFF $472
Net debt 2,599 FY13E FCFF 463
FY14E FCFF 539
Shareholders equity $5,145
Gross debt / FY12E EBITDA 1.8x FY12E Diluted EPS $1.70
Gross debt / FY11A EBITDA 2.0x NTM Diluted EPS 1.86
FY13E Diluted EPS 1.89
(1) EBITDA includes rent expense addition of $39 million in FY ‘12E and FY ‘13E since we capitalize operating leases for valuation purposes. Note: Fiscal year ends at the end of September.
Source: Wolfe Trahan Accounting & Tax Policy estimates; Company filings; Bloomberg; Standard & Poor’s; FactSet.

WolfeTrahan.com Page 5 of 38 Accounting & Tax Policy September 26, 2012
PPOORRTTFFOOLLIIOO MMAANNAAGGEERR’’SS SSUUMMMMAARRYY:: AADDTT’’SS SSUUMMMMAARRYY FFIINNAANNCCIIAALLSS
Below we summarize ADT’s historical financial statements and our yearly forecasts. We are not modeling any future uses of cash other than initiating a dividend, yielding 1.4%. Note the acquisition of Broadview security closed in FY ’10 (May 2010) and, thus, FY ‘11 is not necessarily comparable to prior years. ADT Corporation: Summary Financial Statements, Operating Information, and WT Estimates ($ in millions)
WT Est. WT Est. WT Est.
FY 2009A FY 2010A FY 2011A FY 2012E FY 2013E FY 2014E
Net revenue $2,248 $2,591 $3,110 $3,240 $3,381 $3,562Y/Y growth ‐‐ 15.3% 20.0% 4.2% 4.4% 5.3%
Pro forma EBITDA 1,013 1,109 1,463 1,579 1,686 1,837 Pro forma EBITDA margin 45% 43% 47% 49% 50% 52%
Pro forma operating income 440 517 681 726 778 866 Operating income margin 20% 20% 22% 22% 23% 24%
Pro forma diluted EPS NA NA $1.57 $1.70 $1.89 $2.14Y/Y growth ‐‐ ‐‐ ‐‐ 8% 12% 13%
Operating cash flow 981 1,070 1,439 1,494 1,566 1,702
Capital expenditures 736 801 902 1,081 1,164 1,224
Interest expense, after tax 53 69 58 59 61 61
FCFF 298 338 595 472 463 539 FCFF margin 13% 13% 19% 15% 14% 15%
Dividends NM NM NM 0 116 139
FCFF, after dividends NM NM NM 472 347 400
Customer additions/metrics
Total number of customers (000s) 4,753 6,285 6,351 6,455 6,561 6,755
Gross customer additions (000s) 971 1,025 1,088 1,174 1,248 1,351
Attrition (%) 14.3 13.3 13.0 13.5 13.4 13.3
Average Revenue Per User (ave.) $35.92 $36.10 $37.24 $38.71 $40.12 $41.58
Capital Structure (Pro Forma as of 9/30/2012)
Pro forma cash 300
Pro forma debt 2,899
Pro forma gross debt / FY '12E EBITDA 1.8x
FY 2012E EBITDA(1)1,618
FY 2012E Cap‐ex 1,081
(1) EBITDA includes rent expense addition of $39 million in FY ‘12E since we capitalize operating leases. Note: WT est. = Wolfe Trahan estimates. Fiscal year ends September.
Source: Wolfe Trahan Accounting & Tax Policy Research estimates; Company filings.

WolfeTrahan.com Page 6 of 38 Accounting & Tax Policy September 26, 2012
AADDTT:: CCOOMMPPAANNYY OOVVEERRVVIIEEWW
ADT is the largest provider of electronic security and monitoring for homes and small businesses in the United States (93% of revenues) and Canada (7% of revenues) with over 6 million customers and an estimated 25% market share in what is an otherwise fragmented ~$13 billion market. ADT has a 138 year history and is based in Boca Raton, Florida. Tyco acquired ADT in 1997, and in 2010, ADT acquired its largest competitor, Broadview Security (1.4 million customers, which was previously part of Brinks). ADT’s principal competitors in residential and small business security systems are Protection One, Monitronics, Vivint, and a host of smaller “mom and pop” businesses. New(er) entrants into the market include selected incumbent local exchange telecommunication companies, but none currently have product offerings reaching a broad customer base. ADT’s overall market is best characterized as slow growth, but with some opportunity for higher future growth as housing recovers and through new adjunct product offerings (ADT Pulse). According to IMS and ADT analyses, the residential and small business electronic security market has grown at a 1-2% CAGR from 2008 to 2012 and they project a 2% to 3% CAGR in market growth from 2012-2016 due to better demographics, higher crime, technological advancements and customer needs for automation of remote monitoring. Over the longer-term, there is also an additional opportunity to gain further market penetration of overall security services as compared with other in-house services as shown in the Home Security Market section. Although further market penetration is possible, we believe that significant additional penetration is predicated on lowering the up-front cost of ownership and monthly charges, and also moving away from its target customer (700+ FICO score). ADT’s partner network is one of the broadest in the industry, including dealers, affinity organizations such as USAA and AARP, and technology providers. The company maintains the industry’s largest sales, installation, and service field force and a monitoring network of 6 fully redundant ADT owned monitoring centers, all supported by over 16,000 employees and ~200 field offices. MMAANNAAGGEEMMEENNTT TTEEAAMM
Below are summary bios of key officers of ADT. Historically, management incentive compensation has been principally tied to targets for operating income, free cash flow, and revenue. Naren Gursahaney (Chief Executive Officer): Mr. Gursahaney joined Tyco in 2003 and held various leadership positions within the organization. Just prior to his current role, Mr. Gursahaney was President of Tyco Security Solutions. Prior to joining Tyco, Mr. Gursahaney worked at GE where he held senior leadership roles in services, marketing, and information management. His career also includes positions with Booz Allen & Hamilton and Westinghouse Electric Corporation. Mr. Gursahaney holds a B.S. from The Pennsylvania State University and an MBA from the University of Virginia. Kathryn Mikells (Chief Financial Officer): Ms. Mikells joined ADT in April 2012. Previously, Ms. Mikells was EVP and CFO for Nalco Holding Company, which merged with EcoLab Inc. in December 2011. Ms. Mikells also served as EVP and CFO of UAL Corporation from 2008 until its 2010 merger with Continental Airlines. Before UAL, Ms. Mikells worked at GE Capital Corporate Finance and Household International. She holds an MBA from the University of Chicago and a B.S. in finance from the University of Illinois Urbana-Champaign. Don Boerema (Chief Corporate Development Officer): Mr. Boerema joined Tyco Security Solutions in November 2007. Prior to joining Tyco Security Solutions, he worked at FDN, AT&T, McCaw Cellular Communications, Pepsi, and Procter & Gamble. Mr. Boerema holds B.S. and MBA degrees from Eastern Illinois University.

WolfeTrahan.com Page 7 of 38 Accounting & Tax Policy September 26, 2012
AADDTT’’SS BBUUSSIINNEESSSS MMOODDEELL
The company solicits customers through both a direct internal sales force and dealer model. More than half of new customers come through an internal sales force with the remaining through an authorized dealer program with approximately 450 authorized dealers operating across the U.S. and Canada (Canada is less than 10% of ADT’s sales, but growing). Authorized dealers typically agree to exclusivity with ADT for all qualified, security related services that they generate, but ADT is not obligated to accept these accounts. Additions to the company’s customer base typically require an upfront investment, of direct materials and labor to install the security systems, direct sales costs, indirect sales costs, marketing costs and administrative costs related to installation services. The ADT product offering is the installation and monitoring of residential and small business security systems with average revenue per user (ARPU1) of $38.36 per month in the most recent quarter ending June 29, 2012. Purchasers of ADT’s electronic systems typically contract for ongoing security system monitoring and maintenance at the time of initial equipment installation. Monitoring services are governed by multi-year contracts with automatic renewal provisions that provide ADT with recurring monthly revenue (RMR). The customer pays the initial installation fee and signs a contract term (typically 3 years) with automatic renewals for successive 30 day periods, unless cancelled by either party. Services are billed in advance (monthly, quarterly, or annually) and more than 50% of customers pay through automated, recurring methods. Historically, the customer has generally owned the equipment installed in their home/business, but ADT has recently been moving towards increased ownership of the equipment assets as more proprietary technology is embedded in their security hardware containing enhanced offerings (e.g., ADT Pulse). ADT’s ownership of the assets also makes it more difficult and expensive for customers to switch home monitoring service providers. Promotions and incentives vary over time and by region, but based on a recent sample of ADT dealers, we found a security purchase arrangement as follows:
Free basic equipment (but typically add-on’s increase this cost to $300-$600); $99 installation fee; 36-month contract; and Other potential incentives (e.g., $100 Visa gift card).
ADT management has indicated that the company earns a mid- to high-teens IRR on a typical customer and that its average customer relationship is 5-7 years. Average monthly fees for different levels of service are listed in the exhibit below. The most common service is the basic plan (~70%) of customers. ADT Home Security and Monitoring Solutions
Monthly fee
ADT
monitoring* 2‐way voice CellGuard
Arm/Disarm
remotely
Web and
mobile
access
Email and
text alerts
Event
history
Basic $36 x
Basic + 2‐Way Voice $42 x x
Basic + CellGuard $46 x x
Basic + Cell Guard + 2‐Way Voice $48 x x x
Basic + Cell Guard + 2‐Way Voice + ADT Pulse $54 x x x x x x x
*ADT monitoring includes a digital keypad, 3 entryway contacts, keychain remote, pet sensitive motion detector, high-decible alarm, backup battery, yard sign, and window decals. Note: 2-Way = voice system, which picks up people talking from 75 feet away and allows for 2-way communication without being on a phone; CellGuard = service through cell phone rather than land line or broadband, which can be cut or not function during a power outage; ADT Pulse = remote home monitoring from a smartphone or tablet.
Source: Wolfe Trahan Accounting & Tax Policy Research; The ADT Corporation; dealer websites.
1 ADT defines ARPU as the average amount of recurring revenue per customer per month, and is calculated based on the recurring revenue under contract at the end of the period, divided by the total number of customers under contract at the end of the period.

WolfeTrahan.com Page 8 of 38 Accounting & Tax Policy September 26, 2012
AADDTT’’SS BBUUSSIINNEESSSS MMOODDEELL ((CCOONNTTIINNUUEEDD))
Although the most basic home security initial fee is typically only $99, the overwhelming majority of set-ups require a much larger up-front investment. Below we outline a few different levels of installation fees for variations in ADT home monitoring solutions:
Essentials Plus = $99, after a $250 mail-in rebate (+$36 monthly monitoring fee) Safewatch PRO = $450 (+$36 monthly monitoring fee) Critical Conditions = $400 (+$39 monthly monitoring fee) Family Package = $550 (+$43 monthly monitoring fee)
Not only are there different options and levels of service, but there are also different programs and pricings for different regions in North America as shown in the exhibit below. Various ADT Home Security and Monitoring Solutions (Not All Inclusive)
U.S. Residential ADT Pulse Advantage: Savings on ADT Pulse Advantage Package include $136 on installation and $216 on the first year of monitoring. Installation price of ADT Pulse Advantage Package components if sold separately is $855; package price of $749 represents $136 installation savings. Monthly price of ADT Pulse Advantage Package monitoring services if sold separately is $67.99 per month; package monitoring price of $49.99 represents $18 per month in savings x 12 months = $216 in savings in first year. Residential ADT Pulse Select: Installation starts at $399. Burglary, Fire, Carbon Monoxide and Medical Alert monitoring requires purchase and/or activation of an ADT security system with monitored Burglary, Fire, Carbon Monoxide and Medical Alert devices. Fire, Carbon Monoxide and Medical Alert services are an additional charge. Does not include one‐time $25 activation fee. Quality Service Plan (QSP) is ADT's Extended Limited Warranty. 36‐month monitoring contract required from $47.99 per month, including Quality Service Plan (QSP). In California, 24‐month monitoring contract required from $47.99 per month, including QSP (24‐month total from $1,151.76). Additional charges may apply in areas that require guard response service for municipal alarm verification. System with installation price of less than $600 to remain property of ADT. CANADA Residential ADT Pulse Advantage: For ADT Pulse Package, installation starts at $749. 36‐month monitoring contract required from $49.99 per month, including QSP (from $1,799.64 for 36‐months). Burglary, Fire, Carbon Monoxide and Medical Alert monitoring requires purchase and/or activation of an ADT security system with monitored Burglary, Fire, Carbon Monoxide and Medical Alert devices. Fire, Carbon Monoxide and Medical Alert services are an additional charge. Medical Alert services not available in all markets. Does not include one‐time $50 activation fee. Prices may vary by market. Prices subject to change without notice. Residential ADT Pulse Select: ADT Pulse Select, installation starts at $399. 36‐month monitoring contract required from $47.99 per month, including QSP (from $1,727.64 for 36‐months). Burglary, Fire, Carbon Monoxide and Medical Alert monitoring requires purchase and/or activation of an ADT security system with monitored Burglary, Fire, Carbon Monoxide and Medical Alert devices. Fire, Carbon Monoxide and Medical Alert services are an additional charge. Medical Alert services not available in all markets. Does not include one‐time $25 activation fee. Prices may vary by market. Prices subject to change without notice. Small Business ADT Pulse: To qualify for mail‐in rebate (“Rebate”) offer (total Rebate of $200 per new customer depending on package installed), the minimum installed price is $499. 36‐month monitoring contract required with a minimum monthly maintenance fee of $49.99 per month (from $1,799.64 for 36‐months), for Intrusion Detection including Quality Service Plan (QSP). Additional $200 charge will accompany packages that require electrician services. Applicable taxes extra. After your installation or reactivation is complete, you will receive an ADT Rebate Form (“Form”) in the mail approximately 2 weeks after you sign the Small Business Contract. You can apply for your Rebate after your installation is complete. The Form will provide you with information on how to qualify for and access your $200 Rebate.
Note: WT emphasis/underlining added.
Source: Wolfe Trahan Accounting & Tax Policy Research; The ADT Corporation.

WolfeTrahan.com Page 9 of 38 Accounting & Tax Policy September 26, 2012
AADDTT PPUULLSSEE22
A significant source of potential future revenue growth from higher price points is a product offering named ADT Pulse, which was launched in October 2010. This product allows customers to remotely monitor and manage homes/small businesses through their electronic security systems. ADT Pulse allows customers with an internet-connected smart phone or computer to monitor and control their home security system, lights, thermostats, video cameras, and other appliances, all in real-time. ADT is selling its Pulse product as a way to better control and be connected to your home, and also as a more affordable way to make your home “smart”. Some ADT Pulse customers may be able to receive discounts on homeowners’ insurance and/or energy rates due to the energy saving features available through Pulse (e.g. automatically turning off or dimming lights, adjusting temperature). The ADT Pulse service generates ARPU that is approximately $10 higher than the company’s standard services and is a future growth engine for the company. The company first offered ADT Pulse through the direct sales channel, but has recently expanded to include its dealer network. In the last reported quarter, the so-called “take rates” for ADT Pulse increased to 39% versus the prior year’s rate of 19%. The small business Pulse take rate was 19% in the prior quarter vs. 7% in the previous year. Management believes that the Pulse take rate will continue to increase. ADT Pulse is available to all home and small and medium-sized businesses in North America, excluding Quebec, Canada where Pulse is not yet available.
2 ADT Pulse is built on Z-Wave technology, which is an interoperable wireless RF-based communications technology designed specifically to control, monitor, and status read in residential and light commercial environments. Z-Wave is the market leader (12 million products sold worldwide) in wireless control. Z-Wave market: 700+ interoperable products, 12 million Z-Wave products worldwide; used in residential systems, including ADT, Alarm.com, AT&T, DSC, GE/Interlogics, Honeywell, Lowes, Verizon, and Vivint; found in hotels, cruise ships, and vacation rentals; and actively supported by over 160 manufacturers and service providers throughout the world. Z-Wave technology: Low powered RF communications technology that supports full mesh networks without the need for a coordinator node; operates in the sub-1GHz band, impervious to interference from Wi-Fi and other wireless technologies in the 2.4-GHz range (Bluetooth, ZigBee, etc.); designed specifically for control and status apps, supports data rates of up to 100kbps, with AES125 encryption, IPV6, and multi-channel operation; full interoperability through layer 5 with backwards compatibility to all versions; bridged and trialed with OpenADR, SEP 1, SEP 1.1 and other Smart Energy protocols; and shares the same position in the NIST / SGIP Catalog of Standards as the IEEE 802.11 and 802.15 and 802.16 families.

WolfeTrahan.com Page 10 of 38 Accounting & Tax Policy September 26, 2012
AADDTT PPUULLSSEE ((CCOONNTTIINNUUEEDD))
ADT Pulse Screenshot: Web Interface
Source: Wolfe Trahan Accounting & Tax Policy Research; The ADT Corporation.

WolfeTrahan.com Page 11 of 38 Accounting & Tax Policy September 26, 2012
AADDTT PPUULLSSEE ((CCOONNTTIINNUUEEDD))
ADT Pulse Screenshots: “Personal Command Center”
Source: Wolfe Trahan Accounting & Tax Policy Research; The ADT Corporation; www.padgadget.com.

WolfeTrahan.com Page 12 of 38 Accounting & Tax Policy September 26, 2012
TTHHEE NNOORRTTHH AAMMEERRIICCAANN HHOOMMEE SSEECCUURRIITTYY MMAARRKKEETT
The North American home and small business security market is highly fragmented and its estimated size in 2012 is ~$13 billion. Principal competitors in residential and small business security systems are Protection One, Monitronics, and Vivint Inc. and a host of smaller “mom and pop” businesses. New(er) entrants into the market include some of the incumbent local exchange telecommunication companies, but none currently have product offerings reaching a broad customer base. Due to the fragmented nature of the market and the recurring cash flow characteristics of the business, consolidation has been a continued theme in the market from both strategic and financial buyers. In fact, very recently, on September 19th, Blackstone agreed to buy Vivint for over $2 billion, implying an estimated EBITDA multiple >10x according to press reports. According to Vivint, it is the #1 home automation services company in North America and the #2 residential security services provider, servicing 600-700 thousand customers. It was reported that Blackstone out bid multiple other private equity bidders. The monitored security penetration rate has been range bound between 15% and 20% since 2003. While not completely recession proof, the core monitored security customers have historically been very sticky since they are tied into long-term, multi-year contracts, often pay in advance through automated charges, and the service provides peace of mind. Monthly fees have risen by over 10% since the end of 2007 and the industry demonstrates lower churn / longer customer relationship lives than many other industries. North America Small Business and Security Market Size and Penetration
ADT25% Protection One
4%
Monitronics3%
Vivint2%
Other competitors
66%
Residential and Small Business Security Market
2012 ~$13.0B
98%
86%
69%68%
19%
4%1%
WirelessTVInternetWiredphones
Monitoredsecurity
Energy mgmtHomeautomation
Market Penetration Rates
Source: Wolfe Trahan Accounting & Tax Policy Research; Company filings and presentations.

WolfeTrahan.com Page 13 of 38 Accounting & Tax Policy September 26, 2012
TTHHEE NNOORRTTHH AAMMEERRIICCAANN HHOOMMEE SSEECCUURRIITTYY MMAARRKKEETT ((CCOONNTTIINNUUEEDD))
Video monitoring and home automation are expected to drive further growth in the market, expanding the market opportunities beyond the traditional home security solutions. This new market opportunity has attracted new players into the space, including large and formidable competitors such as AT&T, Comcast, Verizon, Time Warner, and Rogers Communications. These new telecommunication and cable competitors offer both do-it-yourself and monitored solutions. Based on a Parks Associates study, these new features are expected to grow the current market ~30% by 2016, but the monitored security industry is still only expected to have a penetration rate of approximately 20%. As shown in the exhibit below, the market is very competitive, especially given the new market entrants. This heightened level of competition may lead to pricing and margin pressure over the longer-term. Select Competitors in the Security Market
Source: Wolfe Trahan Accounting & Tax Policy Research; Company websites.

WolfeTrahan.com Page 14 of 38 Accounting & Tax Policy September 26, 2012
HHOOWW WWEE BBEELLIIEEVVEE AADDTT SSHHOOUULLDD BBEE VVAALLUUEEDD
We haven’t found a publicly traded company directly comparable to ADT and expect investors to value the company based on a combination of free cash flow, recurring monthly revenue (RMR), and EBITDA. We don’t believe earnings are a reliable measure on which to value the company due to the different accounting for subscriber acquisition costs (SAC), depending on the sales channel in which the customer is sourced. Further, many SAC costs are immediately expensed creating accounting asymmetry as most of the expenses are recognized in the period the customer signs on, but the revenues are recorded each subsequent month over the tenure of the customer. There is also a level of arbitrariness in choosing the proper amortization period to recognize the capitalized costs/revenue (i.e., customer life). In calculating free cash flow, the company treats three cap-ex. like items as capital expenditures:
1. Dealer generated accounts; 2. Subscriber system assets; and 3. Other capital expenditures.
We agree with this treatment and calculate free cash flow in a similar manner. Arguably, current free cash flow generation is understated when calculating it in this manner since all acquisition costs are expensed up-front, followed by monthly subscriber cash flows in subsequent quarters. That is, this free cash flow calculation includes some level of “growth” cap-ex and, therefore, we believe that the true free cash flow of the existing business is understated.

WolfeTrahan.com Page 15 of 38 Accounting & Tax Policy September 26, 2012
AADDTT FFIINNAANNCCIIAALL SSTTAATTEEMMEENNTT DDEEEEPP DDIIVVEE AANNDD KKEEYY DDRRIIVVEERRSS
In the next sections of this report, we discuss our financial analysis and modeling of ADT3. At a high level, based on financial disclosures and a FY ending in September, overall revenues have grown at a 9% CAGR from FY ‘07A to FY ‘12E from an increase in net customer additions and a higher ARPU. EBITDA margins have been steadily increasing from ~44% FY ‘07 to ~47% in FY ‘11, and adjusted EBITDA has grown at a ~11% CAGR from FY ‘07A to FY ‘12E. Note the acquisition of Broadview security closed in FY ‘10 and, thus, FY ‘11 is not necessarily comparable to prior years. We estimate free cash flow of $472 million in FY ’12, growing to $539 million in FY ’14. A key question we’re still contemplating is the sustainable free cash flow margin for the business as FY ‘11 unlevered free cash margins reached 19% and we’re forecasting 14-15% in fiscal years 2012 through 2014. ARPU has grown 3.2% from 2010 to 2011 and we forecast it to grow 3.9% in FY ’12 ending in September as the company’s Pulse product take rate increases (price points on Pulse are ~$10 higher than more basic monitoring contracts). Customer churn has been fairly stable between 13% and 13.5%. ADT Corporation: Summary Financial Statements, Operating Information, and WT Estimates ($ in millions)
WT Est. WT Est. WT Est.
FY 2009A FY 2010A FY 2011A FY 2012E FY 2013E FY 2014E
Net revenue $2,248 $2,591 $3,110 $3,240 $3,381 $3,562Y/Y growth ‐‐ 15.3% 20.0% 4.2% 4.4% 5.3%
Pro forma EBITDA 1,013 1,109 1,463 1,579 1,686 1,837 Pro forma EBITDA margin 45% 43% 47% 49% 50% 52%
Pro forma operating income 440 517 681 726 778 866 Operating income margin 20% 20% 22% 22% 23% 24%
Pro forma diluted EPS NA NA $1.57 $1.70 $1.89 $2.14Y/Y growth ‐‐ ‐‐ ‐‐ 8% 12% 13%
Operating cash flow 981 1,070 1,439 1,494 1,566 1,702
Capital expenditures 736 801 902 1,081 1,164 1,224
Interest expense, after tax 53 69 58 59 61 61
FCFF 298 338 595 472 463 539 FCFF margin 13% 13% 19% 15% 14% 15%
Dividends NM NM NM 0 116 139
FCFF, after dividends NM NM NM 472 347 400
Customer additions/metrics
Total number of customers (000s) 4,753 6,285 6,351 6,455 6,561 6,755
Gross customer additions (000s) 971 1,025 1,088 1,174 1,248 1,351
Attrition (%) 14.3 13.3 13.0 13.5 13.4 13.3
Average Revenue Per User (ave.) $35.92 $36.10 $37.24 $38.71 $40.12 $41.58
Capital Structure (Pro Forma as of 9/30/2012)
Pro forma cash 300
Pro forma debt 2,899
Pro forma gross debt / FY '12E EBITDA 1.8x
FY 2012E EBITDA(1)1,618
FY 2012E Cap‐ex 1,081
(1) EBITDA includes rent expense addition of $39 million in FY ‘12E since we capitalize operating leases. Note: WT est. = Wolfe Trahan estimates.
Source: Wolfe Trahan Accounting & Tax Policy Research Estimates; Company filings.
3 Note that the ADT spin-off business is not directly comparable to segment disclosures provided in Tyco’s SEC filings as the prior business included portions of the commercial security business that is not part of the ADT spin-off. The North America commercial security business is included in the “new” Tyco, along with the Fire Safety business. The company acquired its largest competitor Broadview Security (~1.4 million subscribers) in May 2010.

WolfeTrahan.com Page 16 of 38 Accounting & Tax Policy September 26, 2012
AADDTT FFIINNAANNCCIIAALL SSTTAATTEEMMEENNTT DDEEEEPP DDIIVVEE AANNDD KKEEYY DDRRIIVVEERRSS ((CCOONNTTIINNUUEEDD))
RREEVVEENNUUEE
The company has set long term annual organic revenue growth targets of 5% to 7% (FY ’13 to FY ’17). Overall, we are forecasting 4.4% revenue growth in FY 2013 and 5.3% in FY 2014. Our baseline assumption for total organic revenue growth (ex. foreign exchange translation and acquisitions) is that the overall security market grows 1.5% combined with average price increases of 3% to 4% over the next two years. We do not model additional revenue from acquisitions or increased market penetration both of which seem reasonably possible, but very difficult to accurately quantify. There is seasonality in the business as more household moves take place during calendar 'Q2 and 'Q3 and, therefore, the disconnect rate is higher in those quarters than in 1st and 4th quarters. As shown in the next exhibit, in recent quarters, the company has grown overall total revenues in the low single digits consistent with overall 1% to 2% market growth and ~3% price increases. ADT: Historical Revenues ($ in millions)
12/31/11 3/30/12 6/29/12 9/30/12 12/31/12 3/30/13 6/30/13 9/30/13
2010A 2011A 1Q12A 2Q12A 3Q12A 4Q12E 2012E 1Q13E 2Q13E 3Q13E 4Q13E 2013E 2014E
Recurring customer revenue 2,282 2,765 708 720 733 750 2,911 758 768 778 790 3,094 3,287
Other revenue 309 345 87 87 81 74 329 73 72 71 71 287 274
Net revenue 2,591 3,110 795 807 814 824 3,240 831 840 850 860 3,381 3,562
Y/Y Growth 15.3% 20.0% 3.9% 5.1% 4.0% 3.6% 4.2% 4.6% 4.0% 4.4% 4.4% 4.4% 5.3%
Q/Q Growth ‐‐ ‐‐ 0.0% 1.6% 0.8% 1.2% ‐‐ 0.9% 1.0% 1.1% 1.3% ‐‐ ‐‐
Source: Wolfe Trahan Accounting & Tax Policy Research; Company filings.
The three drivers in our model of ADT’s forecasted revenue are gross customer additions, average revenue per user (ARPU), and customer churn. Overall, the company has two sources of revenue: monthly recurring customer revenue from security monitoring services (90% of revenues as of ‘Q3 FY ’12) and “other revenue” from the direct sale of security equipment to customers. We model monthly recurring customer revenue as a function of ARPU and the ending number of customers. Other revenue is derived from the sale of equipment to customers in the period in which the security equipment is installed. Historically, the majority of ADT’s customers owned their equipment. With the introduction of Pulse, ADT is endeavoring to keep ownership of the security system due to proprietary technology and to increase switching costs (more difficult/costly for a customer to switch monitoring services to another company if ADT owns the system). As we explain later, since the accounting for ADT owned systems is different than customer owned systems, there will be a short-term headwind to other revenue as security installation revenues are deferred and recognized on an accelerated basis over a 15 year life of the customer relationship. This dynamic began in ’Q3 FY ’12.

WolfeTrahan.com Page 17 of 38 Accounting & Tax Policy September 26, 2012
AADDTT FFIINNAANNCCIIAALL SSTTAATTEEMMEENNTT DDEEEEPP DDIIVVEE AANNDD KKEEYY DDRRIIVVEERRSS ((CCOONNTTIINNUUEEDD))
AverageRevenuePerUser(ARPU)
ARPU is defined by the company as the average amount of recurring revenue per customer per month and is calculated based on the recurring revenue under contract at the end of period, divided by the total number of customers under contract at the end of the period. We estimate 0.9% Q/Q ARPU growth in FY 2013 and FY 2014 and this amount has trended from 0.6% Q/Q growth to 1.3% Q/Q growth over the past 7 quarters. On an annual basis in FY ’13 and ’14, we estimate an increase in ARPU of 3.6% based on annual price increases for existing customers and higher Pulse take rates. ADT: Historical Average Revenue Per User
12/31/11 3/30/12 6/29/12 9/30/12 12/31/12 3/30/13 6/30/13 9/30/13
2010A 2011A 1Q12A 2Q12A 3Q12A 4Q12E 2012E 1Q13E 2Q13E 3Q13E 4Q13E 2013E 2014E
ARPU ($) 36.10 37.24 37.51 37.98 38.36 38.71 38.71 39.05 39.41 39.76 40.12 40.12 41.58
Y/Y Growth 0.5% 3.2% 2.8% 3.5% 3.6% 3.9% 3.9% 4.1% 3.8% 3.6% 3.6% 3.6% 3.6%
Q/Q Growth ‐‐ ‐‐ 0.7% 1.3% 1.0% 0.9% ‐‐ 0.9% 0.9% 0.9% 0.9% ‐‐ ‐‐
Source: Wolfe Trahan Accounting & Tax Policy Research; Company filings.
CustomerAdditionsvs.Attrition
The ending number of customers is a function of gross customer additions and the customer attrition rate (i.e., churn rate). We forecast gross customer additions growth of 2% each quarter during FY ’13 and FY ’14. We assume the churn rate will decline from 13.5% in ‘Q3 2012 gradually 0.1% (percentage points) during FY ’13 and remain at 13% during FY 2014. The customer attrition rate is calculated as the 52 week trailing ratio, the numerator of which is the annualized recurring revenue lost during the period due to attrition and the denominator of which is total annualized recurring revenue based on an average of recurring revenue under contract at the beginning of each month during the period. ADT: Historical Net Customer Gains/(Losses)
12/31/11 3/30/12 6/29/12 9/30/12 12/31/12 3/30/13 6/30/13 9/30/13
2010A 2011A 1Q12A 2Q12A 3Q12A 4Q12E 2012E 1Q13E 2Q13E 3Q13E 4Q13E 2013E 2014E
in 000s
Beginning customers 6,285 6,351 6,394 6,432 6,447 6,351 6,455 6,471 6,494 6,524 6,455 6,561
Gross customer additions 1,025 1,088 295 291 291 297 1,174 303 309 315 321 1,248 1,351
Ending customers 6,351 6,394 6,432 6,447 6,455 6,455 6,471 6,494 6,524 6,561 6,561 6,755
Gross customers lost 1,022 252 253 276 288 1,069 287 286 285 284 1,142 1,157
Net customer gain/(loss) 66 43 38 15 8 104 16 23 30 37 106 193
Source: Wolfe Trahan Accounting & Tax Policy Research; Company filings.
The increase in the customer churn rate in ‘Q3 2012 was attributable to price increases on certain customers that occurred earlier than usual. Historical Customer Churn
12/31/11 3/30/12 6/29/12 9/30/12 12/31/12 3/30/13 6/30/13 9/30/13
2010A 2011A 1Q12A 2Q12A 3Q12A 4Q12E 2012E 1Q13E 2Q13E 3Q13E 4Q13E 2013E 2014E
Customer attrition rate (%) 13.3 13.0 13.0 13.2 13.5 13.4 13.5 13.3 13.2 13.1 13.0 13.4 13.3
Note: ADT calculates the attrition rate as the 52 week trailing ratio of the annualized recurring revenue lost during the period due to attrition over the total annualized recurring revenue based on an average of recurring revenue under contract at the beginning of each month during the period.
Source: Wolfe Trahan Accounting & Tax Policy Research; Company filings.

WolfeTrahan.com Page 18 of 38 Accounting & Tax Policy September 26, 2012
AADDTT FFIINNAANNCCIIAALL SSTTAATTEEMMEENNTT DDEEEEPP DDIIVVEE AANNDD KKEEYY DDRRIIVVEERRSS ((CCOONNTTIINNUUEEDD))
Based on our model and estimates, below is a 2013 unlevered free cash flow sensitivity table intersecting the attrition rate and annual ARPU growth. The left side of the table is the dollar change based on changes in the assumed attrition rate and ARPU growth rate. The shaded portions in the tables are base case assumptions and the right table shows the percentage change to our base case. FCF numbers are much more sensitive to ARPU growth than attrition, and that is why a decision to increase prices will likely result in higher attrition, but is still likely a net positive action. ADT Corporation: FCF Sensitivity Tables ($ in millions)
FY ’13E Unlevered Free Cash Flow
Attrition Rate (%)
10 11 12 13 14 15 16
0.4% 467 451 435 420 404 389 375
1.2% 479 462 446 430 415 400 385
2.0% 490 473 457 441 426 410 395
2.8% 502 485 468 452 436 421 406
3.6% 513 496 480 463 447 432 416
4.5% 525 508 491 474 458 442 427
5.3% 537 519 502 486 469 453 438
6.1% 549 531 514 497 481 464 449
7.0% 561 543 526 509 492 476 460Annual ARPU Growth Rate
Attrition Rate (%)
10 11 12 13 14 15 16
0.4% 101% 97% 94% 91% 87% 84% 81%
1.2% 103% 100% 96% 93% 90% 86% 83%
2.0% 106% 102% 99% 95% 92% 89% 85%
2.8% 108% 105% 101% 98% 94% 91% 88%
3.6% 111% 107% 104% 100% 97% 93% 90%
4.5% 113% 110% 106% 102% 99% 96% 92%
5.3% 116% 112% 108% 105% 101% 98% 94%
6.1% 118% 115% 111% 107% 104% 100% 97%
7.0% 121% 117% 113% 110% 106% 103% 99%Annual ARPU Growth Rate
Source: Wolfe Trahan Accounting & Tax Policy Research estimates; Company filings.
MMAARRGGIINN AANNDD EEXXPPEENNSSEESS
Gross margins were 57.7% in the most recent quarter (‘Q3 FY ’12) and we are forecasting an increase to 58.0% in ‘Q4 FY ’12. We have modeled a 0.2% (percentage point) increase in gross margins each quarter as fixed operating costs are leveraged from higher revenues. SG&A costs were 35.3% of sales in ‘Q3 FY ’12 and we are modeling a similar percentage in ‘Q4 FY ’12. We forecast SG&A costs of 35.5% in FY ’13 and 35.0% in FY ’14. ADT as a standalone public company is expected to incur $30 to $50 million of additional costs annually and, as such, we’re forecasting $40 million each year (prior years’ financials in our model have been adjusted to reflect these costs). After adjusting for prior period restructuring costs, operating margin was 22.8% in ‘Q3 FY ’12 and, based on the prior assumptions for revenues and margins, we’re forecasting operating margins of 22.7% in ‘Q4 FY ’12, and 23.0% and 24.3% in FY ’13 and FY ’14, respectively. Interest expense is expected to be $93 million based on debt outstanding of $2.5 billion at a weighted average cost of 3.54% including $4 million of debt issuance fees amortization. As we discuss in the tax section of this report, we are modeling a 35% GAAP effective tax rate in earnings. ADT: Estimated Historical and WT Forecasted Margins [common sized to revenue]
12/30/11 3/30/12 6/29/12 9/30/12 12/31/12 3/30/13 6/30/13 9/30/13
2011A 1Q12A 2Q12A 3Q12A 4Q12E 2012E 1Q13E 2Q13E 3Q13E 4Q13E 2013E 2014E
Revenue 100.0% 100.0% 100.0% 100.0% 100.0% 100.0% 100.0% 100.0% 100.0% 100.0% 100.0% 100.0%
Gross profit 56.9% 56.6% 56.8% 57.7% 58.0% 57.3% 58.2% 58.4% 58.6% 58.8% 58.5% 59.3%
SG&A 35.9% 35.8% 34.9% 35.3% 35.3% 35.3% 35.5% 35.5% 35.5% 35.5% 35.5% 35.0%
Pro forma operating income 21.9% 21.7% 22.4% 22.8% 22.7% 22.4% 22.7% 22.9% 23.1% 23.3% 23.0% 24.3%
Pro forma EBT 19.0% 18.9% 19.7% 20.0% 19.9% 19.6% 19.9% 20.1% 20.4% 20.6% 20.2% 21.7%
Taxes 6.8% 7.2% 6.9% 7.6% 7.0% 7.2% 7.0% 7.0% 7.1% 7.2% 7.1% 7.6%
Pro forma net income 11.8% 11.4% 12.6% 12.2% 12.9% 12.3% 12.9% 13.1% 13.2% 13.4% 13.2% 14.1%
Pro forma EBITDA 47.0% 47.1% 48.6% 49.4% 49.9% 48.7% 49.4% 49.7% 50.0% 50.3% 49.9% 51.6% Source: Wolfe Trahan Accounting & Tax Policy Research estimates; Company filings.

WolfeTrahan.com Page 19 of 38 Accounting & Tax Policy September 26, 2012
AADDTT FFIINNAANNCCIIAALL SSTTAATTEEMMEENNTT DDEEEEPP DDIIVVEE AANNDD KKEEYY DDRRIIVVEERRSS ((CCOONNTTIINNUUEEDD))
Customer acquisition costs and two sales channels create complicated balance sheet accounting for deferred costs and revenues. Later we explain and compare the different accounting methods for subscriber acquisition costs. Due to ADT’s business model, there are several asset and liability balance sheet accounts created to hold certain up-front costs incurred and fees received by ADT. Below we discuss each of these accounts. BBAALLAANNCCEE SSHHEEEETT AANNDD CCAASSHH FFLLOOWW
DeferredRevenue
Typically when a customer initiates a security monitoring contract, the company receives up-front non-refundable fees. Such fees are not recognized up front as income, but instead are recorded on the balance sheet as a liability called deferred subscriber acquisition revenue (DSAR). In turn, they are amortized (reduce liability, increase revenue) over the estimated life of the customer relationship (15 years on an accelerated basis). In our model, we grow the DSAR account at the same rate as revenues. DeferredCosts:SubscriberAcquisitionCost(SAC)
There are also up-front direct and incremental selling costs (i.e., commissions) incurred to initiate a monitoring contract called deferred subscriber acquisition costs (SAC). Similar to the recognition of deferred fees above, the costs are depreciated over the estimated life of the customer relationship. ADT: Estimated Historical and WT Forecasted SAC
12/31/11 3/30/12 6/29/12 9/30/12 12/31/12 3/30/13 6/30/13 9/30/13
2011A 1Q12A 2Q12A 3Q12A 4Q12E 2012E 1Q13E 2Q13E 3Q13E 4Q13E 2013E 2014E
Subscriber acquisition costs ($ millions) 131 37 37 37 38 149 40 42 43 45 169 204
Gross internal customer adds (000s) 588 159 157 157 162 636 163 169 175 182 689 770
SAC per gross addition 222.97 234.12 234.12 234.12 234.12 234.12 245.83 245.83 245.83 245.83 245.83 258.12
Source: Wolfe Trahan Accounting & Tax Policy Research estimates; Company filings. SubscriberSystemAssets
For new accounts generated through its direct sales channel, in some situations, ADT retains ownership of the security assets (security control panels, touchpad, motion detectors). With the rollout of Pulse and proprietary technology embedded in Pulse hardware, the company is seeking to retain more ownership of its monitoring assets going forward. The subscriber system assets include the security monitoring hardware in the home and direct labor related to installation (direct materials and labor). In turn, these assets are depreciated over the expected life of the customer relationship (15 years accelerated). The deferred revenue, SAC, and subscriber system assets are recognized under an accelerated method over 15 years (average declining balance rate of 240%) such that 58% of the revenue/costs are recognized within the first 5 years, 25% is recognized within the second five years, and 17% is recognized in the final 5 years. This appears arbitrary to us and why we focus on cash flow measures. IntangibleAssets
As we explain in more detail in the section on Accounting for Customer and ADT Owned Installation Costs, an intangible asset is recorded for the full cost of acquiring dealer accounts at the initial purchase price. In turn, the intangible asset is amortized as expense in earnings over its estimated useful life of 15 years on an accelerated basis (300% average declining balance rate) such that 67% of the costs are recorded in the first 5 years, 22% within the second 5 years, and 11% in the final five years.

WolfeTrahan.com Page 20 of 38 Accounting & Tax Policy September 26, 2012
AADDTT RREEVVEENNUUEE DDEETTAAIILL
Historical and WT Forecasted Revenue Model
ADT REVENUE DETAIL
($ in millions)
12/31/11 3/30/12 6/29/12 9/30/12 12/31/12 3/30/13 6/30/13 9/30/13
2011A 1Q12A 2Q12A 3Q12A 4Q12E 2012E 1Q13E 2Q13E 3Q13E 4Q13E 2013E 2014E
Recurring customer revenue 2,765 708 720 733 750 2,911 758 768 778 790 3,094 3,287
Other revenue 345 87 87 81 74 329 73 72 71 71 287 274
Net revenue 3,110 795 807 814 824 3,240 831 840 850 860 3,381 3,562
Y/Y Growth 20.0% 3.9% 5.1% 4.0% 3.6% 4.2% 4.6% 4.0% 4.4% 4.4% 4.4% 5.3%
Q/Q Growth ‐‐ 0.0% 1.6% 0.8% 1.2% ‐‐ 0.9% 1.0% 1.1% 1.3% ‐‐ ‐‐
Y/Y Growth %
Recurring customer revenue 21.2% 3.8% 5.6% 5.3% 6.3% 5.3% 7.1% 6.6% 6.2% 5.4% 6.3% 6.3%
Other revenue 11.7% 4.8% 1.2% ‐5.8% ‐17.2% ‐4.6% ‐15.9% ‐17.0% ‐11.9% ‐4.9% ‐12.7% ‐4.6%
Net revenue 20.0% 3.9% 5.1% 4.0% 3.6% 4.2% 4.6% 4.0% 4.4% 4.4% 4.4% 5.3%
Q/Q Growth %
Recurring customer revenue ‐‐ 0.4% 1.8% 1.7% 2.3% ‐‐ 1.1% 1.3% 1.4% 1.5% ‐‐ ‐‐
Other revenue ‐‐ ‐2.8% 0.0% ‐6.9% ‐8.5% ‐‐ ‐1.3% ‐1.3% ‐1.2% ‐1.2% ‐‐ ‐‐
Net revenue ‐‐ 0.0% 1.6% 0.8% 1.2% ‐‐ 0.9% 1.0% 1.1% 1.3% ‐‐ ‐‐
Revenue Drivers
Ending number of customers (000s) 6,351 6,394 6,432 6,447 6,455 6,455 6,471 6,494 6,524 6,561 6,561 6,755
Y/Y Growth 1.1% 2.0% 1.8% 1.4% 1.6% 1.6% 1.2% 1.0% 1.2% 1.6% 1.6% 2.9%
Gross customer additions (000s) 1,088 295 291 291 297 1,174 303 309 315 321 1,248 1,351
Customer attrition rate (%) 13.0 13.0 13.2 13.5 13.4 13.5 13.3 13.2 13.1 13.0 13.4 13.3
Net Customer additions (000s) 66 43 38 15 8 104 16 23 30 37 106 193
ARPU ($) 37.24 37.51 37.98 38.36 38.71 38.71 39.05 39.41 39.76 40.12 40.12 41.58
Y/Y Growth 3.2% 2.8% 3.5% 3.6% 3.9% 3.9% 4.1% 3.8% 3.6% 3.6% 3.6% 3.6%
Q/Q Growth ‐‐ 0.7% 1.3% 1.0% 0.9% ‐‐ 0.9% 0.9% 0.9% 0.9% ‐‐ ‐‐
% of Revenue
Recurring customer revenue 88.9% 89.1% 89.2% 90.0% 91.0% 89.8% 91.2% 91.4% 91.6% 91.8% 91.5% 92.3%
Other revenue 11.1% 10.9% 10.8% 10.0% 9.0% 10.2% 8.8% 8.6% 8.4% 8.2% 8.5% 7.7%
in 000s
Beginning customers 6,285 6,351 6,394 6,432 6,447 6,351 6,455 6,471 6,494 6,524 6,455 6,561
Gross customer additions 1,088 295 291 291 297 1,174 303 309 315 321 1,248 1,351
Ending customers 6,351 6,394 6,432 6,447 6,455 6,455 6,471 6,494 6,524 6,561 6,561 6,755
Gross customers lost 1,022 252 253 276 288 1,069 287 286 285 284 1,142 1,157
Net customer gain/(loss) 66 43 38 15 8 104 16 23 30 37 106 193
Source: Wolfe Trahan Accounting & Tax Policy Research estimates; Company filings.

WolfeTrahan.com Page 21 of 38 Accounting & Tax Policy September 26, 2012
AADDTT IINNCCOOMMEE SSTTAATTEEMMEENNTT
Historical and WT Forecasted Income Statement
ADT INCOME STATEMENT
($ in millions)
12/30/11 3/30/12 6/29/12 9/30/12 12/31/12 3/30/13 6/30/13 9/30/13
2011A 1Q12A 2Q12A 3Q12A 4Q12E 2012E 1Q13E 2Q13E 3Q13E 4Q13E 2013E 2014E
Revenue 3,110 795 807 814 824 3,240 831 840 850 860 3,381 3,562 Y/Y Growth 20.0% 3.9% 5.1% 4.0% 3.6% 4.2% 4.6% 4.0% 4.4% 4.4% 4.4% 5.3%
Q/Q Growth ‐‐ 0.0% 1.6% 0.8% 1.2% ‐‐ 0.9% 1.0% 1.1% 1.3% ‐‐ ‐‐
Cost of revenue 1,341 345 349 344 346 1,384 348 349 352 354 1,403 1,449
Gross profit 1,769 450 458 470 478 1,856 484 491 498 506 1,978 2,112 Gross margin % 56.9% 56.6% 56.8% 57.7% 58.0% 57.3% 58.2% 58.4% 58.6% 58.8% 58.5% 59.3%
SG&A 1,076 274 272 277 291 1,114 295 298 302 305 1,200 1,247
Dis‐synergies(1)
40 10 10 10 0 30 0 0 0 0 0 0 % of revenue 35.9% 35.8% 34.9% 35.3% 35.3% 35.3% 35.5% 35.5% 35.5% 35.5% 35.5% 35.0%
Other operating expenses 0 0 0 0 0 0 0 0 0 0 0 0
Operating income 653 166 177 183 187 712 189 192 196 200 778 866 Operating margin % 21.0% 20.8% 21.9% 22.4% 22.7% 22.0% 22.7% 22.9% 23.1% 23.3% 23.0% 24.3%
Operating income (Form 10) 693 176 187 193
Restruct. and other special items 2 2 (1) 1 0 2 0 0 0 0 0 0
Broadview acq. and integration costs 26 5 5 2 0 12 0 0 0 0 0 0
Pro forma operating income 681 173 181 186 187 726 189 192 196 200 778 866 Pro forma operating margin % 21.9% 21.7% 22.4% 22.8% 22.7% 22.4% 22.7% 22.9% 23.1% 23.3% 23.0% 24.3%
Interest expense, net 89 22 22 23 23 90 23 23 23 23 93 93
Earnings from cont. ops. before taxes 564 144 155 160 164 622 165 169 173 177 684 772
EBT (Form 10) 604 154 165 170
Pro forma EBT 592 151 159 163 164 636 165 169 173 177 684 772
Taxes 213 57 55 62 57 232 58 59 61 62 240 270 Effective tax rate % 37.7% 39.7% 35.8% 38.9% 35.0% 37.3% 35.0% 35.0% 35.0% 35.0% 35.0% 35.0%
Taxes (Form 10) 228 61 59 66
Net income 336 83 96 94 106 390 108 110 112 115 445 502
Net income % 10.8% 10.4% 11.9% 11.5% 12.9% 12.0% 12.9% 13.1% 13.2% 13.4% 13.2% 14.1%
Net income (Form 10) 376 93 106 104
Pro forma net income 369 91 102 99 106 399 108 110 112 115 445 502
Pro forma net income % 11.8% 11.4% 12.6% 12.2% 12.9% 12.3% 12.9% 13.1% 13.2% 13.4% 13.2% 14.1%
Basic shares outstanding 232 232 232 232 232 232 232 232 232 232 232 232
Basic pro forma EPS 1.59 0.39 0.44 0.43 0.46 1.72 0.46 0.47 0.48 0.50 1.92 2.16
Y/Y Growth NA NA NA NA NA 8.2% 18.4% 7.7% 13.2% 8.2% 11.6% 12.8%
Q/Q Growth ‐‐ NA 12.3% ‐2.7% 7.2% ‐‐ 1.1% 2.2% 2.3% 2.4% ‐‐ ‐‐
Diluted shares outstanding 235 235 235 235 235 235 235 235 235 235 235 235
Diluted pro forma EPS 1.57 0.39 0.43 0.42 0.45 1.70 0.46 0.47 0.48 0.49 1.89 2.14
Y/Y Growth NA NA NA NA NA 8.2% 18.4% 7.7% 13.2% 8.2% 11.6% 12.8%
Q/Q Growth ‐‐ NA 12.3% ‐2.7% 7.2% ‐‐ 1.1% 2.2% 2.3% 2.4% ‐‐ ‐‐
(1) Dis-synergies (additional stand-alone company costs) are included in our margin assumption included in WT forward estimates.
Source: Wolfe Trahan Accounting & Tax Policy Research estimates; Company filings.

WolfeTrahan.com Page 22 of 38 Accounting & Tax Policy September 26, 2012
AADDTT BBAALLAANNCCEE SSHHEEEETT
Historical and WT Forecasted Balance Sheet
ADT BALANCE SHEET
($ in millions)
12/30/11 3/30/12 6/29/12 9/30/12 12/31/12 3/30/13 6/30/13 9/30/13
2011A 1Q12A 2Q12A 3Q12A 3Q12 PF 4Q12E 2012E 1Q13E 2Q13E 3Q13E 4Q13E 2013E 2014E
Cash and equivalents 65 61 92 3 207 300 300 369 437 509 587 587 926
Accounts receivable, net 94 97 85 80 80 82 82 83 84 85 86 86 82
Inventories, net 33 45 49 57 41 54 54 50 50 51 52 52 55
Prepaids and other current assets 48 46 45 44 38 37 37 37 38 38 39 39 41
Deferred income taxes 23 23 23 23 23 23 23 23 23 23 23 23 23
Current assets 263 272 294 207 389 496 496 563 632 706 786 786 1,126
PP&E, net 172 174 158 178 211 213 213 215 217 219 221 221 231
Subscriber system assets, net 1,653 1,660 1,676 1,703 1,703 1,728 1,728 1,752 1,777 1,803 1,830 1,830 1,950
Goodwill 3,395 3,396 3,400 3,396 3,396 3,396 3,396 3,396 3,396 3,396 3,396 3,396 3,396
Intangibles, net 2,755 2,789 2,818 2,846 2,846 2,875 2,875 2,914 2,952 2,987 3,021 3,021 3,162
Deferred subscriber acquisition costs, net 417 405 437 454 454 458 458 468 480 492 505 505 572
Deferred tax asset NOL ‐‐ ‐‐ ‐‐ ‐‐ 359 359 359 301 241 181 119 119 0
Other non‐current assets 84 82 82 93 233 233 233 233 233 233 233 233 233
Total assets 8,739 8,778 8,865 8,877 9,590 9,756 9,756 9,841 9,927 10,017 10,111 10,111 10,669
ST debt, including current portion of LT debt 1 14 1 1 1 1 1 1 1 1 1 1 1
Accounts payable 153 151 151 177 161 161 161 166 172 178 185 185 214
Accrued and other current liabilities 163 144 148 165 158 158 158 162 164 166 168 168 182
Deferred revenue 250 249 257 254 254 247 247 249 252 255 258 258 273
Current liabilities 567 558 557 597 574 567 567 579 589 600 612 612 670
LT debt 1,506 1,510 1,501 1,537 2,525 2,525 2,525 2,525 2,525 2,525 2,525 2,525 2,525
Deferred subscriber acquisition revenue 630 633 640 650 650 658 658 664 671 679 687 687 727
Deferred tax liabilities 632 632 632 632 632 689 689 678 666 654 641 641 739
Other non‐current liabilities 173 167 173 171 170 172 172 172 172 172 172 172 172
Total liabilities 3,508 3,500 3,503 3,587 4,551 4,611 4,611 4,617 4,623 4,629 4,637 4,637 4,832
Preferred stock 0 0 0 0 0 0 0 0 0 0 0 0 0
Common stock 0 0 0 0 2 2 2 2 2 2 2 2 2
Stock warrants 0 0 0 0 0 0 0 0 0 0 0 0 0
APIC 0 0 0 0 4,970 5,076 5,076 5,076 5,076 5,076 5,076 5,076 5,076
Parent company investment 5,152 5,196 5,274 5,223 0 0 0 0 0 0 0 0 0
Retained earnings 0 0 0 0 0 0 0 79 159 243 329 329 692
AOCI 79 82 88 67 67 67 67 67 67 67 67 67 67
Treasury stock 0 0 0 0 0 0 0 0 0 0 0 0 0
Equity 5,231 5,278 5,362 5,290 5,039 5,145 5,145 5,224 5,305 5,388 5,474 5,474 5,837
Total liabilities and equity 8,739 8,778 8,865 8,877 9,590 9,756 9,756 9,841 9,927 10,017 10,111 10,111 10,669
Source: Wolfe Trahan Accounting & Tax Policy Research estimates; Company filings.

WolfeTrahan.com Page 23 of 38 Accounting & Tax Policy September 26, 2012
AADDTT SSTTAATTEEMMEENNTT OOFF CCAASSHH FFLLOOWWSS
Historical and WT Forecasted Cash Flow Statement
ADT STATEMENT OF CASH FLOWS
($ in millions)
12/30/11 3/30/12 6/29/12 9‐mo ending 9/30/12 12/31/12 3/30/13 6/30/13 9/30/13
2011A 1Q12A 2Q12A 3Q12A 3Q12 PF 4Q12E 2012E 1Q13E 2Q13E 3Q13E 4Q13E 2013E 2014E
Net income (loss) 376 93 106 104 292 106 399 108 110 112 115 445 502
Depreciation and amortization 927 239 243 246 728 254 982 252 255 259 263 1,029 1,091
Amort. of deferred sub. acq. rev. (114) (29) (30) (30) (89) (30) (119) (30) (30) (30) (30) (120) (120)
Deferred sub. acq. revenue 115 32 35 42 109 38 147 36 37 38 38 149 160
Non‐cash compensation 9 2 2 2 6 0 6 0 0 0 0 0 0
Deferred income taxes (53) 61 59 66 186 57 243 46 47 48 50 192 216
Provision for losses on A/R and inv. 46 14 11 13 38 12 50 12 12 12 12 48 48
Other non‐cash items 3 0 0 0 0 (4) (4) 2 2 2 3 9 13
Changes in working capital
Accounts receivable (45) (15) 1 (5) (19) (14) (33) (13) (13) (13) (13) (52) (44)
Inventories (10) (13) (4) (9) (26) (13) (39) 4 (1) (1) (1) 2 (3)
Accounts payable 35 (2) 0 25 23 (0) 23 6 6 6 7 24 29
Accrued and other liabilities (47) (22) 4 (2) (20) 0 (20) 4 2 2 2 10 14
Income taxes, net 266 (3) (2) (2) (7) 0 (7) 0 0 0 0 0 0
Deferred subscriber acq. costs (131) (15) (59) (45) (119) (38) (157) (40) (42) (43) (45) (169) (204)
Other 62 (5) 6 23 24 0 24 0 0 0 0 0 0
Cash from operations 1,439 337 372 428 1,126 368 1,494 386 386 393 401 1,566 1,702
Dealer gen. cust. accts. and bulk acct. purch. (581) (164) (159) (171) (494) (165) (659) (176) (176) (176) (176) (706) (727)
Subscriber system assets (290) (81) (91) (96) (268) (98) (366) (99) (101) (103) (105) (407) (443)
Capital expenditures (31) (5) (7) (32) (44) (12) (56) (12) (13) (13) (13) (51) (53)
Acq. of businesses, net of cash acq. 0 0 0 0 0 0 0 0 0 0 0 0 0
Other (7) 0 0 (9) (9) 0 (9) 0 0 0 0 0 0
Cash from investing (909) (250) (257) (308) (815) (275) (1,090) (288) (290) (292) (294) (1,164) (1,224)
Repayments of current maturities of LT debt (1) 0 0 (1) (1) 0 (1) 0 0 0 0 0 0
Dividend payments 0 0 0 0 0 0 0 (29) (29) (29) (29) (116) (139)
Allocated debt activity (5) 17 (19) 37 35 0 35 0 0 0 0 0 0
Change due to Tyco and affiliates 32 1 1 (2) 0 0 0 0 0 0 0 0 0
Change in parent co. investment (574) (109) (68) (243) (420) 0 (420) 0 0 0 0 0 0
Spin‐off adjustments 0 0 0 0 214 0 214 0 0 0 0 0 0
Other 0 0 0 0 0 0 0 0 0 0 0 0 0
Cash from financing (548) (91) (86) (209) (172) 0 (172) (29) (29) (29) (29) (116) (139)
F/X (1) 0 2 1 3 0 3 0 0 0 0 0 0
Cash and equiv. at beg. of period 84 65 61 91 65 207 65 300 369 437 509 300 587
Cash and equivalents at end of period 65 61 91 3 207 300 300 369 437 509 587 587 926
Unlevered Free Cash Flow 595 101 129 144 364 108 472 113 112 117 122 463 539
Unlevered Free Cash Flow Margin 19.1% 12.7% 16.0% 17.6% 15.1% 13.1% 14.6% 13.6% 13.3% 13.7% 14.1% 13.7% 15.1%
Unlevered Free Cash Flow, after dividend 595 101 129 144 364 108 472 84 83 88 93 347 400
Source: Wolfe Trahan Accounting & Tax Policy Research estimates; Company filings.

WolfeTrahan.com Page 24 of 38 Accounting & Tax Policy September 26, 2012
AADDTT’’SS CCAAPPIITTAALL SSTTRRUUCCTTUURREE PPRROOVVIIDDEESS FFIINNAANNCCIIAALL FFLLEEXXIIBBIILLIITTYY
In July, ADT issued $2.5 billion in long-term debt at a weighted average coupon rate of 3.54%. The pro forma capital structure of ADT consists of $300 million cash and $2.9 billion in debt, implying a gross debt to FY '12E EBITDA multiple of 1.8x. Pro Forma Capital Structure and Long-Term Debt Detail ($ in millions)
Debt Detail
Rate Amount
Interest
Expense
Other debt 3.54% $25 $1
Senior Unsecured due 7/15/2017 2.25% 750 17
Senior Unsecured due 7/15/2022 3.50% 1,000 35
Senior Unsecured due 7/15/2042 4.88% 750 37
Weighted average rate and sub‐totals 3.54% $2,525 $89
Issuance fees (annual amortization) 20 4
Interest expense $93
Operating leases (8 x $39m rent expense) 312
Capital leases 62
Total debt $2,899
Source: Wolfe Trahan Accounting & Tax Policy Research; Company filings.
Pro Forma Capital Structure
Cash
Debt
Capital and operating leases
Total lease adjusted debt
Net debt
Shareholders equity
Gross debt / FY12E EBITDA
Gross debt / FY11A EBITDA
$300
$2,525
374
2,899
2,599
$5,145
1.8x
2.0x

WolfeTrahan.com Page 25 of 38 Accounting & Tax Policy September 26, 2012
AADDTT’’SS CCAAPPIITTAALL AALLLLOOCCAATTIIOONN
The ADT business is cash generative and the company has indicated that it will pay an annual dividend of $0.50 per share which equates to a ~1.4% yield or $116 million annually (~26% payout ratio based on FY ’13E EPS). We forecast free cash flow of $347 and $400 million in FY ’13 and FY ’14 after dividend payments, providing financial flexibility to further materially increase the dividend over time. If we assume a 40% payout ratio, the dividend yield would be 2.1%. Below we show the source of cash flow in FY ’13 based on our forecasts. ADT: WT Forecasted FY ’13 Cash Flow ($ in millions)
$0
$500
$1,000
$1,500
EBITDA Cap‐ex Interest Taxes Dividends Free cash flow
FY '13E Free Cash Flow Waterfall
$1.7B
$0.4B
$0.1B
$0.1B
$1.1B
$0.0B
Source: Wolfe Trahan Accounting & Tax Policy Research estimates.

WolfeTrahan.com Page 26 of 38 Accounting & Tax Policy September 26, 2012
AACCCCOOUUNNTTIINNGG FFOORR CCUUSSTTOOMMEERR AANNDD AADDTT OOWWNNEEDD IINNSSTTAALLLLAATTIIOONN CCOOSSTTSS
ADT sells its products through different sales channels and with a mix of customer owned and company owned equipment, with more ADT owned systems expected to occur over time as its Pulse product gains market penetration. This business model creates different accounting impacts on earnings and cash flow and one of the primary reasons we believe an earnings based approach to valuing the company doesn’t capture the full economic realities of the business. Below is an illustration comparing the financial statement impacts of customer owned, ADT owned, and dealer generated subscribers. For situations in which the customer is generated through ADT’s internal sales force and owns the equipment, the up-front installation revenue is generally recorded in the period in which it is installed. There are more expenses than revenues in the current period due to labor and equipment installation costs, marketing, and overhead expenses and, thus, significant cash costs (outflows) in the initial period of the customer contract. Further, a substantial portion of the sales commission costs are capitalized as a subscriber acquisition cost asset. By contrast, under a scenario in which ADT owns the equipment, there are similar cash outflows (costs) in the period in which the customer contract is initiated. However, the equipment’s cost is capitalized as part of property, plant, and equipment and depreciated over time. Sales commissions paid (subscriber acquisition costs) are similarly capitalized as they are under the customer-owned model. However, generally, 100% are capitalized instead of ~70% under a customer owned model. Since a higher amount of costs are capitalized under the ADT-owned scenario, earnings are generally higher from a lower amount of immediately expensed costs. For new customers acquired through dealers, the acquisition of the customer and total amount paid to the dealer is recorded on the balance sheet as an intangible asset. This amount is shown on the cash flow statement as an investing cash outflow and we treat it as a capital expenditure. It results in a large cash flow in the period the customer is “purchased” from the dealer, but with non-cash amortization expense recorded in the subsequent quarters. Intangible assets from dealer acquired accounts are amortized into earnings on a 300% accelerated basis over 15 years, resulting in ~67% of the amort. in the first 5 years, 22% between years 6 and 10, and the remaining 11% in years 11 through 15. Example: Financial Statement Effects of Accounting for Customer Acquisition Costs
Customer Owned ADT Owned Dealer Account
Cash
Installation revenue $650 $650 $0
Cost and expenses:
Installation (labor and equip.) 950 950 0
Sales (commissions) 250 250 0
Marketing and other admin. 525 525 5
Account acquisition costs 0 0 1,185
Total costs 1,725 1,725 1,190
New subscriber investment ($1,075) ($1,075) ($1,190)
Income Statement
Other revenue $650 $0 $0
Installation cost (950) 0 0
Sales cost (75) 0 0
Marketing and admin (525) (525) (5)
Operating income ($900) ($525) ($5)
Balance Sheet: Asset/(Liability)
Deferred revenue $0 ($650) $0
Capitalized asset (PP&E) 0 950 0
Deferred asset (SAC) 175 250 0
Intangible asset 0 0 1,185
Net assets $175 $550 $1,185
Source: Wolfe Trahan Accounting & Tax Policy Research; Company presentation.

WolfeTrahan.com Page 27 of 38 Accounting & Tax Policy September 26, 2012
MMAATTEERRIIAALL NNOOLL TTAAXX AASSSSEETTSS,, LLOOWW CCAASSHH TTAAXX RRAATTEESS,, AANNDD LLIIKKEELLYY FFUURRTTHHEERR TTAAXX OOPPTTIIMMIIZZAATTIIOONN
As part of the spin-off, the parent company, Tyco International pushed down $1 billion in U.S. Federal tax net operating loss carryforwards (NOLs) to ADT. At a 35% U.S. federal tax rate, ADT disclosed that this equates to a deferred tax asset NOL of $411 million as of 6/30/12 (disclosed in Form 10). Of this amount, we estimate a U.S. Federal NOL of $359 million (at a 35% rate, the NOL is ~$1 billion). This had the effect of unlocking tax value that was previously trapped at the Tyco Switzerland incorporated parent company. The company is expected to also pay a single digit cash tax rate for the foreseeable future as the $1 billion in net operating loss carryforwards are utilized. Accordingly, we are modeling a 7% cash tax rate in FY ’13 and ’14 to incorporate Federal alternative minimum taxes, states taxes, and some Canadian taxes. ADT: Forecasted NOL Usage
12/31/12 3/30/13 6/30/13 9/30/13 12/31/13 3/30/14 6/30/14 9/30/14
NOL Deferred Tax Asset Usage 2012E 1Q13E 2Q13E 3Q13E 4Q13E 2013E 1Q14E 2Q14E 3Q14E 4Q14E 2014E
Beginning tax‐effected NOL DTA 359 301 241 181 359 119 54 0 0 119
Beginning pre‐tax NOL 1,024 859 690 517 1,024 340 154 0 0 340
Pre‐tax income 165 169 173 177 684 186 191 195 201 772
NOL Generated (Used) (165) (169) (173) (177) (684) (186) (154) 0 0 (340)
Ending pre‐tax NOL 1,024 859 690 517 340 340 154 0 0 0 0
Tax Rate 35% 35% 35% 35% 35% 35% 35% 35% 35% 35% 35%
Ending tax‐effected NOL DTA 359 301 241 181 119 119 54 0 0 0 0
Source: Wolfe Trahan Accounting & Tax Policy Research estimates; Company filings.
OOFFFF--BBAALLAANNCCEE SSHHEEEETT DDEEFFEERRRREEDD TTAAXX AASSSSEETT??
In our model, there are two primary tax considerations. First, we model a 35% GAAP effective tax rate for ADT based on a pro forma effective tax rate of approximately 34.6% in the company’s historical financial statements (company guidance is 36% to 38% which we believe is too high). The company inserted a new disclosure in its most recently amended SEC Form 10 information statement suggesting there will be a reduction in the company’s marginal tax rate from tax intangible amortization:
“The pro forma effective tax rates include the long-term tax benefit that will result from ADT’s purchase of certain intellectual property from Tyco in conjunction with the spin-off. This purchase will result in the creation of an asset for tax purposes, the amortization of which will reduce our effective tax rate over the asset’s 15 year tax life. The effective tax rate could be significantly different (either higher or lower) depending on post-spin activities”.
ADT’s Form 10 does not disclose the intangible tax asset amount that is expected to be created on its tax books (Section 197 of the tax code allows 15 year straight line amortization for goodwill and intangibles). Based on the disclosure, due to the mechanics of deferred tax accounting, there will not be a tax asset recorded on the GAAP books. Instead, there would be an off-balance sheet tax asset that reduces future cash taxes. Unfortunately, we have no way of precisely estimating the possible intangible asset created for tax purposes, but we believe it and a possible tax accounting policy change to immediate expense PP&E/customer acquisition costs could provide a substantial amount of annual tax deductions per year, materially reducing cash taxes. We expect to find out more information when the company files its first periodic SEC filing.

WolfeTrahan.com Page 28 of 38 Accounting & Tax Policy September 26, 2012
NNOOLL TTAAXX AASSSSEETTSS,, LLOOWW CCAASSHH TTAAXX RRAATTEESS,, AANNDD LLIIKKEELLYY FFUURRTTHHEERR TTAAXX OOPPTTIIMMIIZZAATTIIOONN ((CCOONNTT..))
Previously, ADT was part of the Switzerland based Tyco parent and, therefore, tax optimization activities to reduce U.S. income were not likely as high of a priority as being a standalone U.S. corporation. The company has disclosed information indicating that it expects to accelerate certain tax deductions that would minimize its cash tax rate for a period of time beyond the NOL utilization period. We believe that this relates to the immediate expensing of some subscriber acquisition (and other up front) costs that are currently capitalized for both GAAP and tax purposes. As a new standalone U.S. corporation, ADT may choose to change its tax depreciation/amortization policies to expense more costs up-front rather than capitalizing them on the balance sheet. Further, although difficult to quantify, our sense is that ADT’s dealer account acquisitions may create intangible tax amortization recognized over 15 years.

WolfeTrahan.com Page 29 of 38 Accounting & Tax Policy September 26, 2012
AACCQQUUIISSIITTIIOONN AACCTTIIVVIITTYY AANNDD TTRRAANNSSAACCTTIIOONN MMUULLTTIIPPLLEESS IINN SSEECCUURRIITTYY MMOONNIITTOORRIINNGG
Although much smaller, Vivint is the most comparable and recent acquisition to ADT. On Sept. 19, 2012, Blackstone agreed to acquire Vivint for over $2 billion, winning the bid over multiple other private equity companies. According to press reports, the announced acquisition of Vivint equated to an enterprise value to EBITDA multiple of over 10x. Vivint serves over 600,000 customers in the U.S. and Canada. The transaction is expected to close by the end of 2012. The exhibit below lists other similar transactions in the industry and the multiples paid for the acquisitions since 2001. Based on three most recent acquisitions in the security monitoring space, we find an average EV/EBITDA multiple of approximately 8.8x. Comparable Security Monitoring Transaction Multiples
Announce Date Multiples
Close Date Target Acquiror
EV /
Revenue
EV /
EBITDA
Price /
Earnings
NA Vivint, Inc. (announced on September 19, 2012) The Blackstone Group 2,000 NA >10.0x(3)
NA
6/4/10 Protection One, Inc. GTCR, LLC 811 2.2x 9.2x 25.5x
5/14/10 Brinks Home Security Inc.1
Tyco International Ltd. 1,830 3.2x 7.3x 31.1x
12/17/10 Monitronics International, Inc. Ascent Media Corporation 1,191 4.3x 6.2x NA
1/16/07 HSM Electronic Protection Services, Inc.2
Stanley Black & Decker, Inc. 545 2.7x 12.0x NA
11/8/01 Sensormatic Electronics, LLC Tyco International Ltd. 2,457 2.2x 14.5x 55.9x
10.0x
Mean 1,472 2.9x 9.9x 37.5x
Median 1,511 2.7x 9.6x 31.1x
Enterprise
Value ($ in
millions)
Note: All acquisition multiplies based on LTM information as of the respective acquisition date. 1. a.k.a. Broadview Security, Inc. 2. n.k.a. Stanley Convergent Security Solutions, Inc. 3. According to press reports.
Source: Wolfe Trahan Accounting & Tax Policy Research; Company filings; Bloomberg; Standard & Poor’s; FactSet.
Although not generally disclosed, to put the recurring monthly revenue valuation measure into context (not shown above due to limited data availability), Tyco paid approximately 46-47x recurring monthly revenue for Broadview Security in May 2010 and other transactions have occurred at RMR multiplies ranging from 40x to 60x.

WolfeTrahan.com Page 30 of 38 Accounting & Tax Policy September 26, 2012
Appendix: Detailed ADT Model

WolfeTrahan.com Page 31 of 38 Accounting & Tax Policy September 26, 2012
ADT REV
ENUE DETAIL
($ in
millions)
12/24/10
3/25/11
6/30/11
9/30/11
12/31/11
3/30/12
6/29/12
9/30/12
12/31/12
3/30/13
6/30/13
9/30/13
2009A
2010A
1Q11A
2Q11A
3Q11A
4Q11A
2011A
1Q12A
2Q12A
3Q12A
4Q12E
2012E
1Q13E
2Q13E
3Q13E
4Q13E
2013E
2014E
Recurring customer revenue
1,936
2,282
682
682
696
705
2,765
708
720
733
750
2,911
758
768
778
790
3,094
3,287
O
ther revenue
312
309
8386
8690
345
8787
8174
329
7372
7171
287
274
Net revenue
2,248
2,591
765
768
782
795
3,110
795
807
814
824
3,240
831
840
850
860
3,381
3,562
Y/Y Growth
‐‐15.3%
NA
NA
NA
NA
20.0%
3.9%
5.1%
4.0%
3.6%
4.2%
4.6%
4.0%
4.4%
4.4%
4.4%
5.3%
Q/Q
Growth
‐‐‐‐
‐‐0.4%
1.8%
1.7%
‐‐0.0%
1.6%
0.8%
1.2%
‐‐0.9%
1.0%
1.1%
1.3%
‐‐‐‐
Y/Y Growth %
Recurring customer revenue
NA
17.9%
NA
NA
NA
NA
21.2%
3.8%
5.6%
5.3%
6.3%
5.3%
7.1%
6.6%
6.2%
5.4%
6.3%
6.3%
O
ther revenue
NA
‐1.0%
NA
NA
NA
NA
11.7%
4.8%
1.2%
‐5.8%
‐17.2%
‐4.6%
‐15.9%
‐17.0%
‐11.9%
‐4.9%
‐12.7%
‐4.6%
Net revenue
NA
15.3%
NA
NA
NA
NA
20.0%
3.9%
5.1%
4.0%
3.6%
4.2%
4.6%
4.0%
4.4%
4.4%
4.4%
5.3%
Q/Q
Growth %
Recurring customer revenue
‐‐‐‐
NA
0.0%
2.1%
1.3%
‐‐0.4%
1.8%
1.7%
2.3%
‐‐1.1%
1.3%
1.4%
1.5%
‐‐‐‐
O
ther revenue
‐‐‐‐
NA
3.6%
0.0%
4.1%
‐‐‐2.8%
0.0%
‐6.9%
‐8.5%
‐‐‐1.3%
‐1.3%
‐1.2%
‐1.2%
‐‐‐‐
Net revenue
‐‐‐‐
NA
0.4%
1.8%
1.7%
‐‐0.0%
1.6%
0.8%
1.2%
‐‐0.9%
1.0%
1.1%
1.3%
‐‐‐‐
Revenue Drivers
Ending number of customers (000s)
4,753
6,285
6,271
6,321
6,360
6,351
6,351
6,394
6,432
6,447
6,455
6,455
6,471
6,494
6,524
6,561
6,561
6,755
Y/Y Growth
NA
NA
NA
NA
1.1%
2.0%
1.8%
1.4%
1.6%
1.6%
1.2%
1.0%
1.2%
1.6%
1.6%
2.9%
Gross customer additions (000s)
971
1,025
258
262
278
290
1,088
295
291
291
297
1,174
303
309
315
321
1,248
1,351
Customer attrition rate (%)
14.3
13.3
13.4
13.2
12.9
13.0
13.0
13.0
13.2
13.5
13.4
13.5
13.3
13.2
13.1
13.0
13.4
13.3
Net Customer additions (000s)
(14)
50
39
(9)
6643
38
15
8
104
16
23
30
37
106
193
ARPU ($)
35.92
36.10
36.50
36.71
37.01
37.24
37.24
37.51
37.98
38.36
38.71
38.71
39.05
39.41
39.76
40.12
40.12
41.58
Y/Y Growth
0.5%
3.2%
2.8%
3.5%
3.6%
3.9%
3.9%
4.1%
3.8%
3.6%
3.6%
3.6%
3.6%
Q/Q
Growth
‐‐NA
0.6%
0.8%
0.6%
‐‐0.7%
1.3%
1.0%
0.9%
‐‐0.9%
0.9%
0.9%
0.9%
‐‐‐‐
% of Revenue
Recurring customer revenue
86.1%
88.1%
89.2%
88.8%
89.0%
88.7%
88.9%
89.1%
89.2%
90.0%
91.0%
89.8%
91.2%
91.4%
91.6%
91.8%
91.5%
92.3%
O
ther revenue
13.9%
11.9%
10.8%
11.2%
11.0%
11.3%
11.1%
10.9%
10.8%
10.0%
9.0%
10.2%
8.8%
8.6%
8.4%
8.2%
8.5%
7.7%
in 000s
Beginning customers
6,285
6,271
6,321
6,360
6,285
6,351
6,394
6,432
6,447
6,351
6,455
6,471
6,494
6,524
6,455
6,561
Gross customer additions
971
1,025
258
262
278
290
1,088
295
291
291
297
1,174
303
309
315
321
1,248
1,351
Ending customers
6,271
6,321
6,360
6,351
6,351
6,394
6,432
6,447
6,455
6,455
6,471
6,494
6,524
6,561
6,561
6,755
Gross customers lost
272
212
239
299
1,022
252
253
276
288
1,069
287
286
285
284
1,142
1,157
Net customer gain/(loss)
(14)
50
39
(9)
66
43
38
15
8
104
16
23
30
37
106
193
Wolfe Trahan
Accounting & Tax Policy Research estim
ates; C
ompany estimates.

WolfeTrahan.com Page 32 of 38 Accounting & Tax Policy September 26, 2012
ADT INCOME STATEMEN
T
($ in
millions)
9/25/09
9/24/10
12/24/10
3/25/11
6/24/11
9/30/11
12/30/11
3/30/12
6/29/12
9/30/12
12/31/12
3/30/13
6/30/13
9/30/13
2009A
2010A
1Q11A
2Q11A
3Q11A
4Q11A
2011A
1Q12A
2Q12A
3Q12A
4Q12E
2012E
1Q13E
2Q13E
3Q13E
4Q13E
2013E
2014E
Revenue
2,248
2,591
765
768
782
795
3,110
795
807
814
824
3,240
831
840
850
860
3,381
3,562
Y/Y Growth
2.6%
15.3%
NA
NA
NA
NA
20.0%
3.9%
5.1%
4.0%
3.6%
4.2%
4.6%
4.0%
4.4%
4.4%
4.4%
5.3%
Q/Q
Growth
‐‐‐‐
NA
0.4%
1.8%
1.7%
‐‐0.0%
1.6%
0.8%
1.2%
‐‐0.9%
1.0%
1.1%
1.3%
‐‐‐‐
Cost of revenue
935
1,065
328
330
333
350
1,341
345
349
344
346
1,384
348
349
352
354
1,403
1,449
Gross profit
1,313
1,526
437
438
449
445
1,769
450
458
470
478
1,856
484
491
498
506
1,978
2,112
Gross m
argin %
58.4%
58.9%
57.1%
57.0%
57.4%
56.0%
56.9%
56.6%
56.8%
57.7%
58.0%
57.3%
58.2%
58.4%
58.6%
58.8%
58.5%
59.3%
SG&A
839
1,022
277
253
280
266
1,076
274
272
277
291
1,114
295
298
302
305
1,200
1,247
Dis‐synergies
4040
1010
1010
4010
1010
030
00
00
00
%
of revenue
39.1%
41.0%
37.5%
34.2%
37.1%
34.7%
35.9%
35.8%
34.9%
35.3%
35.3%
35.3%
35.5%
35.5%
35.5%
35.5%
35.5%
35.0%
O
ther operating expenses
00
00
00
00
00
00
00
00
00
Operating income
434
464
150
175
159
169
653
166
177
183
187
712
189
192
196
200
778
866
Operating m
argin %
19.3%
17.9%
19.6%
22.8%
20.3%
21.3%
21.0%
20.8%
21.9%
22.4%
22.7%
22.0%
22.7%
22.9%
23.1%
23.3%
23.0%
24.3%
Operating income (Form
10)
474
504
160
185
169
179
693
176
187
193
Restruct. and other special items
618
10
01
22
(1)
10
20
00
00
0
Broadview acq. and integration costs
035
86
67
265
52
012
00
00
00
Pro form
a operating income
440
517
159
181
165
177
681
173
181
186
187
726
189
192
196
200
778
866
Pro form
a operating m
argin %
19.6%
20.0%
20.8%
23.6%
21.1%
22.3%
21.9%
21.7%
22.4%
22.8%
22.7%
22.4%
22.7%
22.9%
23.1%
23.3%
23.0%
24.3%
Interest expense, net
81106
2224
2221
8922
2223
2390
2323
2323
9393
Earnings from cont. ops. before taxes
353
358
128
151
137
148
564
144
155
160
164
622
165
169
173
177
684
772
EBT (Form
10)
393
398
138
161
147
158
604
154
165
170
Pro form
a EBT
359
411
137
157
143
156
592
151
159
163
164
636
165
169
173
177
684
772
Taxes
135
143
4854
5060
213
5755
6257
232
5859
6162
240
270
Effective tax rate %
38.2%
39.9%
37.7%
36.0%
36.7%
40.5%
37.7%
39.7%
35.8%
38.9%
35.0%
37.3%
35.0%
35.0%
35.0%
35.0%
35.0%
35.0%
Taxes (Form
10)
150
159
52
58
54
64
228
61
59
66
Net income
203
199
7693
8384
336
8396
94106
390
108
110
112
115
445
502
Net income %
9.0%
7.7%
9.9%
12.1%
10.6%
10.6%
10.8%
10.4%
11.9%
11.5%
12.9%
12.0%
12.9%
13.1%
13.2%
13.4%
13.2%
14.1%
Net income (Form
10)
243
239
86103
9394
376
93106
104
Pro form
a net income
222
247
85100
9093
369
91102
99106
399
108
110
112
115
445
502
Pro form
a net income %
9.9%
9.5%
11.2%
13.1%
11.6%
11.7%
11.8%
11.4%
12.6%
12.2%
12.9%
12.3%
12.9%
13.1%
13.2%
13.4%
13.2%
14.1%
Basic shares outstanding
232
232
232
232
232
232
232
232
232
232
232
232
Basic pro form
a EPS
1.59
0.39
0.44
0.43
0.46
1.72
0.46
0.47
0.48
0.50
1.92
2.16
Y/Y Growth
NA
NA
NA
NA
NA
8.2%
18.4%
7.7%
13.2%
8.2%
11.6%
12.8%
Q/Q
Growth
‐‐NA
12.3%
‐2.7%
7.2%
‐‐1.1%
2.2%
2.3%
2.4%
‐‐‐‐
Diluted shares outstanding
235
235
235
235
235
235
235
235
235
235
235
235
Diluted pro form
a EPS
1.57
0.39
0.43
0.42
0.45
1.70
0.46
0.47
0.48
0.49
1.89
2.14
Y/Y Growth
NA
NA
NA
NA
NA
8.2%
18.4%
7.7%
13.2%
8.2%
11.6%
12.8%
Q/Q
Growth
‐‐NA
12.3%
‐2.7%
7.2%
‐‐1.1%
2.2%
2.3%
2.4%
‐‐‐‐
Wolfe Trahan
Accounting & Tax Policy Research estim
ates; C
ompany estimates.

WolfeTrahan.com Page 33 of 38 Accounting & Tax Policy September 26, 2012
ADT EBITDA CALCULATION
($ in
millions)
9/25/09
9/24/10
12/24/10
3/25/11
6/24/11
9/30/11
12/30/11
3/30/12
6/29/12
9/30/12
12/31/12
3/30/13
6/30/13
9/30/13
2009A
2010A
1Q11A
2Q11A
3Q11A
4Q11A
2011A
1Q12A
2Q12A
3Q12A
4Q12E
2012E
1Q13E
2Q13E
3Q13E
4Q13E
2013E
2014E
EBITDA calculation
N
et income
203
199
7693
8384
336
8396
94106
390
108
110
112
115
445
502
Interest expense, net
81106
2224
2221
8922
2223
2390
2323
2323
9393
Income tax expense
135
143
4854
5060
213
5755
6257
232
5859
6162
240
270
Depr. & Amort.
671
785
229
232
233
233
927
239
243
246
254
982
252
255
259
263
1,029
1,091
Amortization of deferred revenue
(111)
(111)
(28)
(29)
(28)
(29)
(114)
(29)
(30)
(30)
(30)
(119)
(30)
(30)
(30)
(30)
(120)
(120)
EBITDA
979
1,122
347
374
360
369
1,451
372
386
395
411
1,575
410
418
425
433
1,686
1,837
EBITDA m
argin
43.5%
43.3%
45.4%
48.7%
46.1%
46.4%
46.7%
46.7%
47.8%
48.5%
49.9%
48.6%
49.4%
49.7%
50.0%
50.3%
49.9%
51.6%
Y/Y Growth
1.2%
14.6%
NA
NA
NA
NA
29.3%
7.0%
3.2%
9.5%
11.3%
8.5%
10.4%
8.1%
7.7%
5.4%
7.1%
8.9%
Q/Q
Growth
‐‐‐‐
NA
7.8%
‐3.8%
2.4%
‐‐0.7%
3.9%
2.2%
4.1%
‐‐‐0.1%
1.8%
1.8%
1.8%
‐‐‐‐
Restruct. and other special items
618
10
01
22
(1)
10
20
00
00
0
Broadview acq. and integration costs
035
86
67
265
52
012
00
00
00
Dis‐synergies
(40)
(40)
(10)
(10)
(10)
(10)
(40)
(10)
(10)
(10)
0(30)
00
00
00
Pro form
a EBITDA
1,013
1,109
348
378
364
371
1,463
375
392
402
411
1,579
410
418
425
433
1,686
1,837
Pro form
a EBITDA m
argin %
45.1%
42.8%
45.5%
49.3%
46.6%
46.7%
47.0%
47.1%
48.6%
49.4%
49.9%
48.7%
49.4%
49.7%
50.0%
50.3%
49.9%
51.6%
Wolfe Trahan
Accounting & Tax Policy Research estim
ates; C
ompany estimates.

WolfeTrahan.com Page 34 of 38 Accounting & Tax Policy September 26, 2012
ADT BALANCE SH
EET
($ in
millions)
12/30/11
3/30/12
6/29/12
9/30/12
12/31/12
3/30/13
6/30/13
9/30/13
2010A
2011A
1Q12A
2Q12A
3Q12A
3Q12 PF
4Q12E
2012E
1Q13E
2Q13E
3Q13E
4Q13E
2013E
2014E
Cash and equivalents
8465
6192
3207
300
300
369
437
509
587
587
926
Accounts receivable, net
9794
9785
8080
8282
8384
8586
8682
Inventories, net
2333
4549
5741
5454
5050
5152
5255
Prepaids and other current assets
5648
4645
4438
3737
3738
3839
3941
Deferred income taxes
4823
2323
2323
2323
2323
2323
2323
Current assets
308
263
272
294
207
389
496
496
563
632
706
786
786
1,126
PP&E, net
168
172
174
158
178
211
213
213
215
217
219
221
221
231
Subscriber system assets, net
1,648
1,653
1,660
1,676
1,703
1,703
1,728
1,728
1,752
1,777
1,803
1,830
1,830
1,950
Goodwill
3,393
3,395
3,396
3,400
3,396
3,396
3,396
3,396
3,396
3,396
3,396
3,396
3,396
3,396
Intangibles, net
2,695
2,755
2,789
2,818
2,846
2,846
2,875
2,875
2,914
2,952
2,987
3,021
3,021
3,162
Deferred subscriber acquisition costs, net
388
417
405
437
454
454
458
458
468
480
492
505
505
572
Deferred tax asset NOL
‐‐‐‐
‐‐‐‐
‐‐359
359
359
301
241
181
119
119
0
O
ther non‐current assets
9284
8282
93233
233
233
233
233
233
233
233
233
Total assets
8,692
8,739
8,778
8,865
8,877
9,590
9,756
9,756
9,841
9,927
10,017
10,111
10,111
10,669
ST debt, including current portion of LT debt
190
114
11
11
11
11
11
1
Accounts payable
122
153
151
151
177
161
161
161
166
172
178
185
185
214
Accrued and other current liabilities
190
163
144
148
165
158
158
158
162
164
166
168
168
182
Deferred revenue
224
250
249
257
254
254
247
247
249
252
255
258
258
273
Current liabilities
726
567
558
557
597
574
567
567
579
589
600
612
612
670
LT debt
1,326
1,506
1,510
1,501
1,537
2,525
2,525
2,525
2,525
2,525
2,525
2,525
2,525
2,525
Deferred subscriber acquisition revenue
630
630
633
640
650
650
658
658
664
671
679
687
687
727
Deferred tax liabilities
693
632
632
632
632
632
689
689
678
666
654
641
641
739
O
ther non‐current liabilities
151
173
167
173
171
170
172
172
172
172
172
172
172
172
Total liabilities
3,526
3,508
3,500
3,503
3,587
4,551
4,611
4,611
4,617
4,623
4,629
4,637
4,637
4,832
Preferred stock
00
00
00
00
00
00
00
Common stock
00
00
02
22
22
22
22
Stock warrants
00
00
00
00
00
00
00
APIC
00
00
04,970
5,076
5,076
5,076
5,076
5,076
5,076
5,076
5,076
Parent company investment
5,087
5,152
5,196
5,274
5,223
00
00
00
00
0
Retained earnings
00
00
00
00
79159
243
329
329
692
AOCI
7979
8288
6767
6767
6767
6767
6767
Treasury stock
00
00
00
00
00
00
00
Equity
5,166
5,231
5,278
5,362
5,290
5,039
5,145
5,145
5,224
5,305
5,388
5,474
5,474
5,837
Total liabilities and equity
8,692
8,739
8,778
8,865
8,877
9,590
9,756
9,756
9,841
9,927
10,017
10,111
10,111
10,669
Wolfe Trahan
Accounting & Tax Policy Research estim
ates; C
ompany estimates.

WolfeTrahan.com Page 35 of 38 Accounting & Tax Policy September 26, 2012
ADT STATEMEN
T OF CASH
FLO
WS
($ in
millions)
12/24/10
3/25/11
6/30/11
9/30/11
12/30/11
3/30/12
6/29/12
9‐m
o ending
9/30/12
12/31/12
3/30/13
6/30/13
9/30/13
2009A
2010A
1Q11A
2Q11A
3Q11A
4Q11A
2011A
1Q12A
2Q12A
3Q12A
3Q12 PF
4Q12E
2012E
1Q13E
2Q13E
3Q13E
4Q13E
2013E
2014E
Net income (loss)
243
239
86103
9394
376
93106
104
292
106
399
108
110
112
115
445
502
Depreciation and amortization
671
785
229
232
233
233
927
239
243
246
728
254
982
252
255
259
263
1,029
1,091
Amort. of deferred sub. acq. rev.
(111)
(111)
(28)
(29)
(28)
(29)
(114)
(29)
(30)
(30)
(89)
(30)
(119)
(30)
(30)
(30)
(30)
(120)
(120)
Deferred sub. acq. revenue
103
111
2928
2632
115
3235
42109
38147
3637
3838
149
160
N
on‐cash compensation
78
23
22
92
22
60
60
00
00
0
Deferred income taxes
5(61)
5258
54(217)
(53)
6159
66186
57243
4647
4850
192
216
Provision for losses on A/R and inv.
3944
1412
911
4614
1113
3812
5012
1212
1248
48
O
ther non‐cash items
04
00
03
30
00
0(4)
(4)
22
23
913
Changes in working capital
Accounts receivable
(25)
(38)
(24)
1(10)
(12)
(45)
(15)
1(5)
(19)
(14)
(33)
(13)
(13)
(13)
(13)
(52)
(44)
Inventories
3(3)
(9)
(2)
(1)
2(10)
(13)
(4)
(9)
(26)
(13)
(39)
4(1)
(1)
(1)
2(3)
Accounts payable
1710
84
24(1)
35(2)
025
23(0)
236
66
724
29
Accrued and other liabilities
(12)
6(18)
2(4)
(27)
(47)
(22)
4(2)
(20)
0(20)
42
22
1014
Income taxes, net
125
185
(5)
5(9)
275
266
(3)
(2)
(2)
(7)
0(7)
00
00
00
Deferred subscriber acq. costs
(95)
(110)
(33)
(33)
(31)
(34)
(131)
(15)
(59)
(45)
(119)
(38)
(157)
(40)
(42)
(43)
(45)
(169)
(204)
Other
111
5(16)
865
62(5)
623
240
240
00
00
0
Cash from operations
981
1,070
308
368
366
397
1,439
337
372
428
1,126
368
1,494
386
386
393
401
1,566
1,702
Dealer gen. cust. accts. and bulk acct. purch.
(511)
(532)
(129)
(140)
(156)
(156)
(581)
(164)
(159)
(171)
(494)
(165)
(659)
(176)
(176)
(176)
(176)
(706)
(727)
Subscriber system assets
(189)
(247)
(68)
(70)
(73)
(79)
(290)
(81)
(91)
(96)
(268)
(98)
(366)
(99)
(101)
(103)
(105)
(407)
(443)
Capital expenditures
(36)
(22)
(1)
(9)
(10)
(11)
(31)
(5)
(7)
(32)
(44)
(12)
(56)
(12)
(13)
(13)
(13)
(51)
(53)
Acq. of businesses, net of cash acq.
0(449)
00
00
00
00
00
00
00
00
0
O
ther
(4)
00
0(7)
0(7)
00
(9)
(9)
0(9)
00
00
00
Cash from investing
(740)
(1,250)
(198)
(219)
(246)
(246)
(909)
(250)
(257)
(308)
(815)
(275)
(1,090)
(288)
(290)
(292)
(294)
(1,164)
(1,224)
Repayments of current maturities of LT debt
(1)
(1)
(9)
29(21)
0(1)
00
(1)
(1)
0(1)
00
00
00
Dividend payments
00
00
00
00
00
00
0(29)
(29)
(29)
(29)
(116)
(139)
Allocated debt activity
181
371
(9)
2937
(62)
(5)
17(19)
3735
035
00
00
00
Change
due to Tyco and affiliates
(23)
03
132
(4)
321
1(2)
00
00
00
00
0
Change
in parent co. investment
(416)
(140)
(148)
(140)
(204)
(82)
(574)
(109)
(68)
(243)
(420)
0(420)
00
00
00
Spin‐off adjustments
00
00
00
00
00
214
0214
00
00
00
O
ther
00
00
00
00
00
00
00
00
00
0
Cash from financing
(259)
230
(163)
(81)
(156)
(148)
(548)
(91)
(86)
(209)
(172)
0(172)
(29)
(29)
(29)
(29)
(116)
(139)
F/X
(1)
21
11
(4)
(1)
02
13
03
00
00
00
Cash and equiv. at beg. of period
5132
8432
101
6684
6561
9165
207
65300
369
437
509
300
587
Cash and equivalents at end of period
3284
32101
6665
6561
913
207
300
300
369
437
509
587
587
926
Unlevered Free Cash Flow
298
338
124
165
141
165
595
101
129
144
364
108
472
113
112
117
122
463
539
Unlevered Free Cash Flow M
argin
13.2%
13.0%
16.2%
21.4%
18.1%
20.7%
19.1%
12.7%
16.0%
17.6%
15.1%
13.1%
14.6%
13.6%
13.3%
13.7%
14.1%
13.7%
15.1%
Unlevered Free Cash Flow, after dividend
298
338
124
165
141
165
595
101
129
144
364
108
472
8483
8893
347
400
Wolfe Trahan
Accounting & Tax Policy Research estim
ates; C
ompany estimates.

WolfeTrahan.com Page 36 of 38 Accounting & Tax Policy September 26, 2012
AACCCCOOUUNNTTIINNGG && TTAAXX PPOOLLIICCYY RREESSEEAARRCCHH LLIIBBRRAARRYY
Report Title Topic Date
1 European Financial Crisis: Mark to Market Maneuvers Financial Institutions 9/23/2011
2 CIT Deep Dive Corporate Actions / Fin. Institutions [CIT] 9/28/2011
3 Spin‐offs, Post Bankruptcy Equity & Value Opportunities Corporate Actions 10/7/2011
4 Pension Funding Deteriorates $250 Billion Pensions 10/12/2011
5 Synovus Financial: DTA Valued at $500 Million Financial Institutions [SNV] 10/24/2011
6 Companies Initiating Dividends Outperform Corporate Actions 10/31/2011
7 Shareholder Value Creation Stock Ideas: TREE Analysis Capital Allocation 11/8/2011
8 Yahoo! Possible Avenues to Unlock Tax Value Corporate Actions [YHOO] 11/15/2011
9 Banks: Earnings Quality Analysis Earnings Quality / Fin. Institutions 11/21/2011
10 Large Share Repurchases and Deep Value Capital Allocation 11/30/2011
11 Earnings Quality: Ideas and a Guide to Avoid Accounting Pitfalls Earnings Quality 12/6/2011
12 A Dive Into Banks' Off‐Balance Sheet Vehicles Financial Institutions 12/16/2011
13 Audio Update: Pension Underfunding with Chris Senyek Pensions 12/20/2011
14 2012 Pension Outlook Pensions 1/3/2012
15 Verizon Cash Flow Deep Dive: Taxes & Wireless Support Dividend Telecom [VZ] 1/5/2012
16 2012 Stock Picking Ideas: Capital Creation and Earnings Quality Capital Allocation / Earnings Quality 1/9/2012
17 Audio Update: Key Themes in Financials with Chris Senyek Financial Institutions 1/12/2012
18 Spin‐offs, Post Bankruptcy Equity & Value Opportunities Corporate Actions 1/13/2012
19 Dividend Increases Signal Stock Price Outperformance Corporate Actions 1/30/2012
20 Weekly Spin‐off Update (Including Post Holdings Analysis) Corporate Actions [POST] 2/3/2012
21 Key Themes: Chart Book Chart Book 2/4/2012
22 Reincorporating: Will Others Follow Aon's Move? Corporate Actions / Taxes [AON] 2/15/2012
23 Audio Update: Corporate Tax Reform Unveiled with Chris Senyek Taxes 2/23/2012
24 10‐K Navigation Guide Primers 2/28/2012
25 Key Themes: Chart Book Chart Book 3/3/2012
26 Banks: Earnings Quality Analysis Earnings Quality / Fin. Institutions 3/5/2012
27 Apple's Dividend Initiation and Buyback Corporate Actions [AAPL] 3/19/2012
28 Pensions: Restructuring & Mark to Market Adoption Pensions 3/21/2012
29 Audio Update: Pension Restructurings and MTM with Chris Senyek Pensions 3/22/2012
30 New Contrarian Ideas Based on TREE & Earnings Quality Capital Allocation / Earnings Quality 3/23/2012
31 Earnings Quality: Identifying Underperformers Earnings Quality 3/30/2012
32 Key Themes: Chart Book Chart Book 3/31/2012
33 Financial Institutions' Accounting Themes Financial Institutions 4/9/2012
34 CIT Deep Dive: Lowering Economic Book Value by $5 Corporate Actions / Fin. Institutions [CIT] 4/18/2012
35 Tax Changes in 2013 Likely to Compel Special Dividends in 2012 Corporate Actions / Taxes 4/23/2012
36 Hidden Value in Net Operating Losses (NOLs) Corporate Actions / Taxes 5/2/2012
37 Key Themes: Chart Book Chart Book 5/5/2012
38 Pro Forma Earnings Earnings Quality 5/9/2012
39 Pensions: State of the Union Pensions 5/11/2012
40 Banks: 'Q1 Earnings/Asset Quality Analysis Earnings Quality / Fin. Institutions 5/16/2012
41 Returning Cash to Shareholders: Who's Next? Capital Allocation 5/21/2012
42 Spin‐offs, Post Bankruptcy Equity & Value Opportunities Corporate Actions [ADT, LMCA, VC] 5/31/2012
43 Key Themes: Chart Book Chart Book 6/3/2012
44 Capital Allocation: Buyback and Dividend Analysis Capital Allocation 6/7/2012
45 Earnings Quality: Identifying Underperformers Earnings Quality 6/22/2012
46 Winners From Pension Funding Relief Pensions 6/26/2012
47 Audio Update: Pension Relief with Chris Senyek Pensions 6/29/2012
48 Key Themes: Chart Book Chart Book 6/30/2012
49 Pension Funding Relief Signed Into Law Pensions 7/9/2012
50 Financial Institutions' Accounting Themes Financial Institutions 7/10/2012

WolfeTrahan.com Page 37 of 38 Accounting & Tax Policy September 26, 2012
AACCCCOOUUNNTTIINNGG && TTAAXX PPOOLLIICCYY RREESSEEAARRCCHH LLIIBBRRAARRYY ((CCOONNTTIINNUUEEDD))
Report Title Topic Date
51 Senyek's Stock Idea Spreadsheet Capital Allocation / Database 7/17/2012
52 Repatriation Transactions and Bills to Extend Bush‐Era Tax Cuts Taxes 7/25/2012
53 Key Themes: Chart Book Chart Book 7/28/2012
54 Banks: 'Q2 Earnings/Asset Quality Analysis Earnings Quality / Fin. Institutions 8/14/2012
55 Earnings Quality: Identifying Underperformers Earnings Quality 8/23/2012
56 Key Themes: Chart Book Chart Book 9/1/2012
57 Capital Allocation: Buyback and Dividend Analysis Capital Allocation 9/5/2012
58 Financial Institutions' Accounting Themes Financial Institutions 9/7/2012
59 Audio Update: Avoiding Underperforming Stocks with Chris Senyek Earnings Quality 9/7/2012
60 European Stock Ideas: Shareholder Value Creation TREE Analysis Capital Allocation 9/20/2012
* Every Friday, we send out “Senyek’s Weekly Spin‐off Update”, a brief look at new announcements, updates, and activities in
spin‐off and post‐bankruptcy equities. Monthly, we send out "Senyek's Stock Ideas Spreadsheet " based on three important
areas of our investment analysis and research: capital creation/allocation, earnings quality, and valuation. It may also be used as
a simple screening tool for other factors. We maintain a separate distribution list for these reports. If you would like to be
added, please contact [email protected] or your Wolfe Trahan salesperson.

WolfeTrahan.com Page 38 of 38 Accounting & Tax Policy September 26, 2012
DDIISSCCLLOOSSUURREE SSEECCTTIIOONN
Analyst Certification: The analyst of Wolfe Trahan & Co. primarily responsible for this research report whose name appears first on the front page of this research report hereby certifies that (i) the recommendations and opinions expressed in this research report accurately reflect the research analysts’ personal views about the subject securities or issuers and (ii) no part of the research analysts’ compensation was, is or will be directly or indirectly related to the specific recommendations or views contained in this report. Important Disclosures: Wolfe Trahan & Co. Research Disclosures: None Other Disclosures: Wolfe Trahan & Co. does not assign ratings of Buy, Hold or Sell to the stocks it covers. Outperform, Peer Perform and Underperform are not the respective equivalents of Buy, Hold and Sell but represent relative weightings as defined above. To satisfy regulatory requirements, Outperform has been designated to correspond with Buy, Peer Perform has been designated to correspond with Hold and Underperform has been designated to correspond with Sell. The content of this report is to be used solely for informational purposes and should not be regarded as an offer, or a solicitation of an offer, to buy or sell a security, financial instrument or service discussed herein. Opinions in this communication constitute the current judgment of the author as of the date and time of this report and are subject to change without notice. Information herein is believed to be reliable but Wolfe Trahan & Co. and its affiliates, including but not limited to Wolfe Trahan Securities, makes no representation that it is complete or accurate. The information provided in this communication is not designed to replace a recipient's own decision-making processes for assessing a proposed transaction or investment involving a financial instrument discussed herein. Recipients are encouraged to seek financial advice from their financial advisor regarding the appropriateness of investing in a security or financial instrument referred to in this report and should understand that statements regarding the future performance of the financial instruments or the securities referenced herein may not be realized. Past performance is not indicative of future results. This report is not intended for distribution to, or use by, any person or entity in any location where such distribution or use would be contrary to applicable law, or which would subject Wolfe Trahan & Co. or any affiliate to any registration requirement within such location. For additional important disclosures, please see www.WolfeTrahan.com/Disclosures. The views expressed in Wolfe Trahan & Co. research reports with regards to sectors and/or specific companies may from time to time be inconsistent with the views implied by inclusion of those sectors and companies in other Wolfe Trahan & Co. analysts’ research reports and modeling screens. Copyright © Wolfe Trahan & Co. 2012. All rights reserved. All material presented in this document, unless specifically indicated otherwise, is under copyright to Wolfe Trahan & Co. None of the material, nor its content, nor any copy of it, may be altered in any way, or transmitted to or distributed to any other party, without the prior express written permission of Wolfe Trahan & Co. This report is limited for the sole use of clients of Wolfe Trahan & Co. Authorized users have received an encryption decoder which legislates and monitors the access to Wolfe Trahan & Co. content. Any distribution of the content produced by Wolfe Trahan & Co. will violate the understanding of the terms of our relationship.